1. Introduction
There are five basic transport processes: roadway transport, seaway transport, air transport, railway transport, and pipeline transport. The choice of transport modes, planning, and route recommendations are based on accurate mode choice prediction models [
1]. The route and environmental impacts also effectively select transport modes [
2]. After choosing the appropriate transport route, transport modes are determined according to time, carbon emissions, and cost. Today, the transport sector is an essential source of carbon emissions that directly affect global warming. Globally, transport contributes about 25% of energy-related carbon emissions. This is mainly due to the fossil fuels used in transport [
3].
One of the most critical parameters affecting transport modes is trade routes. China’s ever-increasing production capacity has increased trade volume between east and west, which naturally prompts the need for sustainable, fast, and secure trade routes. In this direction, improvements have been made to existing routes, and new alternative routes have been constructed. The China–Central Asia–West Asia Economic Corridor (CCAWAEC) is one of the most significant land transit routes between China and Europe, starting from China, passing through Central Asian countries, and reaching Turkey. The vast geography, rich in underground and aboveground resources and covering 40% of China, is one of the world’s populations that contributes significantly to international trade and the economy [
4].
Empirical studies by experts such as H. Yeung and J. Huber, including Turkey and Central Asian countries, show that China’s Belt and Road Initiative (BRI) BRI developments enhance the economic potential of the nation’s bordering trade routes [
5]. Between 2013 and 2023, China’s total investment in member countries under the BRI was USD 389.7 billion, and when construction projects are included, this figure reaches USD 970.7 billion [
6]. Turkey conducts about half of its trade with European countries and is keen to increase its east–west trade potential along the Middle Corridor under the BRI. Turkey’s membership in NATO, its Customs Agreement with the EU, its historical, ethnic, and cultural ties with countries in the Caucasus and Central Asia, and its religious and historical common history with countries in the Middle East and Africa have all played an essential role in making Turkey a reliable route for global trade and BRI [
7]. Regional tensions due to the Ukraine–Russia war and the embargoes imposed on Russia interrupted trade flows due to accidents on the Suez Canal, and the never-ending conflicts between Israel and Palestine have also increased the importance of the Middle Corridor. Moreover, Turkey’s many ports at the point of exit to the high seas allow for new alternative maritime routes through the middle corridor. As is seen in
Figure 1, except for Russia, the Black Sea littoral countries have 50 ports. Except for Constanta port in Romania, there are multiple ports in other countries that could reach similar potential [
8].
Located within the borders of Zonguldak province, Filyos Port is the third-largest port in Turkey and the fourth-largest port in the Black Sea, with an annual handling capacity of 25 million tonnes [
9]. Filyos Port also can handle 13 ships of various sizes simultaneously [
10]. In addition to contributing to both national and international trade, Filyos Port is expected to play a significant role in the transport of cargo to be transited through the north–south corridor, including the Silk Road Economic Belt (SREB), by creating the advantage of intermodal transport, as well as reducing the pressure on the Istanbul Straits caused by increasing ship traffic [
11]. Moreover, the commercial connection of Filyos Port to Ankara via railway, which is actively used between Shanghai and London as a part of SREB and to the ports on the Danube waterway via Constanta port, will offer advantages in terms of emissions, time, and cost. In this respect, Filyos Port and Constanza Port are two ports with high potential, including various transportation routes, such as railway, highway, and airway, at the departure from Asia to the Black Sea and from Europe to the Black Sea, respectively.
Accordingly, new projects such as the Filyos Port are needed to increase regional trade with the Black Sea and to strengthen the trade potential on the middle corridor. The Danube River Basin, which has a total area of 817,000 km
2 and is the second-largest river basin in Europe, is characterized as the most international river basin in the world as it includes the territories of 19 countries. According to the data of the Danube Commission, there are more than 90 ports, large and small, belonging to 10 countries on the Danube and its tributaries. These ports are connected to their hinterland by road or railway. Although the impact areas of these ports and their rail and highway connections have been improved to a considerable extent, works in this direction are still in progress [
12,
13]. Some cargo transported on the Danube can reach the open seas via the Black Sea and the Straits. Regarding the east–west trade route, the Danube is not a significant route used directly. On the other hand, it is foreseen that the Danube waterway will be utilized more intensively in the coming period, and trade capacity with the countries in the Danube basin will increase. In transport on the Danube River, gauge cargo can quickly come to Turkey without using highways or encountering international legal obstacles. They can be transported to the Middle East, Caucasus, and Central Asian countries as transit cargo. In this context, the integration of the Danube waterway into the Filyos Port in Turkey, which has favorable location characteristics, will both support the reduction of freight traffic on the straits and increase the functionality of the Filyos Port, and it is expected to contribute to the integration and development of this route into the increasing international trade in the east–west direction.
The transportation of products in a single-loading unit is known as intermodal transport. Combined supply chain and transportation optimization may persuade shippers to adopt multimodal waterway transportation [
14]. Efficient waterway infrastructure, high-performance ports as regional economic centers, environmentally friendly and modern inland waterway vessels, the optimal integration of inland waterway transport into multimodal logistics chains, qualified personnel, and the use of digital services are the essential prerequisites for a competitive inland waterway transport of the future [
15].
Studies on inland waterways transport in general and Danube waterway transport in particular are standard. However, this study, which compares the use of several forms of transportation from one port to another in terms of carbon emissions, time, and cost, will contribute to the literature as a new piece of research in terms of both subject and content. All parties desire a reduction of emissions, cost, and time in transport. The parameters determined are essential in selecting a more sustainable transport mode or modes where cost and environmental assessments are made in this study. The main issues addressed in this study concern the evaluation of the appropriate route and the commercial products transported on the route in terms of time, cost, and emissions. Thus, this study will make significant contributions to the literature in selecting the most sustainable transport modes. In particular, the main research topic of this study is how access to ports on the Danube waterway, which stands out as an alternative transport corridor from Filyos Port, is shaped through different modes of transport and whether this can be advantageous. One of the main contributions of this study is the presentation of a new environmentally friendly alternative route for east–west trade that connects the northern and middle corridor through the Black Sea. Focusing on the transport of goods through different transport modes and route parameters, such as the emissions caused by the fuel consumed, the cost caused by the fuel consumed, and the transport time, this study addresses both environmental and economic dimensions and includes multiple perspectives.
2. Materials and Methods
In this study, where economic and environmental assessments are conducted, the parameters established are crucial in choosing a more sustainable mode (or modes) of transportation. This study’s primary concerns are determining the best route and assessing the time, cost, and emissions of the commercial goods delivered along it. Shifting freight to various forms of transportation is a governmental goal for most countries. This transition can achieve high-level policy objectives such as sustainability of the environment, improved connectivity, and higher safety. Countries worldwide have implemented mode shift policies to achieve a range of objectives, including environmental and economic goals.
Figure 2 shows the transportation scenarios with different modes of transportation.
Filyos Port, which was included in the investment plan in 2014, started construction in 2016 and was completed in 2021. It is currently one of the three largest ports in Turkey and the largest port established on the Black Sea coast, with an annual capacity of 25 million tonnes. Filyos Port is expected to have many benefits in the long term, such as relieving the traffic load of the straits and the ports on the Marmara Sea coast, especially Derince, reducing road traffic, especially between Kardemir and Kocaeli ports, reducing the transportation costs of industrial enterprises in its hinterland, especially Kardemir, and creating an essential connection between the Middle East and Asia and Europe. Some of the cargoes transported on the Danube can be transported to the port of Rotterdam and the North Sea via the Danube–Main–Ren waterway, and some of them can reach the open seas via the Black Sea and the Straits. In the transport carried out on the Danube River, the gauge cargoes can easily reach Turkey without using highways or encountering any international legal obstacles. They can be transported to the Middle East, Caucasus, and Central Asian countries as transit cargo. In this respect, the Danube–Main–Ren waterway is an important route that directly concerns Turkey. It is foreseen that the trade capacity with the countries in the Danube basin will increase in the coming years. In this context, integrating the Danube waterway into Filyos Port, which has favorable location features, will support the reduction of freight traffic on the Straits and contribute to the integration and development of Filyos Port to the increasing international trade in the east–west direction. Approximately 60 million tonnes of cargo are transported annually on inland waterways in the Danube region [
16]. Most cargo handled in Danube river ports is dry bulk cargoes (especially iron ore, fertilizers, sand, and agricultural bulk cargoes) and liquid cargoes (chemicals). Small amounts of Ro-Ro, general cargo, and container transport are also carried out [
12]. Recently, cruise ships have also become widespread on the river line.
Roadway transportation services are provided globally using a variety of vehicles, from train fleets to small delivery vehicles. The vehicle’s payload capacity can be either fixed or converted to a swap body that can be used for an alternate mode of transportation, usually a railway or roadway. The benefits of road transportation are the flexibility, reachability, and security of goods due to the constant presence of an operator. The route taken is crucial when deciding which forms of transportation to employ and weighing their costs, times, and environmental effects. The route should be determined to determine these factors.
2.1. Sea Transportation
The fact that a large part of the world’s transport is carried out by ships (sea freight) brings about lower costs and environmentally friendly ships. In this context, the type and properties of the fuel used in ships are among the parameters that directly affect the cost and environmental pollution in maritime transport [
17,
18]. To reduce emissions and use more efficient ships in transportation, the International Maritime Organisation (IMO) introduced rules limiting the fuel and emission values that must be used worldwide [
19]. Two types of vessels are used in this study. The first type is used in high seas conditions and the second for container transport along the Danube River. Emission calculations are based on the engine power, fuel consumption, and CO
2 emission factors of the fossil fuels used. The emission factor expresses the amount of emission released into the atmosphere per unit of fuel. In the most basic terms, approximately 3.2 tonnes of CO
2 emission is released using 1 tonne of diesel fuel, and the emission factor is 3.2 for diesel fuel. In addition, the emissions are from the main engine and the diesel generators used in electricity generation. ME and AE, which are given as sub-indices in the given equations, refer to the main engine and auxiliary engines. The given notations are widely used on ships. This is seen in IMO EEXI calculations. The container ship emission estimation used in transport is conducted using Equation (1) and depends on specific fuel consumption (
SFC), the main engine
), the auxiliary engine
), and the carbon factor
[
20].
In the given expression,
is the primary main engine of fuel consumption,
is the fuel consumption of the generators used in electricity generation on board, and
is the carbon emission factor depending on the type of fuel used. In the calculations of fuel consumption and greenhouse gas emissions caused by ships, fuel consumption for the main engine and auxiliary engine are accepted as 190 g/kWh and 215 g/kwh, respectively [
21]. The ships used in this study and their specifications are given in
Table 1.
The carbon emission factor differs according to the fuel types used in ships. The carbon emission factor denotes the emissions emitted to the atmosphere in response to the unit fuel consumption of transport vehicles.
Table 2 shows different fuel types’ carbon emission factors and density values [
22].
2.2. Road Transportation
The COPERT model estimates both emissions and energy consumption of energy from vehicles such as trucks used in road transport [
23]. The principal purpose of the model is to allow national authorities to assist national experts in compiling emission inventories, but the scope of the model is wider than this. The model is divided into three sections, namely, input, emission factor, and results, which provide the calculated emissions [
24]. COPERT can be analyzed as a policy evaluation device for environmental studies. The model can also serve as a baseline for scientists to find information on the emission and energy consumption levels of all types of new vehicles on European roads and older vehicle technologies that may still be available [
25]. A flow chart is used in the calculation of emissions from trucks, as given in
Figure 3 [
26].
In the scope of this study, the basic parameters used to estimate the emissions are the road taken, as the basis of the system input along the route given above, the fuel consumption data for the truck used for cargo transport, the fuel used, and the emission factor. The carbon emission to be calculated within the scope of this study can be calculated according to Equation (2) depending on the type of fuel used and fuel consumption [
27].
In the given expression, SFC represents truck fuel consumption, and represents the carbon emission factor. Fuel consumption data for road transport vary depending on the type of road used, and transport between two destinations is also carried out according to different combinations.
The differences in road transport conditions present difficulties in calculating fuel consumption and costs. Therefore,
Figure 4 is used to calculate the fuel consumption for a heavy-duty truck considering EU and US transport conditions [
28].
A literature review shows that fuel consumption varies with road conditions and engine and equipment characteristics. According to a study conducted in 2015 by the German Environment Agency, a new EURO VI truck in Europe currently consumes an average of 34.5 L/100 km [
29]. In addition, experimental tests have shown that the average fuel consumption is approximately 30–38 L/100 km. However, with the regulations introduced, fuel consumption is projected to decrease by 0.5% by 2030 [
30,
31].
Table 3 shows the operating conditions of heavy-duty trucks used in road container transportation.
2.3. Rail Transportation
The fundamental indicator for energy and emission estimation in railway transportation is the total train energy consumption, which is based on the gross tonne of the train and the relationship of the net tonne to the gross tonne weight. The gross tonne weight of the train used for transport and the different load types are considered using different general train types defined by average bulk and volume. The model therefore allows for the use of specific train types for specific transport tasks. The energy usage of trains can be expressed in terms of the number of kilometers traveled. This graph shows the energy consumption per tonnes km based on a specific scenario. It is essential to have a precise overview of the issue. The energy consumption equation for train transport is shown in
Table 4.
For every type of train, the specific energy consumption (SEC) per net tonnes km is computed using Equation (3).
In the given expression,
SEC specific energy consumption is [Wh/Gtkm], TEC is the net energy consumption of train [Wh/Ntkm], and f is the correlation of the Nt/Gt of transportation expenses (with a factor for empty trips included). The expression of f is expressed in
Table 5.
This value is utilized for the conversion process since the average energy consumption of locomotive engines is around 210 g/kWh [
33]. In rail transport, the quantity of 20-foot containers on the route and the quantity of wagons a train must carry play an essential role in determining energy and fuel consumption. Standardizing load planning and train assembly procedures among railway systems may be necessary to eliminate the need to readjust locomotive loads at the borders. Various factors determine the final number of wagons that can operate on a single train. These considerations include the TEU capacity of the wagons utilized, the length of the line’s available passing loops, the length of the terminal sidings, and the locomotives’ carrying capacity [
34]. The number of wagons and train length are determined by the Equation (4).
In the given expression,
is the train length,
is the locomotive length,
is the distance margin for stoppage precision,
is the number of wagons, and
is the length of wagon. In the given expression, two wagon types are used [
35]. Therefore, the number of containers transported in each wagon and the total containers can be calculated via Equation (5) and Equation (6), respectively.
where
is the total container number of the train, and
is the container number of each wagon.
Table 6 shows the train parameters taken from the literature.
The average fuel consumption per km of locomotives in railway transport is 9.4 L/km. In addition, the fuel consumption per liter and km is taken from the literature as 212.572 km/t·L [
36]. The parametric studies performed in this study are based on the given literature values [
37,
38]
2.4. Case Study
In intermodal transport, which is carried out by using different modes of transport together, it is necessary to define the route and route-dependent variables well to estimate emission, cost, and time. The boundary conditions accepted in this study for different transport modes are given in
Table 7. In the table, the full sailing status of the ships is to be especially noted. In railway transport, the sailing time is determined by considering international regulations. According to the relevant regulations, the maximum time that more than one driver can drive is considered in road transport.
This study has been carried out parametrically for the roadway, seaway, and railway frequently used in intermodal transport. As the main route, the transport to Europe via Turkey, which has an essential impact on the east–west transport, and which is being used today, is considered. The route was created between Filyos port and Vienna, and a comparison of intermodal transport of cargoes in terms of cost, environment, and time was carried out.
Table 8 shows the intermodal transport cases used in this study.
The following assumptions have been made within the framework of this study.
Loading and unloading costs between transport modes are not taken into consideration. Only the travel times of different transport modes are taken into consideration.
Only fuel costs are considered. One of the most critical cost items in transport is fuel.
Vehicle operating time in road transport is determined according to the relevant legislation. Parametric studies have been conducted, especially considering using two drivers in road transport.
3. Results and Discussion
Sustainability in transport involves the introduction of a more environmentally friendly model with lower costs. The selection of the modes of transport used, reducing the emissions that cause environmental problems such as global warming, are also among the essential components of sustainability. Within the scope of this study, a comparative evaluation of three different transport modes in terms of cost and environmental emissions is presented. Thus, the possibility of selecting appropriate transport modes for more sustainable systems in transport increases in this study. With the findings obtained, it can be ensured that the optimal value of the appropriate modes of transport, which is the most important parameter in the development of the world economy, is selected in terms of time, cost, and emissions. Carbon dioxide emissions are observed in all transport systems that utilize fossil fuels. However, reducing the amount of carbon dioxide generated due to global warming and the greenhouse effect is an extremely important factor. To reduce carbon dioxide emissions, using more efficient transport vehicles or selecting optimal transportation modes in the transport sector is an important parameter. This study considers the transport of cargo from the port of Filyos in Turkey to Vienna via two different modes of transport. Between Filyos and Vienna, transport modes are being changed in the Romanian port of Constanta, and studies have been carried out for four different situations.
Figure 5 shows the fuel consumption for different configurations. The highest fuel consumption was for Case IV, with 658.47 tonnes. Case IV refers to the mode of transport between Filyos and Vienna via roadway transportation. Case III represents the lowest fuel consumption, with 156.81 tonnes. Case III includes seaway transport and riverway transport as transport modes. Therefore, it is determined that the highest fuel consumption occurs via road transport and the lowest via maritime transport. Case I, Case II, and Case III refer to seaway–road, seaway–railway, and seaway–riverway transport, respectively. The fuel consumption has been obtained for the seaway, railway, and roadway modes of transport, from least to most.
Figure 6 shows the fuel consumption of each transport mode for different transport mode cases. The fuel consumption for roadway, railway, and riverway transportation modes from Constanza to Vienna was determined to be approximately 428 tonnes, 155 tonnes, and 114.21 tonnes, respectively. Fuel consumption is lower in maritime transport, which enables the transport of high-tonnage cargoes at one time, compared to other modes. Maritime transport significantly reduces fuel consumption, even in a specific parts of the transport process. The use of inland waterways and railway transport also contributes significantly to the reduction in fuel consumption.
Cost is one of the most critical parameters to consider in choosing a transport mode. For this reason, approximately 80–90% of the transport in the world is carried out through seaway modes [
37]. However, different transport routes necessitate the use of different modes of transport. In selecting the transport modes used, choosing more environmentally friendly transport modes is essential.
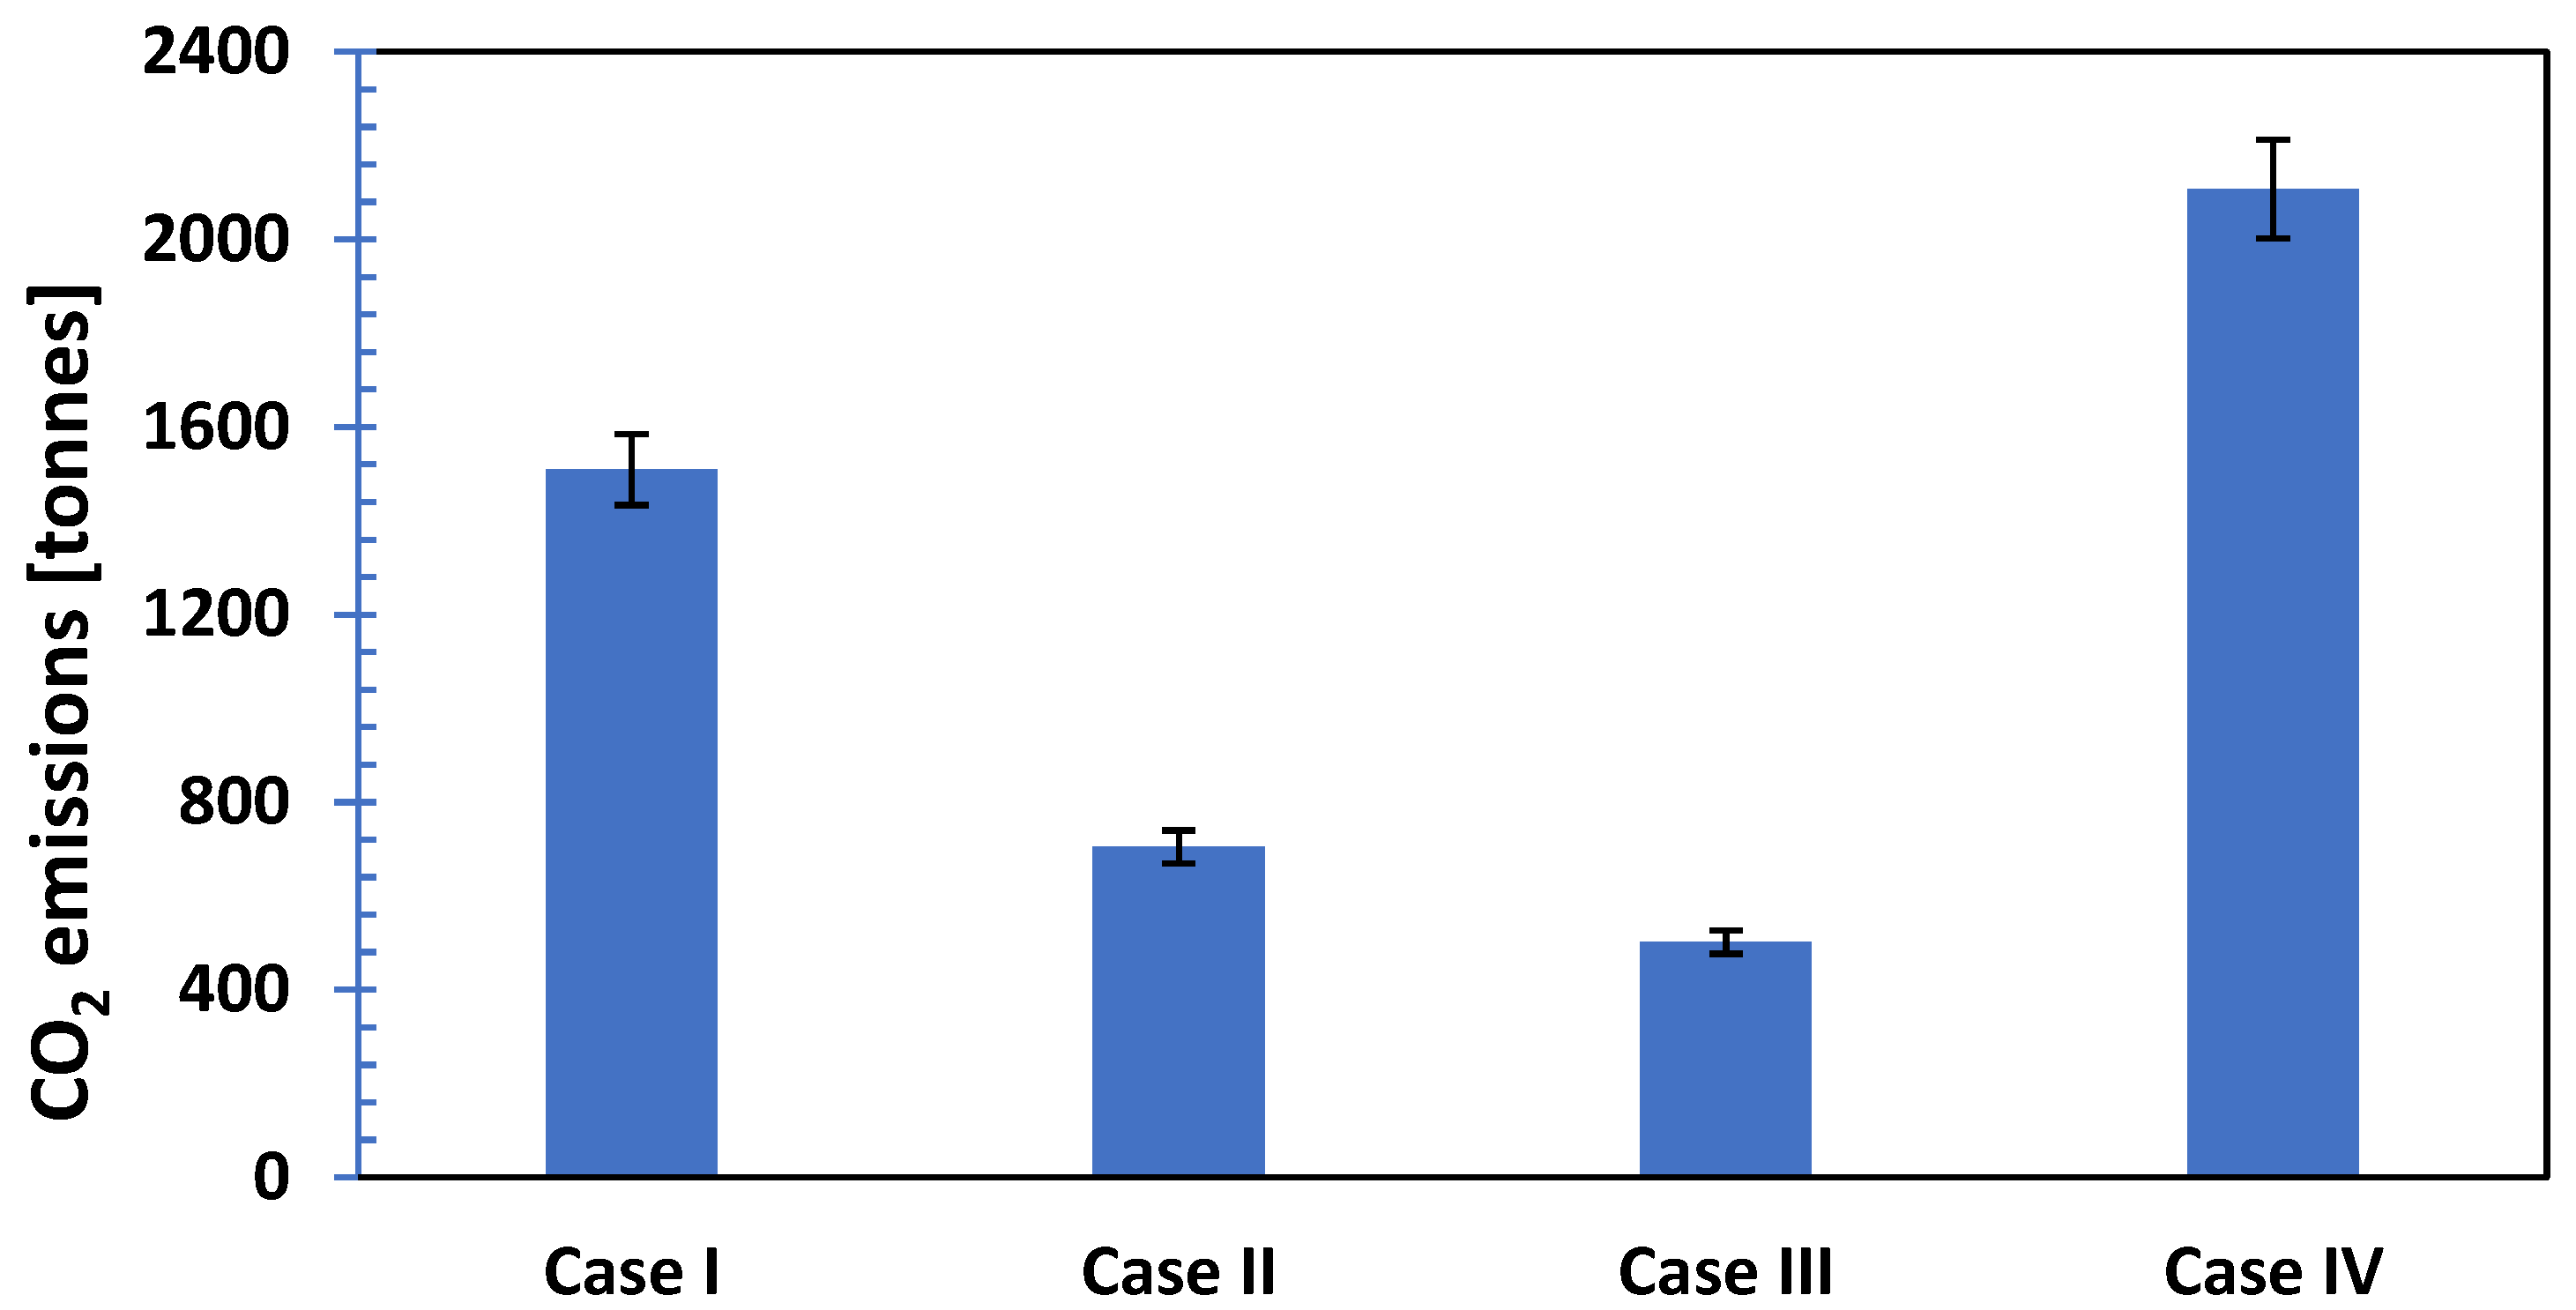
Figure 7 shows the CO
2 emissions for four different intermodal transport modes. The findings show that roadway transportation caused the highest carbon dioxide emission, with approximately 2107.12 tonnes for the same route, while this value was determined to be approximately 365.6 tonnes in maritime transportation. Case III emits the least CO
2, followed by Case II, which refers to the railway connected to the seaway, with approximately 704.32 tonnes. When the findings obtained are compared with the literature data, it is seen that the environmental impacts of road transport are higher than those of other modes of transport [
39,
40]
The CO
2 change for each transport mode is shown in
Figure 8. Among the transport modes, the highest CO
2 emissions are obtained in roadway transport in relation to fuel consumption. Since CO
2 emissions are caused directly by fuel consumption, they change in proportion to fuel consumption. The highest fuel consumption was approximately 1373.55 tonnes, 568 tonnes, and 365.472 tonnes for roadway, railway, and riverway, respectively, between Constanta and Vienna.
Time is essential in delivering goods and services from the production center to the consumption areas. The purchased product or service should reach the consumer in the fastest way. Among the modes of transport, the most advantageous in terms of time is road transport, i.e., Case IV, with a value of 37.2 h. Maritime and Danube waterway transport are the most disadvantageous in this category, with 71.2 h. The overall transportation time for every transport case is displayed in
Figure 9.
Inland waterway transport is disadvantageous regarding freight transport time (52.9 h). Railway transport (32.7 h) is also slower than road transport. Traveling between Filyos–Constanta by sea and the remaining distance by road requires an additional time of 5 h compared to direct road transport. On the other hand, the time difference between Filyos–Constanta and Danube waterway ship transport and road transport increases to 34 h. The time consumption change for each transport mode is shown in
Figure 10.
One of the parameters determining the market cost of a product is the transport cost. The cost aspect is also considered when creating the distribution network between the production and consumption points of the product. Road transport is the leading mode of transport in terms of cost. Filyos–Constanta and Danube waterway ship transport constitute the most advantageous situation. Road transport is more than four times more costly than waterway transport.
Figure 11 shows the costs for each transport case. Within the scope of this study, fuel consumption is calculated for each transport mode. While diesel fuel is generally used in ships and trains in the calculations, low-sulfur diesel fuels are used in ships with the regulations introduced under IMO MARPOL Annex 6. Therefore, the properties of the fuels used for each transport mode are very similar, and the same fuel use is assumed in this study.
The most advantageous mode of transport in terms of cost is seaway transport. Inland waterway transport, which refers to riverway transport, is also beneficial in terms of cost. Roadway transport, whether direct or multimodal, increases the cost significantly. For a commodity transported by ship from Filyos to Constanta, road transport is 2.8 times more costly than railway transport and 3.8 times more costly than riverway transport. The cost change for each transport mode is shown in
Figure 12.
The findings obtained have been evaluated for different modes of transport for the distribution of products brought from the east to Europe from Filyos port, which is open to development and is one of the central port installation locations. This study makes significant contributions to the literature in terms of alleviating regional tensions and strait traffic, especially in the Black Sea region. This study analyzes different modes of transport in terms of cost, environment, and time. One of the innovations that stands out in this study is its focus on Black Sea and European river transportation without straits. This study examined different parameters and revealed the appropriate transportation mode.
4. Conclusions
Suitable transportation choices regarding time, cost, and environment constitute the basis of freight transport in today’s conditions. Therefore, the choices of these priorities, in terms of both intermodal and multimodal transport, fall under the selection of transport routes. This study presents the comparative time, cost, fuel consumption, and CO2 values for various modes of transport with intermodal transport between Filyos and Vienna. This study also analyzes the relationship between roadway, railway, and seaway capacity and the size, environmental emissions, and cost of the selected route. The data used in this study are current, and the research has been carried out only on transport costs. It has been carried out in line with certain limitations, e.g., by ignoring the parameters related to cargo handling and personnel costs. The findings obtained in this study are as follows:
This study concludes that the highest fuel consumption occurred only by road and was determined to be approximately 658.47 tonnes. Fuel consumption is calculated from minimum to maximum for seaway, railway, and roadway transportation.
CO2 emissions have been calculated in proportion to fuel consumption, and 1372.55 tonnes, 568 tonnes, and 365 tonnes have been obtained for roadway, railway, and sea transportation, respectively.
Seaway is found to be the slowest means of transportation costs, while roadway transportation is the fastest. However, seaway transportation is the most cost-effective and valuable.
With the findings, the transport sector and policy-makers can draw a road map for selecting the appropriate transport mode by considering the imposed emission restrictions. The main outputs of this study are the selection of road and rail transport modes for speed and transport options and the selection of maritime transport in terms of cost. Further studies may use novel investigation methods to minimize emissions, utilizing both multimodal and intermodal transportation modes. In addition, in future studies, intermodal transportation costs and environmental efficiency could be evaluated according to loading, unloading, and human factors.


