
Impact of the “Class B Infectious Disease Class B Management” Policy on the Passenger Volume of Urban Rail Transit: A Nationwide Interrupted Time Series Study


Abstract
1. Introduction
2. Methods
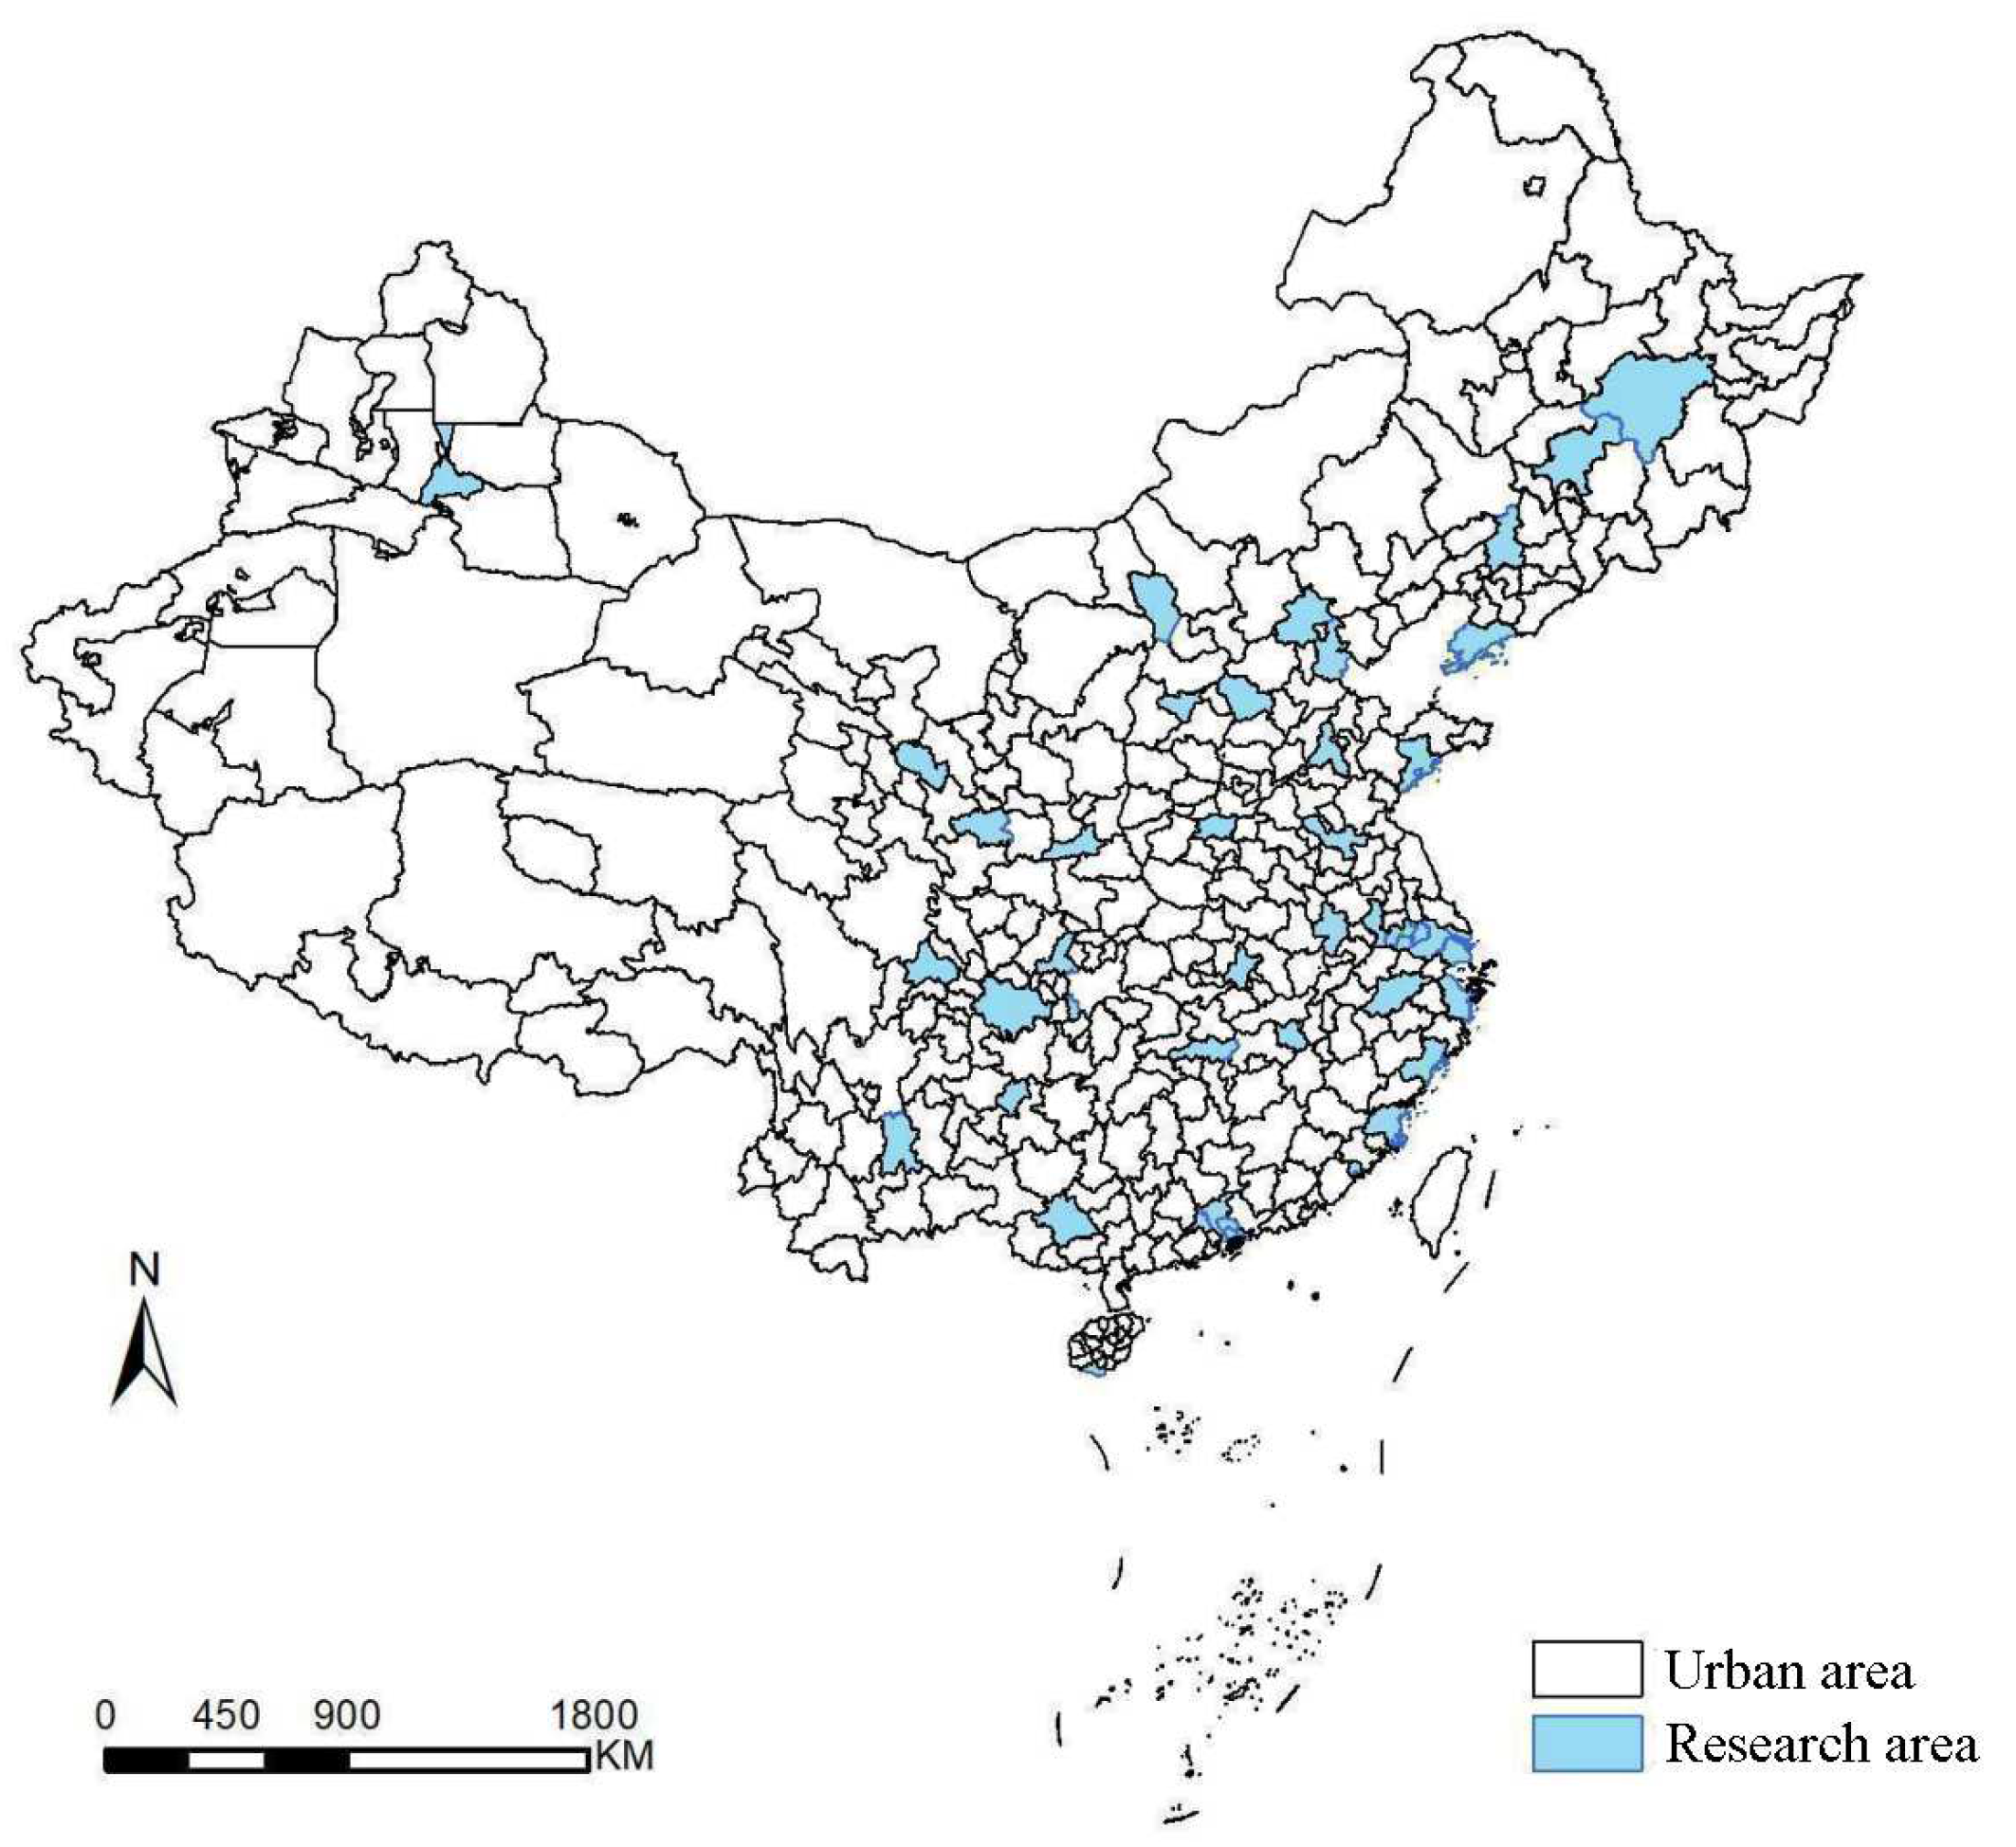
2.1. Data Sources
2.2. Outcomes
2.3. Intervention
2.4. Interrupted Time Series Analysis
3. Results
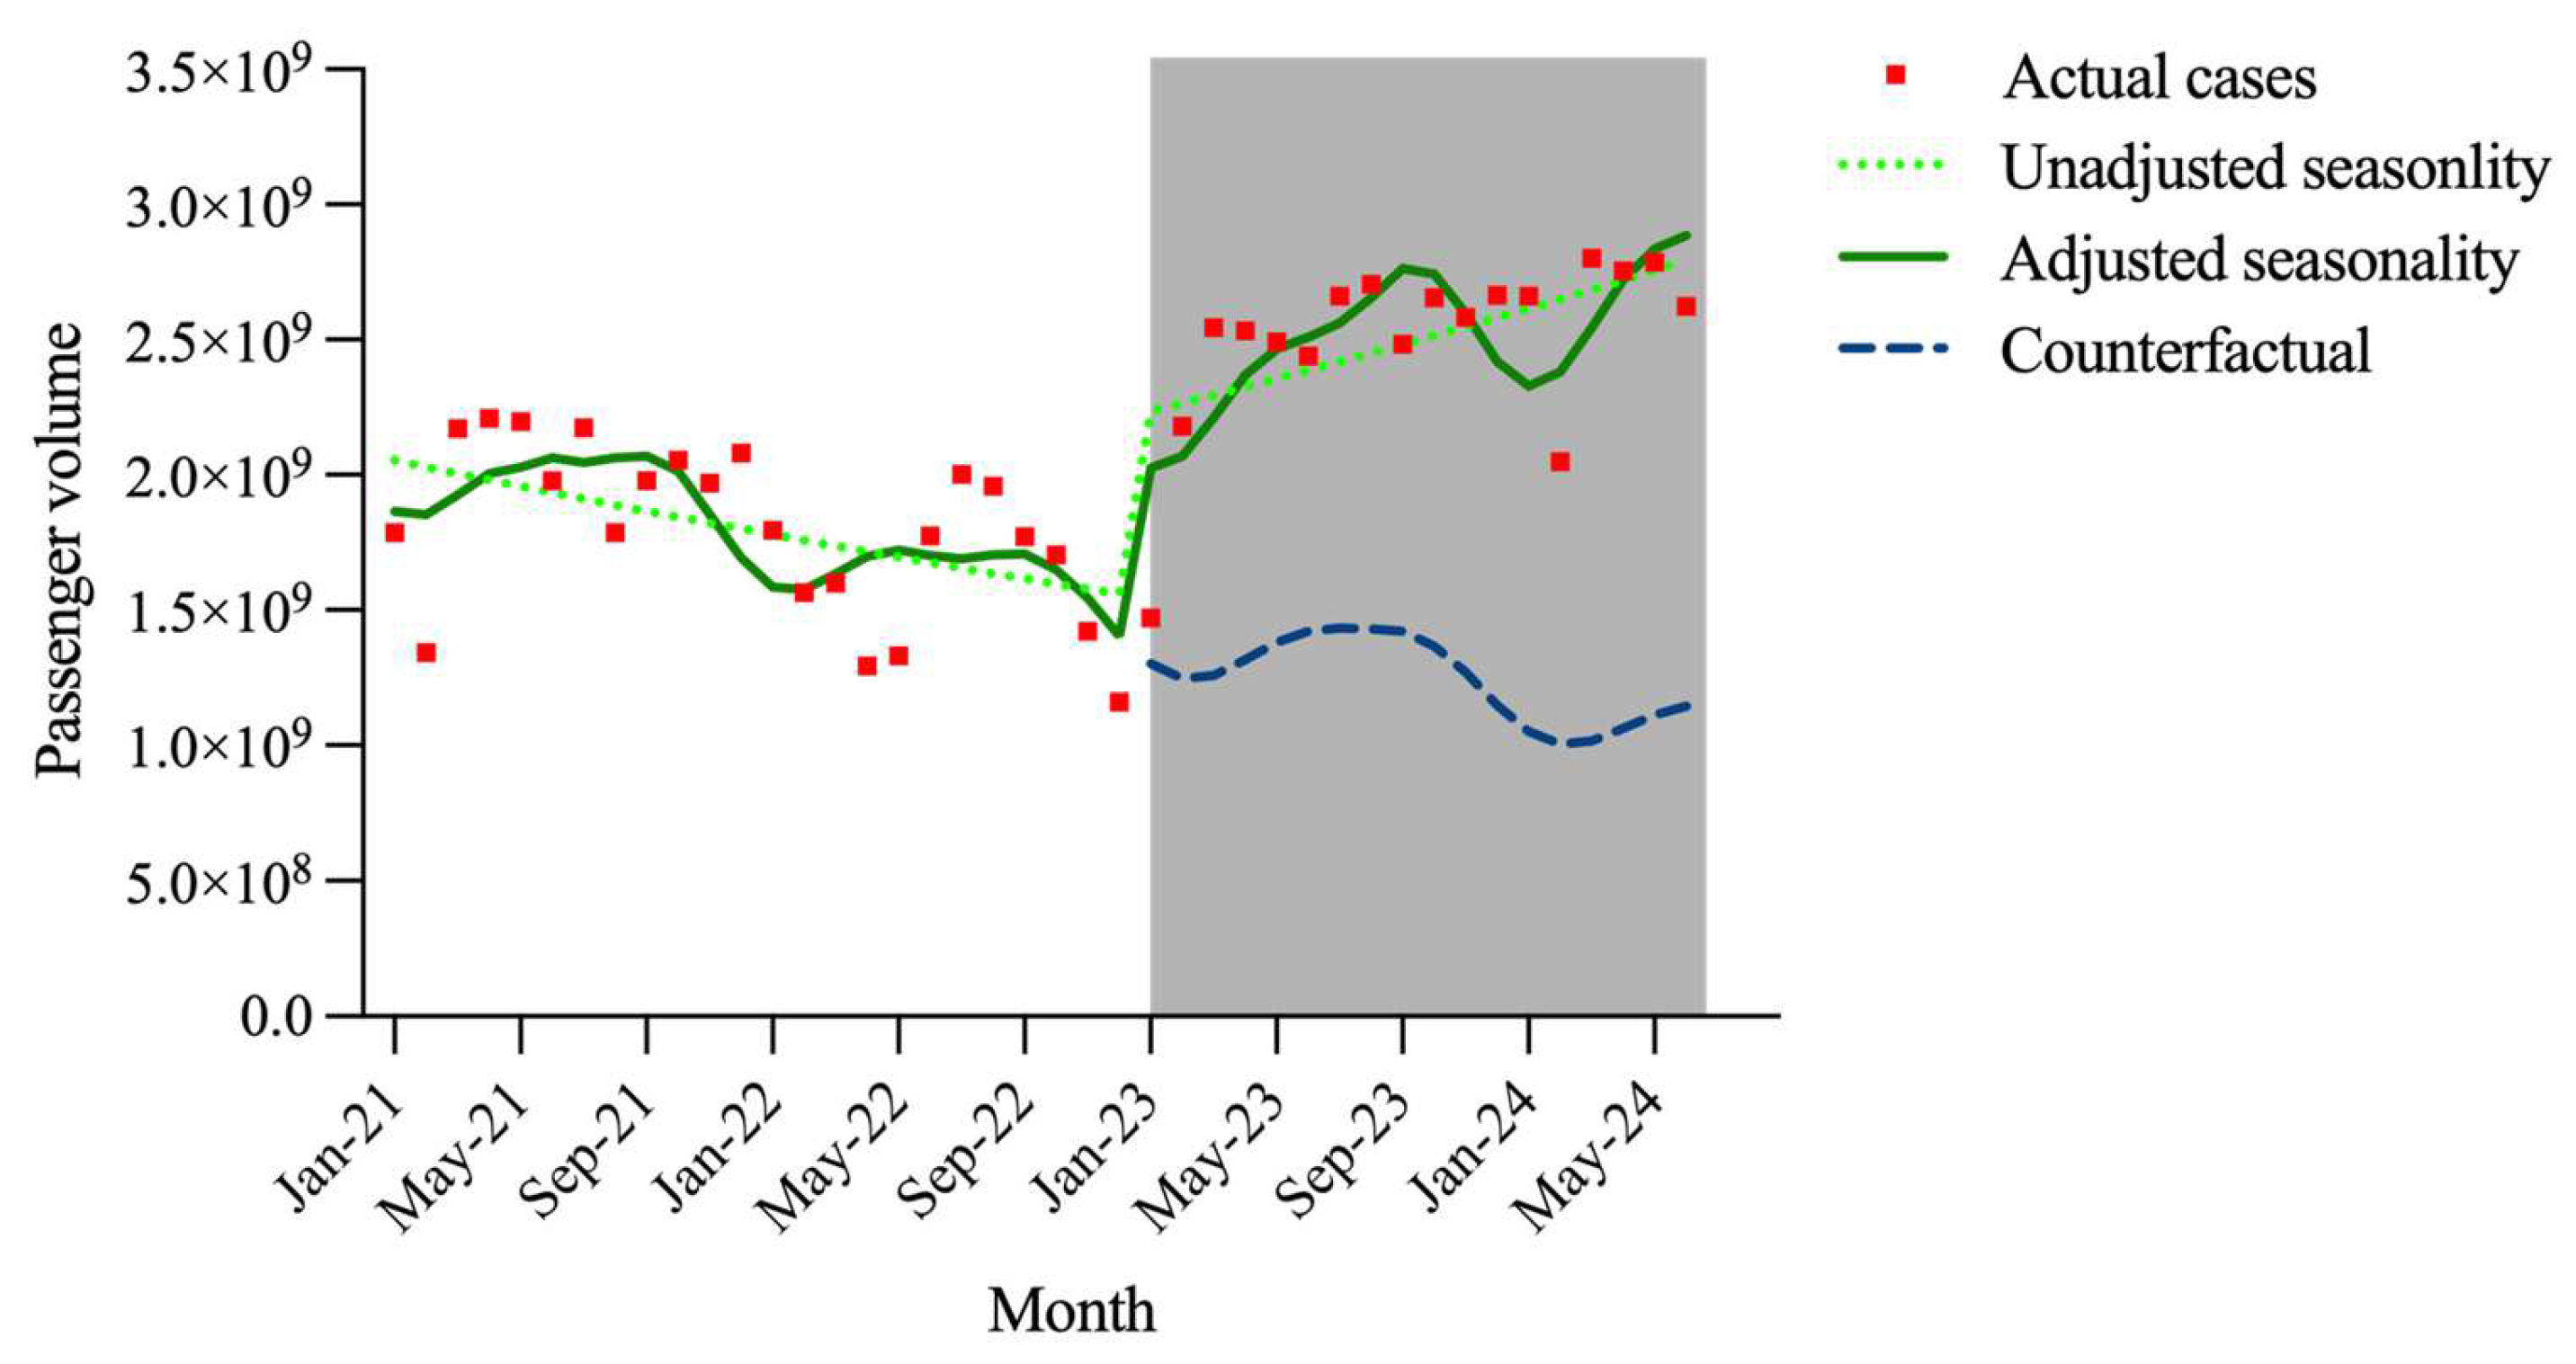
3.1. Overall Trends for the 42 Cities
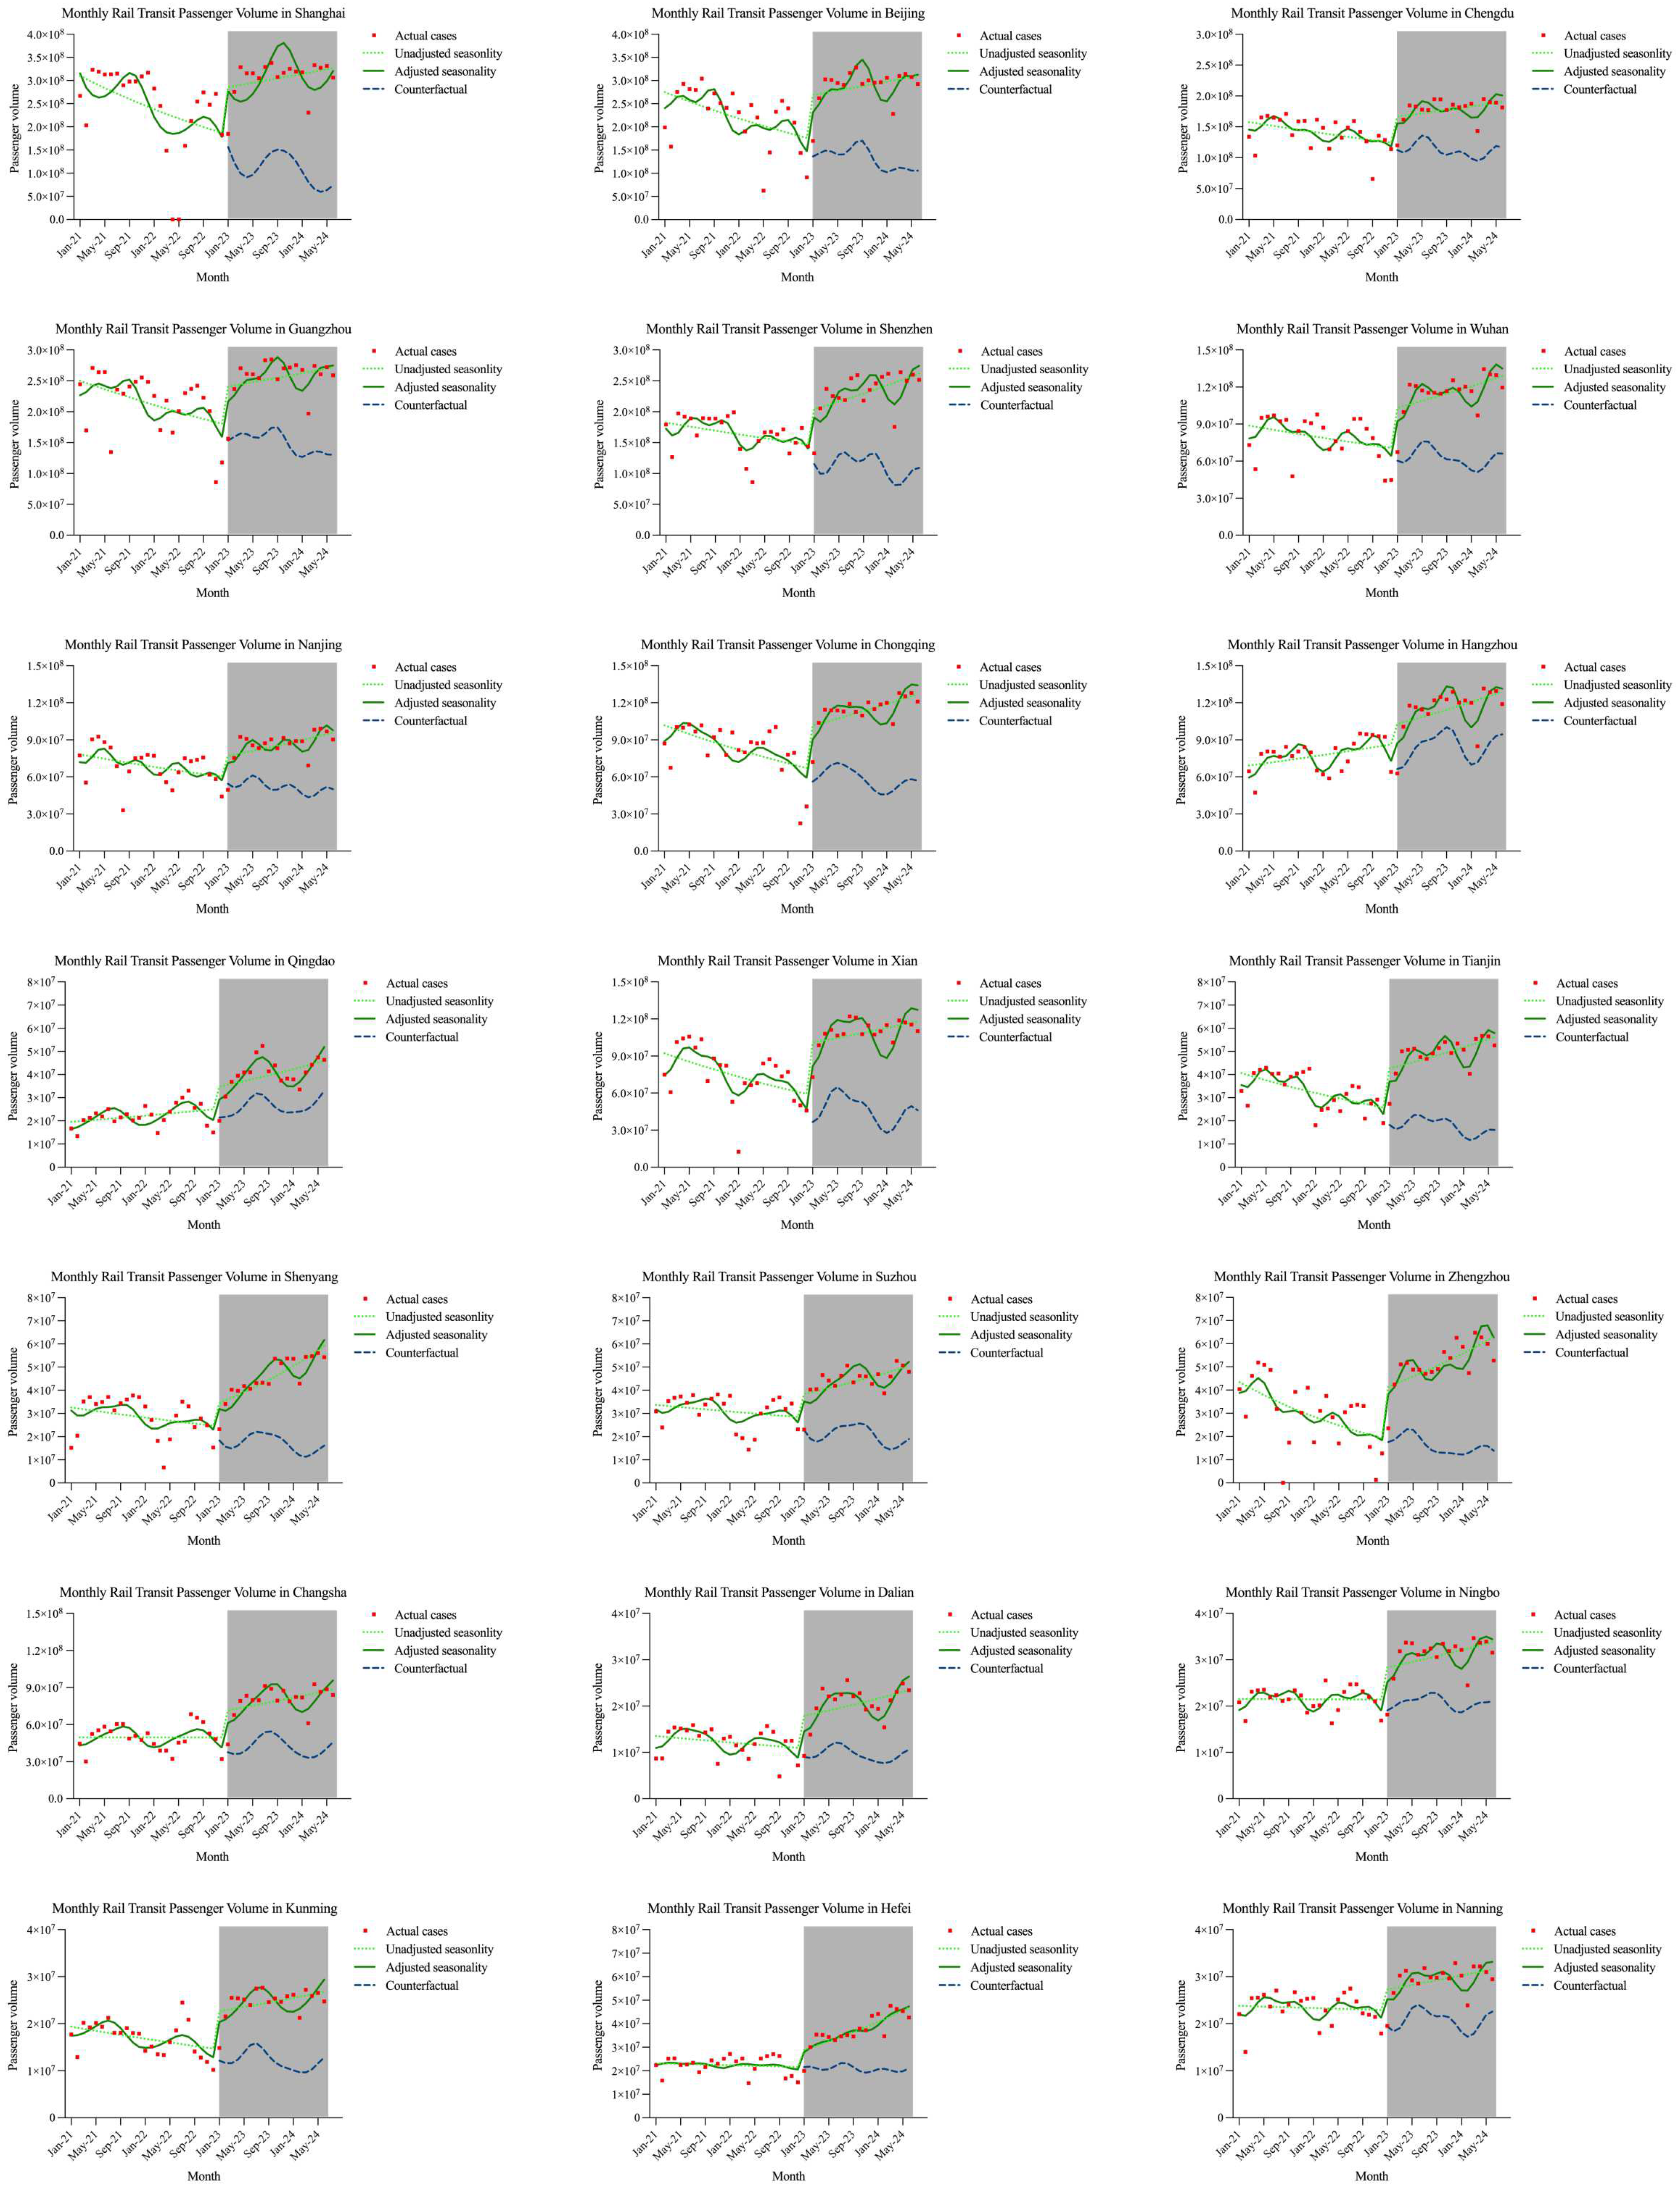
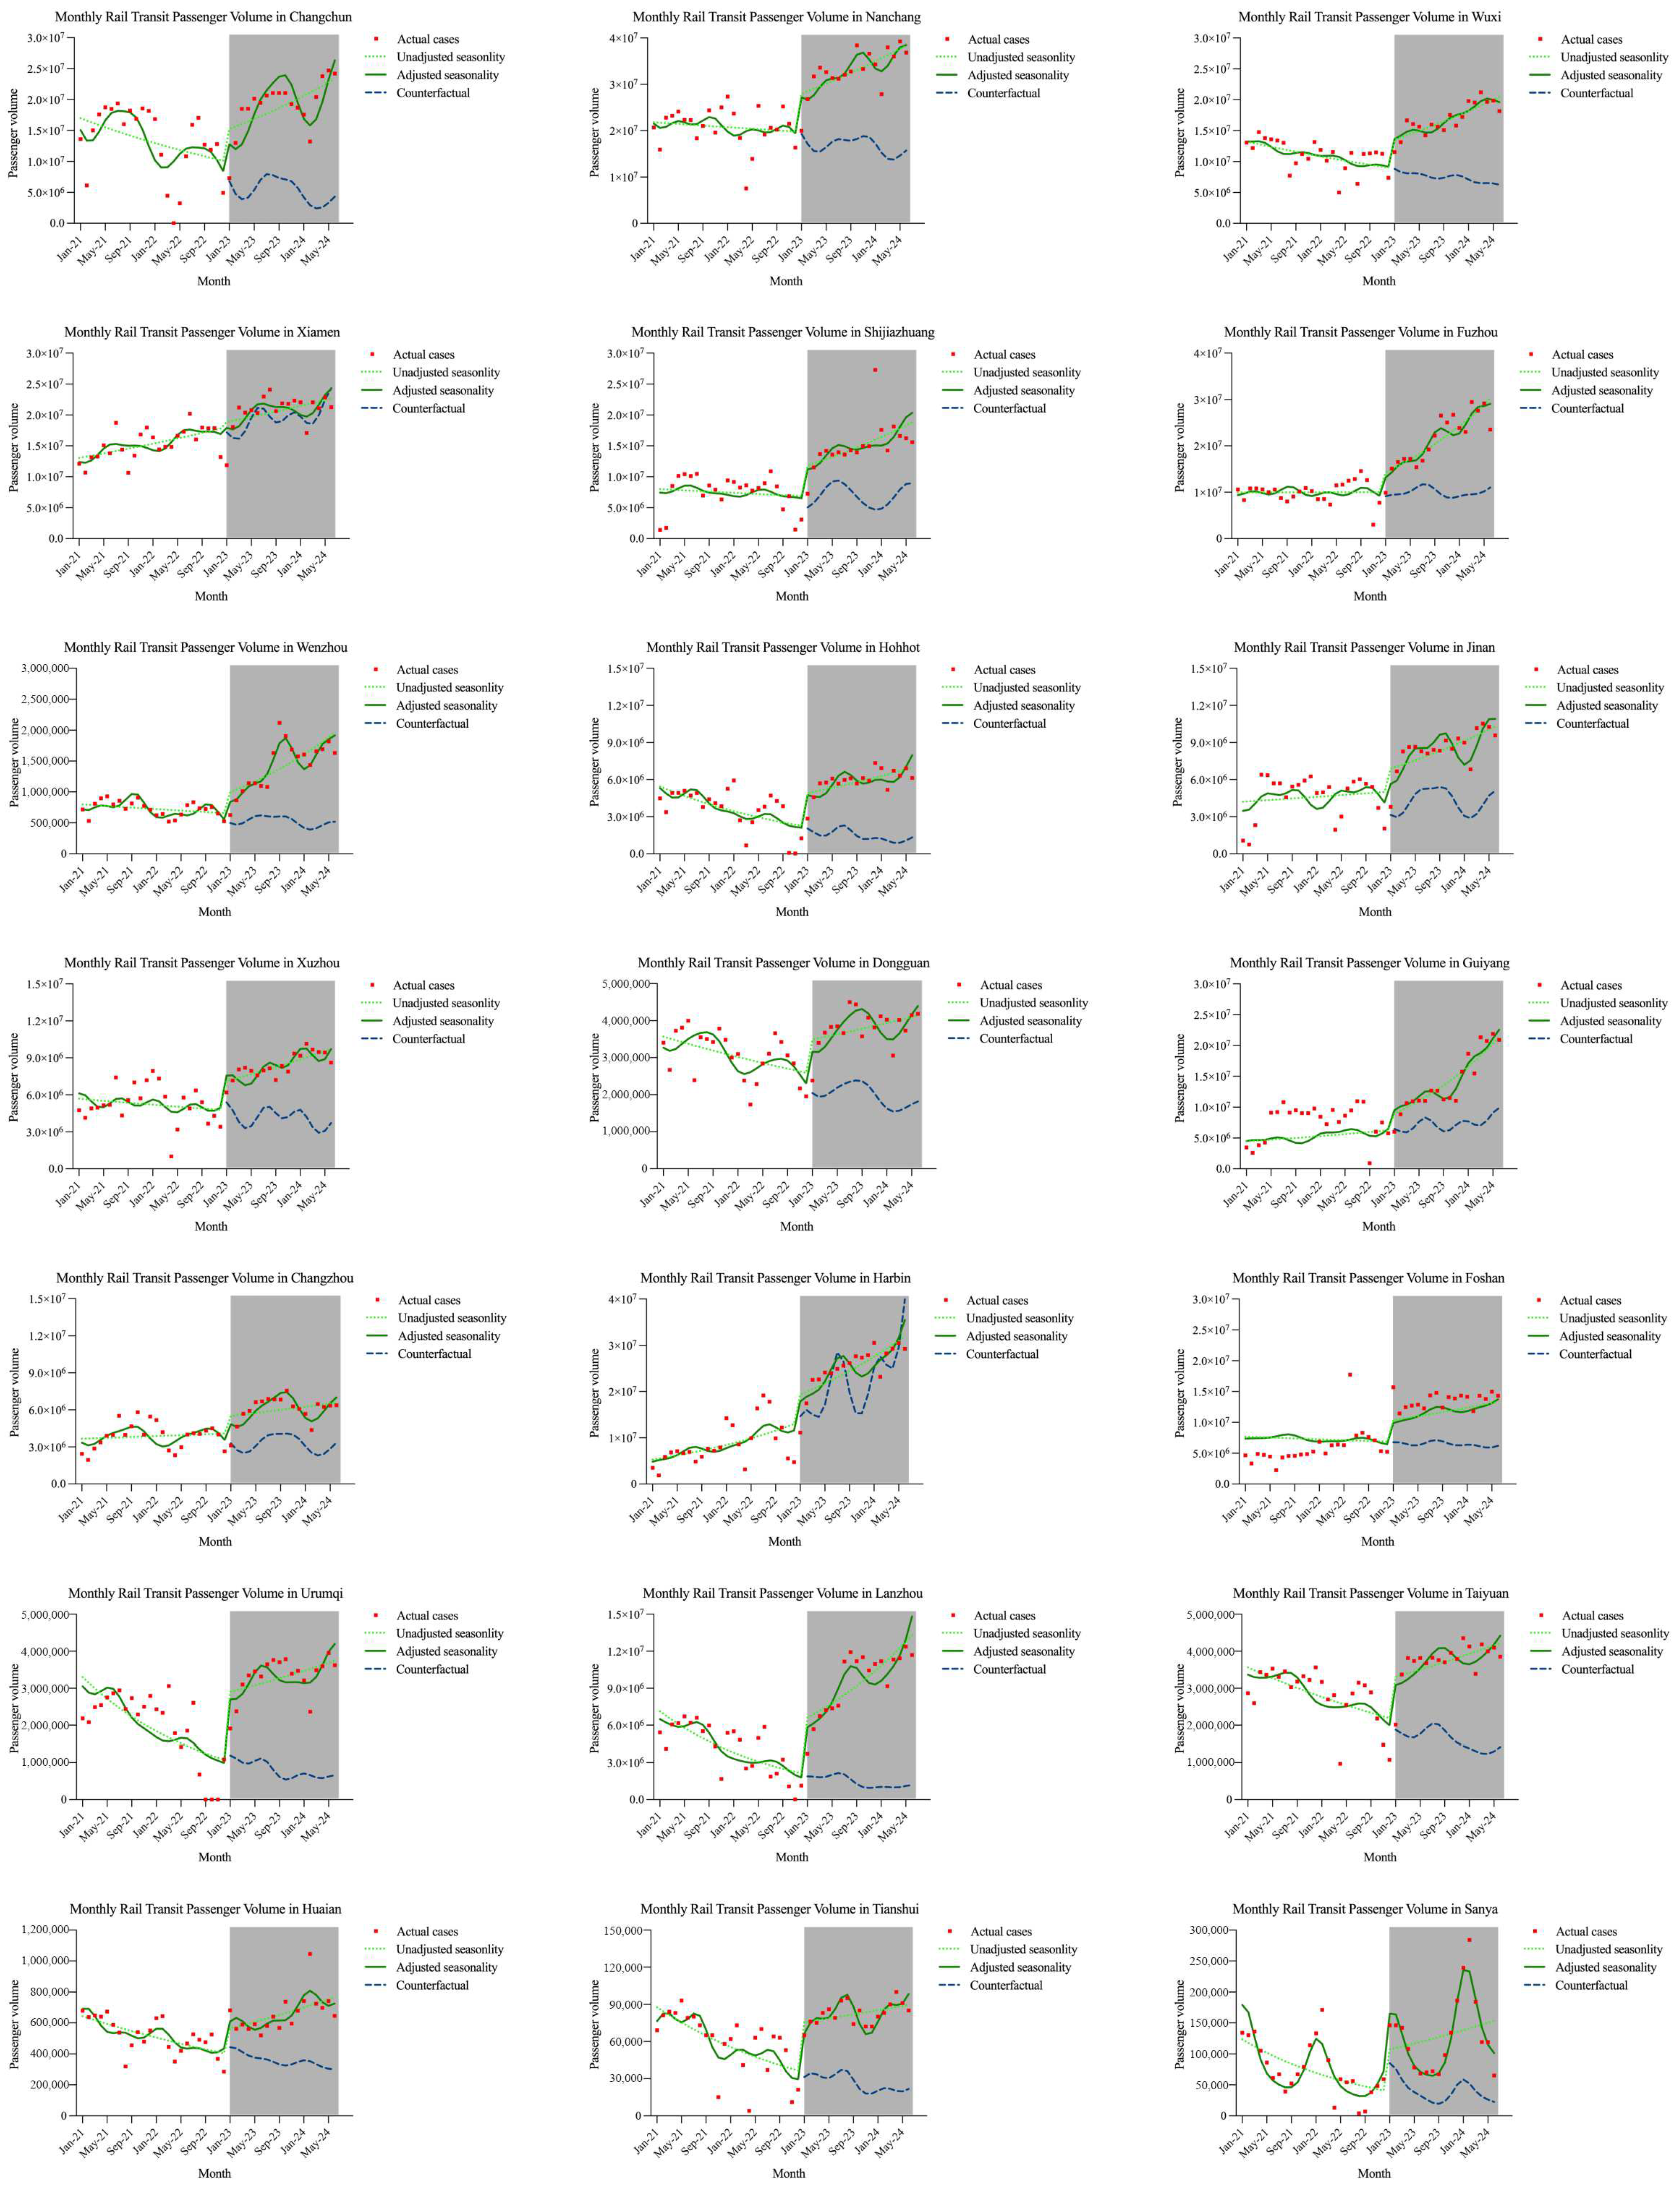
3.2. Trends for Each of the 42 Cities
4. Discussion
4.1. Reasons and Variations in Policy Impact
4.1.1. Reasons for the Positive Impact of the Policy in the Whole Country
Easing of Travel Restrictions
Reduction in Travel Fear
4.1.2. Reasons for the Different Impacts of the Policy in Certain Cities
Variations in Policy Implementation and Enforcement
Regional Differences in Public Travel Needs
4.1.3. Reasons for the Lack of Impact of the Policy in Certain Cities
4.2. Recommendations and Suggestions
4.2.1. Integration of Multi-Modal Transportation
4.2.2. Adjustments in Operational Planning
4.2.3. Design of Station Environments
4.2.4. Health and Safety Protection Measures
4.2.5. Data-Driven Management Approaches
4.3. Study Limitations
5. Conclusions
Author Contributions
Funding
Data Availability Statement
Acknowledgments
Conflicts of Interest
Abbreviations
| ITS | Interrupted Time Series |
Appendix A

| Parameters | Estimated Value (95%CI) | SE | z | RR (95%CI) | p-Value |
|---|---|---|---|---|---|
| 3.775 (3.471, 4.079) | 0.155 | 24.294 | 43.606 (32.157, 59.132) | <0.001 | |
| −0.003 (−0.064, 0.058) | 0.031 | −0.110 | 0.997 (0.938, 1.059) | 0.912 | |
| −0.235 (−0.513, 0.043) | 0.142 | −1.652 | 0.791 (0.599, 1.045) | 0.099 | |
| 0.019 (−0.042, 0.080) | 0.031 | 0.608 | 1.019 (0.959, 1.083) | 0.543 |
| Parameters | Estimated Value (95%CI) | SE | z | RR (95%CI) | p-Value |
|---|---|---|---|---|---|
| 3.492 (3.394, 3.590) | 0.050 | 69.957 | 32.863 (29.800, 36.241) | <0.001 | |
| −0.208 (−0.310, −0.106) | 0.052 | −3.974 | 0.812 (0.733, 0.900) | <0.001 | |
| 0.402 (0.224, 0.626) | 0.091 | 4.363 | 1.495 (1.251, 1.869) | <0.001 | |
| 0.040 (0.022, 0.058) | 0.009 | 4.608 | 1.041 (1.023, 1.058) | <0.001 |
Appendix B
| Pre-Intervention Passenger Volume Ranking | City | Rate of Change in Passenger Volume After Intervention | Ranking of Passengers Volume Change Rates After Intervention |
|---|---|---|---|
| 1 | Shanghai | 179.95% | 8 |
| 2 | Beijing | 119.67% | 15 |
| 3 | Guangzhou | 71.04% | 33 |
| 4 | Shenzhen | 107.96% | 20 |
| 5 | Chengdu | 58.44% | 35 |
| 6 | Wuhan | 84.42% | 29 |
| 7 | Hangzhou | 36.77% | 39 |
| 8 | Chongqing | 95.06% | 25 |
| 9 | Xian | 136.29% | 12 |
| 10 | Nanjing | 66.04% | 34 |
| 11 | Changsha | 90.62% | 27 |
| 12 | Zhengzhou | 219.77% | 5 |
| 13 | Tianjin | 176.56% | 9 |
| 14 | Shenyang | 168.70% | 11 |
| 15 | Suzhou | 114.86% | 16 |
| 16 | Qingdao | 52.90% | 36 |
| 17 | Hefei | 78.68% | 31 |
| 18 | Nanchang | 96.45% | 24 |
| 19 | Ningbo | 49.65% | 37 |
| 20 | Nanning | 41.91% | 38 |
| 21 | Harbin | 13.54% | 40 |
| 22 | Kunming | 103.07% | 21 |
| 23 | Fuzhou | 114.40% | 18 |
| 24 | Xiamen | 6.32% | 41 |
| 25 | Dalian | 114.27% | 19 |
| 26 | Changchun | 261.68% | 4 |
| 27 | Wuxi | 125.85% | 14 |
| 28 | Shijiazhuang | 114.72% | 17 |
| 29 | Guiyang | 73.88% | 32 |
| 30 | Foshan | −5.13% | 42 |
| 31 | Lanzhou | 569.86% | 1 |
| 32 | Jinan | 100.63% | 23 |
| 33 | Xuzhou | 101.97% | 22 |
| 34 | Changzhou | 86.44% | 28 |
| 35 | Hohhot | 298.49% | 3 |
| 36 | Dongguan | 92.17% | 26 |
| 37 | Taiyuan | 131.17% | 13 |
| 38 | Urumqi | 311.03% | 2 |
| 39 | Wenzhou | 173.23% | 10 |
| 40 | Huaian | 84.36% | 30 |
| 41 | Sanya | 214.28% | 6 |
| 42 | Tianshui | 209.11% | 7 |
References
- Yang, H.; Lu, Y.; Wang, J.; Zheng, Y.; Ruan, Z.; Peng, J. Understanding Post-Pandemic Metro Commuting Ridership by Considering the Built Environment: A Quasi-Natural Experiment in Wuhan, China. Sustain. Cities Soc. 2023, 96, 104626. [Google Scholar] [CrossRef]
- Osorio, J.; Liu, Y.; Ouyang, Y. Executive orders or public fear: What caused transit ridership to drop in Chicago during COVID-19? Transp. Res. Part D Transp. Environ. 2022, 105, 103226. [Google Scholar] [CrossRef] [PubMed]
- Campisi, T.; Basbas, S.; Trouva, M.; Papas, T.; Akgün-Tanbay, N.; Stamatiadis, N.; Tesoriere, G. Anxiety, fear and stress feelings of road users during daily walking in COVID-19 pandemic: Sicilian cities. Transp. Res. Procedia 2022, 62, 107–114. [Google Scholar] [CrossRef]
- Muhammad, S.; Long, X.; Salman, M. COVID-19 pandemic and environmental pollution: A blessing in disguise? Sci. Total Environ. 2020, 728, 138820. [Google Scholar] [CrossRef]
- Palm, M.; Allen, J.; Liu, B.; Zhang, Y.; Widener, M.; Farber, S. Riders Who Avoided Public Transit During COVID-19: Personal Burdens and Implications for Social Equity. J. Am. Plan. Assoc. 2021, 87, 455–469. [Google Scholar] [CrossRef]
- Jaekel, B.; Muley, D. Transport impacts in Germany and State of Qatar: An assessment during the first wave of COVID-19. Transp. Res. Interdiscip. Perspect. 2022, 13, 100540. [Google Scholar] [CrossRef]
- Klos-Adamkiewicz, Z.; Gutowski, P. The Outbreak of COVID-19 Pandemic in Relation to Sense of Safety and Mobility Changes in Public Transport Using the Example of Warsaw. Sustainability 2022, 14, 1780. [Google Scholar] [CrossRef]
- Jiang, S.; Cai, C. Unraveling the dynamic impacts of COVID-19 on metro ridership: An empirical analysis of Beijing and Shanghai, China. Transp. Policy 2022, 127, 158–170. [Google Scholar] [CrossRef]
- Pan, Y.; He, S.Y. Analyzing COVID-19’s impact on the travel mobility of various social groups in China’s Greater Bay Area via mobile phone big data. Transp. Res. Part A Policy Pract. 2022, 159, 263–281. [Google Scholar] [CrossRef]
- National Health Commission of the People’s Republic of China. Notice on the issuance of the general plan for the implementation of “Class B infectious Disease Class B Management” for Novel Coronavirus Infection. 2022. Available online: http://www.gov.cn/xinwen/2022-12/27/content_5733739.html (accessed on 20 July 2024).
- People’s Daily Online. China Enters a New Stage of COVID-19 Response. 2023. Available online: http://en.people.cn/n3/2023/0113/c90000-10195779.html (accessed on 20 July 2024).
- Ma, Y.; Xu, S.; Luo, Y.; Peng, J.; Guo, J.; Dong, A.; Xu, Z.; Li, J.; Lei, L.; He, L.; et al. Predicting the transmission dynamics of novel coronavirus infection in Shanxi province after the implementation of the “Class B infectious disease Class B management” policy. Front. Public Health 2023, 11, 1322430. [Google Scholar] [CrossRef]
- Voith, R. The long-run elasticity of demand for commuter rail transportation. J. Urban Econ. 1991, 30, 360–372. [Google Scholar] [CrossRef]
- Iseki, H.; Liu, C.; Knaap, G. The determinants of travel demand between rail stations: A direct transit demand model using multilevel analysis for the Washington D.C. Metrorail system. Transp. Res. Part A Policy Pract. 2018, 116, 635–649. [Google Scholar] [CrossRef]
- Mancinelli, E.; Rizza, U.; Canestrari, F.; Graziani, A.; Virgili, S.; Passerini, G. New Habits of Travellers Deriving from COVID-19 Pandemic: A Survey in Ports and Airports of the Adriatic Region. Sustainability 2022, 14, 8290. [Google Scholar] [CrossRef]
- Tang, X.; Chen, W.; Tang, S.Q.; Zhao, P.Z.; Ling, L.; Wang, C. The evaluation of preventive and control measures on congenital syphilis in Guangdong Province, China: A time series modeling study. Infection 2022, 50, 1179–1190. [Google Scholar] [CrossRef]
- McGreevy, A.; Soley-Bori, M.; Ashworth, M.; Wang, Y.; Rezel-Potts, E.; Durbaba, S.; Dodhia, H.; Fox-Rushby, J. Ethnic inequalities in the impact of COVID-19 on primary care consultations: A time series analysis of 460,084 individuals with multimorbidity in South London. BMC Med. 2023, 21, 26. [Google Scholar] [CrossRef]
- Nash, K.; Lai, J.; Sandhu, K.; Chandan, J.S.; Shantikumar, S.; Ogunlayi, F.; Coleman, P.C. Impact of national COVID-19 restrictions on incidence of notifiable communicable diseases in England: An interrupted time series analysis. BMC Public Health 2022, 22, 2318. [Google Scholar] [CrossRef]
- Ma, X.; Sun, S.; Li, L.; He, M.; Cui, H. How temporary disruption of metro service influence metro commuters’ mode shifts during the COVID-19 pandemic? Evidence from Tianjin, China. Travel Behav. Soc. 2024, 36, 100773. [Google Scholar] [CrossRef]
- Peng, Y.; Lopez, J.M.R.; Santos, A.P.; Mobeen, M.; Scheffran, J. Simulating exposure-related human mobility behavior at the neighborhood-level under COVID-19 in Porto Alegre, Brazil. Cities 2023, 134, 104161. [Google Scholar] [CrossRef]
- Musselwhite, C.; Avineri, E.; Susilo, Y. Restrictions on mobility due to the coronavirus COVID-19: Threats and opportunities for transport and health. J. Transp. Health 2021, 20, 101042. [Google Scholar] [CrossRef]
- Damsara, K.; De Silva, D.; Pasindu, H.; Munasinghe, T. Study on Variation in Mobility and Travel Behavior during the COVID-19 Pandemic: A Case Study in Western Province, Sri Lanka. Transp. Res. Procedia 2025, 82, 1949–1964. [Google Scholar] [CrossRef]
- Tabassum, N.; Kalantari, H.A.; Kaniewska, J.; Ameli, S.H.; Ewing, R.; Yang, W.; Promy, N.S. Ways of increasing transit ridership-lessons learned from successful transit agencies. Case Stud. Transp. Policy 2025, 19, 101362. [Google Scholar] [CrossRef]
- Bi, W.; Shen, Y.; Ji, Y.; Du, Y. The impacts of COVID-19 pandemic on bus transit demand: A 30-month Naturalistic Observation in Jiading, Shanghai, China. Int. J. Transp. Sci. Technol. 2024, S2046043024000479. [Google Scholar] [CrossRef]
- Ashour, L.A.; Shen, Q.; Moudon, A.; Cai, M.; Wang, Y.; Brown, M. Post-pandemic transit commute: Lessons from focus group discussions on the experience of essential workers during COVID-19. J. Transp. Geogr. 2024, 116, 103832. [Google Scholar] [CrossRef]
- Lin, Y.; Xu, Y.; Zhao, Z.; Tu, W.; Park, S.; Li, Q. Assessing effects of pandemic-related policies on individual public transit travel patterns: A Bayesian online changepoint detection based framework. Transp. Res. Part A Policy Pract. 2024, 181, 104003. [Google Scholar] [CrossRef]
- Yu, J.; Wang, S.; Wang, B.; Li, W.; Feng, T. Effects of COVID-19 on flex route transit utilization: An interrupted time series analysis. Res. Transp. Bus. Manag. 2024, 57, 101230. [Google Scholar] [CrossRef]
- Goodland, F.; Potoglou, D. The resilience of public transport post-COVID: The case of Great Britain. Case Stud. Transp. Policy 2023, 14, 101088. [Google Scholar] [CrossRef]
- Christoforou, Z.; Kalakoni, A.M.P.; Gioldasis, C. Mode shifts from public transport to bike-sharing in the era of COVID-19: Riding back to normality. J. Public Transp. 2023, 25, 100071. [Google Scholar] [CrossRef]
- Bonera, M.; Martinelli, V. COVID-19 and Public Transport: Two years later. Investigating the transport demand trend in the City of Brescia. Transp. Res. Procedia 2023, 69, 376–383. [Google Scholar] [CrossRef]
- Mashrur, S.M.; Wang, K.; Lavoie, B.; Habib, K.N. What can bring transit ridership back: An econometric study on the potential of usage incentives and operational policies in the Greater Toronto Area. Transp. Res. Part F Traffic Psychol. Behav. 2023, 95, 18–35. [Google Scholar] [CrossRef]
- Pepe, E.; Bajardi, P.; Gauvin, L.; Privitera, F.; Lake, B.; Cattuto, C.; Tizzoni, M. COVID-19 outbreak response, a dataset to assess mobility changes in Italy following national lockdown. Sci. Data 2020, 7, 230. [Google Scholar] [CrossRef]
- Wallace, J.; Hamid, S.; Mohamed, R.; Wong, T. Viral hepatitis in Asia-Pacific: A post-COVID-19 reset. Lancet Gastroenterol. Hepatol. 2023, 8, 778–780. [Google Scholar] [CrossRef] [PubMed]
- Liu, Q.; Liu, Y.; Zhang, C.; An, Z.; Zhao, P. Elderly mobility during the COVID-19 pandemic: A qualitative exploration in Kunming, China. J. Transp. Geogr. 2021, 96, 103176. [Google Scholar] [CrossRef] [PubMed]
- Liu, S.; Yamamoto, T. Role of stay-at-home requests and travel restrictions in preventing the spread of COVID-19 in Japan. Transp. Res. Part A Policy Pract. 2022, 159, 1–16. [Google Scholar] [CrossRef] [PubMed]
- Hensher, D.A.; Beck, M.J.; Balbontin, C. Working from home 22 months on from the beginning of COVID-19: What have we learned for the future provision of transport services? Res. Transp. Econ. 2023, 98, 101271. [Google Scholar] [CrossRef]
- Oestreich, L.; Rhoden, P.S.; Vieira, J.D.S.; Ruiz-Padillo, A. Impacts of the COVID-19 pandemic on the profile and preferences of urban mobility in Brazil: Challenges and opportunities. Travel Behav. Soc. 2023, 31, 312–322. [Google Scholar] [CrossRef]
- Przybylowski, A.; Stelmak, S.; Suchanek, M. Mobility Behaviour in View of the Impact of the COVID-19 Pandemic—Public Transport Users in Gdansk Case Study. Sustainability 2021, 13, 364. [Google Scholar] [CrossRef]
- Aghabayk, K.; Esmailpour, J.; Shiwakoti, N. Effects of COVID-19 on rail passengers’ crowding perceptions. Transp. Res. Part A Policy Pract. 2021, 154, 186–202. [Google Scholar] [CrossRef]
- Kwon, D.; Oh, S.E.S.; Choi, S.; Kim, B.H.S. Viability of compact cities in the post-COVID-19 era: Subway ridership variations in Seoul Korea. Ann. Reg. Sci. 2023, 71, 175–203. [Google Scholar] [CrossRef]
- Ge, J. The COVID-19 pandemic in China: From dynamic zero-COVID to current policy. Herz 2023, 48, 226–228. [Google Scholar] [CrossRef]
- Zang, P.; Qiu, H.; Yu, Y.; Chen, K.; Zhang, H.; Ye, B.; Guo, H. Non-linear impact of the built environment on metro commuter flows before and after the COVID-19 outbreak: A case study in Guangzhou. Appl. Geogr. 2024, 168, 103301. [Google Scholar] [CrossRef]
- Ghosh, A.; Nundy, S.; Ghosh, S.; Mallick, T.K. Study of COVID-19 pandemic in London (UK) from urban context. Cities 2020, 106, 102928. [Google Scholar] [CrossRef] [PubMed]
- Hotle, S.; Murray-Tuite, P.; Singh, K. Influenza risk perception and travel-related health protection behavior in the US: Insights for the aftermath of the COVID-19 outbreak. Transp. Res. Interdiscip. Perspect. 2020, 5, 100127. [Google Scholar] [CrossRef] [PubMed]
- Jou, R.C.; Yeh, C.S.; Chen, K.H. Travel Behavior Changes after COVID-19 Outbreak in Taiwan. J. Adv. Transp. 2022, 2022, 9085030. [Google Scholar] [CrossRef]
- Liu, C.; Zhang, W. Social and spatial heterogeneities in COVID-19 impacts on individual’s metro use: A big-data driven causality inference. Appl. Geogr. 2023, 155, 102947. [Google Scholar] [CrossRef]
- Zhou, M.; Wang, D.; Guan, X. Co-evolution of the built environment and travel behaviour in Shenzhen, China. Transp. Res. Part D Transp. Environ. 2022, 107, 103291. [Google Scholar] [CrossRef]
- Rosenthal, S.S.; Strange, W.C.; Urrego, J.A. JUE insight: Are city centers losing their appeal? Commercial real estate, urban spatial structure, and COVID-19. J. Urban Econ. 2022, 127, 103381. [Google Scholar] [CrossRef]
- Chen, C.; Feng, T.; Gu, X.; Yao, B. Investigating the effectiveness of COVID-19 pandemic countermeasures on the use of public transport: A case study of The Netherlands. Transp. Policy 2022, 117, 98–107. [Google Scholar] [CrossRef]
- Hong, S.Y.; Cho, S.H.; Park, H.C. Behavioral differences between young adults and elderly travelers concerning the crowding effect on public transit after the COVID-19 pandemic. Res. Transp. Econ. 2024, 106, 101463. [Google Scholar] [CrossRef]

| Parameters | Estimated Value (95%CI) | SE | z | RR (95%CI) | p-Value |
|---|---|---|---|---|---|
| 3.861 (3.745, 3.977) | 0.059 | 65.881 | 47.507 (42.352, 53.290) | <0.001 | |
| −0.017 (−0.025, −0.009) | 0.004 | −3.975 | 0.983 (0.975, 0.991) | <0.001 | |
| 0.394 (0.225, 0.563) | 0.086 | 4.58 | 1.483 (1.253, 1.756) | <0.001 | |
| 0.028 (0.014, 0.042) | 0.007 | 4.069 | 1.028 (1.015, 1.042) | <0.001 |
| City | Parameters | Estimated Value (95%CI) | SE | z | RR (95%CI) | p-Value |
|---|---|---|---|---|---|---|
| Shanghai | 2.628 (2.395, 2.861) | 0.119 | 22.046 | 13.849 (10.964, 17.495) | <0.001 | |
| −0.029 (−0.047, −0.011) | 0.009 | −3.199 | 0.971 (0.954, 0.989) | 0.001 | ||
| 0.537 (0.167, 0.907) | 0.189 | 2.838 | 1.711 (1.181, 2.479) | 0.005 | ||
| 0.037 (0.008, 0.066) | 0.015 | 2.451 | 1.038 (1.007, 1.069) | 0.014 | ||
| Beijing | 2.584 (2.413, 2.755) | 0.087 | 29.576 | 13.251 (11.165, 15.725) | <0.001 | |
| −0.022 (−0.036, −0.008) | 0.007 | −3.392 | 0.978 (0.965, 0.991) | 0.001 | ||
| 0.469 (0.206, 0.732) | 0.134 | 3.502 | 1.599 (1.229, 2.079) | <0.001 | ||
| 0.030 (0.008, 0.052) | 0.011 | 2.830 | 1.031 (1.009, 1.053) | 0.005 | ||
| Chengdu | 2.028 (1.906, 2.150) | 0.062 | 32.74 | 7.595 (6.727, 8.575) | <0.001 | |
| −0.011 (−0.021, −0.001) | 0.005 | −2.500 | 0.989 (0.980, 0.998) | 0.012 | ||
| 0.319 (0.139, 0.499) | 0.092 | 3.485 | 1.376 (1.150, 1.646) | <0.001 | ||
| 0.016 (0.002, 0.030) | 0.007 | 2.203 | 1.016 (1.002, 1.031) | 0.028 | ||
| Guangzhou | 2.627 (2.474, 2.780) | 0.078 | 33.716 | 13.833 (11.874, 16.116) | <0.001 | |
| −0.016 (−0.028, −0.004) | 0.006 | −2.817 | 0.984 (0.973, 0.995) | 0.005 | ||
| 0.326 (0.093, 0.559) | 0.119 | 2.731 | 1.385 (1.096, 1.750) | 0.006 | ||
| 0.023 (0.003, 0.043) | 0.010 | 2.350 | 1.023 (1.004, 1.042) | 0.019 | ||
| Shenzhen | 2.394 (2.265, 2.523) | 0.066 | 36.186 | 10.959 (9.626, 12.477) | <0.001 | |
| −0.014 (−0.024, −0.004) | 0.005 | −2.804 | 0.987 (0.977, 0.996) | 0.005 | ||
| 0.403 (0.215, 0.591) | 0.096 | 4.174 | 1.496 (1.238, 1.807) | <0.001 | ||
| 0.025 (0.009, 0.041) | 0.008 | 3.290 | 1.026 (1.010, 1.041) | 0.001 | ||
| Wuhan | 1.894 (1.743, 2.045) | 0.077 | 24.462 | 6.645 (5.709, 7.734) | <0.001 | |
| −0.011 (−0.023, 0.001) | 0.006 | −1.992 | 0.989 (0.978, 1.000) | 0.046 | ||
| 0.405 (0.187, 0.623) | 0.111 | 3.648 | 1.499 (1.206, 1.863) | <0.001 | ||
| 0.021 (0.003, 0.039) | 0.009 | 2.404 | 1.022 (1.004, 1.039) | 0.016 | ||
| Nanjing | 2.143 (1.996, 2.290) | 0.075 | 28.566 | 8.528 (7.362, 9.879) | <0.001 | |
| −0.013 (−0.023, −0.003) | 0.005 | −2.378 | 0.987 (0.976, 0.998) | 0.017 | ||
| 0.275 (0.055, 0.495) | 0.112 | 2.441 | 1.316 (1.056, 1.640) | 0.015 | ||
| 0.023 (0.005, 0.041) | 0.009 | 2.563 | 1.023 (1.005, 1.042) | 0.010 | ||
| Chongqing | 1.165 (1.022, 1.308) | 0.073 | 15.891 | 3.206 (2.777, 3.701) | <0.001 | |
| −0.018 (−0.028, −0.008) | 0.005 | −3.257 | 0.982 (0.972, 0.993) | 0.001 | ||
| 0.412 (0.196, 0.628) | 0.110 | 3.755 | 1.510 (1.218, 1.872) | <0.001 | ||
| 0.029 (0.011, 0.047) | 0.009 | 3.342 | 1.029 (1.012, 1.047) | 0.001 | ||
| Hangzhou | 1.768 (1.654, 1.882) | 0.058 | 30.515 | 5.856 (5.228, 6.560) | <0.001 | |
| 0.005 (−0.003, 0.013) | 0.004 | 1.331 | 1.005 (0.997, 1.013) | 0.183 | ||
| 0.225 (0.074, 0.376) | 0.077 | 2.935 | 1.253 (1.078, 1.457) | 0.003 | ||
| 0.006 (−0.006, 0.018) | 0.006 | 0.940 | 1.006 (0.994, 1.019) | 0.347 | ||
| Qingdao | 0.655 (0.512, 0.798) | 0.073 | 8.972 | 1.926 (1.669, 2.222) | <0.001 | |
| 0.008 (−0.002, 0.018) | 0.005 | 1.609 | 1.008 (0.998, 1.018) | 0.108 | ||
| 0.368 (0.188, 0.548) | 0.092 | 4.022 | 1.445 (1.208, 1.729) | <0.001 | ||
| 0.007 (−0.009, 0.023) | 0.008 | 0.892 | 1.007 (0.992, 1.022) | 0.372 | ||
| Xian | 2.005 (1.852, 2.158) | 0.078 | 25.743 | 7.424 (6.373, 8.648) | <0.001 | |
| −0.021 (−0.033, −0.009) | 0.006 | −3.676 | 0.979 (0.968, 0.990) | <0.001 | ||
| 0.573 (0.348, 0.798) | 0.115 | 4.980 | 1.774 (1.416, 2.224) | <0.001 | ||
| 0.028 (0.010, 0.046) | 0.009 | 3.055 | 1.028 (1.010, 1.047) | 0.002 | ||
| Tianjin | 1.155 (1.024, 1.286) | 0.067 | 17.226 | 3.175 (2.784, 3.622) | <0.001 | |
| −0.024 (−0.034, −0.014) | 0.005 | −4.731 | 0.976 (0.967, 0.986) | <0.001 | ||
| 0.587 (0.391, 0.783) | 0.100 | 5.852 | 1.799 (1.478, 2.190) | <0.001 | ||
| 0.036 (0.020, 0.052) | 0.008 | 4.602 | 1.037 (1.021, 1.053) | <0.001 | ||
| Shenyang | 1.357 (1.159, 1.555) | 0.101 | 13.406 | 3.886 (3.186, 4.739) | <0.001 | |
| −0.018 (−0.032, −0.004) | 0.007 | −2.428 | 0.982 (0.968, 0.997) | 0.015 | ||
| 0.402 (0.114, 0.690) | 0.147 | 2.730 | 1.496 (1.120, 1.997) | 0.006 | ||
| 0.049 (0.025, 0.073) | 0.012 | 4.189 | 1.050 (1.026, 1.075) | <0.001 | ||
| Suzhou | 1.036 (0.877, 1.195) | 0.081 | 12.797 | 2.818 (2.404, 3.302) | <0.001 | |
| −0.013 (−0.025, −0.001) | 0.006 | −2.190 | 0.987 (0.976, 0.999) | 0.029 | ||
| 0.376 (0.147, 0.605) | 0.117 | 3.206 | 1.457 (1.158, 1.834) | 0.001 | ||
| 0.028 (0.010, 0.046) | 0.009 | 2.918 | 1.028 (1.009, 1.047) | 0.004 | ||
| Zhengzhou | 1.241 (0.963, 1.519) | 0.142 | 8.733 | 3.461 (2.619, 4.573) | <0.001 | |
| −0.034 (−0.056, −0.012) | 0.011 | −3.057 | 0.967 (0.946, 0.988) | 0.002 | ||
| 0.741 (0.316, 1.166) | 0.217 | 3.409 | 2.099 (1.370, 3.214) | 0.001 | ||
| 0.055 (0.024, 0.086) | 0.016 | 3.324 | 1.056 (1.023, 1.091) | 0.001 | ||
| Changsha | 1.620 (1.479, 1.761) | 0.072 | 22.375 | 5.052 (4.384, 5.823) | <0.001 | |
| −0.004 (−0.014, 0.006) | 0.005 | −0.862 | 0.996 (0.986, 1.006) | 0.389 | ||
| 0.426 (0.234, 0.618) | 0.098 | 4.355 | 1.531 (1.264, 1.855) | <0.001 | ||
| 0.016 (0.000, 0.032) | 0.008 | 1.963 | 1.016 (1.002, 1.032) | 0.048 | ||
| Dalian | 0.629 (0.451, 0.807) | 0.091 | 6.944 | 1.876 (1.571, 2.241) | <0.001 | |
| −0.012 (−0.026, 0.002) | 0.007 | −1.849 | 0.988 (0.975, 1.001) | 0.064 | ||
| 0.545 (0.298, 0.792) | 0.126 | 4.342 | 1.725 (1.349, 2.206) | <0.001 | ||
| 0.025 (0.005, 0.045) | 0.010 | 2.465 | 1.025 (1.005, 1.045) | 0.014 | ||
| Ningbo | 0.832 (0.728, 0.936) | 0.053 | 15.583 | 2.299 (2.070, 2.553) | <0.001 | |
| −0.002 (−0.010, 0.006) | 0.004 | −0.590 | 0.998 (0.990, 1.005) | 0.555 | ||
| 0.302 (0.157, 0.447) | 0.074 | 4.083 | 1.352 (1.170, 1.563) | <0.001 | ||
| 0.011 (−0.001, 0.023) | 0.006 | 1.838 | 1.011 (0.999, 1.023) | 0.066 | ||
| Kunming | 0.857 (0.73, 0.984) | 0.065 | 13.130 | 2.355 (2.072, 2.676) | <0.001 | |
| −0.014 (−0.024, −0.004) | 0.005 | −2.990 | 0.986 (0.977, 0.995) | 0.003 | ||
| 0.463 (0.279, 0.647) | 0.094 | 4.913 | 1.588 (1.321, 1.910) | <0.001 | ||
| 0.023 (0.007, 0.039) | 0.008 | 3.036 | 1.023 (1.008, 1.038) | 0.002 | ||
| Hefei | 0.896 (0.753, 1.039) | 0.073 | 12.224 | 2.451 (2.123, 2.830) | <0.001 | |
| −0.004 (−0.014, 0.006) | 0.005 | −0.688 | 0.996 (0.986, 1.007) | 0.491 | ||
| 0.26 (0.064, 0.456) | 0.100 | 2.598 | 1.297 (1.066, 1.579) | 0.009 | ||
| 0.032 (0.016, 0.048) | 0.008 | 4.013 | 1.033 (1.017, 1.049) | <0.001 | ||
| Nanning | 1.021 (0.913, 1.129) | 0.055 | 18.477 | 2.777 (2.492, 3.094) | <0.001 | |
| −0.004 (−0.012, 0.004) | 0.004 | −1.081 | 0.996 (0.988, 1.003) | 0.280 | ||
| 0.224 (0.067, 0.381) | 0.080 | 2.814 | 1.251 (1.070, 1.462) | 0.005 | ||
| 0.01 (−0.002, 0.022) | 0.006 | 1.580 | 1.010 (0.998, 1.023) | 0.114 | ||
| Changchun | 0.758 (0.495, 1.021) | 0.134 | 5.676 | 2.135 (1.643, 2.773) | <0.001 | |
| −0.032 (−0.052, −0.012) | 0.010 | −3.169 | 0.968 (0.949, 0.988) | 0.002 | ||
| 0.562 (0.154, 0.97) | 0.208 | 2.699 | 1.754 (1.166, 2.638) | 0.007 | ||
| 0.056 (0.023, 0.089) | 0.017 | 3.363 | 1.057 (1.023, 1.092) | 0.001 | ||
| Nanchang | 1.267 (1.108, 1.426) | 0.081 | 15.607 | 3.551 (3.029, 4.164) | <0.001 | |
| −0.008 (−0.020, 0.004) | 0.006 | −1.426 | 0.992 (0.980, 1.003) | 0.154 | ||
| 0.392 (0.171, 0.613) | 0.113 | 3.464 | 1.479 (1.185, 1.846) | 0.001 | ||
| 0.026 (0.008, 0.044) | 0.009 | 2.823 | 1.026 (1.008, 1.044) | 0.005 | ||
| Wuxi | 0.58 (0.441, 0.719) | 0.071 | 8.125 | 1.786 (1.553, 2.054) | <0.001 | |
| −0.016 (−0.026, −0.006) | 0.005 | −3.041 | 0.984 (0.974, 0.994) | 0.002 | ||
| 0.375 (0.169, 0.581) | 0.105 | 3.569 | 1.455 (1.184, 1.787) | <0.001 | ||
| 0.040 (0.024, 0.056) | 0.008 | 4.856 | 1.041 (1.024, 1.058) | <0.001 | ||
| Xiamen | 0.914 (0.792, 1.036) | 0.062 | 14.655 | 2.493 (2.206, 2.817) | <0.001 | |
| 0.011 (0.003, 0.019) | 0.004 | 2.672 | 1.011 (1.003, 1.020) | 0.008 | ||
| 0.091 (−0.072, 0.254) | 0.083 | 1.099 | 1.096 (0.931, 1.289) | 0.272 | ||
| −0.002 (−0.016, 0.012) | 0.007 | −0.324 | 0.998 (0.984, 1.011) | 0.746 | ||
| Shijiazhuang | −0.328 (−0.647, −0.009) | 0.163 | −2.009 | 0.721 (0.523, 0.992) | 0.045 | |
| −0.007 (−0.031, 0.017) | 0.012 | −0.588 | 0.993 (0.971, 1.016) | 0.556 | ||
| 0.539 (0.116, 0.962) | 0.216 | 2.495 | 1.714 (1.123, 2.618) | 0.013 | ||
| 0.032 (−0.001, 0.065) | 0.017 | 1.858 | 1.032 (0.998, 1.067) | 0.063 | ||
| Fuzhou | 0.191 (0.001, 0.381) | 0.097 | 1.976 | 1.211 (1.002, 1.464) | 0.048 | |
| −0.002 (−0.016, 0.012) | 0.007 | −0.284 | 0.998 (0.985, 1.012) | 0.777 | ||
| 0.337 (0.090, 0.584) | 0.126 | 2.676 | 1.401 (1.094, 1.793) | 0.007 | ||
| 0.047 (0.027, 0.067) | 0.010 | 4.694 | 1.048 (1.028, 1.069) | <0.001 | ||
| Wenzhou | −2.395 (−2.522, −2.268) | 0.065 | −36.944 | 0.091 (0.080, 0.104) | <0.001 | |
| −0.016 (−0.026, −0.006) | 0.005 | −3.451 | 0.984 (0.975, 0.993) | 0.001 | ||
| 0.481 (0.305, 0.657) | 0.090 | 5.360 | 1.618 (1.357, 1.929) | <0.001 | ||
| 0.057 (0.043, 0.071) | 0.007 | 8.025 | 1.059 (1.044, 1.074) | <0.001 | ||
| Hohhot | 0.506 (0.230, 0.782) | 0.141 | 3.592 | 1.659 (1.258, 2.186) | <0.001 | |
| −0.041 (−0.063, −0.019) | 0.011 | −3.687 | 0.960 (0.939, 0.981) | <0.001 | ||
| 0.801 (0.366, 1.236) | 0.222 | 3.606 | 2.227 (1.441, 3.442) | <0.001 | ||
| 0.061 (0.028, 0.094) | 0.017 | 3.588 | 1.063 (1.028, 1.099) | <0.001 | ||
| Jinan | −0.759 (−1.039, −0.479) | 0.143 | −5.315 | 0.468 (0.354, 0.619) | <0.001 | |
| 0.003 (−0.017, 0.023) | 0.010 | 0.294 | 1.003 (0.984, 1.023) | 0.769 | ||
| 0.391 (0.032, 0.750) | 0.183 | 2.141 | 1.478 (1.034, 2.114) | 0.032 | ||
| 0.017 (−0.012, 0.046) | 0.015 | 1.177 | 1.018 (0.988, 1.048) | 0.239 | ||
| Xuzhou | −0.461 (−0.667, −0.255) | 0.105 | −4.386 | 0.631 (0.513, 0.775) | <0.001 | |
| −0.007 (−0.023, 0.009) | 0.008 | −0.926 | 0.993 (0.978, 1.008) | 0.355 | ||
| 0.353 (0.065, 0.641) | 0.147 | 2.397 | 1.423 (1.066, 1.899) | 0.017 | ||
| 0.028 (0.004, 0.052) | 0.012 | 2.394 | 1.028 (1.005, 1.052) | 0.017 | ||
| Dongguan | −1.026 (−1.151, −0.901) | 0.064 | −16.094 | 0.359 (0.316, 0.406) | <0.001 | |
| −0.017 (−0.027, −0.007) | 0.005 | −3.667 | 0.983 (0.974, 0.992) | <0.001 | ||
| 0.364 (0.174, 0.554) | 0.097 | 3.750 | 1.439 (1.190, 1.741) | <0.001 | ||
| 0.026 (0.010, 0.042) | 0.008 | 3.322 | 1.026 (1.011, 1.042) | 0.001 | ||
| Guiyang | −0.386 (−0.596, −0.176) | 0.107 | −3.613 | 0.680 (0.551, 0.838) | <0.001 | |
| 0.018 (0.004, 0.032) | 0.007 | 2.530 | 1.018 (1.004, 1.033) | 0.011 | ||
| 0.258 (0.017, 0.499) | 0.123 | 2.103 | 1.294 (1.018, 1.646) | 0.035 | ||
| 0.031 (0.011, 0.051) | 0.010 | 3.115 | 1.031 (1.011, 1.051) | 0.002 | ||
| Changzhou | −0.294 (−0.482, −0.106) | 0.096 | −3.051 | 0.745 (0.617, 0.900) | 0.002 | |
| −0.003 (−0.017, 0.011) | 0.007 | −0.460 | 0.997 (0.984, 1.010) | 0.646 | ||
| 0.432 (0.177, 0.687) | 0.130 | 3.311 | 1.540 (1.193, 1.988) | 0.001 | ||
| 0.011 (−0.011, 0.033) | 0.011 | 1.056 | 1.011 (0.990, 1.033) | 0.291 | ||
| Harbin | −0.67 (−1.025, −0.315) | 0.181 | −3.699 | 0.512 (0.359, 0.730) | <0.001 | |
| 0.039 (0.015, 0.063) | 0.012 | 3.395 | 1.040 (1.017, 1.064) | 0.001 | ||
| 0.369 (0.014, 0.724) | 0.181 | 2.034 | 1.446 (1.014, 2.062) | 0.042 | ||
| −0.010 (−0.039, 0.019) | 0.015 | −0.628 | 0.990 (0.961, 1.021) | 0.530 | ||
| Foshan | −0.210 (−0.306, −0.114) | 0.049 | −4.267 | 0.811 (0.736, 0.893) | <0.001 | |
| −0.005 (−0.013, 0.003) | 0.004 | −1.500 | 0.995 (0.988, 1.022) | 0.134 | ||
| 0.408 (0.275, 0.541) | 0.068 | 6.039 | 1.504 (1.318, 1.717) | <0.001 | ||
| 0.020 (0.010, 0.030) | 0.005 | 3.725 | 1.020 (1.010, 1.031) | <0.001 | ||
| Urumqi | −0.150 (−0.434, 0.134) | 0.145 | −1.035 | 0.861 (0.649, 1.143) | 0.301 | |
| −0.050 (−0.074, −0.026) | 0.012 | −4.223 | 0.951 (0.929, 0.974) | <0.001 | ||
| 1.014 (0.553, 1.475) | 0.235 | 4.316 | 2.756 (1.739, 4.368) | <0.001 | ||
| 0.063 (0.028, 0.098) | 0.018 | 3.561 | 1.065 (1.029, 1.102) | <0.001 | ||
| Lanzhou | 0.585 (0.326, 0.844) | 0.132 | 4.417 | 1.795 (1.385, 2.327) | <0.001 | |
| −0.057 (−0.079, −0.035) | 0.011 | −5.164 | 0.945 (0.924, 0.965) | <0.001 | ||
| 1.152 (0.738, 1.566) | 0.211 | 5.463 | 3.164 (2.093, 4.783) | <0.001 | ||
| 0.099 (0.070, 0.128) | 0.015 | 6.387 | 1.104 (1.071, 1.138) | <0.001 | ||
| Taiyuan | −0.363 (−0.524, −0.202) | 0.082 | −4.410 | 0.696 (0.592, 0.817) | <0.001 | |
| −0.024 (−0.036, −0.012) | 0.006 | −3.859 | 0.976 (0.965, 0.988) | <0.001 | ||
| 0.442 (0.193, 0.691) | 0.127 | 3.483 | 1.556 (1.213, 1.995) | <0.001 | ||
| 0.038 (0.018, 0.058) | 0.010 | 3.769 | 1.039 (1.018, 1.059) | <0.001 | ||
| Huaian | −1.979 (−2.114, −1.844) | 0.069 | −28.517 | 0.138 (0.121, 0.158) | <0.001 | |
| −0.017 (−0.027, −0.007) | 0.005 | −3.283 | 0.983 (0.973, 0.993) | 0.001 | ||
| 0.246 (0.036, 0.456) | 0.107 | 2.299 | 1.279 (1.037, 1.577) | 0.022 | ||
| 0.037 (0.021, 0.053) | 0.008 | 4.443 | 1.038 (1.021, 1.055) | <0.001 | ||
| Tianshui | −3.510 (−3.728, −3.292) | 0.111 | −31.656 | 0.030 (0.024, 0.037) | <0.001 | |
| −0.036 (−0.054, −0.018) | 0.009 | −4.151 | 0.964 (0.948, 0.981) | <0.001 | ||
| 0.701 (0.354, 1.048) | 0.177 | 3.963 | 2.015 (1.425, 2.850) | <0.001 | ||
| 0.047 (0.020, 0.074) | 0.014 | 3.473 | 1.049 (1.021, 1.077) | 0.001 | ||
| Sanya | −2.391 (−2.612, −2.170) | 0.113 | −21.076 | 0.091 (0.073, 0.114) | <0.001 | |
| −0.031 (−0.049, −0.013) | 0.009 | −3.516 | 0.969 (0.953, 0.986) | <0.001 | ||
| 0.594 (0.245, 0.943) | 0.178 | 3.341 | 1.811 (1.278, 2.566) | 0.001 | ||
| 0.061 (0.036, 0.086) | 0.013 | 4.645 | 1.062 (1.036, 1.090) | <0.001 |
Disclaimer/Publisher’s Note: The statements, opinions and data contained in all publications are solely those of the individual author(s) and contributor(s) and not of MDPI and/or the editor(s). MDPI and/or the editor(s) disclaim responsibility for any injury to people or property resulting from any ideas, methods, instructions or products referred to in the content. |
© 2025 by the authors. Licensee MDPI, Basel, Switzerland. This article is an open access article distributed under the terms and conditions of the Creative Commons Attribution (CC BY) license (https://creativecommons.org/licenses/by/4.0/).
Share and Cite
Yang, M.; Zhu, Y.; Ji, X.; Fang, H.; Tong, S. Impact of the “Class B Infectious Disease Class B Management” Policy on the Passenger Volume of Urban Rail Transit: A Nationwide Interrupted Time Series Study. Sustainability 2025, 17, 2365. https://doi.org/10.3390/su17062365
Yang M, Zhu Y, Ji X, Fang H, Tong S. Impact of the “Class B Infectious Disease Class B Management” Policy on the Passenger Volume of Urban Rail Transit: A Nationwide Interrupted Time Series Study. Sustainability. 2025; 17(6):2365. https://doi.org/10.3390/su17062365
Chicago/Turabian StyleYang, Mengchen, Yusong Zhu, Xiang Ji, Huanhuan Fang, and Shuai Tong. 2025. "Impact of the “Class B Infectious Disease Class B Management” Policy on the Passenger Volume of Urban Rail Transit: A Nationwide Interrupted Time Series Study" Sustainability 17, no. 6: 2365. https://doi.org/10.3390/su17062365
APA StyleYang, M., Zhu, Y., Ji, X., Fang, H., & Tong, S. (2025). Impact of the “Class B Infectious Disease Class B Management” Policy on the Passenger Volume of Urban Rail Transit: A Nationwide Interrupted Time Series Study. Sustainability, 17(6), 2365. https://doi.org/10.3390/su17062365