
Evaluation of Life Cycle Cost of Excavation and Trenchless Cured-in-Place Pipeline Technologies for Sustainable Wastewater Applications


Abstract
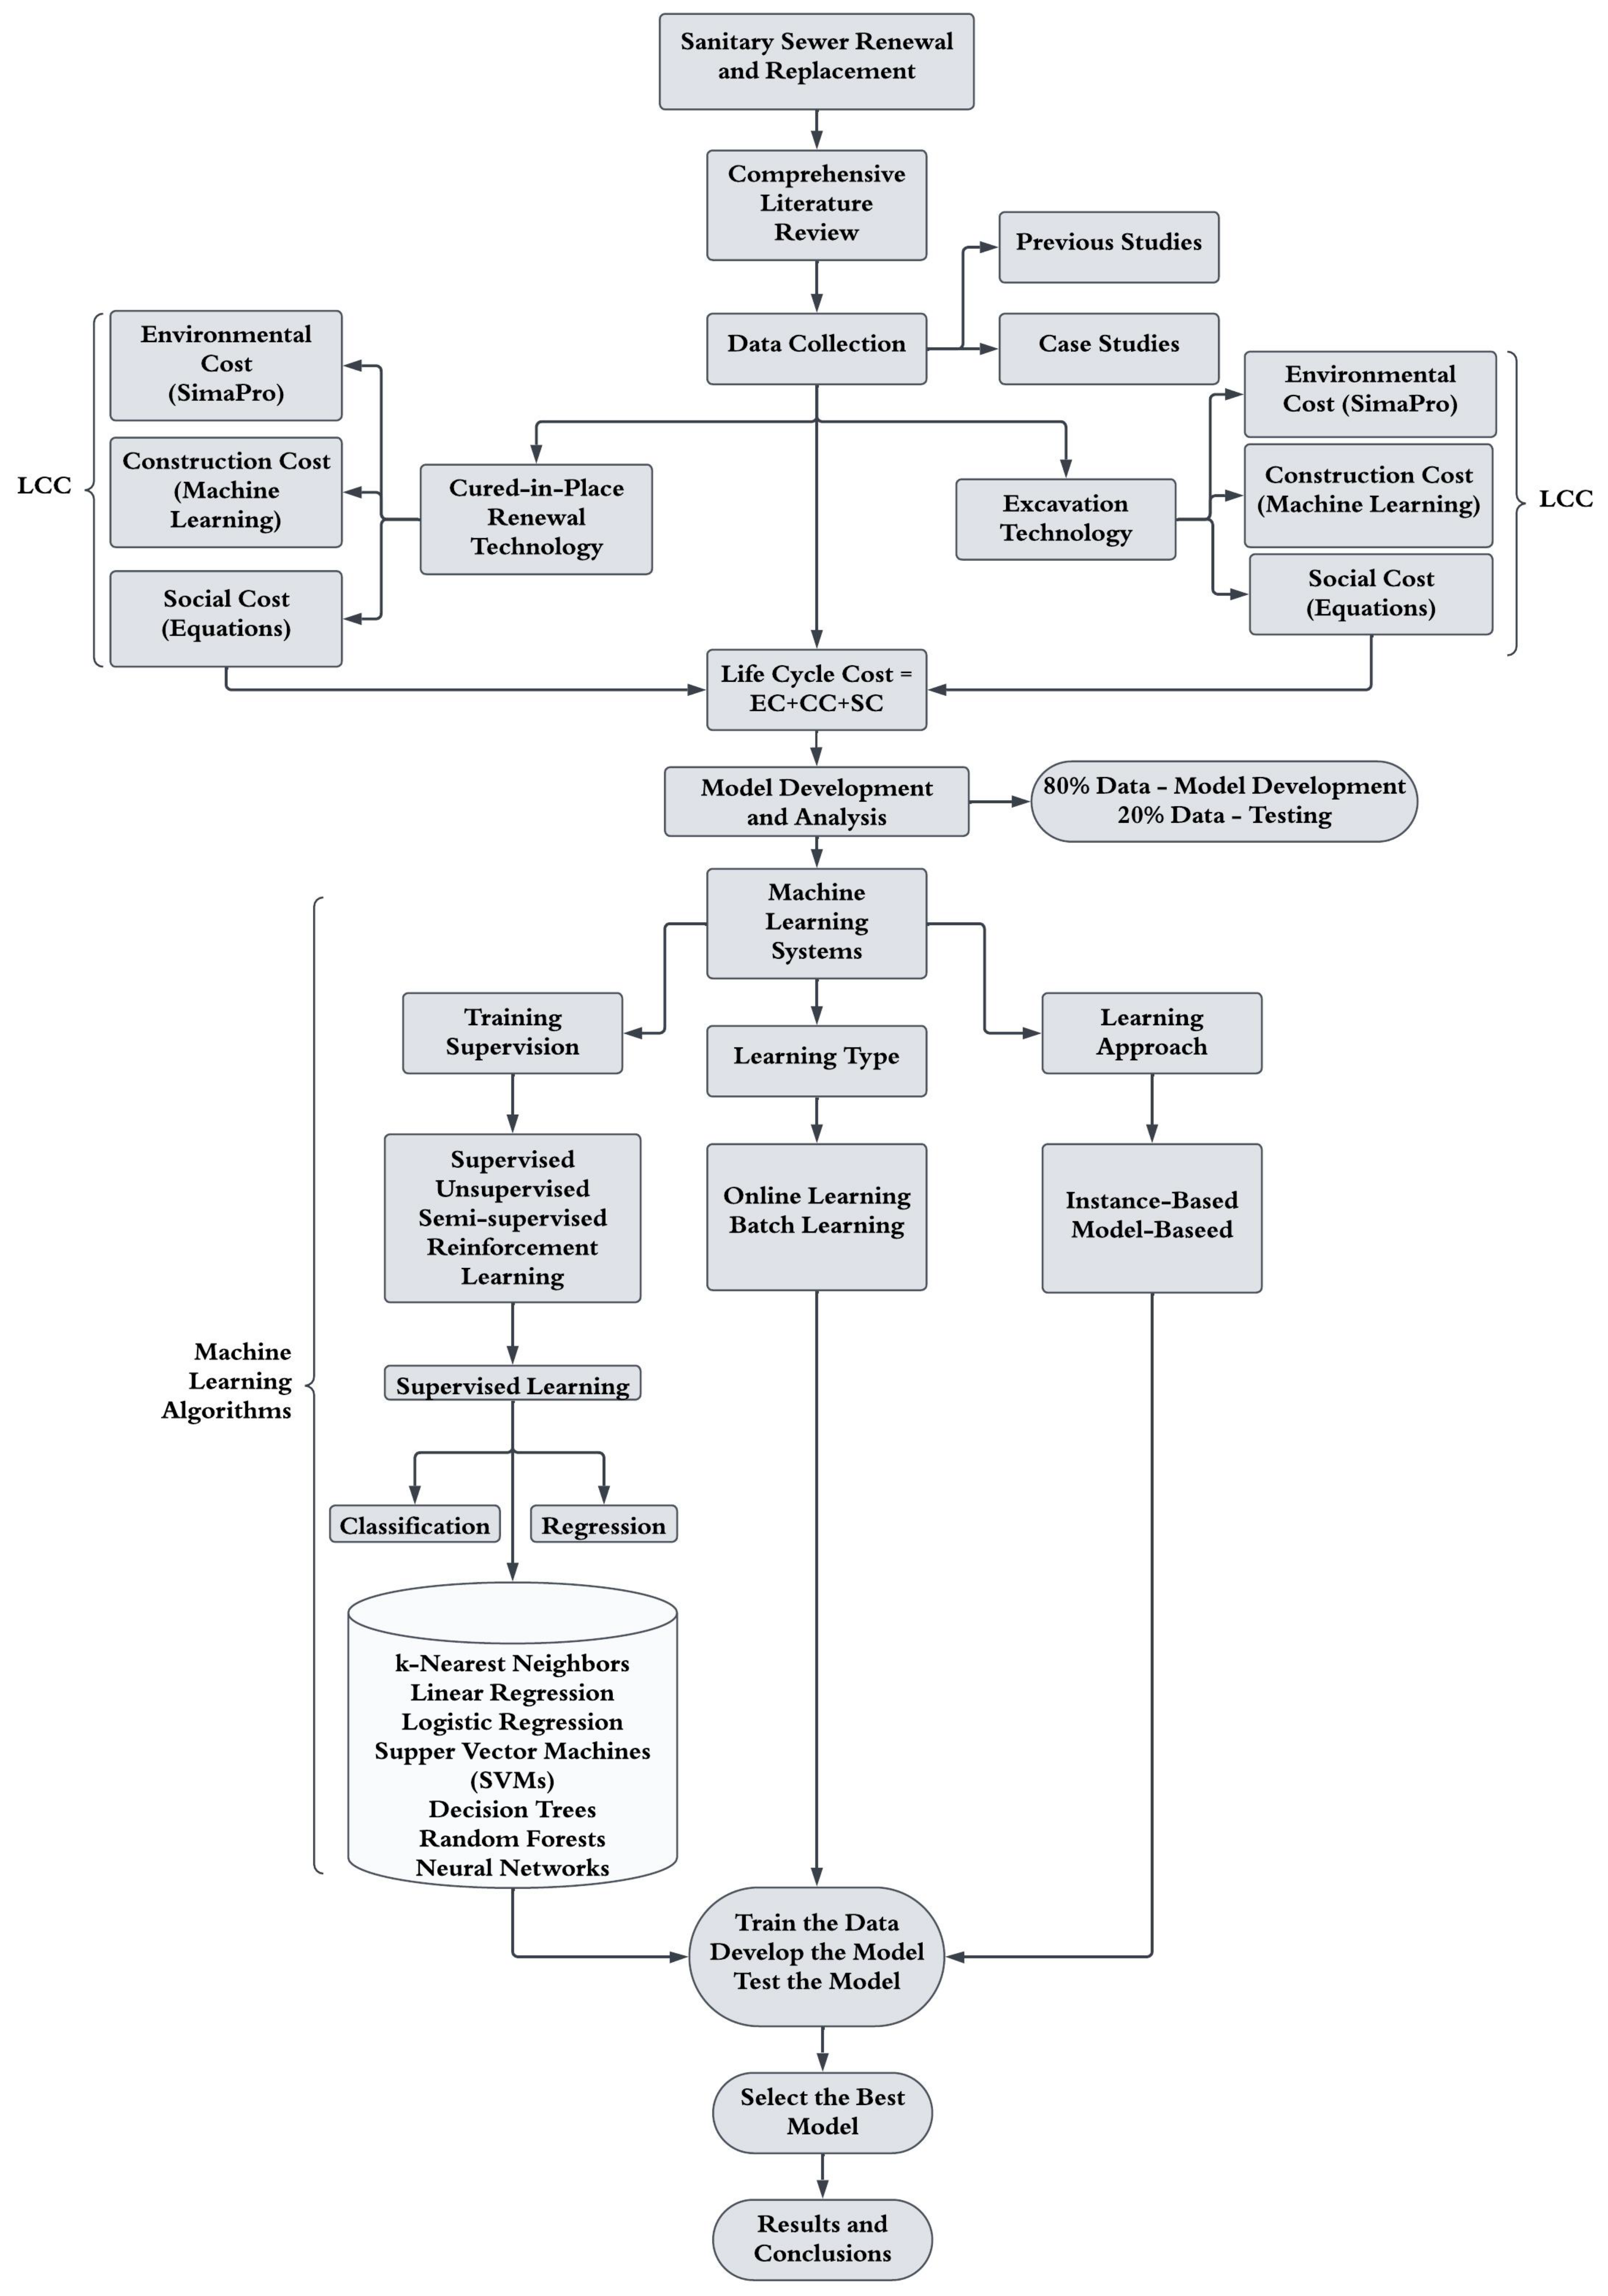
1. Introduction
1.1. Excavation Technology
1.2. Trenchless Technology
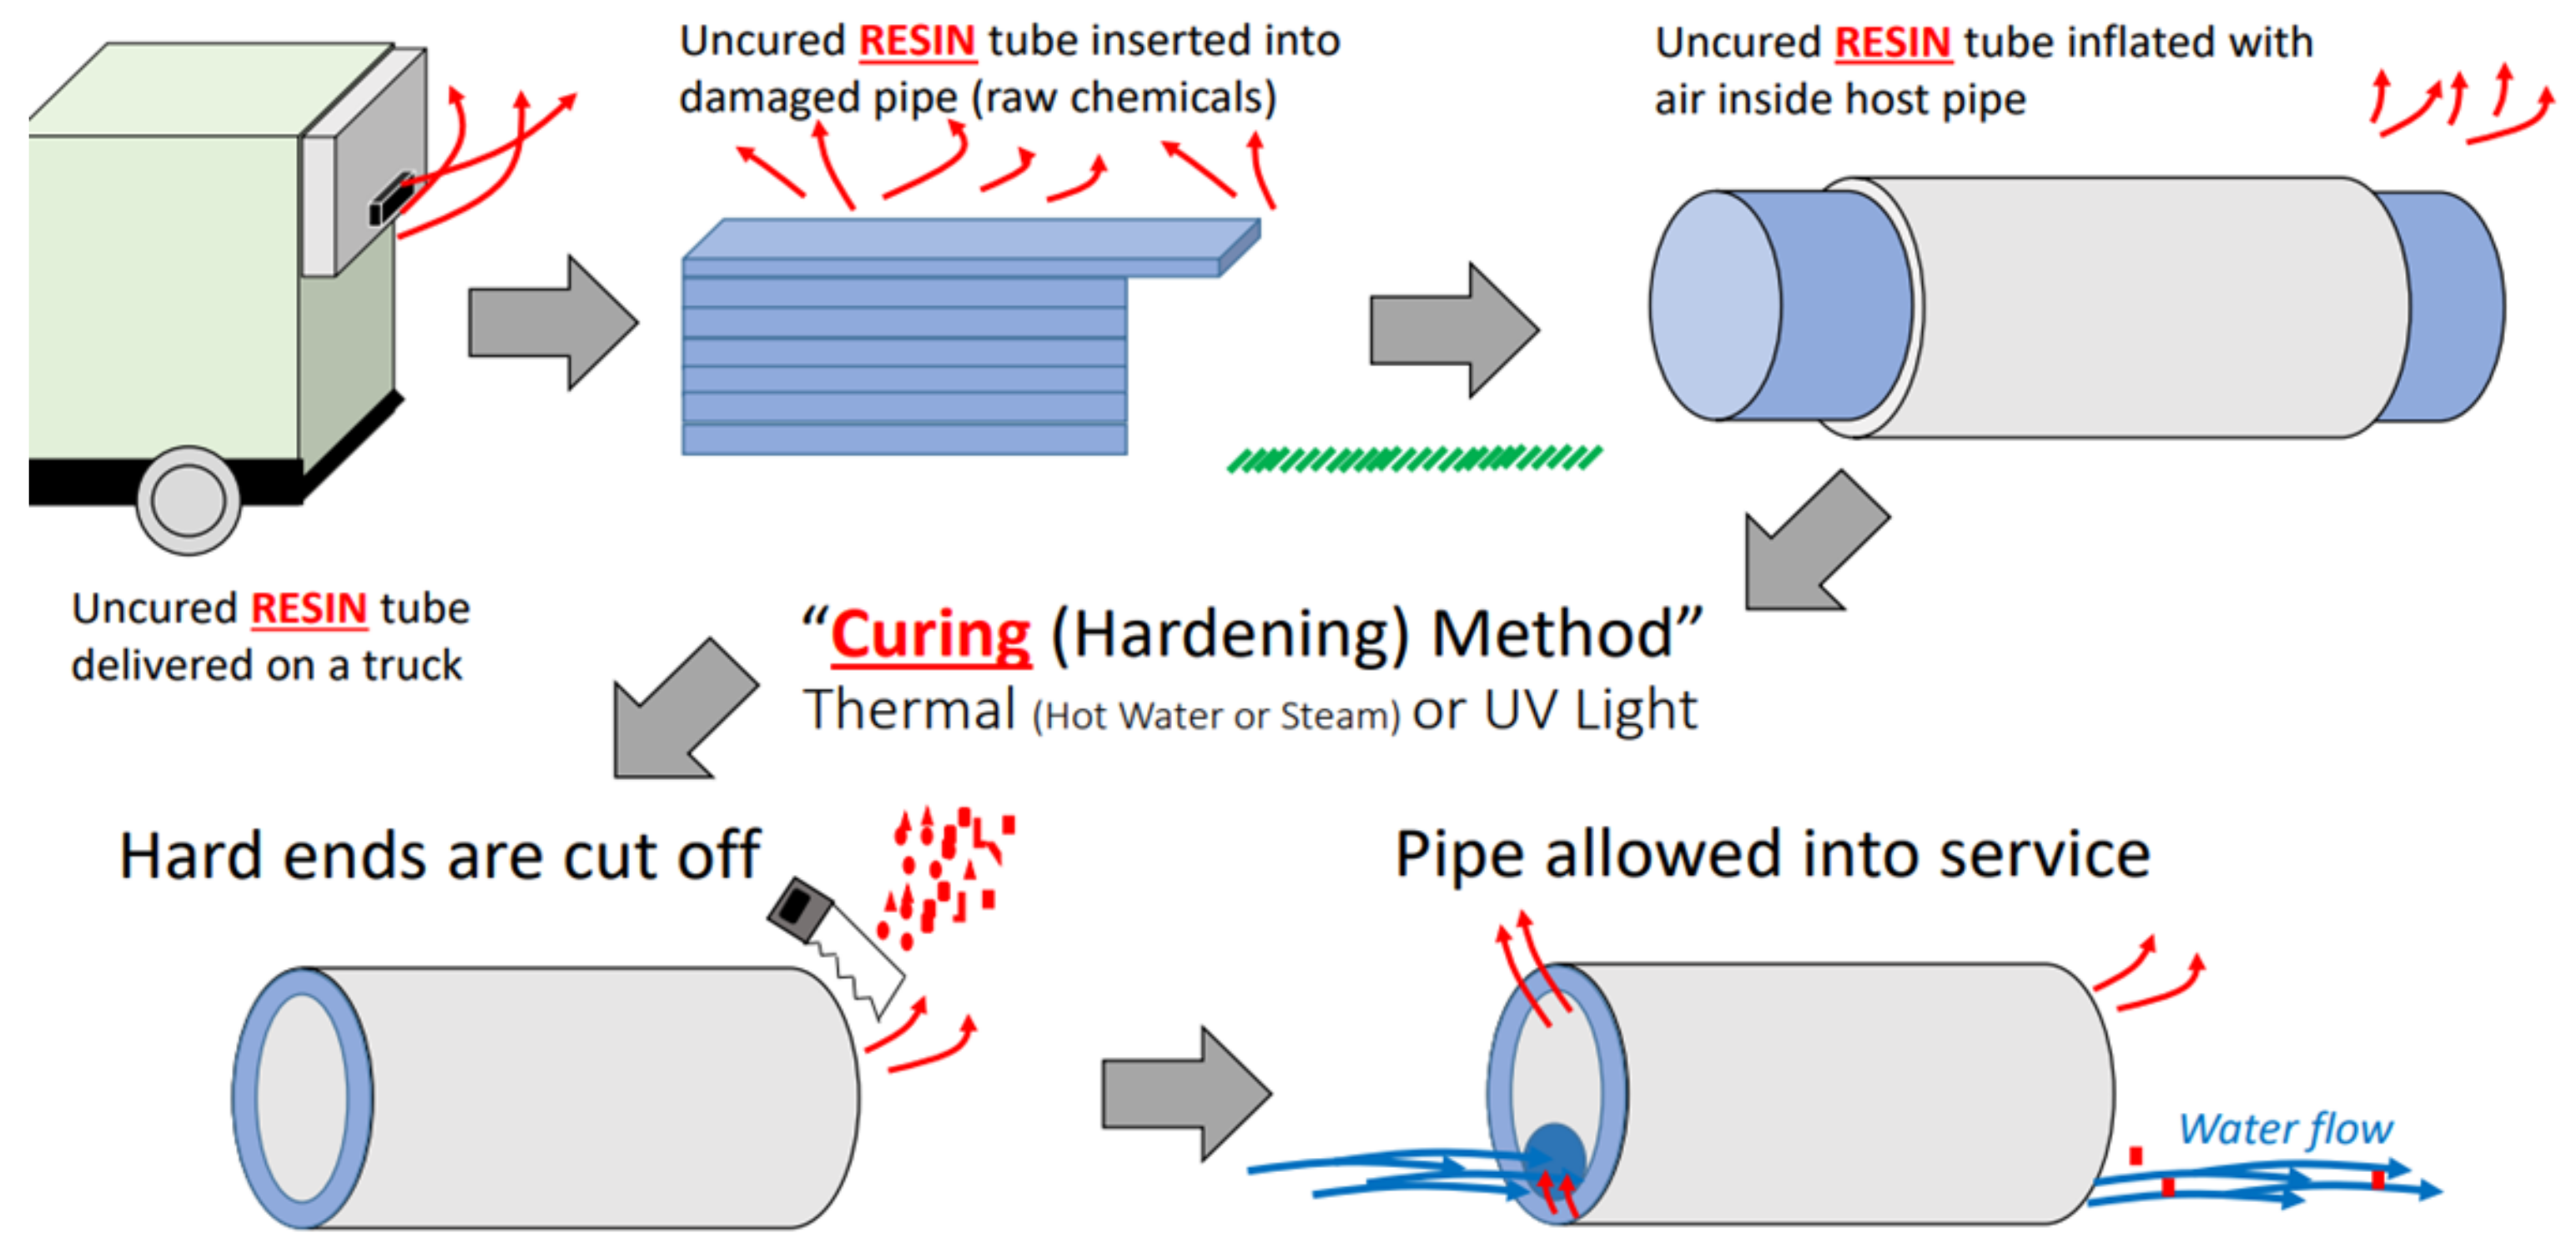
1.3. Cured-in-Place Pipe Technology
2. Literature Review
2.1. Construction-Cost-Related Studies
2.2. Environmental-Cost-Related Studies
2.3. Social-Cost-Related Studies
3. Results and Analysis
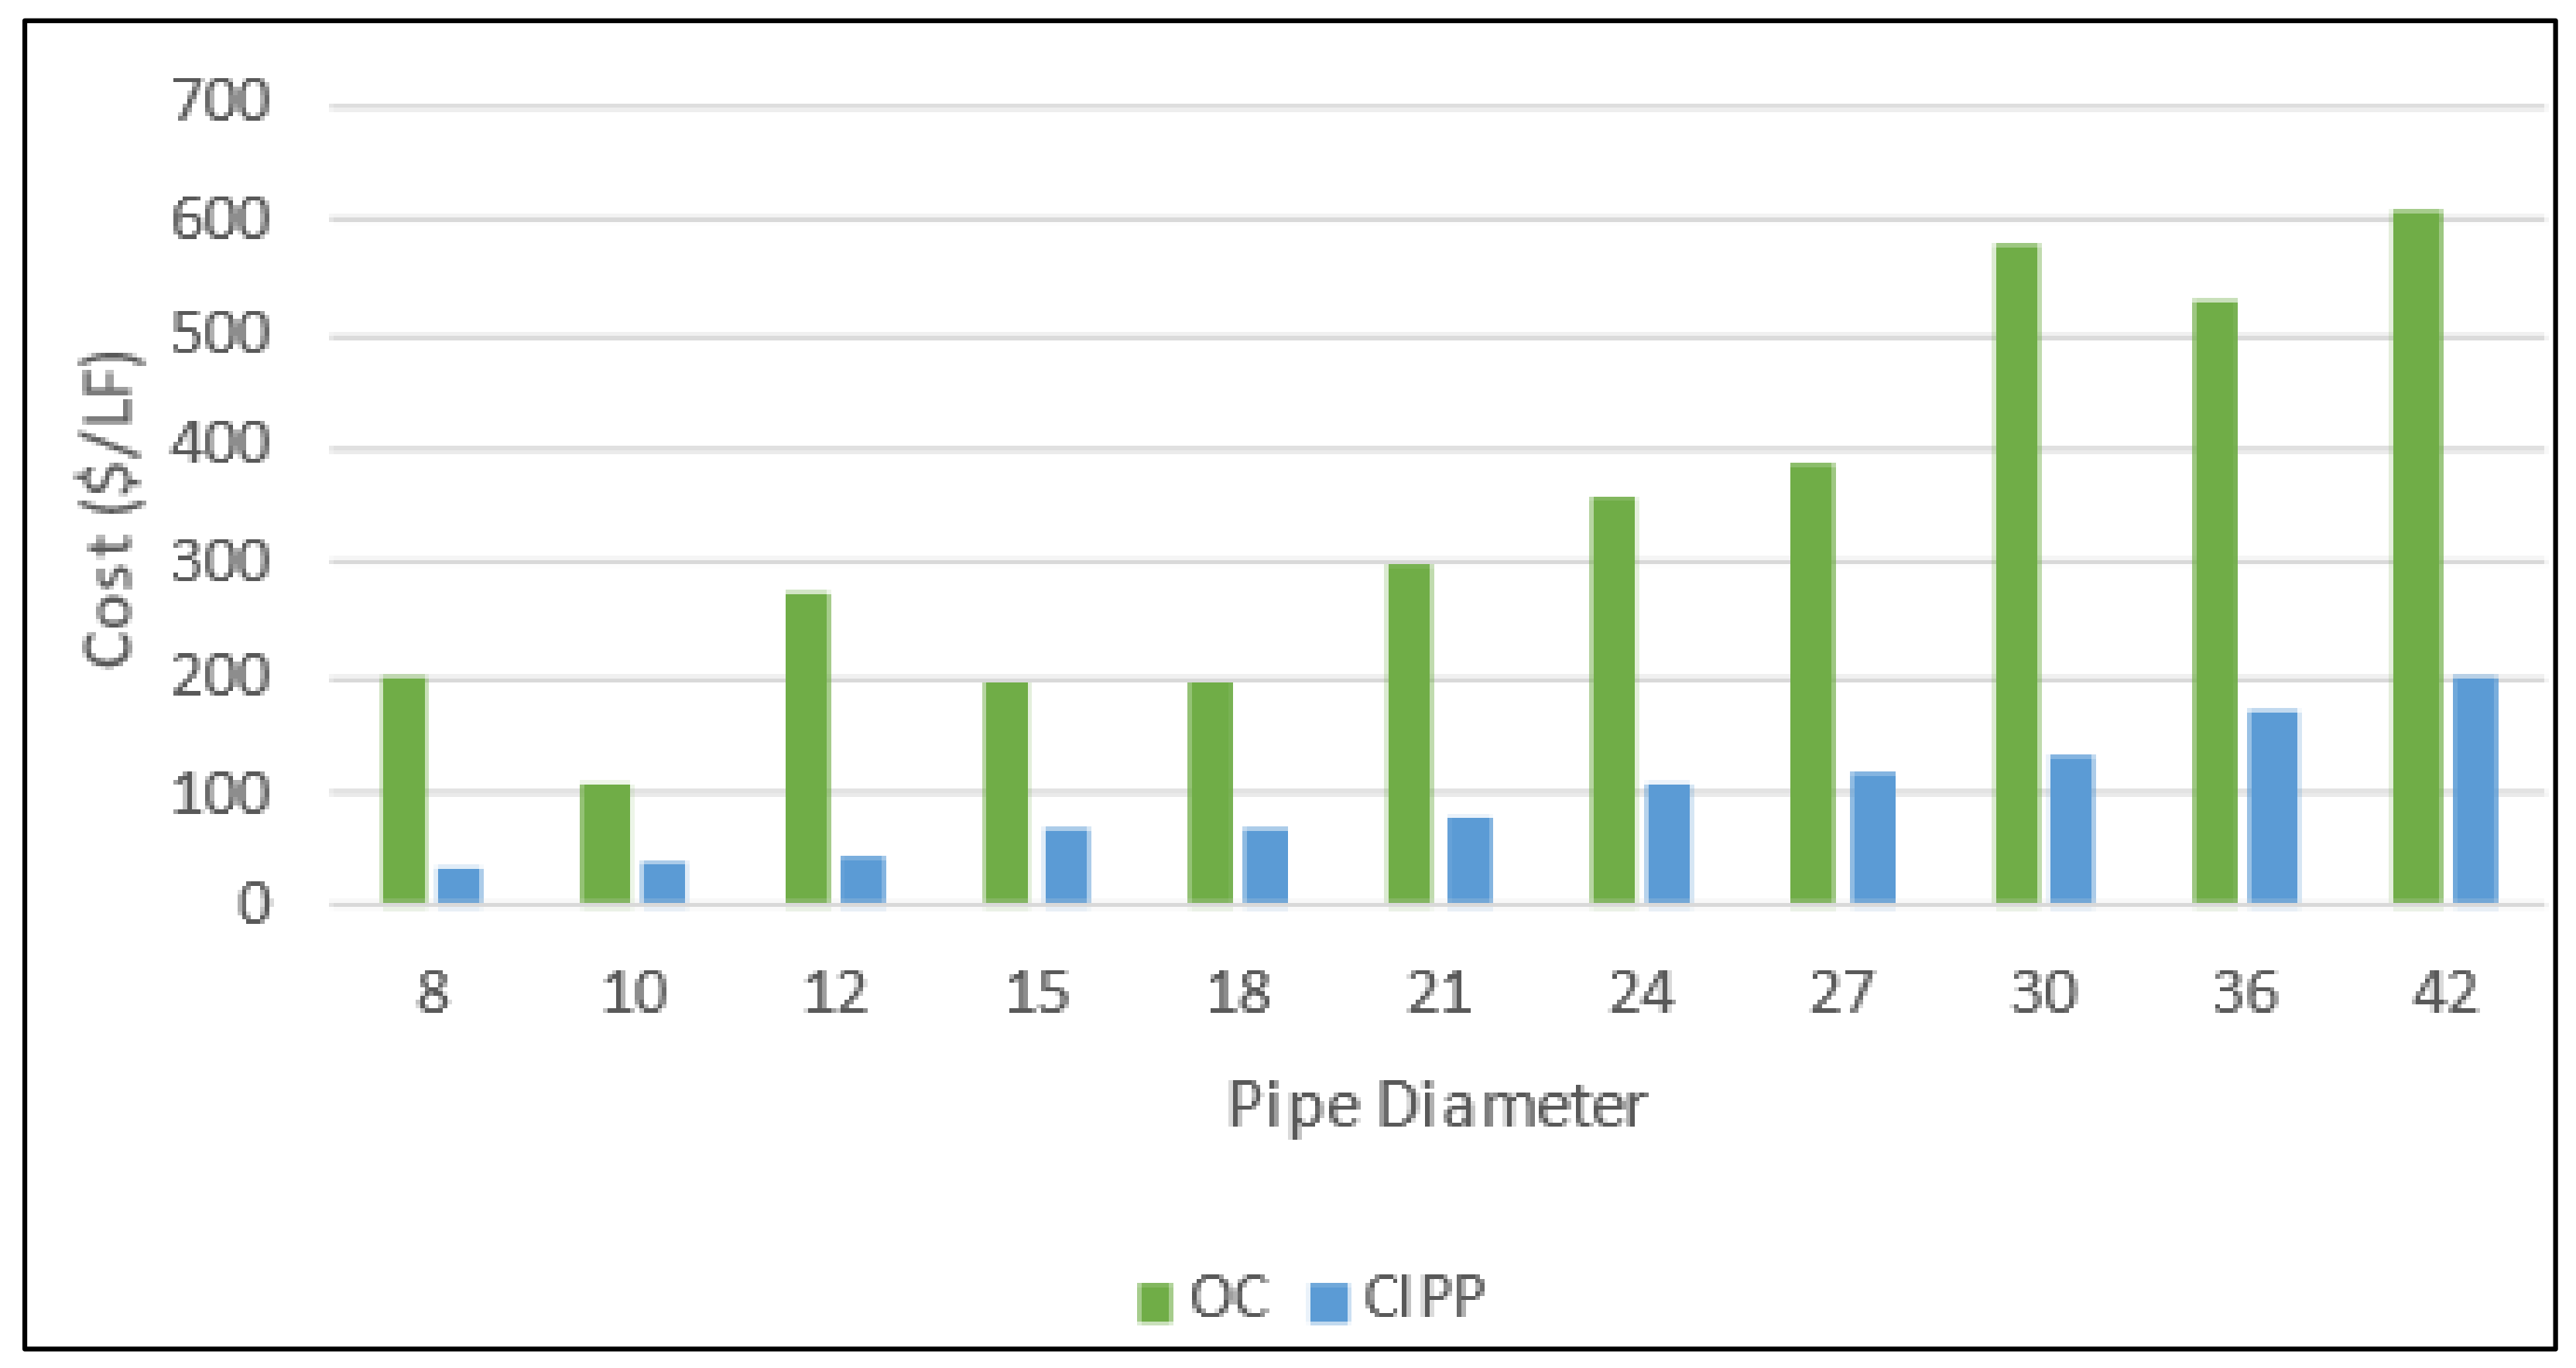
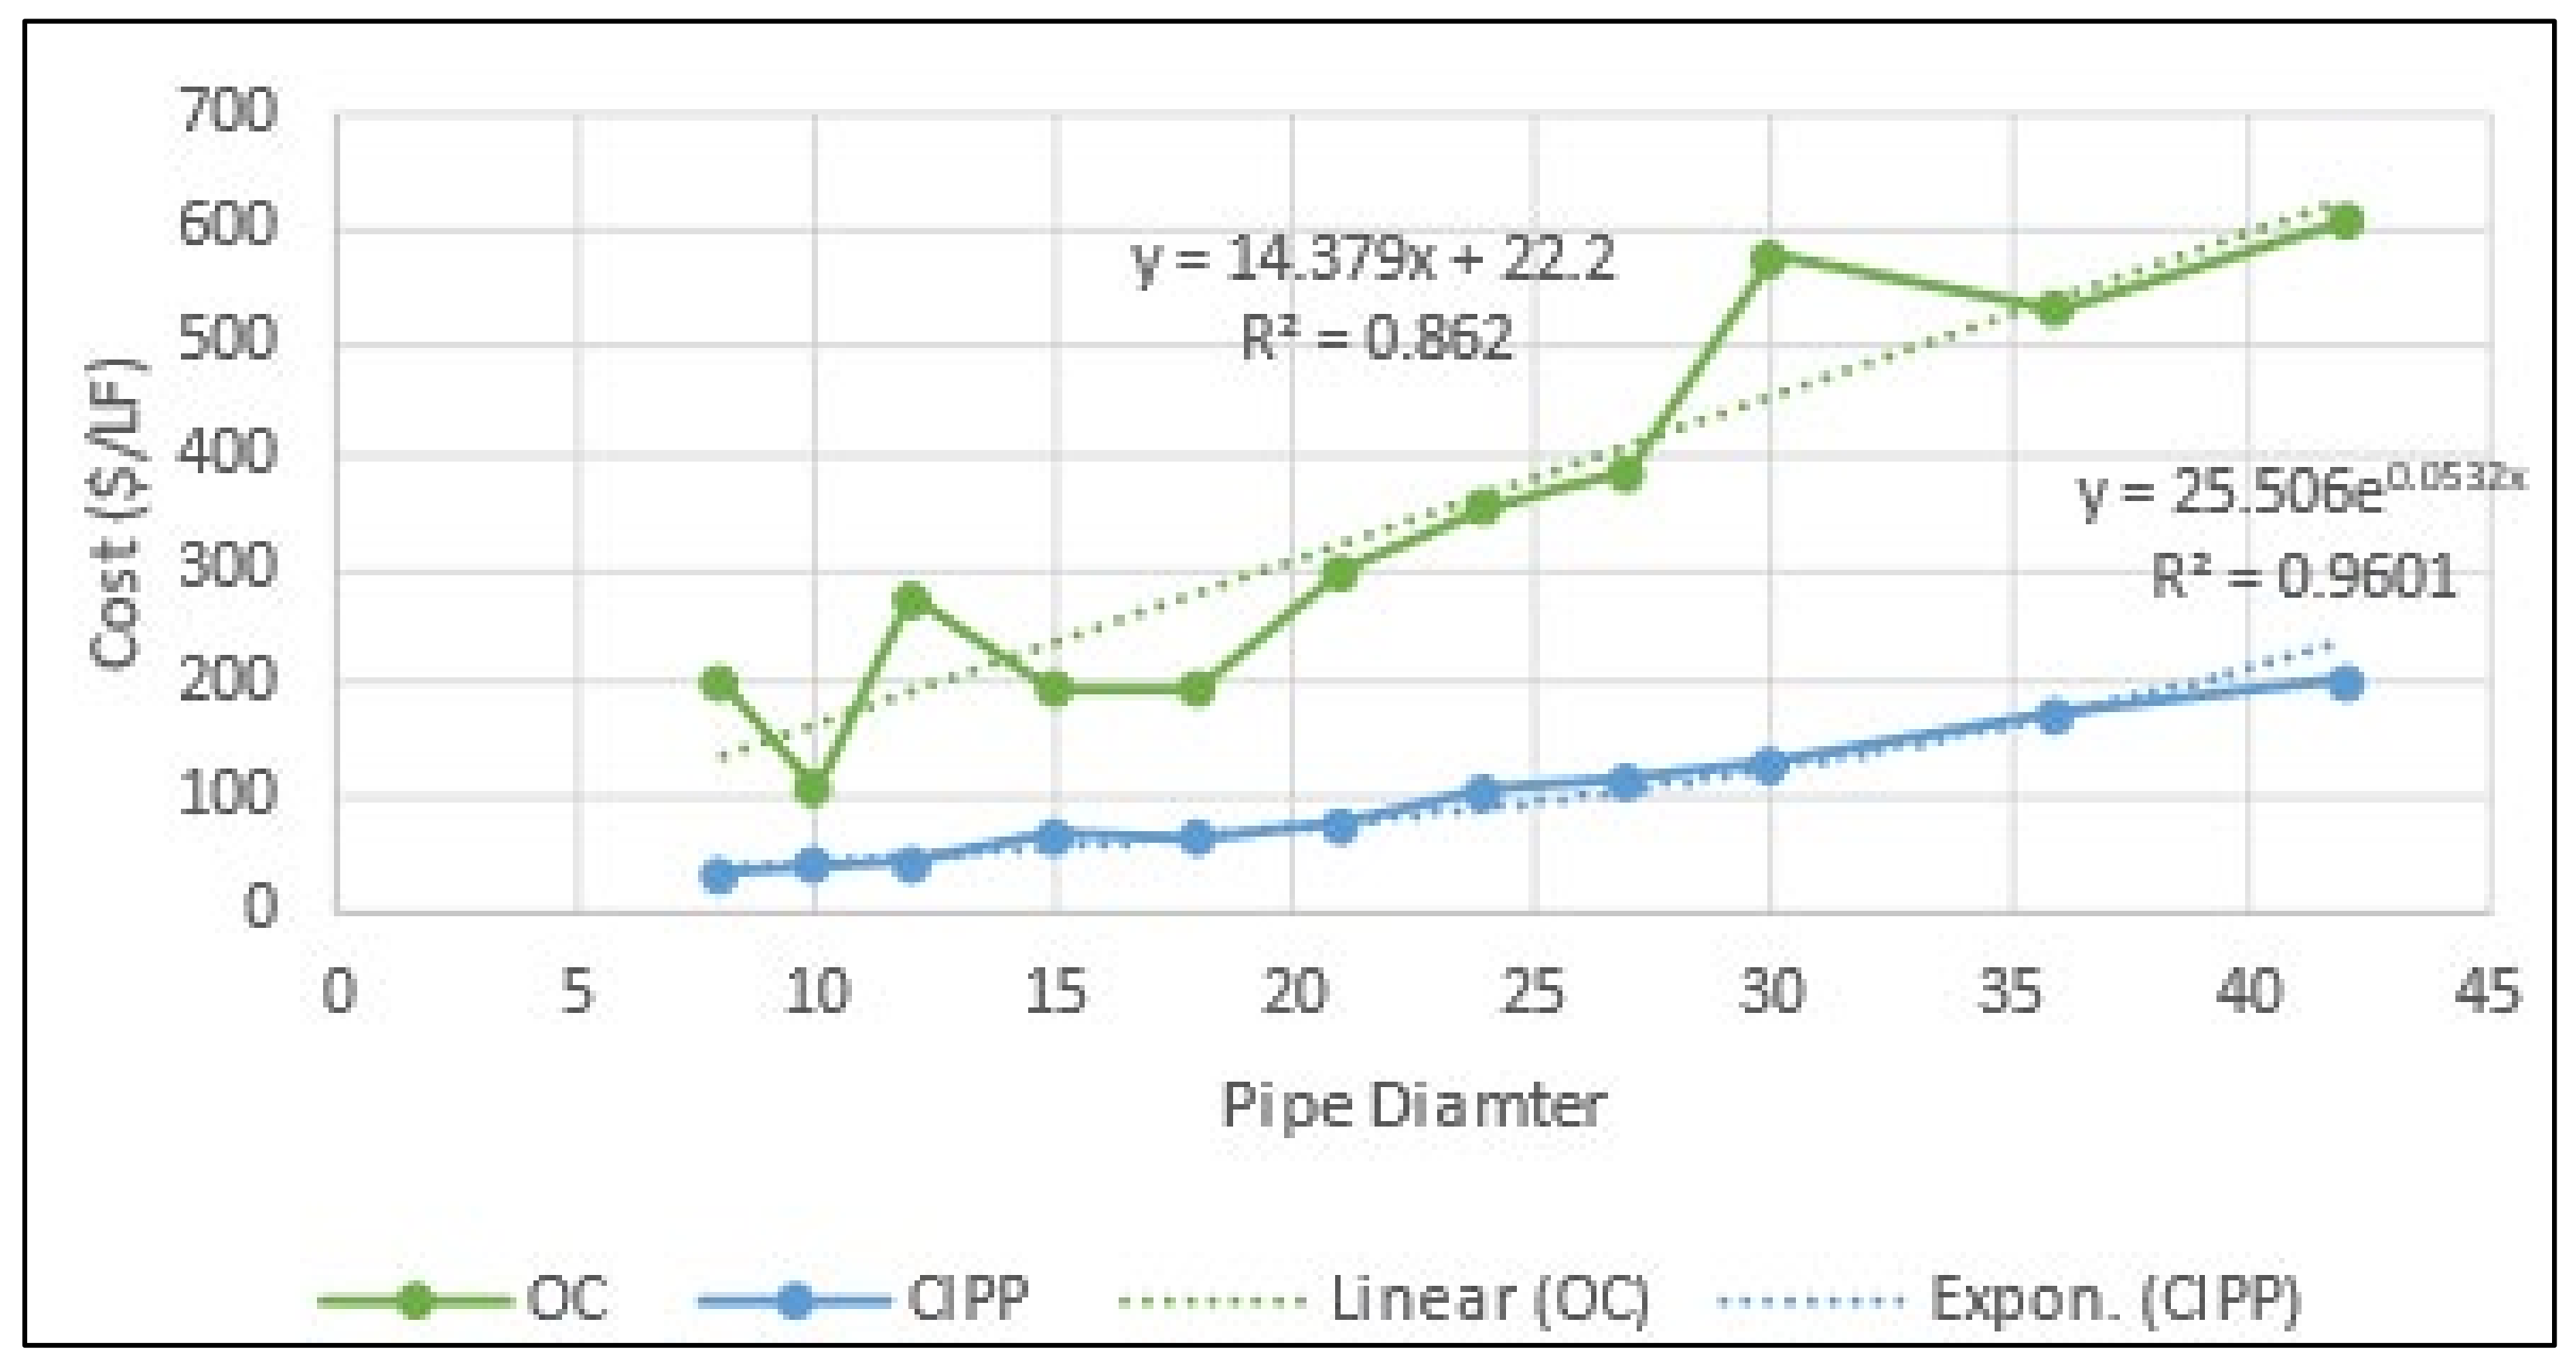
3.1. Construction Cost Analysis
3.2. Environmental Cost Analysis
3.3. Social Cost Analysis
- A.
- Duration of the Project. The duration of a project is a critical determinant of social costs, with extended timelines typically resulting in increased expenses due to
- 1.
- Extended lane closures causing prolonged traffic congestion.
- 2.
- Increased commuter delays and frustration.
- 3.
- Higher cumulative fuel consumption and emissions.
- 4.
- Short-duration projects generally having lower social costs, while longer projects can lead to substantial increases in traffic disruption expenses.
- B.
- Cost of Fuel. Open-cut installation often necessitates lane closures, resulting in traffic congestion and increased fuel consumption. The duration of traffic delays directly correlates with the amount of fuel wasted, which in turn affects the overall fuel cost. To estimate this cost, the calculation considers the amount of fuel consumed by vehicles idling in traffic or using alternate routes. By applying the average fuel consumption rate of a standard vehicle, the total fuel wasted during traffic disruptions is determined. The costs associated with fuel consumption for detour routes or delays per vehicle are calculated using Equation (2).
- C.
- Travel Time Cost. The value of time related to travel varies significantly based on a complex interplay of factors, including the nature of the trip, travel distance, individual traveler characteristics, and prevailing travel conditions. Business trips and longer journeys often carry higher time values compared to personal or local travel. Individual factors, such as income level and personal preferences for leisure time, also influence how travelers value their time. The travel environment plays a crucial role, with comfortable conditions potentially reducing the perceived time costs, while congestion and discomfort tend to increase them. The mode of transport, trip duration, and time of day further contribute to this variability. Notably, passengers typically assign higher per-minute costs to their travel time when faced with uncomfortable or congested conditions, reflecting the increased stress and inconvenience associated with such situations. The cost of detour delays can be determined using Equation (3).
- D.
- Road Damage. Utility construction projects can result in two distinct forms of road damage. The first is direct pavement damage caused by utility cuts, trenching operations, and inadequate patching procedures, which manifests as potholes, increased surface roughness, and cracks in the road surface. This damage is a direct consequence of the construction work itself. The next form is indirect damage to detour roads resulting from the increased volume of traffic, especially heavy vehicles, which are diverted during the construction period. This additional stress on alternative routes can lead to accelerated wear and tear, causing premature deterioration of roads not originally designed to handle such high traffic loads. Both types of damage contribute significantly to the overall social and economic costs associated with utility construction projects, underscoring the importance of comprehensive planning and effective mitigation strategies. To estimate the cost of pavement restoration, Equation (4) can be used:
- E.
- Loss of Sales Tax. Utility construction projects can have significant financial repercussions for nearby businesses and shops, primarily due to reduced customer traffic. As people tend to avoid areas with lane closures and construction-related disruptions, the affected businesses experience a decline in patronage. This reduction in customer visits directly translates to decreased income for these establishments. Consequently, the lower revenue generated by these businesses leads to a decrease in tax revenue for the local government. Equation (5) can be used in calculating the loss of sales tax:
- F.
- Loss of Productivity. Noise pollution from construction activities can significantly impact productivity, though its effects are challenging to quantify precisely. Individual responses to noise vary considerably, with some people experiencing minor productivity decreases, while others find it intolerable. Research indicates that noise levels above 60 dB can hinder complex task performance, and exposure to high noise levels (110 dB) notably reduces overall performance and increases error rates. The impact of noise on productivity depends on factors such as sound intensity, duration of exposure, and the nature of the work being performed, making it a complex issue in workplace environments. The loss of productivity is provided by Equation (6).
- G.
- Dust. One method for quantifying the expense associated with dust is to evaluate the incremental cleaning time required. This approach considers the additional labor hours needed to address dust accumulation, which can be translated into monetary costs. By measuring the extra time spent on cleaning activities, such as dusting, sweeping, or operating specialized dust control equipment, organizations can estimate the financial impact of dust on their operations. This calculation may include factors such as employee wages, cleaning supply costs, and potential productivity losses due to more frequent cleaning interventions. Equation (7) can be used to calculate the dust and dirt control cost:
- H.
- Cost of Fuel. OCCM often necessitates lane closures, resulting in traffic congestion and increased fuel consumption. The duration of traffic delays directly correlates with the amount of fuel wasted, which in turn affects the overall fuel cost. To estimate this cost, calculations are based on the quantity of fuel consumed by vehicles idling in traffic or traversing alternate routes. The computation utilizes the average fuel consumption rate of a typical car to determine the total fuel wasted during these traffic disruptions. The costs of fuel for detour roads or delay per vehicle are calculated according to Equation (8).
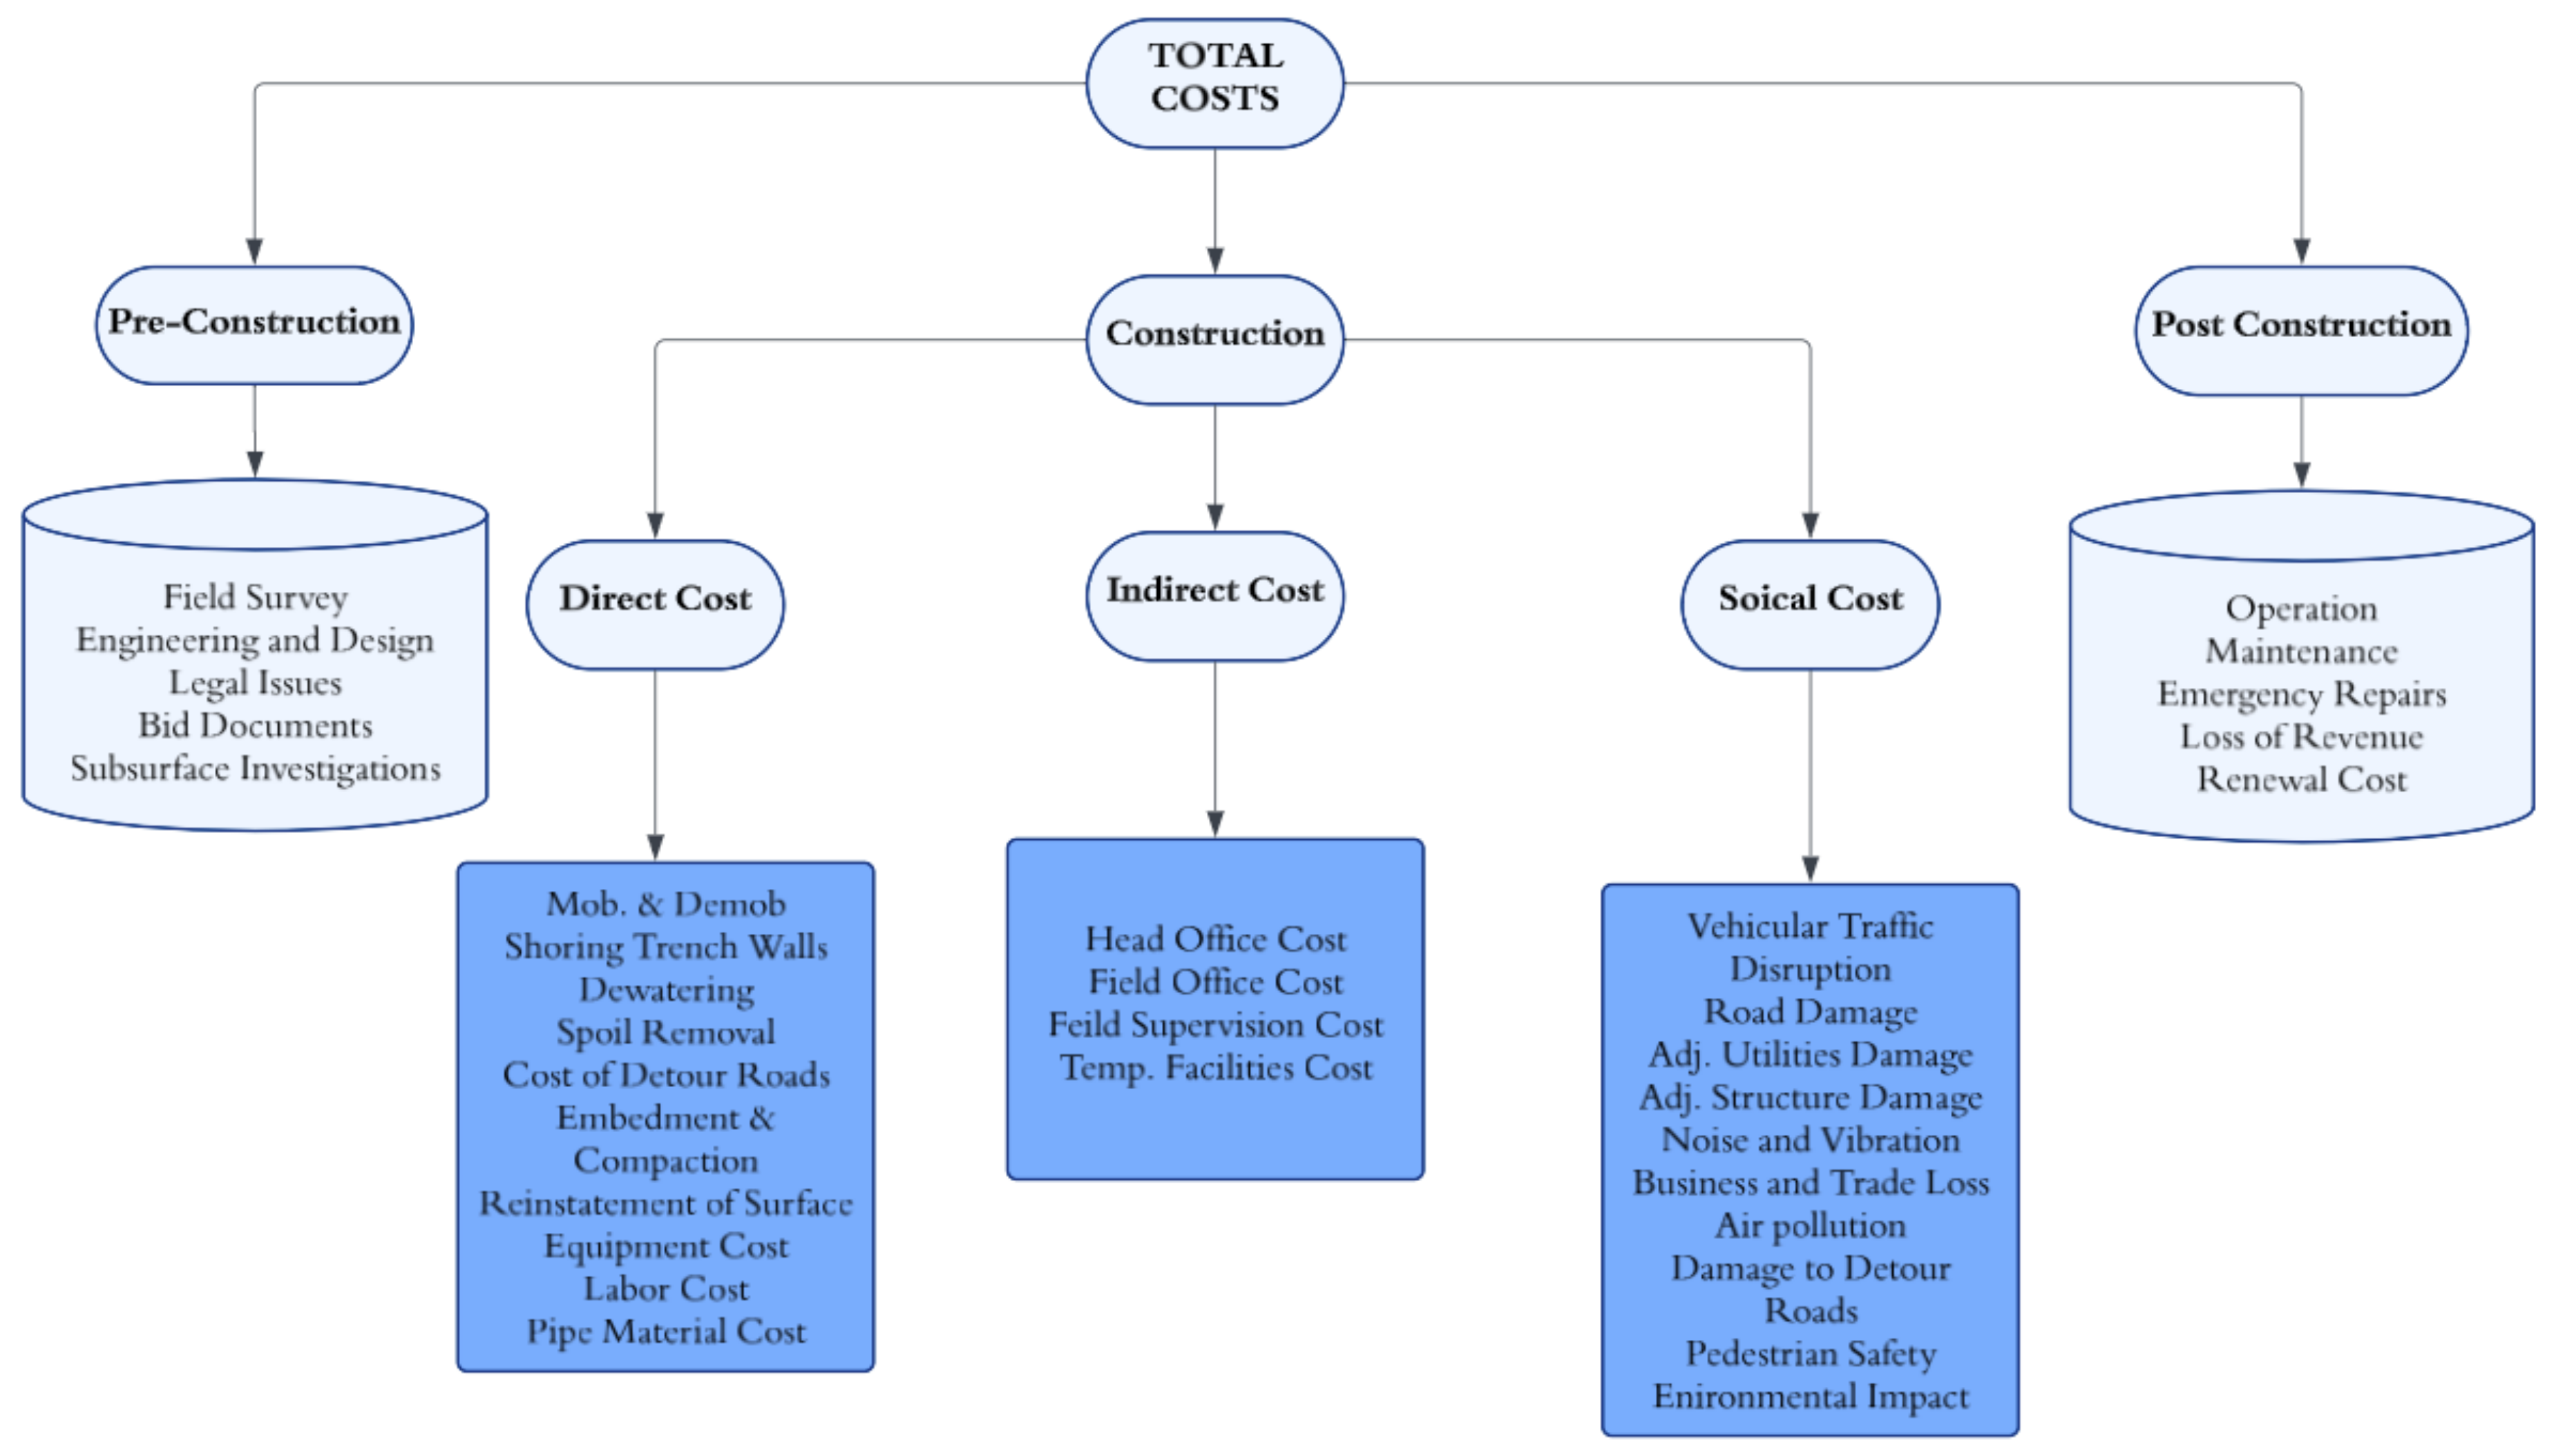
3.4. Life Cycle Cost Analysis Framework
- Preconstruction cost: Land acquisitions, design fees, planning, and legal costs;
- Construction cost: Direct cost, indirect cost, and social cost;
- Post-construction: Cost operation and maintenance.
4. Evaluation, Conclusions, and Recommendations
5. Contributions to the Body of Knowledge
6. Research Gaps
Author Contributions
Funding
Institutional Review Board Statement
Informed Consent Statement
Data Availability Statement
Conflicts of Interest
Abbreviations
| Kg | Kilogram |
| CO2 | Carbon Dioxide |
| LCCA | Life Cycle Cost Analysis |
| CIPPT | Cured-in-Place Pipe Technology |
| ET | Excavation Technologies |
| TT | Trenchless Technology |
| TRACI | Tool for Reduction and Assessment of Chemicals and Other Environmental Impacts |
| EPA | Environmental Protection Agency |
| ASCE | American Society of Civil Engineers |
| VOC | Volatile Organic Compounds |
| EIA | Environmental Impact Assessment |
| NPV | Net Present Value |
| AADT | Average Annual Daily Traffic |
| USD | United States Dollar |
| m2 | Square Meter |
| ft | Foot |
References
- EPA. Collection Systems O&M Fact Sheet. In Trenchless Sewer Rehabilitation; United States Environmental Protection Agency: Washington, DC, USA, 1999. [Google Scholar]
- Chapman, D.N.; Rogers, C.D.F.; Burd, H.J.; Norris, P.M.; Milligan, G.W.E. Research Needs for New Construction Using Trenchless Technologies. Tunn. Undergr. Space Technol. 2007, 22, 491–502. [Google Scholar] [CrossRef]
- Carlisle, M. The Feasibility of Slip-Lining. 2015. Available online: https://www2.latech.edu/~bmagee/writing_contest/2015-2016/303-02-long_report_2016.pdf (accessed on 23 January 2025).
- 2021 Infrastructure Report Card. Available online: www.infrastructurereportcard.org (accessed on 23 January 2025).
- Clean Watersheds Needs Survey 2012 Report to Congress. 2012. Available online: https://www.epa.gov/sites/default/files/2015-12/documents/cwns_2012_report_to_congress-508-opt.pdf (accessed on 23 January 2025).
- Kramer, S.R.; Gary, G.A. Comparison of Trenchless vs. Open-Cut Construction Methods for the Replacement of a Leaking Water Distribution System. In Environmental and Pipeline Engineering 2000; American Society-Civil Engineers: Reston, VA, USA, 2012; pp. 289–298. [Google Scholar] [CrossRef]
- Kramer, S. Advantages and Disadvantages of Trenchless Construction Approach as Compared to the Traditional Open Cut Installation of Underground Utility Systems. In Proceedings of the Creative Construction Conference 2018, Ljubljana, Slovenia, 30 June–3 July 2018; pp. 129–138. [Google Scholar]
- Najafi, M.; Gokhale, S.B. Trenchless Technology: Pipeline and Utility Design, Construction, and Renewal; McGraw-Hill: New York, NY, USA, 2021; ISBN 978-0-07-142266-6. [Google Scholar]
- Lee, H.; Matthys, J. Cost Comparison of Pipeline Asset Replacement: Open-Cut and Pipe-Bursting. In Proceedings of the Pipelines 2007, American Society of Civil Engineers, Boston, MA, USA, 6 July 2007; pp. 1–11. [Google Scholar]
- Kaushal, V. Comparison of Environmental and Social Costs of Trenchless Cured-in-Place Pipe Renewal Method with Open-Cut Pipeline Replacement for Sanitary Sewers; The University of Texas at Arlington: Arlington, TX, USA, 2019. [Google Scholar]
- Monfared, M.A.N. Comparison of Trenchless Technologies and Open Cut Methods in New Residential Land Development. 2018. Available online: https://era.library.ualberta.ca/items/02ee2380-c42a-4d96-b4b4-0a4076050a7c (accessed on 23 January 2025).
- Ajdari, E.B. Volatile Organic Compound (VOC) Emission during Cured-in-Place-Pipe (CIPP) Sewer Pipe Rehabilitation; University of New Orleans: New Orleans, LA, USA, 2016. [Google Scholar]
- Loss, A.; Toniolo, S.; Mazzi, A.; Manzardo, A.; Scipioni, A. LCA Comparison of Traditional Open Cut and Pipe Bursting Systems for Relining Water Pipelines. Resour. Conserv. Recycl. 2016, 128, 458–469. [Google Scholar] [CrossRef]
- Hashemi, S.B. Construction Cost of Underground Infrastructure Renewal: A Comparison of Traditional Open-Cut and Pipe Bursting Technology; The University of Texas at Arlington: Arlington, TX, USA, 2008. [Google Scholar]
- Kim, K. Cost Analysis for Renewal of Sewer System in the City of Grand Rapids, Michigan; Michigan State University: East Lansing, MI, USA, 2005. [Google Scholar]
- Kim, G.-H.; An, S.-H.; Kang, K.-I. Comparison of Construction Cost Estimating Models Based on Regression Analysis, Neural Networks, and Case-Based Reasoning. Build. Environ. 2004, 39, 1235–1242. [Google Scholar] [CrossRef]
- Zhao, J.Q.; Rajani, B.B. Construction and Rehabilitation Costs for Buried Pipe with a Focus on Trenchless Technologies; National Research Council of Canada: Ottawa, ON, Canada, 2002; Volume RR-101. [Google Scholar]
- Jafari, M.R.; Cotter, W.J. A Quantitative Comparison between Trenchless Technology and Open-Cut Method. In Proceedings of the NASTT’s No-Dig Show and ISTT’s 35th International No-Dig, Washington, DC, USA, 9–13 April 2017; International Society for Trenchless Technology: 201 Waterfront Street, National Harbor, MD, USA, 2017. [Google Scholar]
- Das, S. Evaluation of Cured-in-Place Pipe Lining Installations. 2016. Available online: https://era.library.ualberta.ca/items/b02cf9f8-581b-4df1-9d69-2134bff44ebe/view/36b285e3-64bc-4e4a-9657-91cc90058e48/Das_Susen_201601_MSc.pdf.pdf (accessed on 23 January 2025).
- Hashemi, B.; Iseley, T.; Raulston, J. Water Pipeline Renewal Evaluation Using AWWA Class IV CIPP, Pipe Bursting, and Open-Cut. In Proceedings of the ICPTT 2011, Beijing, China, 7 October 2011; pp. 1257–1266. [Google Scholar]
- Matthews, J.C.; Selvakumar, A.; Condit, W. Demonstration and Evaluation of an Innovative Water Main Rehabilitation Technology: Cured-in-Place Pipe (CIPP) Lining. Water Pract. Technol. 2012, 7, wpt2012028. [Google Scholar] [CrossRef]
- Youssef, S.; Nachabe, M. Rehabilitation Technologies to Abate Infiltration in Sanitary Sewers. J. Environ. Eng. 2023, 149, 04023025. [Google Scholar] [CrossRef]
- Yon, Z. Application of Cured-in-Place Pipe in Repair of Urban Sewer. China Water Wastewater 2014, 30, 106–108. [Google Scholar]
- Xin, J. Application of Trenchless Pipeline Rehabilitation Technology. In Proceedings of the ICPTT 2014, Xiamen, China, 13–15 November 2014; pp. 473–477. [Google Scholar]
- Alsadi, A. Evaluation of Carbon Footprint During the Life-Cycle of Four Different Pipe Materials; Louisiana Tech University: Ruston, LA, USA, 2019. [Google Scholar]
- Mitchell, C. Investigation into the Process of Cured-in-Place Pipe Sewer Rehabilitation. Plymouth Stud. Sci. 2020, 13, 290–327. [Google Scholar]
- Jin, Y. Evaluating Infrastructure Performance to Assist Facility Management Toward Sustainable Systems. Ph.D. Thesis, Michigan Technological University, Houghton, MI, USA, 2013. [Google Scholar]
- Alam, S.; Sterling, R.L.; Allouche, E.; Condit, W.; Matthews, J.; Selvakumar, A.; Simicevic, J. A Retrospective Evaluation of the Performance of Liner Systems Used to Rehabilitate Municipal Gravity Sewers. Tunn. Undergr. Space Technol. 2015, 50, 451–464. [Google Scholar] [CrossRef]
- Donaldson, B.M. Environmental Implications of Cured-in-Place Pipe Rehabilitation Technology. Transp. Res. Rec. J. Transp. Res. Board 2009, 2123, 172–179. [Google Scholar] [CrossRef]
- Murray, D.J., Jr. EPA Aging Water Infrastructure Research Program: State of the Technology for the Condition Assessment and Rehabilitation of Wastewater Collection Systems. In Proceedings of the World Environmental and Water Resources Congress 2009, Kansas City, MO, USA, 12 May 2009; pp. 1–7. [Google Scholar]
- Sterling, R.; Simicevic, J.; Allouche, E.; Condit, W.; Wang, L. State of Technology for Rehabilitation of Wastewater Collection Systems. 2010. Available online: https://cfpub.epa.gov/si/si_public_record_report.cfm?Lab=NRMRL&dirEntryId=226504 (accessed on 23 January 2025).
- Apeldoorn, S. Comparing the Costs—Trenchless Versus Traditional Methods. 2000. Available online: https://www.waternz.org.nz/Attachment?Action=Download&Attachment_id=1344 (accessed on 23 January 2025).
- Argyrou, C.; Bouziou, D.; O’Rourke, T.D.; Stewart, H.E. Retrofitting Pipelines with Cured-in-Place Linings for Earthquake-Induced Ground Deformations. Soil Dyn. Earthq. Eng. 2018, 115, 156–168. [Google Scholar] [CrossRef]
- Serajiantehrani, R. Development of a Machine Learning-Based Prediction Model for Construction and Environmental Costs of Trenchless Spray Applied Pipe Linings, Cured-in-Place Pipe, and Sliplining Methods in Large Diameter Culverts; The University of Texas at Arlington: Arlington, TX, USA, 2020. [Google Scholar]
- Hicks, J.; Kaushal, V.; Jamali, K. A Comparative Review of Trenchless Cured-in-Place Pipe (CIPP) With Spray Applied Pipe Lining (SAPL) Renewal Methods for Pipelines. Front. Water 2022, 4, 904821. [Google Scholar] [CrossRef]
- Wang, L.; Yan, C.; Xu, J. Technology Standard of Pipe Rehabilitation; Springer: Singapore, 2021; ISBN 978-981-334-983-4. [Google Scholar]
- Beaudet, B.A.; Tobey, B.; Harder, S.E. Life Cycle Cost Analysis for Decision Making in Collection System Rehabilitation. In Proceedings of the Pipelines 2019; American Society of Civil Engineers: Nashville, TN, USA, 2019; pp. 187–197. [Google Scholar]
- Serajiantehrani, R.; Najafi, M.; Malek Mohammadi, M.; Kaushal, V.; Jalalediny Korky, S. Construction Cost Analysis of Trenchless Cured-in-Place Pipe and Spray-Applied Pipe Linings Rehabilitation Methods in Gravity Conveyance Conduits. In Proceedings of the Pipelines 2021, Virtual, 29 July 2021; pp. 210–220. [Google Scholar]
- Xu, Y.; Zhou, Y.; Sekula, P.; Ding, L. Machine Learning in Construction: From Shallow to Deep Learning. Dev. Built Environ. 2021, 6, 100045. [Google Scholar] [CrossRef]
- Juszczyk, M.; Hanák, T.; Výskala, M.; Pacyno, H.; Siejda, M. Early Fast Cost Estimates of Sewerage Projects Construction Costs Based on Ensembles of Neural Networks. Appl. Sci. 2023, 13, 12744. [Google Scholar] [CrossRef]
- Sousa, V.; Meireles, I. The Influence of the Construction Technology in Time-Cost Relationships of Sewerage Projects. Water Resour. Manag. 2018, 32, 2753–2766. [Google Scholar] [CrossRef]
- Joshi, A. A Carbon Dioxide Comparison of Open Cut and Pipe Bursting. 2012. Available online: https://scholarworks.bgsu.edu/cgi/viewcontent.cgi?article=1008&context=ms_tech_mngmt (accessed on 23 January 2025).
- Chilana, L. Carbon Footprint Analysis of a Large Diameter Water Transmission Pipeline Installation. Master’s Thesis, The University of Texas at Arlington, Arlington, TX, USA, 2011. [Google Scholar]
- Visentin, C.; Trentin, A.W.D.S.; Braun, A.B.; Thomé, A. Lifecycle Assessment of Environmental and Economic Impacts of Nano-Iron Synthesis Process for Application in Contaminated Site Remediation. J. Clean. Prod. 2019, 231, 307–319. [Google Scholar] [CrossRef]
- Fuselli, F.; Huber, S.; Mambretti, S. Environmental Aspects of Trenchless Pipe Rehabilitation Methods. Urban Water J. 2022, 19, 879–887. [Google Scholar] [CrossRef]
- Chorazy, T.; Hlavínek, P.; Raček, J.; Pietrucha-Urbanik, K.; Tchórzewska-Cieślak, B.; Keprdová, Š.; Dufek, Z. Comparison of Trenchless and Excavation Technologies in the Restoration of a Sewage Network and Their Carbon Footprints. Resources 2024, 13, 12. [Google Scholar] [CrossRef]
- Environmental Prices Handbook 2024: EU27 Version. 2024. Available online: https://cedelft.eu/wp-content/uploads/sites/2/2024/12/CE_Delft_230107_Environmental-Prices-Handbook-2024-EU-version_def.pdf (accessed on 23 January 2025).
- Wang, X.; Liu, B.; Allouche, E.N.; Liu, X. Practical Bid Evaluation Method Considering Social Costs in Urban Infrastructure Projects. In Proceedings of the 2008 4th IEEE International Conference on Management of Innovation and Technology, Bangkok, Thailand, 21–24 September 2008; pp. 617–622. [Google Scholar]
- Ormsby, C. A Framework for Estimating the Total Cost of Buried Municipal Infrastructure Renewal Projects. Master’s Thesis, McGill University, Montréal, QC, Canada, 2009. [Google Scholar]
- Maldikar, S.D. An Investigation of Productivity Loss Due to Outdoor Noise Conditions. Master’s Thesis, The University of Texas at Arlington, Arlington, TX, USA, 2010. [Google Scholar]
- Matthews, J.C.; Allouche, E.N.; Sterling, R.L. Social Cost Impact Assessment of Pipeline Infrastructure Projects. Environ. Impact Assess. Rev. 2015, 50, 196–202. [Google Scholar] [CrossRef]
- Çelik, T.; Kamali, S.; Arayici, Y. Social Cost in Construction Projects. Environ. Impact Assess. Rev. 2017, 64, 77–86. [Google Scholar] [CrossRef]
- Mohanty, S.S.; Rath, A. Capturing Social Cost in Construction Sector: A Review of Literature through Meta-Analysis. J. Stud. Dyn. Change JSDC 2021, 8, 17–30. [Google Scholar]
- Montgomery, D.C.; Peck, E.A.; Vining, G.G. Introduction to Linear Regression Analysis; John Wiley & Sons: Hoboken, NJ, USA, 2012. [Google Scholar]
- Theis, T.; Tomkin, J. Sustainability-a-Comprehensive-Foundation; 12th Media Services: Suwanee, GA, USA, 2018. [Google Scholar]
- ISO 14044; LCA Requirements and Guidelines. ISO: Geneva, Switzerland, 2006.
- Database & Support Team at PRé Sustainability SimaPro Database Manual Methods Library 2024. Available online: https://simapro.com/wp-content/uploads/2024/04/DatabaseManualMethods.pdf (accessed on 23 January 2025).
- Gangavarapu, B.S.; Najafi, M.; Salem, O. Quantitative Analysis and Comparison of Traffic Disruption Using Open-Cut and Trenchless Methods of Pipe Installation. 2003. Available online: https://ascelibrary.org/doi/abs/10.1061/40690(2003)186 (accessed on 23 January 2025).
- Gilchrist, A.; Allouche, E.N. Quantification of Social Costs Associated with Construction Projects: State-of-the-Art Review. Tunnel Underground. Space Technol. 2005, 20, 89–104. [Google Scholar] [CrossRef]
- Tighe, S.; Knight, M.; Papoutsis, D.; Rodriguez, V.; Walker, C. User Cost Savings in Eliminating Pavement Excavations through Employing Trenchless Technologies. Can. J. Civ. Eng. 2002, 29, 751–761. [Google Scholar] [CrossRef]
- Hoffman, J.; Harold, C.; Adderley, V. Portland’s Sewer Rehabilitation Program Development and Implementation. In Pipelines 2014: From Underground to the Forefront of Innovation and Sustainability; American Society of Civil Engineers: Reston, VA, USA, 2014. [Google Scholar]
- Kamat, S. Comparison of Dust Generation from Open Cut and Trenchless Technology Methods for Utility Construction; The University of Texas at Arlington: Arlington, TX, USA, 2011. [Google Scholar]
- Arditi, D.; Messiha, H.M. Life Cycle Cost Analysis (LCCA) in Municipal Organizations. J. Infrastruct. Syst. 1999, 5, 1–10. [Google Scholar] [CrossRef]
- Gao, X.; Pishdad-Bozorgi, P. A Framework of Developing Machine Learning Models for Facility Life-Cycle Cost Analysis. Build. Res. Inf. 2020, 48, 501–525. [Google Scholar] [CrossRef]
- Azeez, K.; Zayed, T.; Ammar, M. Fuzzy- versus Simulation-Based Life-Cycle Cost for Sewer Rehabilitation Alternatives. J. Perform. Constr. Facil. 2013, 27, 656–665. [Google Scholar] [CrossRef]
- Alam, S.; Matthews, J.; Sterling, R.; Allouche, E.; Selvakumar, A.; Condit, W.; Kampbell, E.; Downey, D. Evaluation of Testing Methods for Tracking CIPP Liners’ Life-Cycle Performance. Cogent Eng. 2018, 5, 1463594. [Google Scholar] [CrossRef]
- Schwarz, P.E.; Patrick White, P.E.; Mark, S.; Mihm, P.E. ASCE Guideline of Sustainable Design of Pipelines by American Society of Civil Engineers; American Society of Civil Engineers: Reston, VA, USA, 2019. [Google Scholar]
- Allouche, E.; Sterling, R.; Condit, W. National Database Structure for Life Cycle Performance Assessment of Water and Wastewater Rehabilitation Technologies (Retrospective Evaluation). Available online: https://nepis.epa.gov/Adobe/PDF/P100LDG0.pdf (accessed on 23 January 2025).
- Morera, S.; Remy, C.; Comas, J.; Corominas, L. Life Cycle Assessment of Construction and Renovation of Sewer Systems Using a Detailed Inventory Tool. Int. J. Life Cycle Assess. 2016, 21, 1121–1133. [Google Scholar] [CrossRef]
- Kere, K.J.; Huang, Q. An Analytical Approach to Evaluate Life-Cycle Cost of Deteriorating Pipelines. Reliab. Eng. Syst. Saf. 2024, 250, 110287. [Google Scholar] [CrossRef]
- ASTM F1675-13; Practice for Life-Cycle Cost Analysis of Plastic Pipe Used for Culverts, Storm Sewers, and Other Buried Conduits. Committee ASTM International: West Conshohocken, PA, USA, 2022. [CrossRef]
- Alaloul, W.S.; Altaf, M.; Musarat, M.A.; Faisal Javed, M.; Mosavi, A. Life Cycle Assessment and Life Cycle Cost Analysis in Infrastructure Projects: A Systematic Review. Civ. Eng. 2021, preprint. [Google Scholar] [CrossRef]


| Advantages | Challenges | |
|---|---|---|
| ET |
|
|
| CIPPT |
|
|
Disclaimer/Publisher’s Note: The statements, opinions and data contained in all publications are solely those of the individual author(s) and contributor(s) and not of MDPI and/or the editor(s). MDPI and/or the editor(s) disclaim responsibility for any injury to people or property resulting from any ideas, methods, instructions or products referred to in the content. |
© 2025 by the authors. Licensee MDPI, Basel, Switzerland. This article is an open access article distributed under the terms and conditions of the Creative Commons Attribution (CC BY) license (https://creativecommons.org/licenses/by/4.0/).
Share and Cite
Thakre, G.; Kaushal, V.; Karkhanis, E.; Najafi, M. Evaluation of Life Cycle Cost of Excavation and Trenchless Cured-in-Place Pipeline Technologies for Sustainable Wastewater Applications. Sustainability 2025, 17, 2329. https://doi.org/10.3390/su17052329
Thakre G, Kaushal V, Karkhanis E, Najafi M. Evaluation of Life Cycle Cost of Excavation and Trenchless Cured-in-Place Pipeline Technologies for Sustainable Wastewater Applications. Sustainability. 2025; 17(5):2329. https://doi.org/10.3390/su17052329
Chicago/Turabian StyleThakre, Gayatri, Vinayak Kaushal, Eesha Karkhanis, and Mohammad Najafi. 2025. "Evaluation of Life Cycle Cost of Excavation and Trenchless Cured-in-Place Pipeline Technologies for Sustainable Wastewater Applications" Sustainability 17, no. 5: 2329. https://doi.org/10.3390/su17052329
APA StyleThakre, G., Kaushal, V., Karkhanis, E., & Najafi, M. (2025). Evaluation of Life Cycle Cost of Excavation and Trenchless Cured-in-Place Pipeline Technologies for Sustainable Wastewater Applications. Sustainability, 17(5), 2329. https://doi.org/10.3390/su17052329