Abstract
To accelerate the dissipation of excess pore water pressure, enhance the bearing capacity of piles, and mitigate long-term settlement in soft ground, a novel green and lowcarbon pile foundation technology, termed the precast drainage pile (PDP) technology, is proposed. This innovative approach integrated precast pipe piles with prefabricated vertical drains (PVDs) attached to their sides. The piles were installed using static pile pressing and were subsequently subjected to vacuum-induced negative pressure to facilitate soil consolidation, which enhances the resource utilization rate of pile foundations and promotes the sustainable utilization of soft soil foundations. To investigate the bearing characteristics of the PDP, this study combined the shear displacement method for piles with the consolidation theory of soft soil foundations. A calculation model for the load-settlement behavior of precast piles, accounting for the influence of vacuum-induced soil consolidation, was derived, establishing a method for analyzing the load transfer mechanism of PDPs. The reliability of the theoretical model was validated through comparisons with engineering test results. Building on this foundation, the influence of factors such as consolidation period and pile length on the bearing characteristics of PDPs was analyzed. The results demonstrated that, compared to a 10 m precast pile without drainage, the ultimate bearing capacity of single piles with drainage durations of 3, 7, 14, and 28 days increased by 7.3%, 12.7%, 20.3%, and 29.6%, respectively. Furthermore, under a 7-day drainage condition, the bearing capacity of piles with lengths of 10 m, 20 m, and 30 m increased by 12.7%, 12.8%, and 13.1%, respectively. Overall, the findings of this study provide a theoretical basis for the research, development, and design calculations of this new sustainable pile technology.
1. Introduction
Drainage piles represent an innovative green pile foundation technology that integrates precast piles with the drainage consolidation method. This advanced technology combines the benefits of effective drainage capabilities and the structural strength of rigid piles, enabling the rapid dissipation of excess pore water pressure induced by pile driving while exhibiting high bearing capacity. Specifically designed to address challenges such as deep soft soil layers, low soil strength, and insufficient lateral friction resistance in coastal regions, drainage piles improve the properties of the surrounding soil through consolidation, thereby enhancing the skin friction resistance and subsequently improving the bearing capacity of the pile foundation. The PDP facilitates the sustainable utilization of construction materials and land resources while ensuring the long-term operational integrity of overlying infrastructure. Moreover, it effectively mitigates progressive foundation settlement and reduces environmental impacts from conventional ground treatment methods, thereby promoting ecological sustainability. Given its effectiveness, this technology holds considerable promise for application in the treatment of soft soil grounds, which are widely distributed across China, offering substantial value for infrastructure development in such areas.
Currently, the existing drainage pile technologies primarily include permeable concrete piles and perforated pipe piles. Leveraging the characteristics of permeable concrete, Ni et al. (2013) proposed the permeable concrete pile and demonstrated its superiority over traditional precast piles without drainage through model tests [1]. Suleiman et al. (2014) investigated the impact of changes in pile formation processes on the ultimate bearing capacity of permeable concrete piles, confirming that, under the same installation method, permeable concrete piles can significantly enhance pile shaft strength [2]. Huang et al. (2016) and Xu et al. (2024) conducted relevant model tests to study the behavior of permeable pipe piles during construction and loading processes [3,4,5]. Umanath et al. (2023) found through indoor consolidation tests that permeable concrete piles exhibit a relatively good consolidation acceleration effect in highly compressible clay [6]. Lin et al. (2023) verified through static load tests that perforated pipe piles could significantly improve the bearing capacity of individual piles and calculated that their carbon emissions over the entire lifecycle are substantially lower than those of traditional pipe piles [7]. In research on perforated pipe piles, Tang et al. (2022) combined pile body perforations with vacuum drainage and, through model tests, found that the shear strength of the soil around the perforated pipe pile and the lateral friction resistance of the pile increased positively with the duration of vacuuming [8]. Li et al. (2023) proposed an anti-slide drainage pile capable of both resisting sliding and draining water by positioning the pile body perforations in the upper half of the pile [9].
The consolidation of pile-side foundations is closely related to the bearing characteristics of drainage piles, prompting scholars to conduct extensive research in this area. Zhang et al. (2013) explored the pressure relief and settlement reduction effects of permeable concrete piles using the finite element method and Biot’s consolidation theory [10]. Building on this, Chen et al. (2021) proposed the concept of a blocked drainage boundary and developed a mathematical model to describe soil consolidation around permeable piles [11]. Han et al. (2022) revised the traditional equal-strain hypothesis by incorporating the penetration deformation of permeable concrete piles, the parabolic variation in the horizontal permeability coefficient in the disturbed soil zone, and the seepage of water within the pile body, leading to the derivation of a corresponding consolidation solution [12]. More recently, Ma et al. (2024) established a full-process model for pile driving and consolidation based on the coupling of the material point method and finite element method and derived solutions for the consolidation effects of permeable pipe piles with varying permeable areas [13]. Tang et al. (2022) used the Poiseuille equation to seamlessly connect pore pressures inside and outside pipe piles, deriving an analytical solution for the equal strain consolidation of vacuum-assisted perforated pipe piles [8]. Moreover, Wang et al. (2019) and Yang et al. (2024) established a consolidation model featuring grooves on the pile side and incorporated PVDs as part of the drainage system to investigate the influence of the number and width of PVDs on the pile side during the consolidation process [14,15,16].
In the southeastern coastal regions of China, the presence of deep and ultra-soft soil presents significant engineering challenges. To address these challenges, a feasible solution involves the installation of PVDs along the sides of precast piles, which are then implanted into the ground. This innovative approach has been termed the precast drainage pile (PDP). Deng et al. (2022) introduced the concept of the implanted precast drainage pile, wherein PVDs are affixed to both sides of a precast pile, and the assembly is subsequently installed using the pile driving method. Through a series of model tests and field tests, they demonstrated the reliability of this novel approach, highlighting its advantages, including ease of construction and the preservation of the structural integrity of the precast pile [17]. Further advancing the understanding of this method, Deng et al. (2023) proposed a consolidation theory specifically for the PDP treating the PVDs as elliptical drainage bodies and deriving an analytical solution under vacuum negative pressure based on the vertical drained consolidation theory [18].
From the above analysis, it can be inferred that research on the technology and consolidation theory of drainage piles has been extensively conducted. However, there remains a notable gap in theoretical studies concerning the bearing characteristics of drainage piles. In this regard, this paper applied the vacuum negative pressure drainage consolidation theory to analyze the changes in the effective stress of the soil and its influence on the characteristics of the side friction resistance of the pile around the PDP technology. Subsequently, based on the shear displacement method, a new load transfer formula for PDP is derived, and a calculation method for determining the bearing characteristics of PDP is established. This research provides theoretical support for the promotion and application of the new drainage pile technology in coastal soft soil areas.
2. Physical Model and Parameter
2.1. Physical Model of Precast Drainage Pile
Prefabricated vertical drains (PVDs) are a common and mature soft ground reinforcement technology. PDP technology combines a precast pile with PVDs, as Figure 1 shows. In this study, prior to being driven into the ground, PVDs were attached to the sides of the precast pipe piles. Once installed, vacuum pressure was applied to facilitate the drainage of water from the soil surrounding the piles. By enhancing soil consolidation through vacuum drainage, the effective stress on the soil increased, leading to an improvement in the unit ultimate lateral resistance and shear modulus of the soil surrounding the pile. This, in turn, enhanced the bearing capacity of the pile foundation.
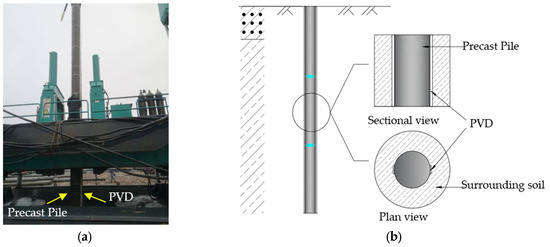
Figure 1.
Precast drainage pile (PDP): (a) on-site construction of PDP; (b) schematic diagram of PDP.
2.2. Consolidation of Surrounding Soil
Based on the traditional consolidation theory for ground improved with vertical drains, a new consolidation model for PVDs was proposed [18]. This model treats the PVDs as elliptical cylindrical drainage bodies. Utilizing the principle of equivalent area and perimeter optimization, a vertical drain with a width of b and a thickness of c is transformed into an equivalent ellipse with major and minor axes of 1.04 b and 1.22 c, respectively. From this transformation, the consolidation theory for elliptical cylindrical PVDs was derived and established. Compared to traditional consolidation theories, this proposed theory provided a more accurate representation of the actual consolidation behavior of the soil surrounding the PVDs (Figure 2).
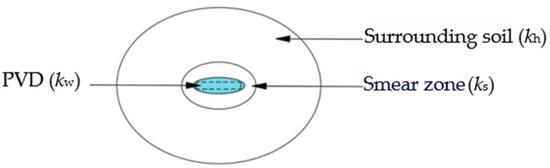
Figure 2.
Consolidation model for single PVD surrounding the precast pile.
The formula for calculating the degree of consolidation is as follows:
where Uρ is ρthe degree of consolidation; is the average degree of consolidation; is the average excess pore water pressure; u0 is the vacuum pressure intensity; γw is the unit weight of water; z represents the calculated depth of the soil; l is the pile length; t represents the consolidation time; Bρ = θA2/(A2 + B2), A = M/l; M = (2m + 1)π/2 and m = 0, 1, 2, …; mv represents the soil volume compression coefficient; kh represents the horizontal permeability coefficient of the undisturbed soil area; kw represents the horizontal permeability coefficient of the PVD; ks represents the horizontal permeability coefficient of the smear zone; a represents the focal point coordinate of the equivalent ellipsoid of the PVD, and a = [(1.04b)2 − (1.22δ)2]0.5/2; ρw, ρs, and ρe represent the diameters of the elliptical cylinder drainage body, the smear zone, and the undisturbed soil area, respectively; and Fa is a dimensionless parameter depending on the soil permeability distribution, with specific calculation formulas given in Equations (A1)–(A8) in Appendix A.
2.3. Unit Ultimate Lateral Resistance of Surrounding Soil
As the degree of consolidation of the soil surrounding the pile increased, the lateral frictional resistance exerted by the soil on the pile side also underwent corresponding changes. The theoretical calculation method for pile-side frictional resistance, Qsu, typically involves taking the product of the unit ultimate lateral resistance of each soil layer, qsui, within the pile range, and the surface area of the pile side Ai, i.e., Qsu = ∑Aiqsui. There are various methods for calculating qsui. Among these, the β method is an analysis approach based on effective stress, suitable for both clay and sand and applicable under both drained and undrained conditions. Burland further validated the rationality of this method for calculating pile-side frictional resistance in cohesive soils. The expression for the unit ultimate lateral resistance on the pile side is as follows:
where δ represents the external friction angle between the pile and the soil; σ′v represents the average vertical effective stress of the soil layer at the pile side; and K0 represents the coefficient of rest earth pressure for the soil.
For normally consolidated cohesive soils, it can be approximated that K0 ≈ 1 − sinφ′ and δ ≈ φ′, where φ′ represents the effective internal friction angle of the soil. Consequently, the expression can be modified to
where β = (1 − sin φ′) tan φ′, and the statistical results indicate that β typically ranges from 0.25 to 0.4.
Based on the principle of effective stress, the unit ultimate lateral resistance of the soil after consolidation is
where Ur represents the radial degree of consolidation and P0 represents the vacuum pressure.
2.4. Shear Modulus of Surrounding Soil
As an important parameter for evaluating the mechanical properties of soil, the shear modulus is influenced by variations in soil moisture content and the degree of compaction resulting from drainage consolidation. During the consolidation and drainage process, the soil tends to become more compact and stable, with its shear strength increasing. Meanwhile, according to the Mohr–Coulomb law, as the effective stress rises, the strength of the soil also improves. The empirical formula for the shear modulus proposed by Hardin is commonly used to describe its variation with effective stress and can also be applied to analyze changes in shear modulus during consolidation [19]. Based on numerous resonant column test results conducted on undisturbed clay, a prediction formula for the Gmax (the maximum shear modulus) of undisturbed soil has been developed based on the effective stress and void ratio (e). The void ratio is introduced through the F(e) function, considering the influence of soil structure on the shear modulus. The formula explicitly integrates the effect of soil compactness, as expressed by the void ratio, on the shear modulus.
where F(e) = (2.97−e)2/(1 + e) is the soil void ratio equation; Pa is the standard atmospheric pressure, with a value of 100 kPa; n is an empirical exponent, typically ranging from 0.5 to 1, reflecting the sensitivity of the shear modulus to effective stress; and A is a fitting parameter, usually falling between 20 and 100 for soft clay.
3. Theoretical Deduction
3.1. Shear Displacement Method
Through an analysis of the deformation behavior of compression piles, it was found that when the pile shaft experienced downward displacement under a load, the frictional interaction between the pile and the surrounding soil induced soil displacement. This process generated shear strain and shear stress within the annular soil mass surrounding the pile. The resulting shear stress and shear strain propagated radially outward in concentric rings. The coordinated deformation relationship between the PDP and the surrounding soil is shown in Figure 3, where r represents the horizontal distance from the center of the pile; z represents the pile settlement; rm represents the extent of the shear zone; r1 represents the influence range of consolidation; z1 represents the pile settlement induced solely by shear action; and z2 represents the pile settlement under combined effects of shear force and drainage consolidation. Under the load applied at the pile top, the soil surrounding the pile underwent shear deformation and settled to z2. Within the influence area of the PDP, the soil underwent consolidation, resulting in altered soil properties. Consequently, the settlement magnitude changed from the initial z2 to z1.
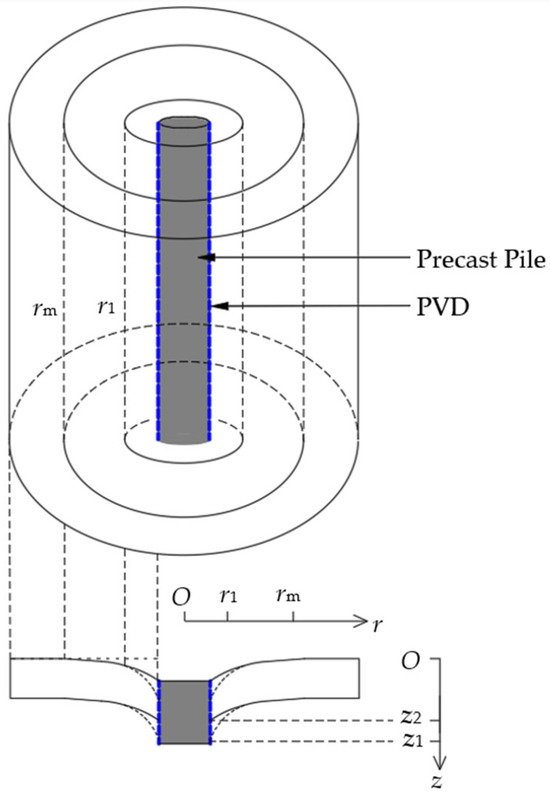
Figure 3.
Diagram of deformation between pile and the surrounding soil.
During the process of pumping and draining water, the soil underwent gradual consolidation, resulting in an increase in density, and the compression and shear moduli of the soil changed, leading to variations in the calculated results for shear displacement. Since the shear displacement formula is dependent on the shear modulus, and the drainage process modifies this parameter, it is essential to recalculate the shear modulus of the soil surrounding the pile after consolidation has occurred.
The shear strain of the soil element at a distance r from the pile axis is given by
The shear stress within the area affected by consolidation is expressed as
Based on the shear stress equilibrium on any annular surface at a radius r surrounding the pile, the following relationship holds:
By rearranging Equations (12) and (11), the following equation can be derived:
Since the static load test is conducted after consolidation, the change in soil shear modulus at this point can be neglected and treated as a constant in the calculations. After integration, the formula for shear displacement at any depth z along the pile side can be obtained. The displacement on the annular surface of the soil surrounding the pile, at a radius r, decreased as the radial distance r increased. The basic formula for shear displacement within the influence range of the PDP is expressed as follows:
where Δs represents the settlement of the soil adjacent to the pile within the consolidation influence zone and r0 represents the radius of the pile shaft.
3.2. Load Transfer Functions for Pile Side and Pile Tip
The key to deriving the basic formula for shear displacement in a PDP lies in determining the unit shear resistance τ(z) at the pile–soil interface. This unit shear resistance can be approximated by calculating the unit ultimate lateral resistance [20,21].
The forces acting on the pile shaft and the force distribution within its elements in soft soil foundations are illustrated in Figure 4. By applying the principle of force equilibrium, the following relationship can be derived:
where τ(z) is the unit area friction resistance along the pile side, which varies with depth; u is the circumference of the pile shaft; and p(z) is the axial force at the pile cross-section at depth z; p0 represents the pile head load; pb denotes the pile tip reaction; and dz indicates the differential element segment.
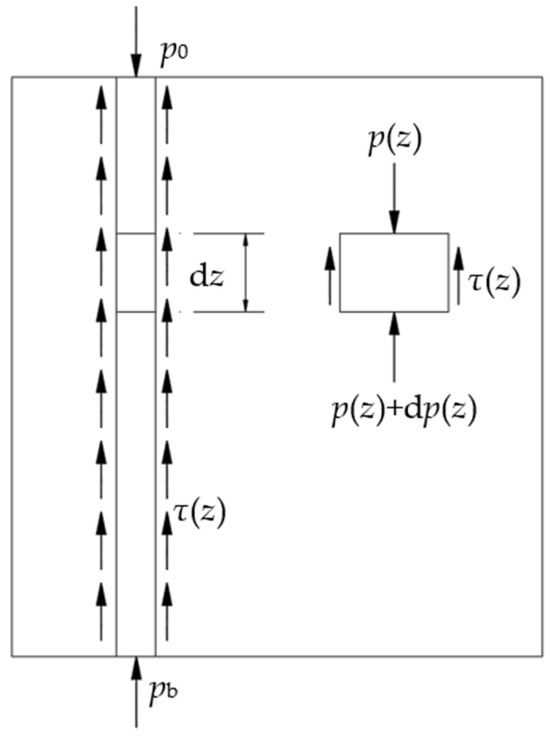
Figure 4.
Force analysis diagram for pile element.
This equation is also a differential equation for the vertical displacement of the pile shaft. Based on Hooke’s Law and after rearranging the terms, the following equation is obtained:
where E represents the elastic modulus of the pile shaft and A denotes the cross-sectional area of the pile shaft.
By substituting Equation (16) into Equation (15), we can derive
The above represents the basic equations governing load transfer and vertical displacement in pile shafts. The solution to the basic equation for load transfer along pile shafts hinges on the selection of an appropriate load transfer function. The ideal elastoplastic model employs a bilinear curve to represent the relationship between pile-side frictional resistance and the relative displacement between the pile and the surrounding soil. This model indicates a linear correlation between the pile-side frictional resistance and pile–soil relative displacement during the elastic phase. Once the relative displacement reaches a critical value, denoted as sf, the frictional resistance no longer increases, signifying the transition to the plastic phase. Due to its computational simplicity and widespread acceptance, this model has been widely adopted. Therefore, this paper adopts this model to simulate the behavior of both the soil at the pile side and the pile tip.
The pile-side model is illustrated in Figure 5. Based on the principle of effective stress, changes in effective stress following soil drainage and consolidation lead to a transition from function 1 to function 2 in terms of the unit area frictional resistance at the same pile–soil relative displacement. As a result, the unit ultimate lateral resistance of the pile-side soil is altered to q′max.
where sf represents the pile–soil relative displacement required to achieve the unit area ultimate friction resistance, typically ranging from 6 to 10 mm, and k is the lateral resistance transfer coefficient, which can be approximated as: κ = q′sui/sf.
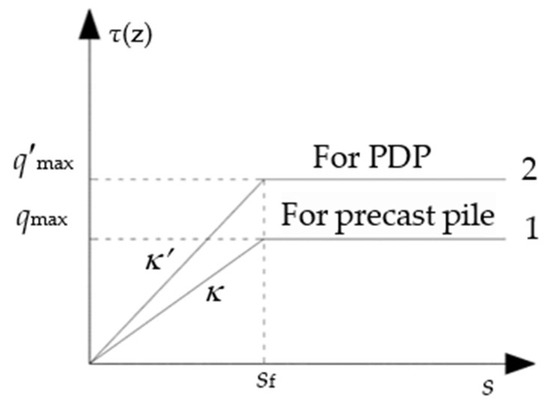
Figure 5.
Load transfer function for pile side.
The pile-tip model is illustrated in Figure 6.
where pb represents the pile-tip reaction force; pbmax is the ultimate value of the pile-tip reaction force; ξf denotes the maximum displacement of the pile-tip soil required to reach the ultimate pile-tip reaction force; and kb is the stiffness coefficient of the normal resistance of the pile-tip soil, calculated as kb = 2dEb/(1 − vb2).
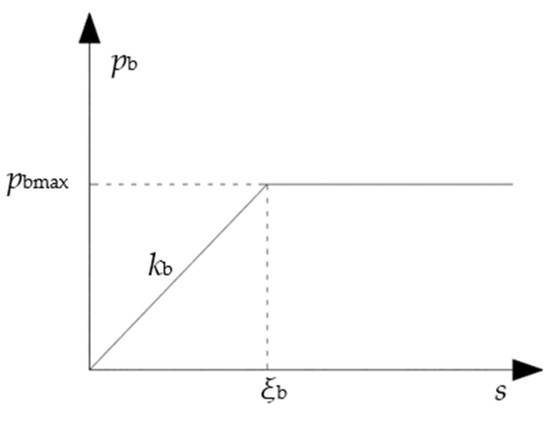
Figure 6.
Load transfer function for pile tip.
3.3. Relative Displacement Between Pile and Soil
When the load was applied to the top of the PDP, the load of the pile body was transmitted from top to bottom, and the shear stress generated by the pile body to the soil around the pile caused relative displacement of the pile–soil interface. As the load increased, the relative displacement between the pile and the soil at the top of the pile also increased. Consequently, the side friction mechanism transitioned from the elastic stage to the plastic stage.
3.3.1. For Elastic Stage, s(z = 0) ≤ sf
Substituting Equation (18) into Equation (17) yields
Equation (20) represents a homogeneous linear differential equation with respect to the relative displacement s of the pile–soil system. The characteristic equation associated with Equation (20) yields two distinct real eigenvalues. Consequently, the general solution of Equation (20) can be expressed as follows:
where r1 and r2 are the two eigenroots of the eigenequation, the values are ±(uκ′/EA)0.5, and m1, m2 are the coefficients.
The general solution can be further simplified as
where c1 and c2 are coefficients and λ = (uκ′′/EA)0.5.
From Equations (22), (17), and (15), the following equation is obtained:
Substituting the boundary conditions for the pile, p(z)|z=0 = p0, p(z)|z=l = pb = kbs, into Equation (23), we can obtain the following solution:
when the load is increased such that the relative displacement at the top of the pile reaches sf, the boundary condition τ|z=0 = qmax is substituted into Equation (25) to obtain the critical load in the elastic stage:
3.3.2. For the Plastic State, s(z = 0) > sf
When the load applied to the top of the pile exceeded the critical load, the relative displacement between the pile and the soil in the upper section of the pile reached its limit due to the transfer of load from the top downward. Meanwhile, in the lower section, the relative displacement between the pile and the soil gradually increased as the load continued to transfer. Consequently, the upper portion of the pile entered the plastic stage, while the lower portion remained in the elastic stage. As shown in Figure 7, the pile is divided into two distinct zones: a plastic zone, where z ≤ h, and an elastic zone, where At z > h. The specific depth z = h is referred to as the depth of the plastic zone; l denotes the length of the pile shaft.
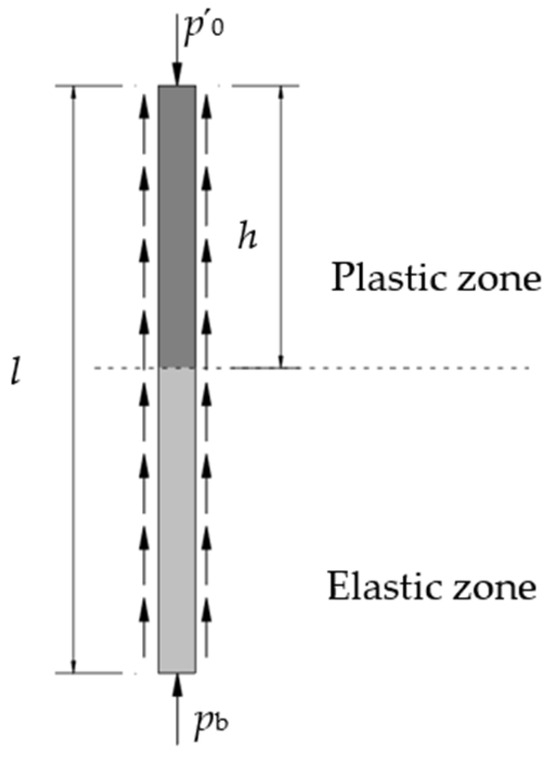
Figure 7.
Schematic diagram of elastic and plastic zones for pile–soil interaction.
Substituting Equation (18) into Equation (17) and combining the images, we can obtain
There are continuity conditions and displacement boundary conditions as follows: s(z)|z=h = sf, p|z=h = p′0 − uhq′max, −EAs(z)/dz|z=0 = p′0. In these conditions, p′0 is the load on the top of the pile after the plastic phase has developed. Substituting the above conditions into Equation (27), the pile displacement can be determined:
Based on the boundary condition p|z=h= p′0 − uhq′max, the displacement s is equal in the calculation formulas for both the plastic and elastic zones at z = h. By combining this condition with Equation (27), the expression for the depth of the plastic zone can be derived.
By substituting Equation (29) into Equation (28), the expression of the relative displacement of pile–soil in the plastic stage can be obtained.
3.4. Settlement at Pile Top Surface
3.4.1. For Elastic Stage
By substituting Equation (25) into Equation (18), the unit friction resistance at the pile–soil interface during the elastic stage can be determined. Subsequently, the obtained unit friction resistance can be substituted into Equation (14) to derive the shear displacement of the soil within the shear zone adjacent to the pile side under these conditions.
Then, the expression for the settlement of the pile top in the elastic stage is
3.4.2. For Plastic State
When the top of the pile enters the plastic stage, in addition to the shear displacement, the relative sliding will also occur at the pile–soil interface. The shear stress in the slip section corresponds to the residual shear strength. Therefore, the shear displacement formula for the plastic stage can be expressed as follows:
The following expression for the settlement of the pile top in the plastic stage is obtained:
In summary, by combining Equation (31) and Equation (33), the expression for the total settlement at the top of the pile, denoted as S(0), can be derived.
Under the load applied at the top of the pile, a relative displacement occurred between the pile and the surrounding soil. As this relative displacement increased, the lateral frictional resistance near the top of the pile also increased, marking the elastic stage. The expression for the displacement at the top of the pile during this stage is provided in Equation (31). When the lateral frictional resistance near the pile top reached its peak value, further increases in the load at the pile top did not result in additional increases in the lateral frictional resistance. At this point, the system transitioned into the plastic stage, and the expression for the displacement at the top of the pile in this stage is given in Equation (33).
4. Verification and Analysis
4.1. Calculation Methodology
The core concept presented in this paper for addressing the settlement of a single PDP involved integrating the effects of vacuum drainage consolidation on soil properties into the shear displacement method. To enhance the practicality and convenience of the equations derived in this study, a MATLAB (2017a) program was developed based on the flowchart illustrated in Figure 8. By inputting the fundamental parameters, the program enabled the determination of the soil parameters surrounding the pile following negative pressure drainage consolidation. Subsequently, by assuming a pile displacement value (sf), the load and settlement values at the pile top were calculated based using the program, and the corresponding curves were generated for analysis.
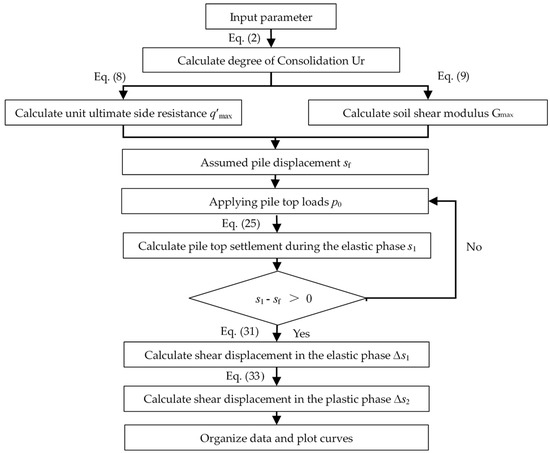
Figure 8.
Calculation flow of load–settlement curve.
4.2. Theoretical Verification
4.2.1. Case One
To validate the reliability of the theory presented in this paper, the derived equations are used to analyze and compare with field test results obtained from the PDP conducted at the Comprehensive Building of the Medical Department of Ningbo University. The project site is situated in the eastern region of Zhejiang Province, bordered by the East China Sea to the east and the Yongjiang River—the second-largest river in Zhejiang Province—to the south. According to the geological survey report, the soil below the fill layer at the test site primarily consists of marine-deposited muddy silty clay.
The field test is illustrated in Figure 9. In the figure, P1 denotes a conventional precast pile, while P2 represents a PDP. The two piles were spaced 5 m apart. Both piles were of the same precast type, with a length of 12 m, an outer diameter of 0.5 m, and an inner diameter of 0.3 m, and were constructed using C80 concrete with a modulus of elasticity (E) of 30 GPa. Two PVDs (Type C) were installed along the side of pile P2, with their length matching that of the pile. The vacuum drainage process was conducted over a period of 5 days. The PVDs had dimensions of 100 mm in width (b) and 4 mm in thickness (c), and the applied vacuum pressure was maintained at 90 kPa. The parameters for the test were set as follows: β = 0.32, sf = 6 mm, A = 20, and n = 1. Table 1 provides the soil and physical–mechanical property indicators of the foundation, including the unit weight (γ), void ratio (e), liquid limit (wL), plastic limit (wP), vertical permeability coefficient (kv), horizontal permeability coefficient (kh), and compressibility coefficient (a).
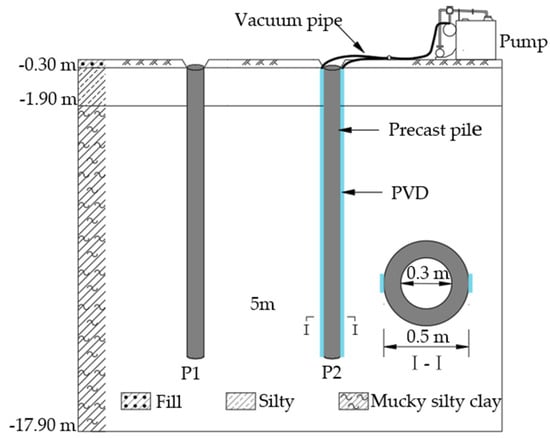
Figure 9.
Schematic diagram of field test scheme for case one.

Table 1.
Soil layers for case one.
To evaluate the bearing capacity of the two different types of pile foundations, static load tests were conducted on piles P1 and P2, respectively, one week after the cessation of the vacuum drainage operation. In accordance with the “Technical Code for Building Pile Foundations” [22], the ultimate bearing capacity of a single pile was estimated to be 450 kN, which led to the determination of a surcharge weight of 900 kN for the test. The static load tests are shown in Figure 10. The slow-maintained load method was employed for the testing, which involves applying the load in incremental stages. The next stage of loading was initiated only after the stability criteria for the current stage were satisfied. The test was concluded once the specified termination conditions were met. During the static load test, the load was applied in increments of 45 kN, representing 1/10 of the estimated ultimate bearing capacity. The initial stage involved a load twice the incremental value (90 kN), with subsequent stages increasing progressively until the ultimate state was reached. The static load test system was utilized to automatically manage the staged loading process and to record the corresponding stress and settlement data throughout the test.
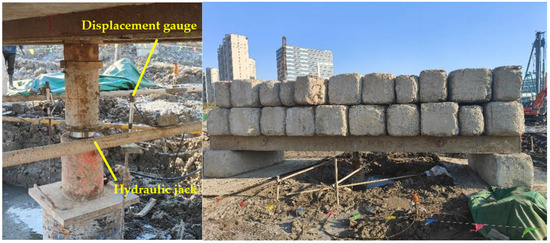
Figure 10.
Static load tests for case one.
Using the field parameters and the equations derived in this study, theoretical calculations were performed to obtain the pile-top load–settlement curve based on the theoretical framework presented herein. A comparison between the calculated results and the field measurements is illustrated in Figure 11. The findings demonstrated that the trend of the measured curve aligned closely with that of the theoretical curve.
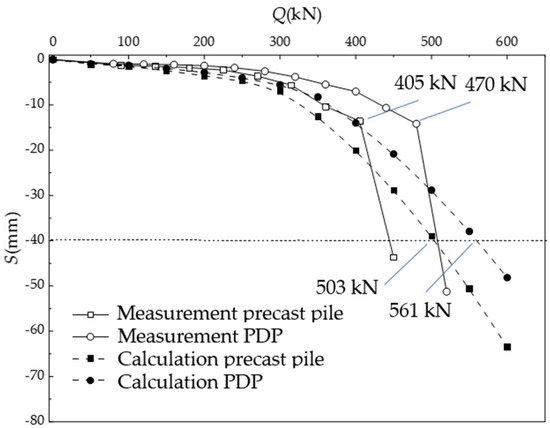
Figure 11.
Comparison of Q-S curves between measurement and theoretical value for case one.
4.2.2. Case Two
The proposed site is situated in the northern region of the Ningshao Plain and forms part of the construction project for the energy-saving and environmentally friendly precast pile production line of Yuyao Zhongchun High-Tech Pile Co., Ltd. (Yuyao, China). The field construction process is illustrated in Figure 12. The precast pile utilized in this test is a statically drilled and grouted pile, with the upper section consisting of three segments of 11 m long PHC piles with a diameter of 0.4 m, and the lower section being a 12 m long bamboo-jointed pile, resulting in a total pile length of 45 m. The elastic modulus of the pile body is 30 GPa. The prefabricated vertical drains have dimensions of b = 100 mm and c = 4 mm. The vacuum unit provided a negative pressure of 90 kPa, and the vacuum drainage duration was set at 36 h. The parameters for the test are defined as β = 0.32, sf = 6 mm, A = 20, and n = 1. The soil parameters are detailed in Table 2, and a weighted average approach is employed for calculations.
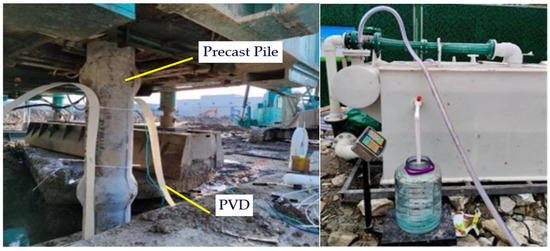
Figure 12.
Field construction for case two.
Table 2.
Soil layers for case two.
After 36 h of vacuum drainage, static load tests were conducted on the pile types at the site, and calculations were performed using the aforementioned parameters and the equations derived in this paper. The comparison of the results is shown in Figure 13, where IP represents the liquid index and IL denotes the plasticity index. The results indicate that the trend of the measured curve aligned closely with that of the theoretical curve. By applying the equations derived in this paper, it is feasible to determine the bearing capacity of the pile after consolidation by controlling the settlement at the pile top.
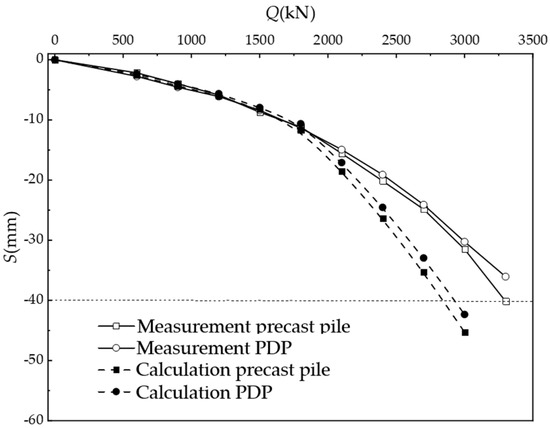
Figure 13.
Comparison of Q-S curves between measurement and theoretical value for case two.
4.3. Example Calculation Analysis
To ensure the reliability of the theory, further example calculations and analyses were conducted to investigate the influence of key parameters, such as vacuum drainage duration and pile length, on the theoretical framework presented in this paper under the same working conditions. The parameter values are as follows: u0 = 90 kPa, b = 100 mm, c = 4 mm, E = 30 GPa, d = 0.5 m, β = 0.32, sf = 6 mm, A = 20, and n = 1. The soil parameters remained consistent with those used in case two. The vacuum drainage durations considered were t = 0 d, 3 d, 7 d, 14 d, and 28 d, and the pile lengths were l = 10 m, 20 m, and 30 m.
Figure 14 presents the load–settlement curves of the pile top for the PDP with a length of l = 10 m and vacuum drainage durations of 0 d, 3 d, 7 d, 14 d, and 28 d. As illustrated in the figure, the increase in vacuum drainage duration had a notable impact on enhancing the ultimate bearing capacity of a single pile. Specifically, the bearing capacity increased progressively with longer drainage times. The ultimate bearing capacity of a single pile showed increments of 7.3%, 12.7%, 20.3%, and 29.6% for drainage durations of 0, 3, 7, 14, and 28 days, respectively. The relationship between bearing capacity and the rate of increase over time is further depicted in Figure 15. While the bearing capacity continued to rise with extended drainage time, the rate of increase gradually diminished. Notably, the ultimate bearing capacity of a single pile after 3 days of drainage was significantly higher than that after 0 d, indicating that vacuum drainage effectively enhanced the properties of the soil surrounding the pile, thereby improving the pile’s bearing capacity. Further increases in bearing capacity were observed after 7 d, 14 d, and 28 d of drainage, indicating that the soil properties around the pile underwent continuous changes during the drainage process. This was attributed to the sustained transmission of vacuum-induced negative pressure within the soil. Under vacuum drainage, the degree of soil consolidation around the pile followed a curvilinear relationship with time. As consolidation progressed, the soil density increased, the permeability coefficient decreased, and the incremental gain in the soil’s effective stress gradually reduced. Consequently, with increased drainage time, the rate at which the bearing capacity increased slowed down. As the drainage consolidation progressed, the effective stress within the soil gradually increased, leading to a continuous rise in the shear modulus. Consequently, the bearing capacity of the pile was progressively enhanced. The extended drainage consolidation duration induced a more pronounced enhancement in the soil mechanical properties, which consequently led to improvement in the pile bearing capacity.
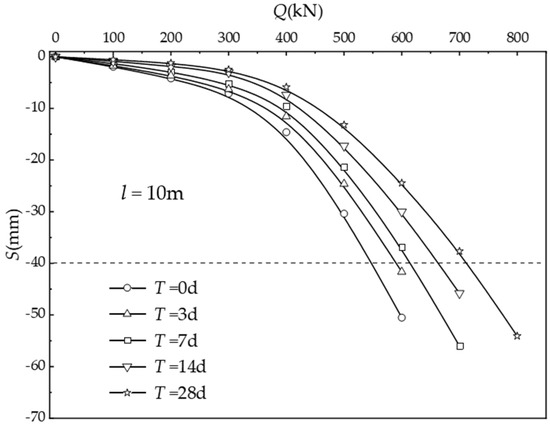
Figure 14.
Variation of load–settlement curves under different drainage periods.
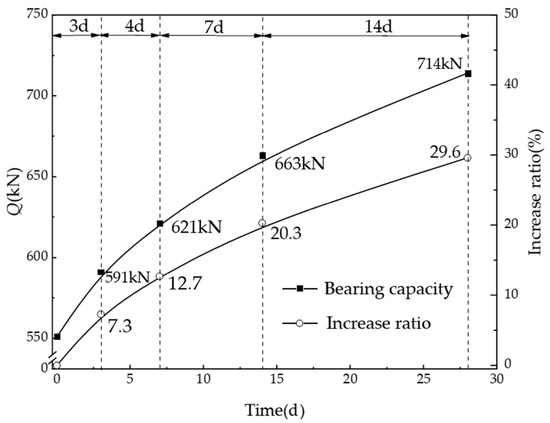
Figure 15.
Load-bearing capacity and increase proportion with drainage periods.
It should be noted that there are multiple factors that affect the improvement of single-pile bearing capacity through drainage consolidation, such as vacuum pressure, soil permeability, and drainage boundary conditions. The transmission process of vacuum negative pressure in the foundation is relatively complex, and this article assumes 90 kPa, which may be higher than the actual situation. Secondly, if the permeability of the on-site foundation is high, the improvement effect is significant; otherwise, the improvement effect is poor [23]. In addition, if the groundwater source is continuously replenished, it will affect the increase in the bearing capacity of the pile. The above conditions will affect the actual pumping and drainage efficiency and need to be analyzed in conjunction with geological conditions and construction plans.
The load–settlement curves at the pile top for various pile lengths, following a drainage period of 7 days, are presented in Figure 16. As illustrated in the figure, the length of the pile significantly influenced the enhancement of the ultimate bearing capacity of a single pile. Specifically, as the pile length increased, the ultimate bearing capacity of the single pile demonstrated a consistent improvement. As shown in Figure 17, for piles with lengths of 10 m, 20 m, and 30 m, the bearing capacities after 7 days of vacuum drainage increased by 12.7%, 12.8%, and 13.1%, respectively. Notably, for piles of different lengths subjected to the same drainage duration, the proportional increase in bearing capacity remained relatively consistent. The pile length is not the key factor affecting the improvement of single-pile bearing capacity through drainage consolidation. The main reasons for this come from two aspects: the constitutive relationship of the soil adopts a linear relationship, and the variation in soil strength with depth was not taken into account. In practical engineering, the mechanical properties of soil are complex, the distribution of soil softness and hardness is uneven, and the influence of pile length may vary.
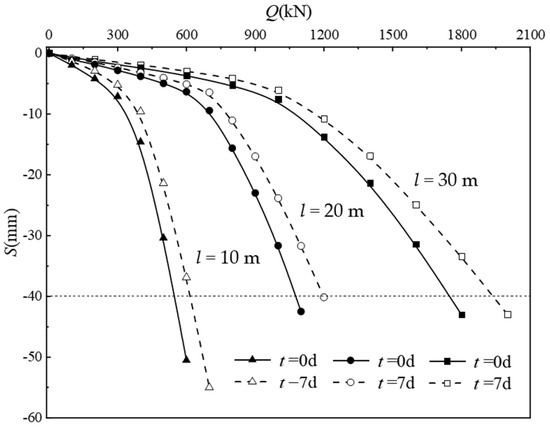
Figure 16.
Comparisons of load–settlement curves under different pile lengths.
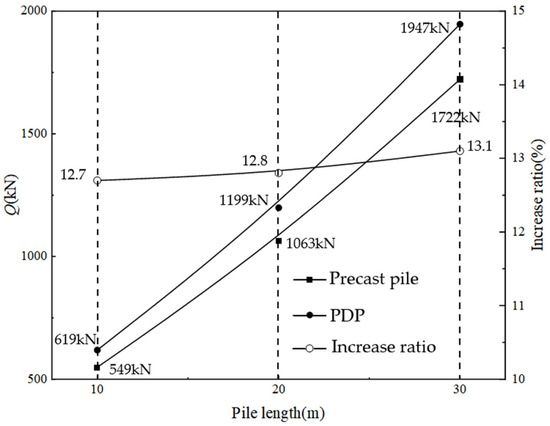
Figure 17.
Load-bearing capacity and increased proportion with pile lengths.
5. Conclusions
- This article presents a theoretical investigation into a novel drainage pile technology referred to as PDP. Utilizing the shear displacement method for pile foundations and incorporating the effects of vacuum drainage consolidation on the surrounding soil, a bearing capacity model for the PDP was developed. By applying this model to calculate the bearing capacity in two real-world engineering cases, it was observed that the theoretical values closely aligned with the measured results, thereby validating the reliability of the proposed model. This approach effectively predicts the settlement characteristics and bearing capacity of drainage piles, offering valuable support for the optimization of drainage pile design.
- The case study analysis indicates that the ultimate bearing capacity of a single pile increases with both the duration of vacuum drainage and the length of the pile. However, the rate of this increase tends to diminish over time. For instance, in the case of a PDP with a length of 10 m, the ultimate bearing capacity of single piles increased by 7.3%, 12.7%, 20.3%, and 29.6% after 3, 7, 14, and 28 days of vacuum drainage, respectively. Furthermore, when comparing piles of different lengths, specifically 10, 20, and 30 m, the bearing capacity after 7 days of vacuum drainage increased by 12.7%, 12.8%, and 13.1%, respectively.
- This paper derives an innovative computational model for pile bearing capacity by synthesizing the shear displacement method with the load transfer method, explicitly accounting for vacuum-induced drainage consolidation effects. This research provides theoretical support for developing novel drainage pile technologies in coastal regions while advancing the adoption of green low-carbon pile foundations in engineering practices.
Author Contributions
Conceptualization, S.-H.H. and Y.-B.D.; methodology, S.-H.H. and Y.-B.D.; software, S.-H.H.; validation, S.-H.H., Y.-B.D., and S.Y.; formal analysis, S.-H.H.; investigation, S.-H.H.; resources, R.-H.Z.; data curation, S.-H.H.; writing—original draft preparation, S.-H.H.; writing—review and editing, Y.-B.D.; visualization, Y.-B.D.; supervision, S.Y.; project administration, Y.-B.D.; funding acquisition, Y.-B.D. All authors have read and agreed to the published version of the manuscript.
Funding
This work was funded by the Key Project of Ningbo Natural Science Foundation (2023J004) and the Major Project of Ningbo Science and Technology Innovation 2025 (2022Z224).
Institutional Review Board Statement
Not applicable.
Informed Consent Statement
Not applicable.
Data Availability Statement
The original contributions presented in this study are included in the article. Further inquiries can be directed to the corresponding author.
Conflicts of Interest
Author Ri-Hong Zhang was employed by the company Ningbo Zhongchun Hi-Tech Co., Ltd. The remaining authors declare that the research was conducted in the absence of any commercial or financial relationships that could be construed as a potential conflict of interest.
Appendix A
References
- Ni, L.; Suleiman, M.T.; Raich, A. Pervious concrete pile: An innovation ground improvement alternative. In Proceedings of the 2013 Geo-Congress, San Diego, CA, USA, 3–7 March 2013; pp. 2051–2058. [Google Scholar] [CrossRef]
- Suleiman, M.T.; Ni, L.; Raich, A. Development of pervious concrete pile ground-improvement alternative and behavior under vertical loading. J. Geotech. Geoenviron. Eng. 2014, 140, 4014035. [Google Scholar] [CrossRef]
- Huang, Y.; Wang, J.; Mei, G.X. Model experimental study of accelerating dissipation of excess pore water pressure in soil around a permeable pipe pile. Rock Soil Mech. 2016, 37, 2893–2898+2908. [Google Scholar]
- Ni, P.; Mangalathu; Mei, G.; Zhao, Y. Laboratory investigation of pore pressure dissipation in clay around permeable piles. Can. Geotech. J. 2017, 55, 1257–1267. [Google Scholar] [CrossRef]
- Xu, M.; Ni, P.; Mei, G. Centrifuge modelling of permeable pipe pile in consideration of pile driving process, soil consolidation, and axial loading. J. Rock Mech. Geotech. Eng. 2024, in press. [Google Scholar] [CrossRef]
- Umanath, U.; Kasinathan, M. Improved radial consolidation in soft clay using pervious concrete piles. Proc. Inst. Civ. Eng.-Geotech. Eng. 2023, 177, 247–258. [Google Scholar] [CrossRef]
- Lin, W.-K.; Tang, X.-W.; Zou, Y.; Liang, J.-X.; Li, K.-Y. Research on the Bearing Capacity and Sustainable Construction of a Vacuum Drainage Pipe Pile. Sustainability 2023, 15, 7555. [Google Scholar] [CrossRef]
- Tang, X.; Lin, W.; Zou, Y.; Zhou, Y.X.; Gao, Z.J.; Sui, W. Experimental study of the bearing capacity of a drainage pipe pile under vacuum consolidation. J. Zhejiang Univ. Sci. 2022, 23, 639–651. [Google Scholar] [CrossRef]
- Li, Z.; Huang, D. Stability analysis of a water-rich slope stabilized by a novel upper-hollow drainage anti-slide pile. Nat. Hazards 2023, 117, 425–446. [Google Scholar] [CrossRef]
- Zhang, N.; Cui, X.Z.; Zhang, J. Settlement-controlling and pressure-reduction effect of pervious concrete pile under the action of embankment load. J. Shandong Univ. Eng. Sci. 2013, 43, 80–86. [Google Scholar]
- Chen, Z.; Xiao, T.; Feng, J.; Ni, P.; Chen, D.; Mei, G. Mathematical characterization of pile–soil interface boundary for consolidation analysis of soil around permeable pipe pile. Can. Geotech. J. 2021, 58, 1277–1288. [Google Scholar] [CrossRef]
- Han, B.L.; Lu, M.M. Theoretical study of consolidation of composite ground with permeable concrete piles considering pile penetration deformation. Rock Soil Mech. 2023, 44, 2360–2368. [Google Scholar]
- Ma, K.; Gao, Z.; Zhang, Y.; Zong, M.; Wu, W.; Mei, G.; Zong, Z. Analysis of accelerated consolidation effect of permeable pipe pile using coupled MPM-FEM method and continuous drainage boundary condition. Comput. Geotech. 2024, 176, 106720. [Google Scholar] [CrossRef]
- Wang, S.; Ni, P.; Chen, Z.; Mei, G. Consolidation solution of soil around a permeable pipe pile. Mar. Georesources Geotechnol. 2019, 38, 1097–1105. [Google Scholar] [CrossRef]
- Yang, Y.H.; Xin, G.F.; Chen, Y.M. Shaking table test on drainage pile-net composite foundation treated liquefiable subgrade. Rock Soil Mech. 2024, 45, 178–186. [Google Scholar]
- Liu, H.L.; Chen, Y.M.; Zhao, N. Development technology of rigidity-drain pile and numerical analysis of its anti-liquefaction characteristics. J. Cent. South Univ. Technol. 2008, 15, 101–107. [Google Scholar] [CrossRef]
- Deng, Y.B.; Zhang, R.H.; Sun, J.F. Novel technology of statical-drill and rooted drainage pile and its large-scale model test. J. Build. Struct. 2022, 43, 293–302. [Google Scholar]
- Deng, Y.; Zhang, C.; Wang, X. Consolidation theory of implantable drainage pile. Rock Soil Mech. 2023, 44, 2639–2647. [Google Scholar]
- Hardin, B.; Black, W.L. Vibration modulus of normally consolidated clay. J. Soil Mech. Found. Div. 1968, 94, 353–369. [Google Scholar] [CrossRef]
- Duan, J.; Yang, Z.; Guo, R. Failure analysis of soil anchors induced by loose interface under pullout load. Chin. J. Geotech. Eng. 2012, 34, 936–941. [Google Scholar]
- Ye, S.H.; Xin, L.L. Settlement and bearing capacity of single pile based on shear characteristics of pile-soil interface. Rock Soil Mech. 2024, 45, 1457–1471. [Google Scholar]
- JGJ 94-2018; Technical Code for Building Pile Foundations. China Architecture & Building Press: Beijing, China, 2018.
- Cui, X.; Zhang, J.; Chen, D.; Li, S.; Jin, Q.; Zheng, Y.; Cui, S. Clogging of pervious concrete pile caused by soil piping: An approximate experimental study. Can. Geotech. J. 2018, 55, 999–1015. [Google Scholar] [CrossRef]
Disclaimer/Publisher’s Note: The statements, opinions and data contained in all publications are solely those of the individual author(s) and contributor(s) and not of MDPI and/or the editor(s). MDPI and/or the editor(s) disclaim responsibility for any injury to people or property resulting from any ideas, methods, instructions or products referred to in the content. |
© 2025 by the authors. Licensee MDPI, Basel, Switzerland. This article is an open access article distributed under the terms and conditions of the Creative Commons Attribution (CC BY) license (https://creativecommons.org/licenses/by/4.0/).