1. Introduction
The power industry is the largest source of carbon emissions in China [
1], accounting for over 40% of the nation’s total CO
2 emissions [
2]. Its low-carbon transition is closely intertwined with resource consumption, presenting both opportunities and challenges for the sustainability of energy development [
3]. Improving the carbon emission efficiency of the power industry is a crucial task for industrial structure optimization and upgrading [
4] and a key measure for achieving China’s carbon peak and neutrality goals [
5]. Developing a scientific method for evaluating carbon emission efficiency in the power industry is essential for understanding the current state of the industry and guiding future regional planning.
Electricity production involves inputs from both energy and non-energy sources, highlighting the need for a comprehensive evaluation of carbon emission efficiency. Data envelopment analysis (DEA) has been widely employed to assess the carbon emission efficiency of the power industry. As a non-parametric method, DEA overcomes the limitations inherent in parametric methods, such as stochastic frontier analysis (SFA), which require the specification of a functional form for the production frontier [
6]. This provides greater flexibility in assessing carbon emission efficiency. Based on a relative efficiency evaluation, DEA constructs a production frontier through linear programming to assess the relative efficiency of decision-making units (DMUs) [
7]. To overcome the limitations of traditional DEA models in handling input and output slacks, Tone [
8] developed the slack-based measure (SBM) model, an extension of DEA that integrates undesirable outputs such as carbon emissions and hazardous waste into evaluations. Recent studies have applied the SBM model to analyze the provincial carbon emission efficiency in China’s power industry [
9,
10,
11].
Unfortunately, existing SBM efficiency studies in the power industry typically use production-based accounting (PBA) to calculate carbon emissions, which results in unfair assessments of carbon emission efficiency. This is because PBA neglects the important process of inter-provincial electricity transmission [
12], where carbon responsibility transfers occur, leading to biased evaluations of efficiency in both power-importing and power-exporting regions. Fundamentally, this is due to the severe spatial imbalance in electricity generation and demand in China’s power industry [
13,
14]. The eastern coastal regions, which are economically developed, have high electricity demand but lack local energy resources, while the western regions, underdeveloped but rich in coal and hydropower resources, are the main areas for electricity generation [
15]. The West-to-East Power Transmission project has reinforced this structure, with nationwide grid interconnection to facilitate the transfer of electricity [
16,
17]. When carbon emissions are accounted for solely under PBA, electricity-exporting provinces bear additional carbon emission pressure from electricity supplied to other regions. These emissions, however, are driven by the consumption demands of importing provinces [
18]. PBA does not capture the transfer of carbon emission responsibilities, and this can intensify the carbon emission burden on exporting provinces [
19]. Therefore, evaluations of carbon emission efficiency in the power industry in China must consider carbon responsibility transfers to avoid underestimating the efficiency of western regions. This consideration is critical for maintaining interprovincial equity and for improving the overall carbon emission efficiency of the power industry nationwide.
According to recommendations by the United Nations Environment Program (UNEP) [
20] and the World Resources Institute (WRI) [
21], carbon accounting in the power industry should be conducted under the framework of consumption-based accounting (CBA), which attributes emissions to final consumption. This approach traces carbon emission responsibilities in inter-regional trade, more accurately reflecting emissions in consumption regions [
22]. The multi-regional input–output (MRIO) model is an effective tool under the CBA framework, capable of tracking carbon transfers across regions and industries. It has been widely applied in studies of regional carbon transfer networks [
23,
24]. Recently, Wang and Feng applied the MRIO model to trace carbon transfers from inter-regional electricity transmission, successfully calculating regional missions [
25,
26]. Similarly, Zhao employed the MRIO model to account for carbon transfers in China’s power industry from the perspective of both production and consumption [
27]. Although the MRIO model has been employed for tracing carbon responsibility transfers, it has not yet been used to evaluate carbon emission efficiency in the power industry.
This study proposes an advanced method for evaluating carbon emission efficiency in China’s power industry by incorporating carbon transfers from inter-provincial electricity transmission. By integrating the MRIO model with the SBM efficiency evaluation framework, we more accurately quantify carbon emissions and reduce parameter deviations that could otherwise bias efficiency assessments. This approach improves the understanding of inter-regional carbon transfers’ impact on national carbon emission distribution, providing a comprehensive and dynamic perspective on carbon emission efficiency and more accurately capturing the effects of power transmission on emission assessments.
The rest of this paper is organized as follows:
Section 2 details the study methods and materials, including the MRIO and SBM models.
Section 3 presents the research results, followed by a discussion of the methodology and findings in
Section 4.
Section 5 concludes this study and offers policy recommendations.
2. Materials and Methods
We propose a carbon emission efficiency evaluation model for China’s power industry that incorporates carbon transfers. The model involves two main steps.
First,
Section 2.1 utilizes Python 3.12 software to process the MRIO table data and calculates the carbon emissions of the provincial power industry from the perspective of both production and consumption. Total carbon emissions under the PBA framework (
) are derived from CO
2 emission inventories of the power industry. Total carbon emissions under the CBA framework (
) are calculated using the MRIO model, which traces carbon transfers across regions.
Second,
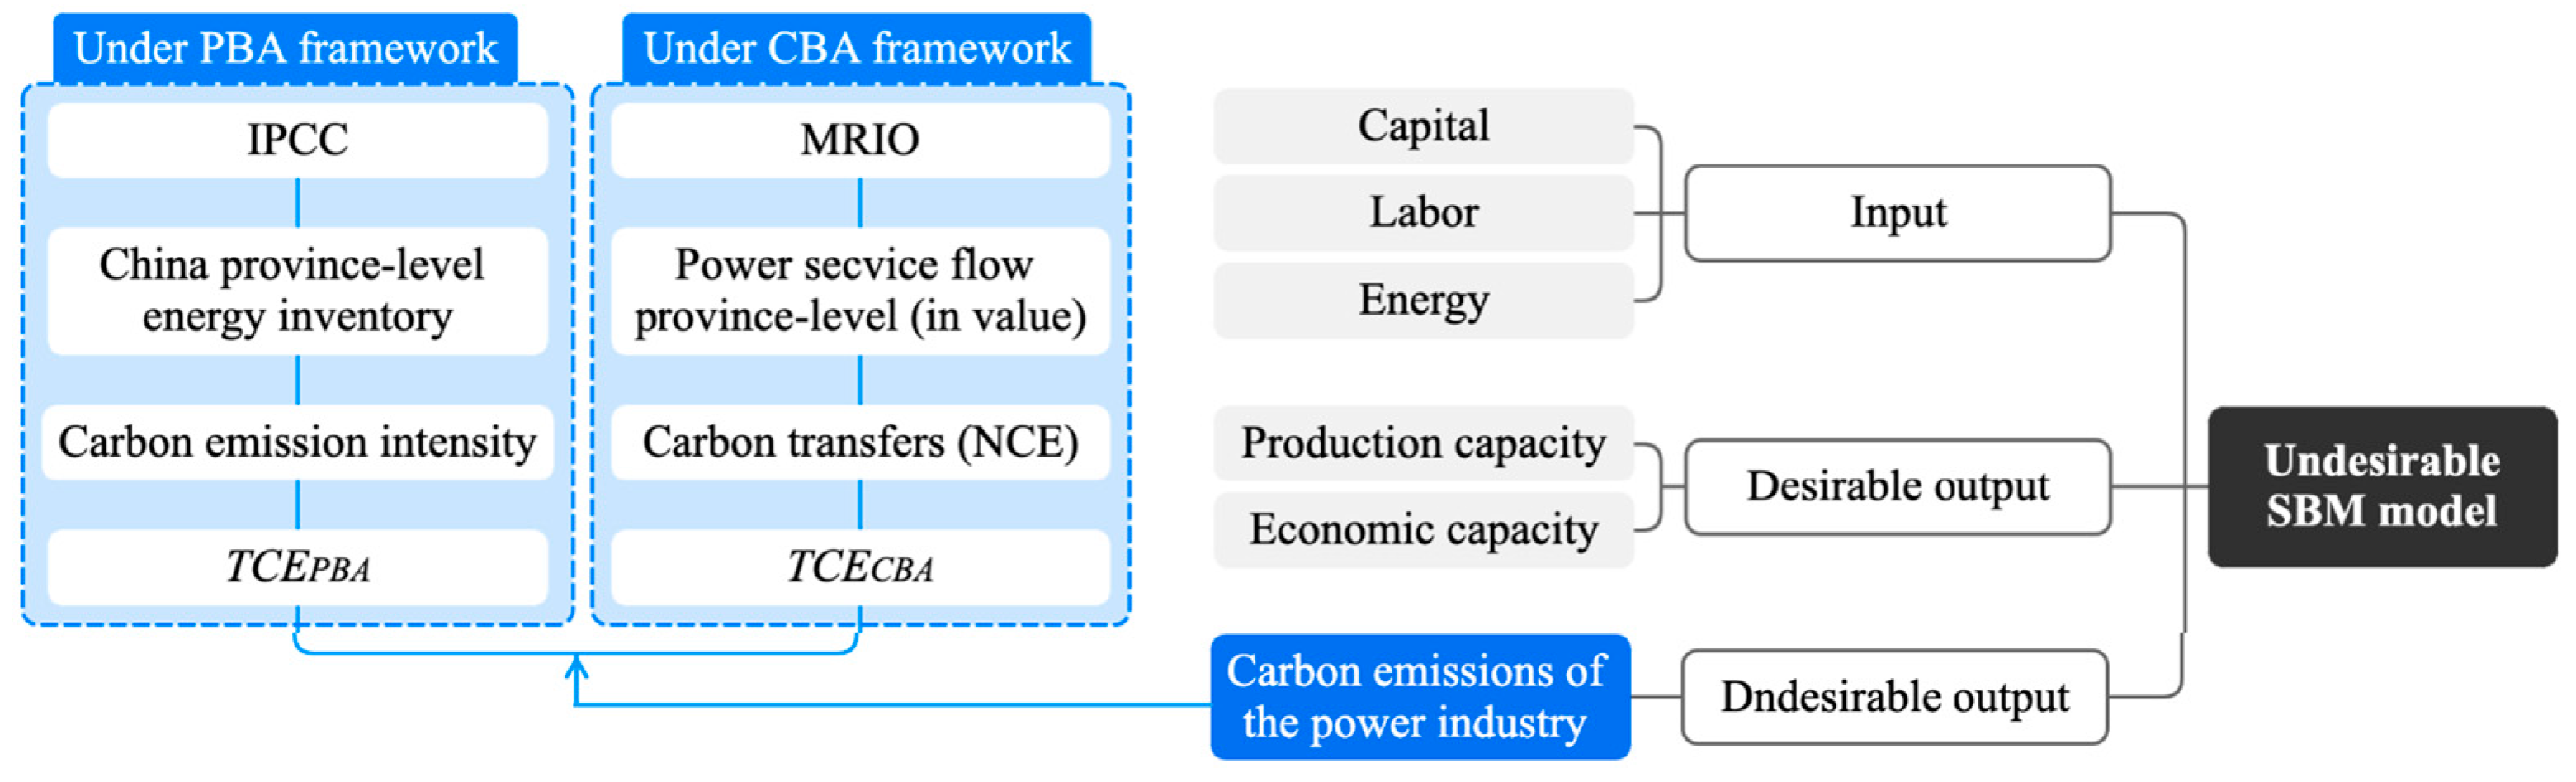
Section 2.2 develops the Undesirable-SBM model. Carbon emissions calculated under the PBA and CBA frameworks are incorporated as undesirable output parameters to evaluate the carbon emission efficiency of the power industry across 30 provinces in China for the years 2012, 2015, and 2017.
2.1. Carbon Emissions Calculation Based on MRIO
The MRIO model divides the output into two parts: intermediate inputs and final demand, reflecting the characteristics of the supply chain. Suppose there are
m regions and
n sectors. The total output of sector
i in region
p (
) can be expressed as follows:
Here, and , respectively, represent the intermediate inputs and final demand of sector i in region p for sector j in region q, as recorded in the input–output table.
Following Leontief’s methodology [
28], the direct consumption coefficient (
) represents the proportion of sector
i’s intermediate input used by sector
j in region
q. Numerically, it is defined as the ratio of the intermediate input of sector
i in region
p (
) to the output of sector
j in region
q (
). Equation (1) can then be simplified:
where
A is the direct consumption coefficient matrix,
X is the intermediate input matrix, and
Y is the final demand matrix. From Equation (2), the total output can be derived as
where
is a Leontief inverse matrix that represents the matrix of product requirements from sector
i to meet the production needs of sector
j.
For the power industry,
can be calculated based on fossil fuel combustion in the power sector, following the approach for calculating CO
2 emissions of the Intergovernmental Panel on Climate Change (IPCC) [
29]:
Here, represents the quantity of consumption of fossil fuels n, while indicates the net calorific value of fossil fuels n. represents the carbon emission coefficient of fossil fuels n, indicating the amount of carbon emissions per unit of net calorific value, and is the carbon oxidation factor of fossil fuel n. is the molecular weight ratio of carbon dioxide. The selection of energy types is based on the China Energy Statistical Yearbook (2016) created by the Department of Energy Statistics, National Bureau of Statistics, People’s Republic of China.
To analyze the environmental impact of electricity transmission, the MRIO model is adapted to account for regional environmental factors. A vector
is introduced to represent the carbon emissions per unit output of the power sector in region
p:
where
represents the total output of the power industry in region
p. The carbon emissions of the power sector in region
p (
) can be expressed as follows:
Here,
denotes the final demand vector of the power industry in region
p, and
represents the export vector for the sector, as recorded in the input–output table. The total carbon emissions of the power industry can be divided into two components: direct carbon emissions triggered by final demand, and embodied carbon emissions resulting from inter-provincial power transmission. The emissions generated by final demand (
) are given by
. The carbon emissions embodied in exports (
) and imports (
) are, respectively, expressed in Equations (7) and (8) [
3].
Here,
represents the export vector, and
is the import vector, as recorded in the input–output table. The net carbon transfer (
) of the power industry in region
p is calculated as the difference between
and
:
is calculated from Equations (4) and (9) as follows:
2.2. Carbon Emission Efficiency Evaluation Based on SBM
In the output-oriented SBM model, it is assumed that the production system consists of
n DMUs, each utilizing
m types of inputs (
x),
types of desirable outputs (
), and
types of undesirable outputs (
). The SBM model for undesirable outputs is expressed as follows:
In the SBM model for evaluating carbon emission efficiency in the power industry, we select capital, labor, and energy as input variables. Production capacity and economic capacity are treated as desirable output variables, while carbon emissions from the power industry are considered as the undesirable output variable. This study further refines the calculation of the undesirable output variable parameter. To account for the impact of carbon transfers caused by inter-provincial power transmission, we apply two frameworks when quantifying carbon emissions: production-based emissions (
) and consumption-based emissions (
). Subsequently, the carbon emission efficiency of the power industry is calculated under both the production-based and consumption-based principles. This dual-perspective efficiency evaluation provides a more comprehensive assessment of the impact of carbon transfers on the carbon emission efficiency of each province.
Figure 1 provides a flowchart of the SBM model, highlighting the key steps where the MRIO model results are used to correct deviations in the SBM model’s undesirable output parameters.
In the SBM model, λ represents the intensity vector, while correspond to the slack variables for inputs, desirable outputs, and undesirable outputs, respectively. , where represents the relative efficiency of a DMU and serves as a measure of the carbon emission efficiency for each province. is the objective function dependent on the slack variables and satisfies . A DMU is considered technically efficient if and only if , meaning that . This indicates no inefficiency in inputs, desirable outputs, or undesirable outputs. When , the DMU is technically inefficient and requires improvements in its input and output indicators to achieve technical efficiency.
Because the Undesirable-SBM model involves non-linear relationships, its computational process can be complex. To simplify the calculations, it can be transformed into a linear programming form, as shown in Equation (12). Using this linearized form, the carbon emission efficiency of the power industry in each province can be determined.
2.3. Data Sources
2.3.1. Data Sources for the MRIO Model
We studied 30 provinces in China and excluded Tibet, Hong Kong, Macao, and Taiwan. The MRIO tables for 2012, 2015, and 2017 were sourced from the Carbon Emission Accounts & Datasets [
30,
31]. Energy consumption data for the power industry, along with the average lower calorific value of various fuels, were sourced from the China Energy Statistical Yearbook. The carbon oxidation rate and emission factors were taken from the Provincial Greenhouse Gas Inventory Compilation Guidelines, supplemented by the IPCC (2006). Inter-provincial trade data were derived from the Production and Supply of Electric and Thermal Power sector in China’s MRIO tables. As such, the scope of electricity transmission in our study extends beyond direct electricity flows to encompass broader electricity-related products and services. This comprehensive perspective ensures a more holistic analysis of the carbon responsibilities associated with inter-provincial electricity exchanges.
The MRIO data used in this study were sourced from the China Emission Accounts and Datasets (CEADs), developed by the Institute of Geographic Sciences and Natural Resources Research (Chinese Academy of Sciences) and the University of East Anglia. CEADs integrates authoritative data from institutions such as the National Bureau of Statistics, the Energy Statistical Yearbook, and the International Energy Agency, ensuring high-quality, consistent, and globally applicable data. First, the CEADs database is widely recognized in global environmental accounting for its integration of international standards and localized data, providing authoritative and reliable sources. Second, the extensive use of the database in research further validates its scientific credibility, as demonstrated by studies such as Guan et al. [
32] on virtual water flow in the Yellow River Basin and Zheng et al. [
33] on low-carbon transitions in major Chinese cities. Lastly, regular updates and strict quality control ensure that the data remain current and reliable.
2.3.2. Data for the SBM Model
The SBM model data include three types of variables: input variables, desirable output variables, and undesirable output variables.
Input variables include capital, labor, and energy, selected based on macroeconomic principles. Fixed capital investment serves as the indicator for capital input, while labor input is represented by the employed population in each province. Energy input is quantified as energy consumption, measured in standard coal equivalent. The data for fixed capital investment and labor were sourced from the China Energy Statistical Yearbook, and energy consumption data were obtained from the Provincial Energy Inventory in the Carbon Emission Accounts & Datasets database.
Desirable output variables represent the production and economic capacity of the power industry. Electricity generation is used as an indicator of production capacity, while economic capacity is measured by the gross regional product (GRDP) of the power industry. Data on electricity generation were sourced from the China Energy Statistical Yearbook, and GRDP values were sourced from the MRIO table to ensure consistency with regional economic analysis.
The undesirable output variable refers to the carbon emissions of the power industry, represented by two values: production-based accounting (
), which reflects carbon emissions under the producer responsibility framework; and consumption-based accounting (
), corresponding to the consumer responsibility framework.
Table 1 provides details on the variables and indicators selected for the SBM model, along with their corresponding units.
3. Results
3.1. Provincial Carbon Emissions in the Power Industry
Using provincial carbon emission inventories and GRDP data derived from the MRIO table, we calculated the total carbon emissions and carbon intensity of the power industry for each province, providing insights into regional variations in electricity generation. The results are detailed in
Figure 2.
Figure 2a illustrates the total carbon emissions of China’s power industry. The findings reveal that the industry emits an average of 5000 Mt annually, with emissions showing a steady upward trend. Significant regional disparities are evident: Shandong, Inner Mongolia, and Jiangsu had the highest emissions, each exceeding 400 Mt and together accounting for approximately one-third of the national total, consistent with the findings of Zhao et al. [
34]. Guangdong and Hebei also exhibited notable emissions, surpassing 250 Mt each. By contrast, Beijing and Hainan had the lowest emissions, each under 50 Mt.
Figure 2b compares the carbon intensity of the power industry across provinces. The carbon intensity is defined as carbon emissions per unit of economic output, reflecting regional energy production efficiency. The national average carbon intensity of the power industry is 8.9 tons per CNY 10,000. Northern and northwestern provinces are predominantly reliant on coal-fired power generation [
35] and exhibited significantly higher carbon intensities, often exceeding 25 tons per CNY 10,000—five times higher than those of southeastern coastal regions. By contrast, economically advanced areas such as Beijing and Shanghai had significantly lower carbon intensities, approximately 5 tons per CNY 10,000. Southwestern provinces benefit from abundant clean energy resources such as wind, hydroelectric, and solar power [
36] and achieve low-carbon electricity production, with a carbon intensity of only one-third of the national average.
3.2. Provincial Carbon Transfers in the Power Industry
Using the MRIO model,
,
, and the carbon transfers of the power industry across provinces were calculated. The results are illustrated in
Figure 3. Specific data can be found in
Table A1 in
Appendix A. Provinces with positive carbon transfers shift carbon emission responsibilities, while provinces with negative transfers absorb additional emissions from electricity transmission. Mainland China is divided into eight regions based on the classification by the National Information Center [
37]. In 2017, the total carbon emissions in China were 5070 Mt under both the PBA and CBA frameworks. This consistency demonstrates that the accounting frameworks influence only the inter-provincial distribution of emissions, without altering the national total.
Under the CBA framework, carbon emissions in electricity-importing provinces increased significantly. For instance, Beijing’s emissions surged from 28.32 Mt under PBA to 163.79 Mt under CBA. Similarly, Hebei, Jiangsu, and Guangdong experienced notable increases in their carbon emissions. By contrast, electricity-exporting provinces, such as Inner Mongolia and Xinjiang, observed substantial reductions in emissions. Inner Mongolia’s emissions decreased from 485.29 Mt to 369.60 Mt, while Xinjiang’s emissions dropped by 50 Mt. Meanwhile, provinces like Tianjin exhibited minimal changes, likely due to their balanced power production and consumption structure, resulting in limited carbon transfers.
Regarding carbon transfers associated with electricity transmission, Beijing displayed the most significant outflow, annually shifting over 100 Mt of carbon emission responsibility to other provinces. Hubei and Guangdong also showed substantial transfers. Northwestern provinces, particularly Inner Mongolia, Shanxi, and Xinjiang, absorbed the majority of these transferred emissions, accounting for 68% of total carbon transfers from inter-provincial electricity transmission. Eastern coastal regions act as key outflow areas, while northeastern and western regions serve as critical inflow regions in the inter-provincial carbon transfer process.
3.3. Provincial Carbon Emission Efficiency in the Power Industry
Using the output-oriented SBM model, we evaluated the carbon emission efficiency of the power industry across 30 provinces in China for 2012, 2015, and 2017, as summarized in
Table 2. The SBM efficiency values are dimensionless and represent relative efficiency, allowing for comparisons among the decision-making units (DMUs). The results indicate that 32% of provinces had moderate efficiency levels (0.5–0.8), highlighting the need for further enhancements. Meanwhile, 48% of provinces exhibited efficiency values below 0.5, underscoring the importance of energy-saving measures and technological advancements in electricity production. By contrast, 20% of provinces achieved efficiency levels above 0.8, reflecting effective carbon management practices and high production efficiency. Overall, with rapid economic growth, provincial carbon emission efficiency experienced fluctuations but demonstrated a general upward trend overall.
At the regional level, significant disparities in carbon emission efficiency are evident. Eastern coastal provinces demonstrated superior performance, such as Jiangsu and Shanghai, which achieved efficiency levels above 0.80, with the Beijing–Tianjin region’s average efficiency at 0.78. This is likely due to the more developed economy in these coastal regions, which is accompanied by stricter environmental regulations and the use of cleaner technologies [
38]. By contrast, provinces in central China and northeastern regions typically had efficiency levels below 0.60. This is due to their heavy reliance on energy-intensive, high-pollution thermal power generation technologies [
39], indicating substantial potential for improvement in carbon emission management. The spatial distribution of carbon emission efficiency, with higher efficiency in coastal regions and a decline toward the central regions, closely aligns with the findings of Liu et al. [
4].
A comparison of efficiency evaluations under the PBA and CBA frameworks clearly demonstrates the substantial influence of the accounting framework, especially for regions importing and exporting electricity. For example, in 2017, Beijing’s efficiency ranked at the frontier under PBA but decreased to 0.81 under CBA, indicating that CBA effectively accounts for the carbon emission pressures transferred through imported electricity. Similarly, electricity-importing provinces such as Shanghai, Anhui, and Guangdong had lower efficiencies under CBA. Conversely, electricity-exporting regions like Inner Mongolia markedly improved in efficiency under CBA, increasing from 0.58 in 2012 to 0.77 in 2017. This demonstrates that accounting for carbon transfers significantly improves the carbon emission efficiency of electricity-producing regions.
4. Discussion
4.1. Improvements and Limitations of the MRIO-SBM Model
We proposed an improved method for evaluating carbon emission efficiency in the power industry by integrating the SBM model with MRIO calculations. The approach was successfully applied to assess the carbon emission efficiency of the power industry across 30 provinces in China for 2012, 2015, and 2017.
This method offers two key advantages. First, the MRIO model, recognized as an effective tool for tracking supply chains and analyzing inter-regional spillover effects [
31], provides a systematic approach for tracing carbon responsibility transfers during inter-provincial electricity exchanges. By incorporating the MRIO model, carbon transfers associated with inter-regional electricity transmission are accurately tracked and accounted for, improves the accuracy of carbon emission accounting.
Second, by refining the calculation of CO2 emissions in the SBM model using MRIO accounting results, this approach enhances the accuracy of carbon emission efficiency evaluations. It clarifies the impact of carbon transfers on provincial efficiency by accounting for the additional carbon emission pressure that electricity-exporting regions previously bore but was overlooked. Our empirical analyses of the power industry’s carbon emission efficiency for 2012, 2015, and 2017 validate the effectiveness of combining the MRIO and SBM models. By incorporating MRIO, the SBM model corrects for biases resulting from unaccounted carbon transfers, leading to more accurate and equitable efficiency assessments. This study offers valuable insights for developing more targeted and fairer regional carbon management strategies.
However, this study has several limitations. First, the timeliness of the MRIO-SBM model is constrained by the availability of MRIO data. Due to the large-scale data requirements and computational complexity of constructing MRIO tables, their updates are relatively infrequent, with the latest dataset available extends only up to 2017. As a result, the MRIO-SBM efficiency model does not fully reflect recent changes in China’s power sector, owing to this time lag. Second, carbon emission accounting in this study relies primarily on input–output tables and energy statistical yearbooks, which may not fully capture the detailed pathways of inter-regional electricity flows or variations in energy structures. (e.g., between traditional thermal power and renewable energy).
4.2. Spatiotemporal Distribution of Carbon Emission Efficiency
An analysis of provincial carbon emission efficiency for 2012, 2015, and 2017, as depicted in
Figure 4, revealed significant regional disparities, closely aligned with economic development levels. Economically advanced regions, such as the Beijing–Tianjin–Hebei area and eastern coastal provinces, demonstrate superior efficiency levels. For example, the average efficiency in the Beijing–Tianjin–Hebei area increased from 0.69 in 2012 to 0.85 in 2017, while eastern coastal provinces consistently maintained efficiency levels above 0.8. Notably, the boxplot lengths for these regions shortened from 2012 to 2017, indicating that carbon emission efficiency has become more concentrated and stable over time.
By contrast, less developed regions, including the northeast and northern coastal areas, generally exhibited carbon emission efficiency ranging from 0.5 to 0.7. The taller box lengths in the boxplots for these regions highlight significant variability in efficiency levels across provinces, underscoring pronounced regional disparities.
Specifically, provinces such as Shanghai, Beijing, and Guizhou have relatively high levels of efficiency but with potential for further improvement. By contrast, central, northwestern, and southwestern regions exhibit carbon emission efficiency levels significantly below the national average, underscoring the need for targeted policy interventions. These regions should prioritize carbon reduction initiatives in the power industry by implementing advanced and clean production technologies and leveraging best practices from regions with higher efficiency levels. Furthermore, these regions may suffer from inefficiencies in resource allocation, which require adjustments such as increased investment in capital and labor and optimized structures that enhance carbon emission efficiency in the power industry.
4.3. Impact of Carbon Transfers on Carbon Emission Efficiency
To reveal the differences in carbon emission efficiency evaluated under the PBA and CBA frameworks,
Figure 5 illustrates the impact of carbon transfers on efficiency changes in the CBA-SBM model. The five provinces with the most pronounced efficiency deviations were selected as representative cases, and their results are presented in
Figure 5. This analysis highlights how carbon transfers influence efficiency evaluations in both power-importing and power-exporting regions. Without incorporating the effects of inter-regional electricity transmission, the carbon emission efficiency of certain regions may not represent their actual circumstances.
In major electricity-exporting provinces such as Inner Mongolia and Ningxia, additional carbon emission responsibilities from electricity exports lead to underestimated efficiency under the PBA framework. For instance, in 2015 and 2017, Inner Mongolia’s carbon transfers increased from 224.77 Mt to 256.16 Mt, resulting in its CBA-SBM efficiency improving from 0.59 to 0.71 and from 0.65 to 0.77, respectively. Similarly, under the CBA framework, Ningxia, with carbon transfers of 54.25 Mt in 2015 and 48.06 Mt in 2017, increased by 0.19. This improvement is attributed to the CBA framework, which reallocates carbon responsibilities to the provinces where electricity is consumed, thereby enhancing the carbon emission efficiency of electricity-exporting regions.
By contrast, electricity-importing provinces such as Beijing and Shanghai, which were reassigned to the carbon emissions previously borne by exporting regions, experienced declines in SBM-CBA efficiency. For instance, Beijing’s efficiency dropped from the optimal score of 1.00 under PBA in both 2015 and 2017 to 0.81 under CBA. Shanghai’s efficiency also declined during the same period, with an average decrease of approximately 0.10. These findings reveal the carbon transfer effects of electricity transmission. Coastal regions, as well as Beijing and Tianjin, rely heavily on electricity imports, with deceptively low emissions as a result of outsourcing high-carbon production. The PBA framework, by failing to account for emissions associated with imported electricity, masks the true environmental pressures borne by these regions, leading to biased assessments of their carbon emission efficiency.
As a result, the PBA framework introduces biases in carbon emission efficiency evaluations: electricity-importing coastal regions are often overestimated in their efficiency levels while electricity-exporting central and western regions are underestimated. These inaccuracies stem from the misallocation of carbon responsibilities. By reallocating carbon responsibilities to electricity-consuming regions, the CBA framework provides a more accurate and equitable assessment of the true carbon burden associated with electricity production and consumption. This correction not only addresses biases in efficiency evaluations but also clarifies the actual environmental pressure faced by both importing and exporting regions. The CBA-SBM model enhances the accuracy and fairness of carbon emission efficiency evaluations, establishing a solid foundation for developing targeted and equitable regional emission reduction policies. By ensuring that regions with greater carbon burdens receive appropriate support and incentives, this model facilitates the development of balanced and effective carbon management strategies from a holistic perspective.
5. Conclusions
We proposed an improved method for evaluating the carbon emission efficiency of China’s provincial power industry by integrating CBA-based carbon emissions into the SBM model. The approach refines undesirable output parameters, providing more accurate representations, and it enhances the objectivity of efficiency evaluations. By accounting for carbon transfers, we assessed the carbon emission efficiency of 30 provinces in 2012, 2015, and 2017. We highlighted the carbon responsibility transfers arising from inter-regional electricity transmission and examined their impact on efficiency. The main conclusions are summarized as follows.
First, the proposed method enhances the accuracy and representativeness of SBM model evaluations by integrating an improved carbon accounting method. By incorporating the MRIO model under the CBA framework, carbon responsibility transfers are effectively tracked and accounted for, addressing biases in traditional PBA approaches that neglect carbon transfers. This optimization improves both the precision and equity of efficiency evaluations. Furthermore, the combined MRIO-SBM method is applicable to other inter-regional or international electricity transfer scenarios. Our study provides valuable insights into carbon transfer patterns and their impact. Meanwhile, this study has limitations, particularly in terms of data timeliness and accuracy.
Second, significant imbalances exist in the carbon emission efficiency of provincial power industries. The production frontier is mainly located in economically developed eastern coastal regions such as Shanghai and Jiangsu. In 2017, their SBM-CBA carbon emission efficiencies were 0.92 and 1.00, reflecting high efficiency and low-carbon production. By contrast, northeastern and western regions have lower efficiencies, typically ranging from 0.5 to 0.7, indicating inefficient resource and energy utilization with notable potential for enhancement. Overall, carbon emission efficiency is higher in developed areas. Less-developed regions require urgent enhancements. Energy policies should prioritize these regions by optimizing energy structures and fostering cleaner and more efficient production practices to address disparities.
Finally, evaluating the carbon emission efficiency of the power industry requires a comprehensive consideration of the carbon transfer effects induced by energy transmission. Ignoring inter-regional carbon transfers distorts efficiency assessments, leading to overestimations in electricity-importing regions, such as eastern coastal provinces, and underestimations in electricity-exporting regions in central and western China. For instance, under CBA, Beijing’s efficiency was overestimated by up to 19%, while central and western provinces were underestimated by around 10%. By assigning carbon responsibility to end users, CBA accurately reflects the true burden of emissions. This ensures realistic efficiency evaluations and supports the development of balanced and considered emission-reduction policies.
The results reveal significant biases in current carbon emission accounting and efficiency assessments, particularly the failure to account for carbon transfers from inter-regional electricity transmission. This leads to imbalanced responsibility allocation and underestimated carbon emission efficiency in exporting regions. For future carbon accounting, we recommend integrating a hybrid accounting framework. A production-consumption-sharing model should ensure that electricity-importing provinces bear their carbon responsibility, while exporting provinces receive policy compensation, fostering fairer regional cooperation in emission reductions. Furthermore, promoting low-carbon collaboration between eastern and western regions is crucial. Carbon management policies should adopt a variety of approaches to support a coordinated energy transition, including exploring carbon trading markets and fostering low-carbon technology innovation. Specifically, for low-efficiency provinces, policies should prioritize initiating targeted green energy development programs, incentivizing the adoption of cleaner energy technologies, and providing financial support for renewable energy infrastructure.


