Article

Regional Water Footprint for a Medium-Size City in the Metropolitan Area of Barcelona: Gavà

by
Iago Ferreiro-Crespo
1,2,*,
Pedro Villanueva-Rey
1,
Mario Ruiz
3,
Yago Lorenzo-Toja
4 and
Gumersindo Feijoo
2
1
Galician Water Research Center Foundation (Cetaqua Galicia), AquaHub—A Vila da Auga, Rúa José Villar Granjel 33, 15890 Santiago de Compostela, Spain
2
CRETUS, Department of Chemical Engineering, Institute of Technology, Universidade de Santiago de Compostela, 15782 Santiago de Compostela, Spain
3
Aigües de Barcelona, Empresa Metropolitana de Gestió del Cicle Integral de l’Aigua, S.A., General Batet 1-7, 08028 Barcelona, Spain
4
Aquatec-Proyectos para el Sector del Agua, 28037 Madrid, Spain
*
Author to whom correspondence should be addressed.
Sustainability 2025, 17(5), 2302; https://doi.org/10.3390/su17052302
Submission received: 31 January 2025 / Revised: 26 February 2025 / Accepted: 27 February 2025 / Published: 6 March 2025

Abstract

:
Assessing water demand is essential for urban planning, aligning with socio-economic and climatic needs. The territorial water footprint identifies water requirements across sectors and detects sources of consumption. This aids in mitigating impacts and evaluating alternative water sources like reclaimed water. In Gavà, water impacts were assessed for residential, commercial, municipal, tourism, industrial, agricultural, and livestock sectors. The total water footprint is 6,458,118 m3, comprising 3,293,589 m3 from blue water, 2,250,849 m3 from green water, and 913,680 m3 from grey water. Agriculture (54.2%), residential (30.9%), and industrial activities (5.8%) are the main water footprint contributors. A key methodological advancement of this study is the refinement of grey water footprint calculations for livestock facilities within the RWF framework, allowing for a more precise assessment of their environmental impact. Integrating geographic information systems with land use mapping helps localize impacts, detect hotspots, and identify infrastructure improvement opportunities.

Graphical Abstract

1. Introduction

Global warming is projected to cause substantial changes in natural water cycles on global and regional scales [1]. Changes in precipitation and evaporation are related to the Earth’s energy balance, since due to the increase in global temperature, these balances are being altered. Regional-scale humidity is directly influenced by temperature and modifies global rainfall and evaporation rates [2], thereby influencing patterns of drought [3] and extreme precipitation [4]. This is especially the case in the densely populated Mediterranean regions, where the effect of global warming on natural resources is most evident, with reported statistics of increased frequency of droughts and floods accompanied by a decrease in precipitation [5]. In order to establish climate change mitigation actions and to face a scenario of drought and torrential rains, indicators must be available to provide valuable information to water cycle managers and governmental authorities and institutions in order to assess the availability of water in their territories.
Originally, Hoekstra and Hung introduced the concept of the Water Footprint (WF), which refers to the cumulative virtual water content of all goods and services consumed by individuals in a country [6]. The WF can be considered as an integral indicator of the use of freshwater resources, alongside the traditional and restricted measure of water abstraction [7]. The WF indicator is accurate, comprehensive, and allows one to determine the amount and type of water consumed [8], so that it is possible to estimate the green WF as the volume of rainwater consumed during the production of agricultural and forestry products [7], the blue WF as an indicator of conjunctive use of fresh surface or groundwater [7], and the grey WF as an indicator of the degree of freshwater pollution that may be associated with the process step. In this case, it is defined as the volume of freshwater required to assimilate the pollutant load based on natural background concentrations and existing water quality standards [7].
WF studies can be applied to different settings, from businesses or products to national or sub-national studies. In all cases, WF is divided into its three indicators (green, blue, and grey) and direct and indirect water use. Direct WF relates directly to the appropriation or pollution of water in the basin and indirect WF is connected to the supply chain of an activity, product or the behaviour of a region. In this study, in order to understand the pressure of human activities on the territory, the Regional Water Footprint (RWF) only takes into account the direct WF.
To better understand territorial water use patterns, the Water Footprint Network (WFN) developed the RWF [7], a methodology that integrates average or basin-specific WF data from geographically explicit databases. The RWF has emerged as a crucial indicator for assessing water demand, offering flexibility across different case studies and enabling multi-sectoral assessments. Unlike traditional water accounting approaches that focus solely on agricultural or industrial water use, RWF allows for a more holistic evaluation of water consumption across various economic sectors, including urban, commercial, livestock, and tourism activities. This makes it a powerful tool for regional and municipal water planning, as it provides insights into how different sectors contribute to water demand and where efficiency measures can be implemented.
Several previous studies have applied regional water footprint analysis in diverse contexts, highlighting the importance of spatial and sectoral variations in water use. Vanham and Bidoglio [9] assessed Milan’s water footprint, emphasizing the significance of virtual water flows in imported goods and how cities depend on external water resources. Zhang et al. [10] investigated regional water footprints and virtual water transfers in China, demonstrating how interregional trade affects local water availability and the need for coordinated water management policies. Li et al. [11] examined the driving forces behind crop-related water footprints and virtual water flows in the Beijing–Tianjin–Hebei region, showcasing the role of agricultural intensification and policy interventions in shaping water use trends. Aldaya et al. [12] applied the grey water footprint to quantify diffuse nitrogen pollution in Navarra, Spain, highlighting the impact of fertilizer use and runoff on water quality. Meanwhile, Kong et al. [13] analyzed the spatiotemporal variations in agricultural grey water footprints in China, identifying key influencing factors such as climatic variability, land use changes, and irrigation practises.
Although most RWF studies have focused primarily on the agricultural sector, neglecting other economic activities, the methodology has the potential to encompass a broader range of sectors, enhancing territorial water management.
Urban areas present a complex interplay of direct and indirect water consumption, with domestic, industrial, and service-related activities contributing significantly to regional water demand. By applying a multi-sectoral approach, RWF provides a more comprehensive understanding of water consumption patterns, allowing for the identification of context-specific measures for footprint reduction, impact mitigation, and compensation strategies. Expanding the application of RWF beyond agriculture is particularly relevant for water-stressed regions, where integrating alternative water sources, demand management policies, and technological solutions is essential for ensuring long-term sustainability.
The main objective of this study is to develop the first comprehensive RWF analysis that considers the main economic and social sectors at the municipal level, with the municipality of Gavà, with a population of 46,931 inhabitants [14], as a case study. A key part of the study is the collaboration with Urban Water Cycle managers (UWCM) in the territory, which provide the sectoral water demand data. The agricultural, industrial, livestock, municipal, and tourism sectors were included, as well as the water consumption of the population because of their importance demand at the municipal level. The gap to be filled is to complete a first RWF based on real data from the UWCM and to integrate demand data from the agricultural, livestock, or tourism sector based on WF studies. In addition, new concepts developed explicitly to measure the impact on the RWF are included, such as the calculation of the grey WF of livestock farming.
The results obtained are expected to be valid and representative, as it is a robust methodology, mainly based on turnover data from the different economic sectors and the integration of geolocalisation of demand in order to favour decision-making related to water management. It allows governments and the UWCM to know in depth the nature of water demands and to implement water reduction or compensation plans.

2. Materials and Methods
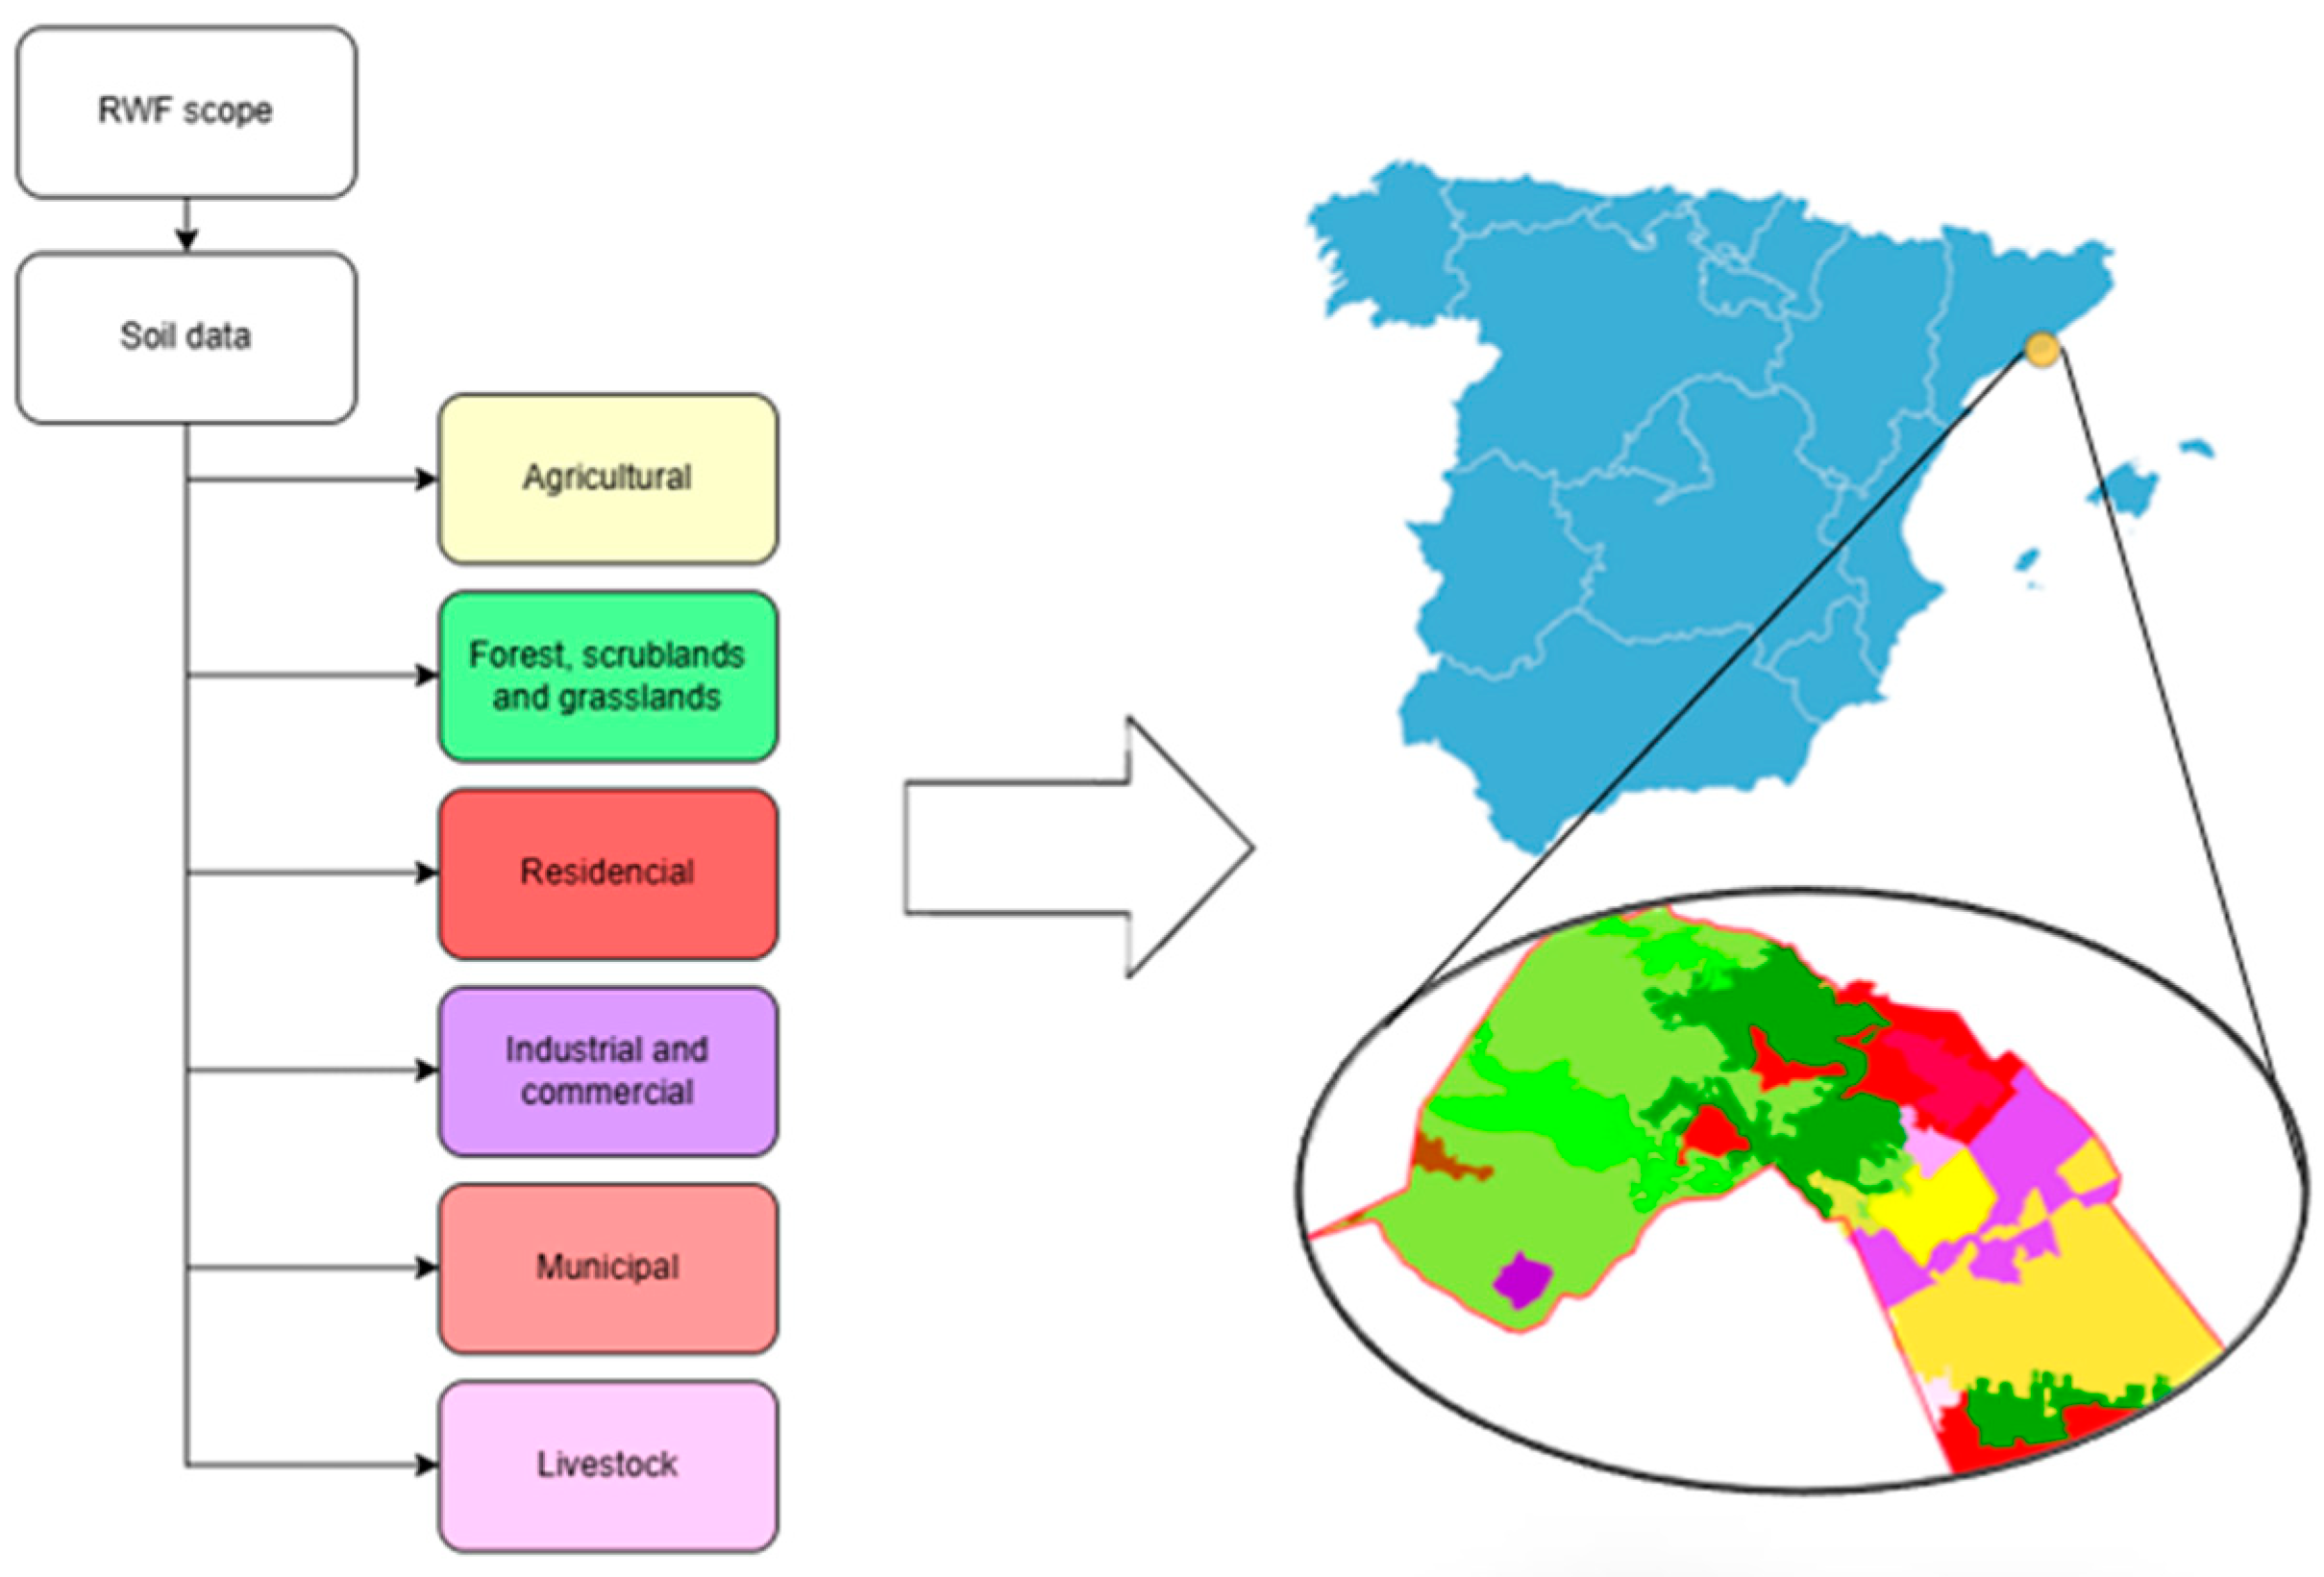
2.1. Land Uses

The RWF requires a broad knowledge of the territory under study, and determining the different sectors—agricultural, residential, industrial, commercial, livestock, and areas with environmental use as forest, scrublands, and grassland—is key for a correct analysis of each case study (Figure 1). The WF of agriculture is determined by the different types of crops and the climatic conditions. Residential, municipal, commercial, and industrial uses demand both tap water and one’s own abstractions. In livestock farming, consumption is directly related to the type of farm. While the remaining territory, consisting of arboreal lands, scrublands, and meadows, is not taken into consideration for the calculation of the RWF, as long as it complies with a natural land use or is not related to economic activities such as the timber or fodder industry.

2.2. Water Footprint Methodology per Economic Activity

2.2.1. Agricultural and Silviculture

The local impact of livestock carbon footprint [15] is a more studied field than the WF is today. In all countries, WF related to agricultural production accounts for the largest share of total WF [16]. Water consumption by crops varies substantially around the world, reflecting differences in crop density, crop choice, soil characteristics, irrigation availability and farm management, as well as climatic drivers of evapotranspiration [17]. Because of this, FAO defined a model to assume the water requirements of green and blue WFs [18] and implemented it in the CROPWAT 8.0 model [19]. Using this model, Mekonnen and Hoekstra [20] developed a dynamic grid-based water balance using a daily soil water balance that calculates crop water requirements for different regions of the world. In this study, the green, blue, and grey WFs of crops are calculated from this database for the region of Catalonia [21], integrating detailed production data per cultivated hectare, as provided in Supplementary Table S1 [22,23]. This Supplementary Table contains specific crop yield values, water consumption rates, and corresponding WF calculations, which serve as a crucial reference for the RWF estimation.
The green WF refers to the human use of evaporative flow from the land surface, mainly for crop cultivation or forestry production [24]. Therefore, it takes into account land that has been anthropized for purposes such as crop cultivation or timber production. In the case of forests, meadows, or scrubland areas that are autochthonous to the land, they are not accounted for in the RWF calculation as their green WF is intrinsic to the land.

2.2.2. Livestock

The virtual water content of an animal at the end of its life span is defined as the total volume of water that was used to grow and process its feed, to provide its drinking water, and to clean its housing and the like [25]. The present study incorporates a new variable particularly relevant in the RWF, the grey WF produced by animal excretions, in order to improve the above methodology. Therefore, the modified Equation (1) would be as follows:
WF [e, a]= WF (feed) [e, a] + WF (drink) [e, a] + WF (serv) [e, a] + WF (excret) [e,a]
where WF represents the virtual water content of animal “a” in exporting country “e” expressed in cubic metres of water per ton of live animal. WFfeed, WFdrink, WFserv, and WFexcret are the virtual water contents from feeding, drinking, servicing, and excretions, respectively.
WFfeed depends on animal species and production systems. While grazing animals usually base their feed on grazing, the percentage of feed in the feed of animals on larger scale farms is very significant. This difference makes for a large variation in RWF calculations, whereas in grazing, the WFfeed is directly related to RWF because the crops are on the land and are consuming water directly. In industrial systems, feed is often produced outside the region, so animal feed does not affect RWF because it is an imported WF; hence, the importance of knowing the different animal species and type of farms in the territory.
Mekonnen and Hoekstra [26] defined the WF of livestock industry models for different regions, the weight, and WF of live animals at end of their lifetime (Table 1).
These data, related to the lifetime of each species, allows us to establish a WF calculation model where a stationary water consumption is set up based on municipal data on the livestock head per facility. Therefore, if a broiler farm has a capacity of 1000 broilers, due to its average lifetime of 0.25 years, the calculation should reflect the WF of 4000 chickens/year. Weight data in WFN for dairy cattle and layer chickens are not available so WF is estimated by the proportional drink and feed of beef cattle and broiler chickens, respectively, in other studies [27,28] (Table 2).
Due to the regional nature of the RWF, it is necessary to split the WF consumption of the animals into those that have a direct impact on the territory, such as the WFserv, WFdrink and the proportion of WFfeed that is produced in the territory and not in another region, such as animal fodder, which would be an indirect WF. In this context, the share of imported food is applied (Table 3) [29].
Concentrated feed is considered an indirect WF because its production typically occurs outside the region where the livestock industry operates. In grazing and mixed systems, it is crucial to adjust the agricultural blue and green WF according to the number of livestock heads to avoid double counting. This adjustment ensures that locally produced feed is correctly accounted for in the RWF, while imported feed remains part of the indirect WF. For example, in intensive pig farming, nearly all feed is imported (e.g., soy or maize), meaning that its WF_feed is largely external to the study region. As a result, the RWF of this system consists mainly of WF_drink and WF_serv, with little contribution from local agricultural water use. Conversely, in extensive cattle farming, animals rely significantly on locally available pasture and forage, meaning that a considerable portion of WF_feed directly contributes to the RWF. To ensure accuracy in these calculations, Table 1 provides reference values for water consumption associated with extensive feed, while Table 3 details the percentage of concentrated feed consumption for different livestock types. By integrating these datasets, we can determine the WF_feed that affects the RWF and the portion that should be classified as imported WF. Finally, to prevent overestimation, the blue and grey WF values attributed to livestock grazing areas should be adjusted based on the region-specific ratios of green and blue WF, ensuring a more precise representation of local water consumption.
WFexcret added to Equation (1), reflects the grey WF linked to the wastewater discharges due to animal excretions and farm cleaning. WFexcret follows the standard WFN grey WF calculation methodology (2) [7]:
Grey WF = Effl × ((Ceffl − Cact)/(Cmax − Cnat))
where the pollutant load can be calculated as the effluent volume (Effl, in volume/time) multiplied by the concentration of the pollutant in the effluent (Ceffl, in mass/volume) minus the actual concentration of the intake water (Cact, in mass/volume) divided by Cmax, representing the maximum concentration allowed by law to be emitted in nature minus Cnat, the natural concentration in the receiving water body.
Due to the difficulty that can be encountered when determining the discharge authorisations of the different facilities, Cmax is defined as the maximum threshold concentration for the good state of the rivers established in [30]. In the same way, due to the difficulty in obtaining regional data, the Cnat and Cact is set to 0 for the pollutants analyzed. Effl is calculated as the sum of water consumed in WFdrink and Wserv. For the calculation of the Cefll, primary data can be used, in the case of not having concrete data of the installations as in the present study, bibliographic concentrations are considered [31,32,33,34].

2.2.3. Municipal

Municipal consumption takes into account the use of tap water used for irrigation of green areas, cleaning of public roads, operation of ornamental fountains, sports facilities, and municipal services. In addition, direct abstractions of municipal water, whether from surface water, wells, or groundwater, must also be taken into account. All these consumptions are taken into account as blue RWF.

2.2.4. Residential

This section accounts for all mains water consumption by residents within the study area, based on billed volumes from residential metres, which are fully classified as blue RWF. In water footprint assessments, distribution losses may be included or excluded, depending on the methodological approach. In the case of Gavà, the analysis relies on billed consumption data, and thus, network inefficiencies are not incorporated into the RWF calculation.

2.2.5. Industrial

This section includes the consumption of tap water by the different industries, as well as the private abstractions of both surface water and groundwater necessary for their activity. If data on the volume and quality of the main discharges are available, it is possible to calculate the associated grey WF. Therefore, this section takes into account the blue RWF and, if possible, the grey RWF.

2.2.6. Commercial

It gathers the consumption of commercial activities in the region (markets, cafés, restaurants, etc.). Consumption associated with these activities in the region is mainly related to tap water consumption and will, therefore, be reflected as a contribution to the blue RWF.

2.2.7. Tourism

Within commercial activities, one of the main activities is associated with tourism. In some municipalities it can become one of the main contributors. In order to calculate the blue RWF, it is necessary to detail the tourist offer of the municipality (hotels, flats, campsites) and to establish average consumption by type of accommodation. For the case study of Gavà, tourist water consumption was estimated at 145 L/tourist/day for campsites [35], 254 L/tourist/day [36] per hotel and 180 L/tourist/day for tourist flats based on Eurostat data [37]. Due to the seasonality of tourism, hotel occupancy data for the region are used to adjust the actual consumption of this sector within the commercial turnover data. In the case of this study, occupancy rate data from INE [38] are used.

2.2.8. Wastewater Treatment (WWT)

WWT is key in different economic sectors (residential, industrial, commercial, etc.). The wastewater treatment plants reduce the concentration of contaminants in order to comply with legal discharge requirements and, thus, reduce the environmental impact. There are three possible scenarios regarding the impact of grey water footprint (WF). According to the WFN methodology, if the discharge occurs directly into the sea, it is not accounted for in the grey WF calculation, as it does not affect inland water bodies. If the treatment plant or discharge point is located outside the study area, the resulting grey WF is considered exported and, therefore, not included in the regional water footprint (RWF). Conversely, if the discharge occurs within the study region, the grey WF is fully accounted for, following the methodology established by the WFN [7].

2.2.9. Reclaimed Water

The need to reintroduce used water into the water cycle for specific customer needs requires a systematic approach to close water loops in the most efficient way [39]. The reclaimed water produced in the treatment plant acquires a new use and displaces the consumption of other water sources such as surface water or groundwater. These types of activities provide a WF benefit for the catchment and can reduce the WF of important sectors such as agriculture. Such water reuse measures become more important in coastal locations, where most effluents are discharged directly into marine waters and represent a loss of the resource. As a result of this phenomenon, the production of reclaimed water in coastal regions plays a crucial role in mitigating the WF. By diverting reclaimed water so that it is not discharged into the sea, it can be used to meet irrigation or industrial water demands, thus, reducing dependence on freshwater sources. It is imperative to identify the specific areas where reclaimed water is being used and to accurately estimate the degree to which the blue WF is being avoided in each case. For example, the use of reclaimed water in agriculture for irrigation means a reduction in groundwater consumption. Therefore, the corresponding blue footprint contribution can be subtracted from the demand calculation obtained from the WFN data.

3. Results

The methodology has been applied in the municipal territory of Gavà for the year 2021. Gavà is a coastal town in northeastern Spain, located within the metropolitan area of Barcelona, covering an area of 30.9 km2 with a population of 46,931 inhabitants [14]. The municipality has a Mediterranean climate, characterized by hot, dry summers and mild, wet winters, with an average annual precipitation of approximately 600 mm, which fluctuates significantly due to seasonal variability and increasing drought trends. Economically, Gavà is a highly diverse municipality, representing a balanced mix of economic sectors. It has extensive agricultural land, particularly dedicated to horticultural production, industrial estates that contribute to regional economic activity, residential and commercial zones, and a coastal area that attracts tourism. Additionally, there is a presence of livestock farming, though at a smaller scale compared to other sectors. The hydrological context of Gavà is particularly relevant, as it lies within the Llobregat River Basin, one of the most water-stressed areas in Spain, frequently affected by prolonged droughts. Given its strategic location within the Barcelona metropolitan area, understanding water consumption patterns and promoting alternative water resources—such as reclaimed water—are critical for ensuring sustainable water management in the near future.
The definition of the different land uses in the territory is based on crop and land use maps [40]. The MAPAMA database geolocates, delimits, and describes crops and land uses throughout the Spanish national territory, using codes, and accurately describing the different crops represented. These data are particularly important for the calculation of the WF of the agricultural and forestry sectors due to the large differences in crop water demand and land use methods. The municipality of Gavà has a very diverse orography, ranging from large extensions dedicated to cultivation to non-productive land, residential, industrial, leisure, and also tourist areas on the coast. Gavà has a wide vegetation cover; 41.45% of the surface area is occupied by forests, 18.85% by arable land, 6.64% by scrubland, 0.56% by meadows, and only 32.50% of the land is unproductive and dedicated to residential, industrial, or other infrastructure uses [40].

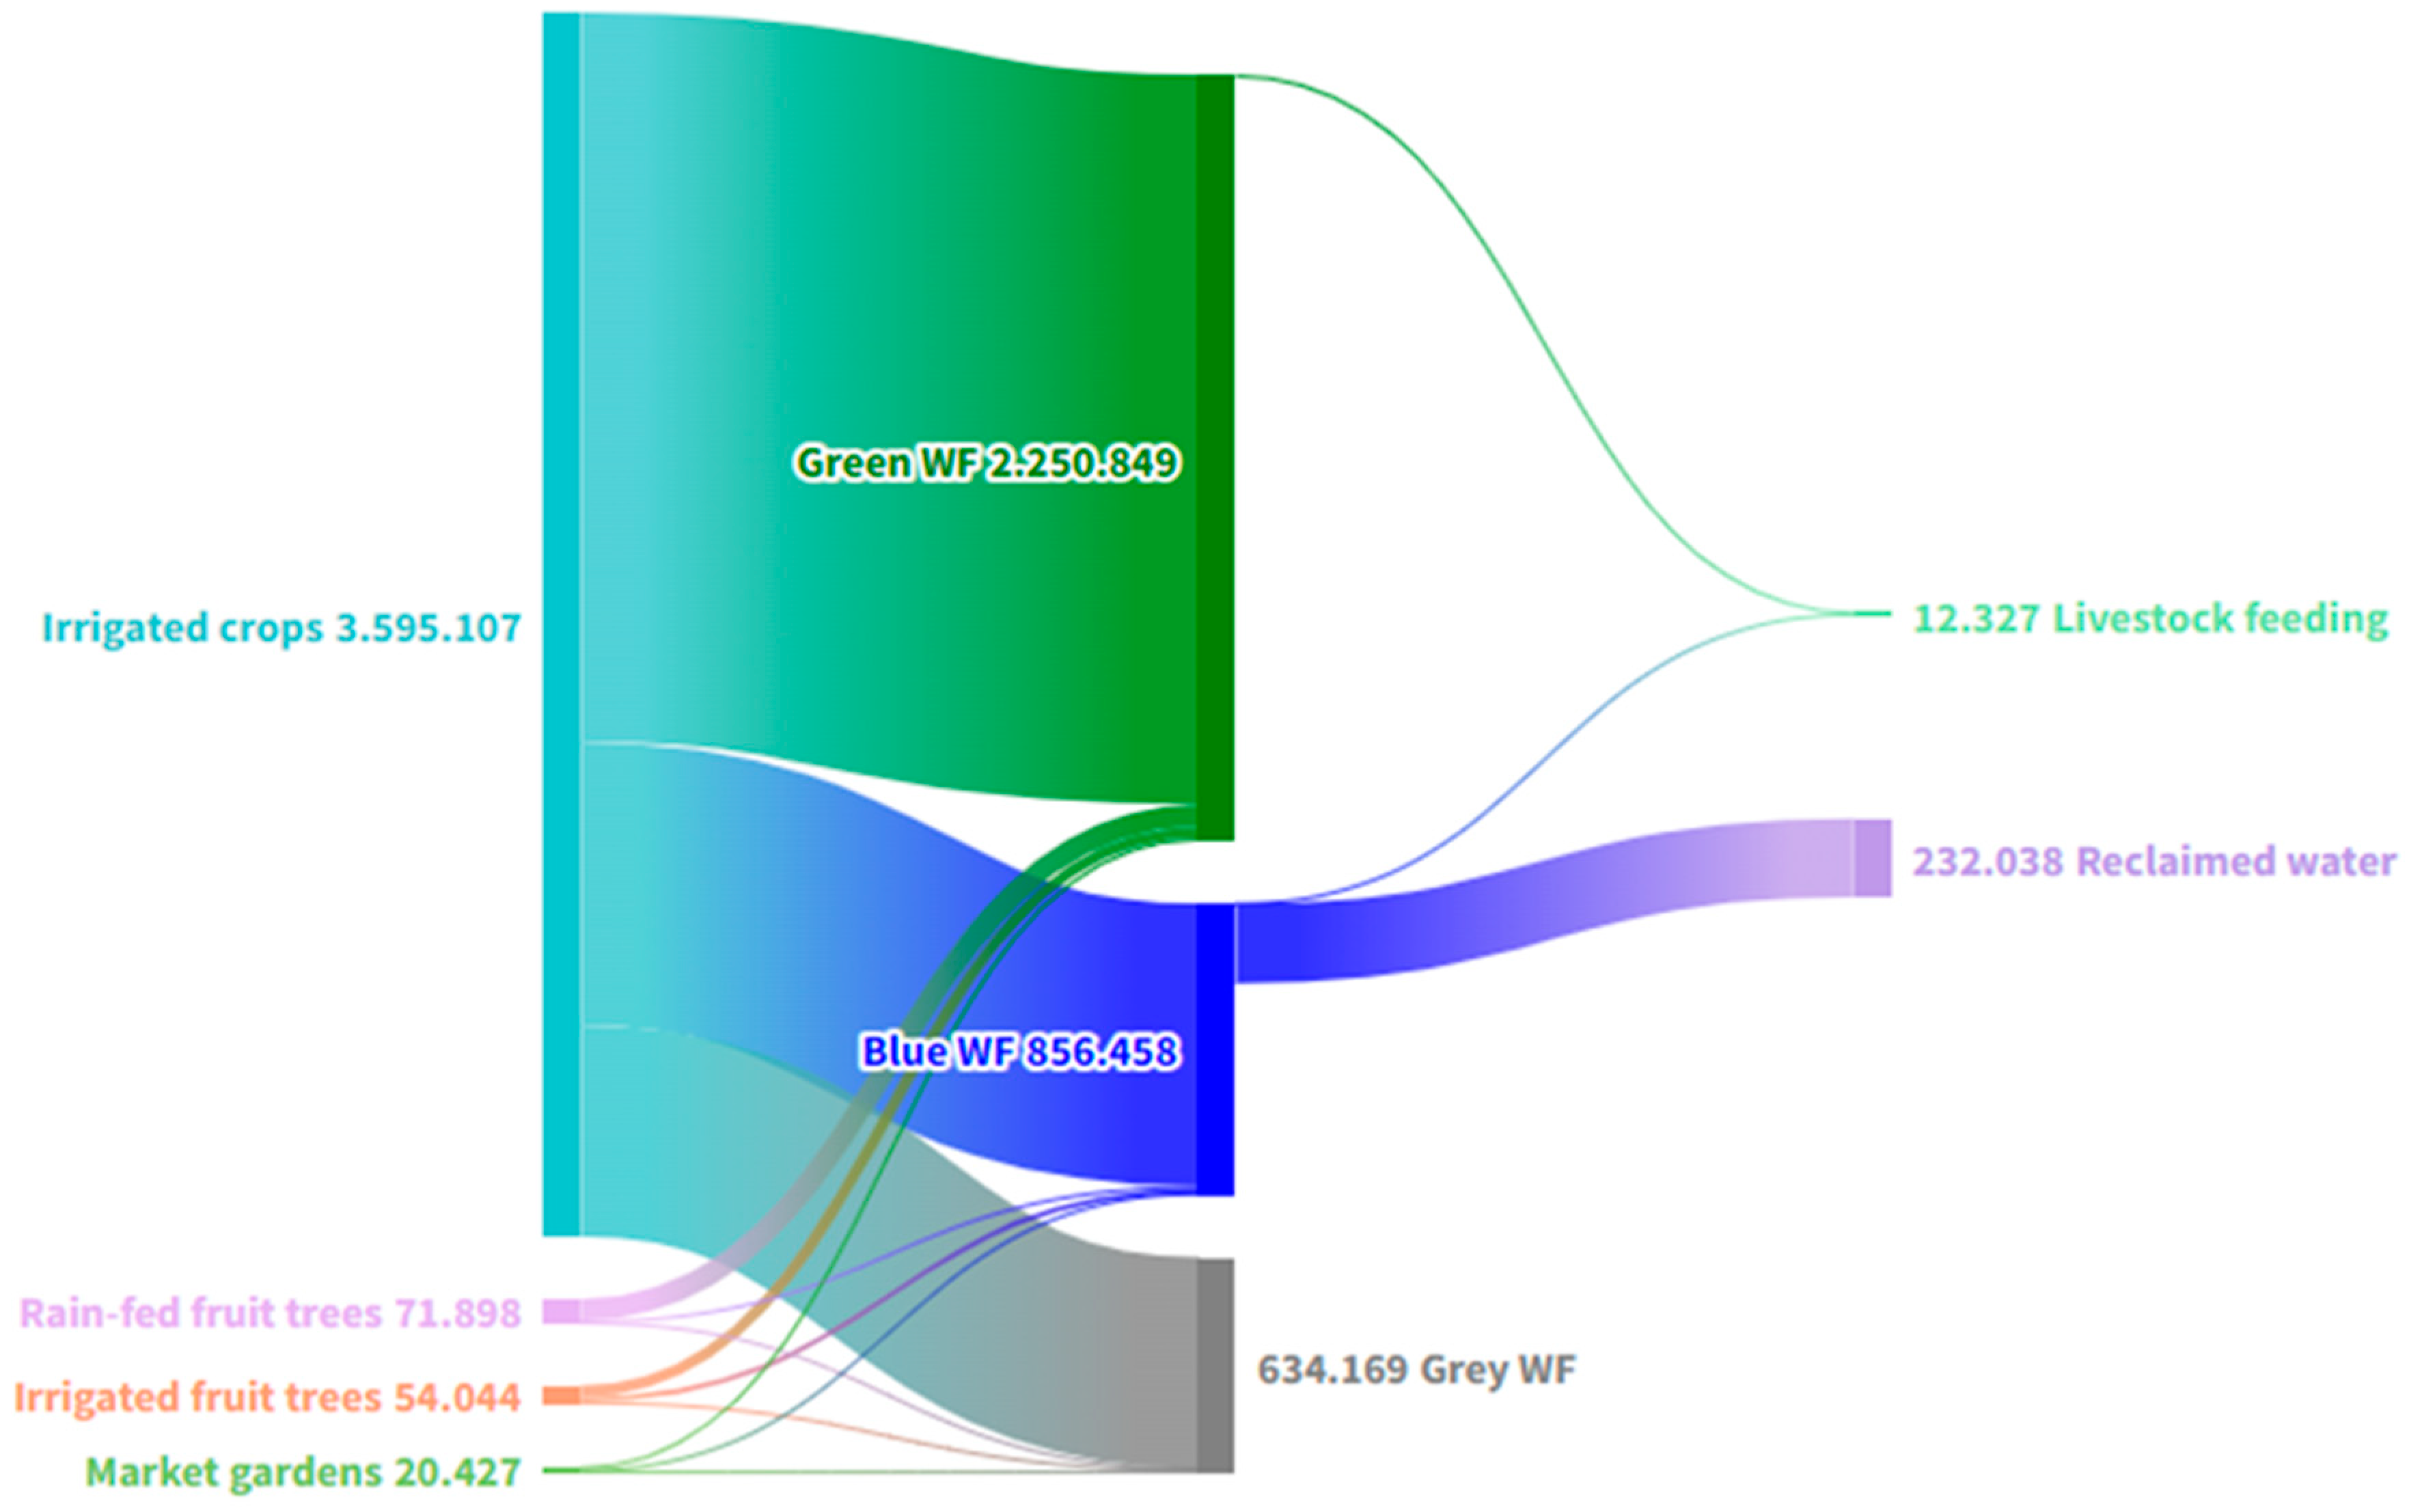
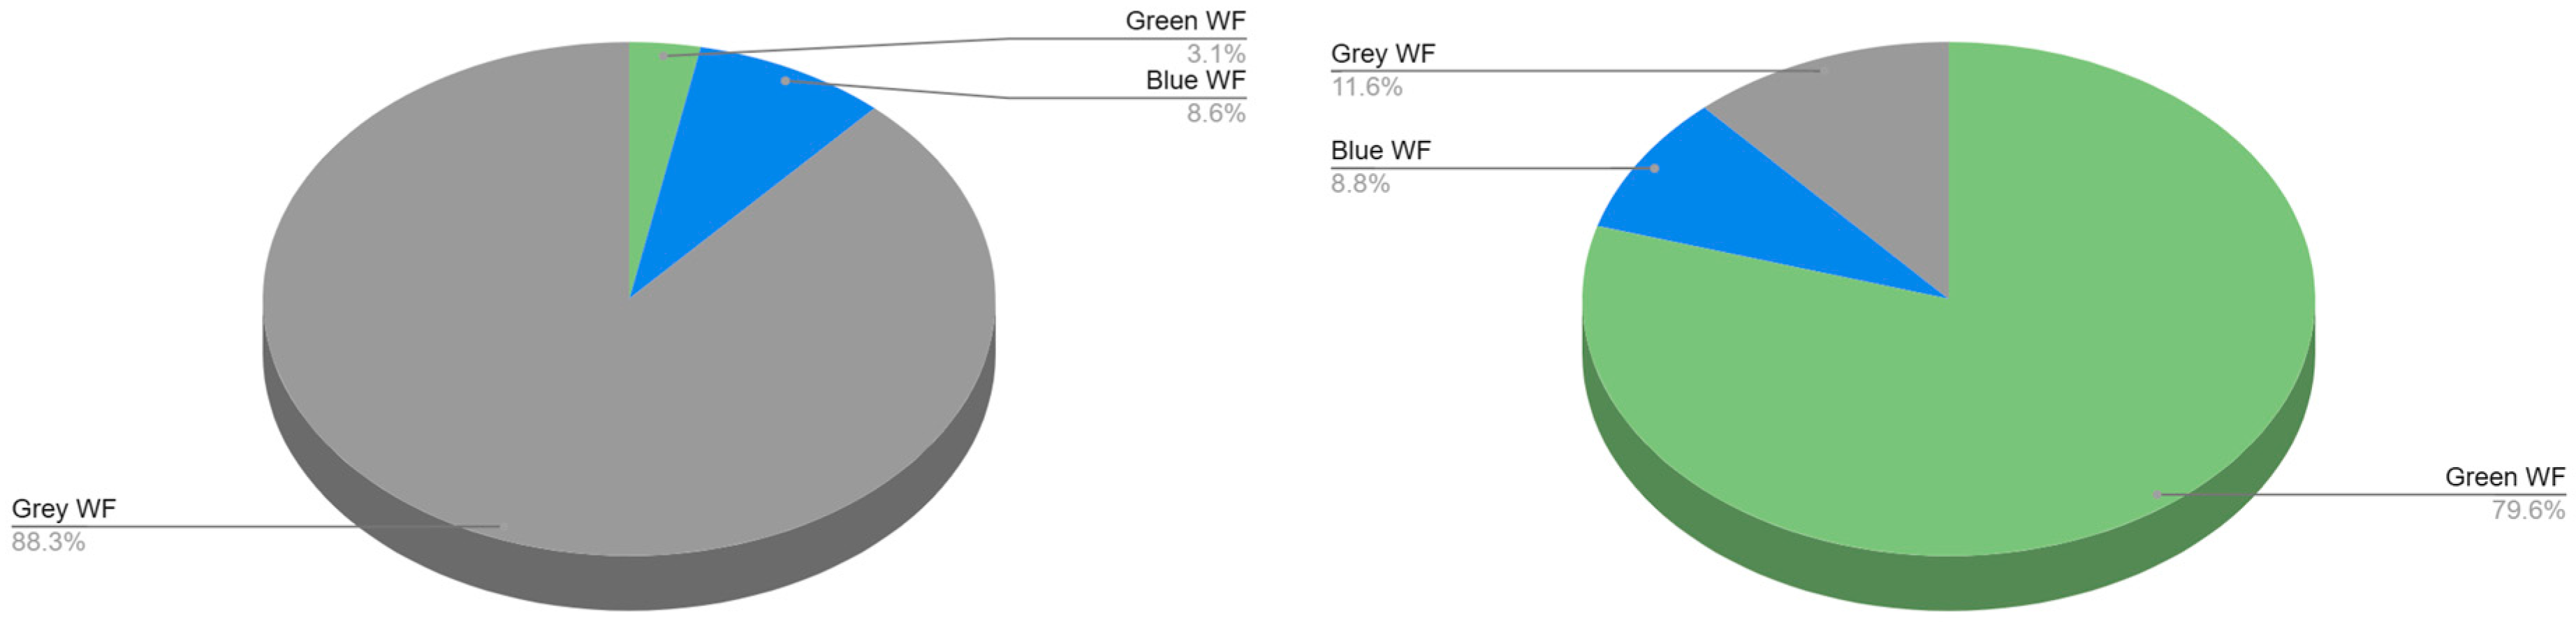
3.1. Agriculture and Silviculture in Gavà

Agriculture in Gavà has a very important weight both economically and in terms of municipal land use, covering 18.85% of the territory. The main types of crops are irrigated arable crops, irrigated fruit trees, rain-fed fruit trees, and market gardens or forced crops (Supplementary Table S2):
Based on the WF assembled by the WFN for the region of Catalonia [21] the WF of agriculture in the area of study is 3,741,447 m3 (Figure 2), of which 2,250,849 m3 is of green WF (60.16%), 856,458 m3 is of blue WF (22.89%), and 634,169 m3 is of grey WF (16.95%). The main contribution is associated with irrigated crops, making up 96.09% of agricultural WF, while rain-fed and irrigated fruit trees contribute 1.92% and 1.44%, respectively. Market gardens or forced crops only contribute 0.55% to the WF.
However, the management of reclaimed water in the municipality of Gavà significantly mitigates the blue WF of the crop. This is achieved by replacing the consumption of surface or groundwater with reclaimed water, which represents a considerable reduction of 232,038 m3, as shown in Section 3.8. In addition, a fraction of the green and blue WF of crops is used to feed horses and pigs in intensive livestock farming. This allocation amounts to 9902 m3 of green WF and 2425 m3 of blue WF according to the allocations shown in Table 3. Forestry in Gavà, as it is not considered a relevant industry in the territory, has not been included in the calculation of the RWF.
Once these adjustments have been applied, the resulting RWF for agriculture in Gavà is 3,497,111 m3, with contributions of 621,995 m3 of blue WF, 2,240,947 m3 of green WF, and 634,169 m3 of grey WF.

3.2. Livestock in Gavà

To determine the head number of livestock in the municipality, the latest data available at the municipal level [41] is used and scaled in relation to the average growth of the sector in the region of Catalonia from 2009 to 2022. From this iteration it is estimated that the livestock farms in Gavà currently have 1110 heads of pigs and 9 heads of horses.
In the local case of Gavà, the discharge standards set by ORDEN ARM/2656/2008 have been considered, which establish limits of 6 mg/L for BOD5 and 25 mg/L for NO3. Based on these regulatory thresholds, the limiting pollutant has been identified as BOD5, with an estimated average discharge of 67 mg/L for pig farming [42], exceeding the legal limit by a factor of 11 under Spanish water quality regulations. In the case of horses, due to the absence of specific bibliographic data on pollutant loads, an equivalence with cattle is assumed. Under this assumption, BOD5 is identified as the limiting parameter, with an estimated concentration of 91 mg/L [32], exceeding the regulatory quality threshold by a factor of 15.
Applying Equation (1), the pig RWF is 303,019 m3 and the horse RWF is 13,492 m3 (Table 4). The contributions of the different WF are shown in Figure 3. The direct WF is mainly related to grey water from excretions with 88.3% of the impact, while the blue WF represents 8.6%. These consumptions are mainly associated with service and drinking water. The nature of the farms in Gavà, in which intensive pig farming predominates, results in a contribution of 9902 m3 of green WF to the overall WF of the territory.

3.3. Municipal

Municipal consumption refers to the water consumed by municipal facilities such as administrative buildings, sports facilities, and the irrigation of green areas. The municipal consumption data were obtained as anonymized from the databases of Aigües de Barcelona and Gavà Town Council. The total consumption of tap water for municipal uses is 159,000 m3, with an additional 8767 m3 from groundwater for irrigation of green areas and street washing. Specifically, Gavà council uses 95,935 m3 of water to irrigate green areas, of which 8.25% is supplied by groundwater. In addition, 65,183 m3 of tap water is consumed in municipal facilities, 854.96 m3 of groundwater is used for street washing and 4939 m3 of tap water is used for ornamental fountains.

3.4. Residential

Residential consumption was provided by Aigües de Barcelona, UWCM of the municipality of Gavà. Residential consumption covers 1,994,000 m3 of water to supply both households and the neighbourhood associations. The average consumption is 116.41 L per inhabitant per day.

3.5. Industrial

Industrial consumption is not very widespread in the territory of Gavà as a whole, where most water consumption is associated with tap water consumption, while private abstractions of surface water or groundwater are minor, and no rainwater consumption has been detected. Industrial consumption, also anonymized and supplied by Aigües de Barcelona, is 373,000 m3 of tap water, while the company’s own abstractions are 4730 m3.

3.6. Commercial

Commercial consumption is directly related to the consumption of tap water by companies in Gavà. Restaurants, cafeterias and any activity registered as a business are included under this heading. Aigües de Barcelona, as the supplier of the resource in the municipality, provides the aggregate data for commercial consumption. This reflects a demand of 105,000 m3 of blue WF.

Tourism

For tourism consumption, the three main typologies present in the municipality are taken into account: hotels, campsites, and flats. The water demand of tourism was modelled on the basis of bibliographic data, in the campsites, 145 L/tourist/day were considered according to the study of Mediterranean campsites [35], in hotels, based on on the Mediterranean coast of Spain, 254 L/tourist/day [36], while for tourist flats, Eurostat data were considered, 180 L/tourist/day [37]. In order to obtain the monthly occupancy data for the different establishments, the tourist occupancy data for Barcelona Costa [38] were used.
The results show that Gavà’s tourism has a demand of 49,210 m3 of tap water. The WF of tourism is included in the commercial consumption reported above, so this calculation helps us to disaggregate consumption and draw indicators at the municipal level for tourism activity. However, it should not be included in the final regional WF to avoid double counting.

3.7. Wastewater Treatment Plants (WWTP)

The wastewater generated in the municipality of Gavà is managed at the Gavà-Viladecans wastewater treatment plant, where the resulting effluent is discharged directly into the sea. Consequently, this discharge does not contribute to the presence of grey or blue WF, as it does not compromise the water quality of the basin or the availability of water.

3.8. Reclaimed Water

Within the municipal boundaries, water is reclaimed to meet agricultural needs, thereby reducing dependence on surface and groundwater sources and minimizing water consumption in this territory. Aigües de Barcelona supplies water to the agricultural park’s water channels, which have a dual function. The first is to serve as a source of water supply for farmers near the channels, and on the other hand to maintain the ecological flow, providing an environmental service. In this way and taking into account the irrigation efficiencies of sprinkler and drip irrigation systems, it is estimated that around 53.91 ha of surface area are irrigated by capillarity, these are the orchards closest to the water channels. In addition, another 25 ha are estimated to draw water directly from the channels for the irrigation of other nearby farms. Taking into account the water demands of crops in the region, it is estimated that 232,038 m3 of water discharged into the canal system ends up being used for crop irrigation and displaces the water consumption from conventional sources.

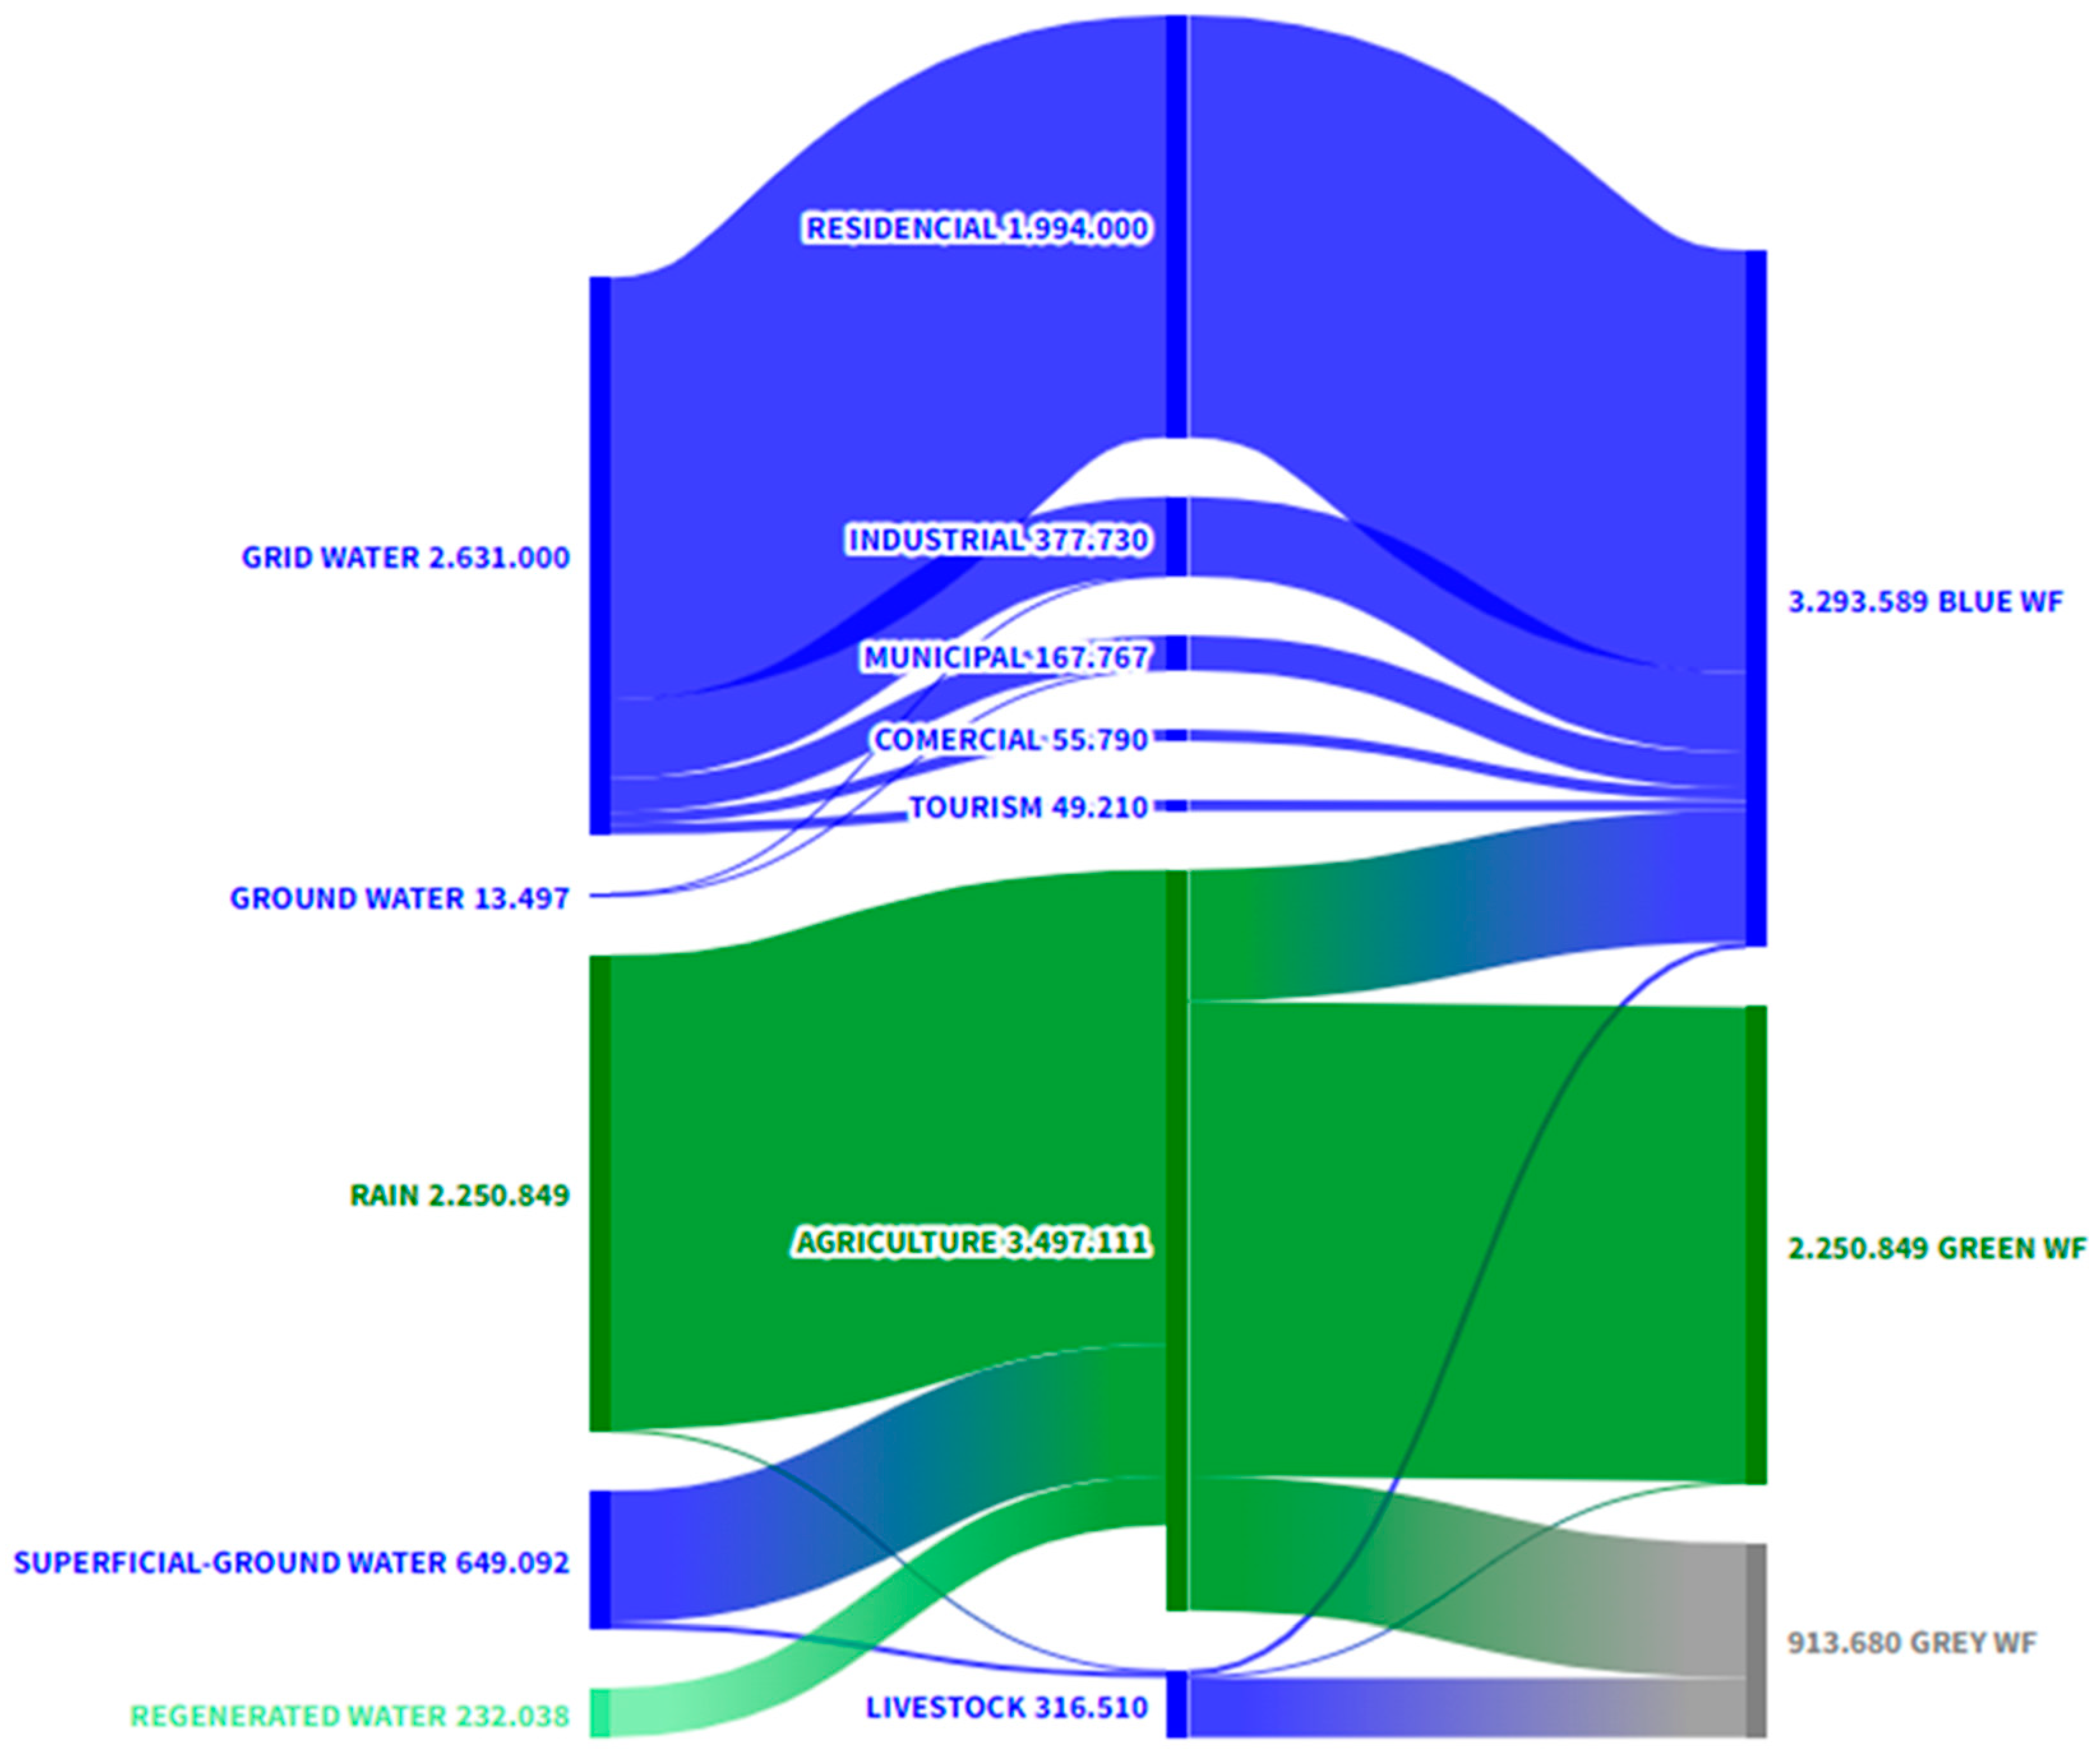
3.9. Gavà Regional WF

The RWF of Gavà, as depicted in Figure 4, primarily consists of the blue WF, with a total of 3,293,589 m3, of which 2,631,000 m3 corresponds to grid water, distributed through the drinking water network managed by Aigües de Barcelona. Within this blue WF, the residential sector represents 60.54%, crop irrigation 18.89%, industrial consumption 11.32% and the municipal sector 4.83%. The remaining contributions together account for 4.42% of the blue WF. Green WF represents the second most significant contribution, with an annual demand of 2,250,849 m3. Of this total, 99.56% is attributed to crop irrigation, while the remaining 0.44% is associated with equine consumption within the municipality. The grey WF of the municipality amounts to 913,680 m3. Of this total, 69.41% is attributed to agriculture, while the remaining 30.59% is derived from livestock. It should be noted that the water managed at the Gavà-Viladecans wastewater treatment plant is discharged directly into the sea. Consequently, the grey WF associated with the residential, industrial or municipal sectors is not taken into account in the calculation of the overall RWF. The final calculation gives a total RWF of 6,458,118 m3, with the blue WF representing 51.00%, the green WF contributing 34.85%, and the grey WF representing 14.15% of the total footprint.
Some insightful indicators can be derived from these data. For example, the WF per inhabitant shows a consumption of 377.01 L/capita/day. Furthermore, the WF of tourism, which refers to the main water consumption by visitors, stands at 177 L/tourist/day. Water consumption by municipal activities, such as watering of green areas, maintenance of municipal facilities and street cleaning, is recorded at a rate of 14.02 L/capita/day.

4. Discussion

RWF framework unveils detailed insights into how, where, when, and what types of water are utilized by various economic stakeholders within a given territory. Unlike other RWF assessments [9,10,11,12,13], which often analyze water consumption in isolation, the RWF approach of this study provides a more integrated perspective, capturing cross-sectoral dependencies and territorial specificities. Currently, the results of this investigation are presented annually. However, considering the pronounced seasonality in sectors like agriculture and tourism, there is a compelling argument for facilitating monthly evaluations, enhancing its ability to identify fluctuations in water demand, facilitating more responsive planning and adaptive management strategies. This level of detail enables public authorities to anticipate critical periods of water scarcity, optimize supply networks, and improve infrastructure planning for groundwater recharge, ensuring that socio-economic and climatic conditions are adequately considered.
RWF allows us to categorize types of municipalities, thereby enabling the establishment of unified action plans. Moreover, they will facilitate the quantification of the impact derived from effective practises and projects implemented by urban water cycle managers, municipalities, or corporations within the territories. Integrating these insights will contribute significantly to achieving sustainable development objectives and will align with the urban agenda water circularity goals. RWF will also serve to analyze indicators of water scarcity and map them [43] at smaller and smaller scales, including at the municipal level.
As mentioned in the previous point, a particularly valuable avenue is quantifying the RWF on a monthly basis, allowing seasonal consumption management strategies. In this context, the utilization of the CROPWAT tool [19] is advantageous for modelling the water demands of territories according to current climatic conditions. This shift from relying on historical climatic data to incorporating timely and specific demand data promises more precise management insights.
Furthermore, there is room for improvement in measuring the WF within the livestock sector. It is recommended to refine the data reported by WFN and to execute specialized studies assessing the quality of discharges from these facilities. Such an approach ensures more accurate representations adjusted to the unique characteristics of each type of facility.
Lastly, it is crucial to integrate these findings with geographic information system (GIS) databases. This integration will enable the creation of heat maps depicting areas with high water demand, facilitating the targeted implementation of water reduction or compensation measures at these critical points.
In summary, the application of the RWF framework extends beyond water accounting, positioning itself as a practical tool for decision-making in water resource governance. Its ability to assess multi-sectoral water demands and spatially differentiate impacts makes it particularly useful for urban and regional planners. This is especially relevant in water-stressed regions, where integrating RWF results with policy initiatives can help municipalities establish more resilient water management strategies. The methodology also allows for the identification of sectors where efficiency improvements can be prioritized, leading to targeted interventions such as reclaimed water expansion, industrial efficiency programmes, and regulatory incentives for sustainable agricultural practises. Moreover, RWF outputs, when coupled with economic assessments, could further aid in evaluating the cost-effectiveness of different water conservation strategies, reinforcing its role as a strategic planning tool.

5. Conclusions

The multi-sectoral assessment of the RWF provides valuable information on water demands in various sectors within the study area. This approach not only quantifies surface or groundwater demands, but also captures water consumption resulting from land disturbance, such as crop expansion or timber harvesting, which increases the green WF. In addition, it takes into account the grey WF of activities discharging water into the catchment. An important methodological advance is achieved by calculating the grey WF of livestock facilities, an adaptation that effectively represents the depth-related impact of discharges from livestock industries, which often exert significant pressure on basin dynamics and water quality. Overall, the multi-sectoral approach of RWF improves our understanding of water use patterns within a territory and supports informed decision-making for sustainable water management. The RWF case study in Gavà reflects a demand of 6,458,118 m3. The blue WF with 3,293,589 m3, the green WF with 2,250,849 m3, and the grey WF with 913,680 m3. The agricultural sector emerges as the main consumer of water resources, accounting for a substantial 54.2% of total water demand. Residential consumption accounts for 30.9% of total water consumption, while industrial activities provide 5.8%. In addition, livestock water consumption amounts to 4.9%, and the municipal and commercial sectors exhibit water demand rates of 2.6% and 1.6%, respectively. These findings underline the significant impact of agricultural practises on Gavà’s WF, highlighting the need for specific and sustainable water management strategies within this sector, such as increasing the production of reclaimed water for agricultural irrigation. The indicators show that the RWF in Gavà is 377.01 L/capita/day.

Supplementary Materials

The following supporting information can be downloaded at: https://www.mdpi.com/article/10.3390/su17052302/s1, Table S1. Production and water footprint of different crops in Gavà; Table S2: Crop distribution by land use.

Author Contributions

I.F.-C.: Methodology, investigation, validation, formal analysis, data curation, writing—original draft, visualization. Y.L.-T.: Conceptualization, formal analysis, methodology, investigation, visualization, validation, writing—review and editing. P.V.-R.: Formal analysis, methodology, investigation, visualization. M.R.: Methodology, investigation, data curation, writing—review and editing. G.F.: Formal analysis, methodology, investigation, validation, writing—review and editing. All authors have read and agreed to the published version of the manuscript.

Funding

This research has been supported by GAIN and the Galician Government (13_IN606D_2022_2702175).

Institutional Review Board Statement

Not applicable.

Informed Consent Statement

Not applicable.

Data Availability Statement

The original contributions presented in this study are included in the article/Supplementary Materials. Further inquiries can be directed to the corresponding author(s).

Acknowledgments

This research has been supported by GAIN and the Galician Government (13_IN606D_2022_2702175), and in collaboration with the BIORECER team (101060684-HORIZON-CL6-2021-ZEROPOLLUTION-01) and the Cross-isciplinary Research in Environmental Technologies (CRETUS Research centre, ED431E 2018/01). We would also like to thank Aigües de Barcelona and the Gavà town council for all the information necessary to carry out this study.

Conflicts of Interest

This research has been supported by GAIN and the Galician Government but does not have any conflicts of interest. Mario Ruiz is an employee of Aigües de Barcelona. The authors confirm their commitment to scientific transparency and ethical research practices. The authors declare no conflicts of interest.

References

  1. IPCC. Climate Change 2021, The Physical Science Basis; Cambridge University Press: Cambridge, UK, 2021. [Google Scholar] [CrossRef]
  2. Dagan, G.; Stier, P. Constraint on precipitation response to climate change by combination of atmospheric energy and water budgets. NPJ Clim. Atmos. Sci. 2020, 3, 34. [Google Scholar] [CrossRef]
  3. Tramblay, Y.; Hertig, E. Modelling extreme dry spells in the Mediterranean region in connection with atmospheric circulation. Atmos. Res. 2018, 202, 40–48. [Google Scholar] [CrossRef]
  4. Zittis, G.; Bruggeman, A.; Lelieveld, J. Revisiting future extreme precipitation trends in the Mediterranean. Weather Clim. Extrem. 2021, 34, 100380. [Google Scholar] [CrossRef] [PubMed]
  5. IPCC. Impacts of 1.5 °C Global Warming on Natural and Human Systems. In Global Warming of 1.5 °C.; Cambridge University Press: Cambridge, UK, 2022; pp. 175–312. [Google Scholar] [CrossRef]
  6. Hoekstra, A.Y. Virtual Water Trade: Proceedings of the International Expert Meeting on Virtual Water Trade; IHE Delft: Delft, The Netherlands, 2003. [Google Scholar]
  7. Aldaya, M.M.; Chapagain, A.K.; Hoekstra, A.Y.; Mekonnen, M.M. The Water Footprint Assessment Manual: Setting the Global Standard; Routledge: London, UK, 2012. [Google Scholar]
  8. Mao, Y.; Liu, Y.; Zhuo, L.; Wang, W.; Li, M.; Feng, B.; Wu, P. Quantitative evaluation of spatial scale effects on regional water footprint in crop production. Resour. Conserv. Recycl. 2021, 173, 105709. [Google Scholar] [CrossRef]
  9. Vanham, D.; Bidoglio, G. The water footprint of Milan. Water Sci. Technol. 2013, 69, 789–795. [Google Scholar] [CrossRef] [PubMed]
  10. Zhang, S.; Taiebat, M.; Liu, Y.; Qu, S.; Liang, S.; Xu, M. Regional water footprints and interregional virtual water transfers in China. J. Clean. Prod. 2019, 228, 1401–1412. [Google Scholar] [CrossRef]
  11. Li, M.; Zhuo, L.; Wu, P. Non-negligible regional differences in the driving forces of crop-related water footprint and virtual water flows: A case study for the Beijing-Tianjin-Hebei region. In Proceedings of the EGU General Assembly Conference Abstracts 2020, Online, 4–8 May 2020. [Google Scholar] [CrossRef]
  12. Aldaya, M.M.; Rodriguez, C.I.; Fernandez-Poulussen, A.; Merchan, D.; Beriain, M.J.; Llamas, R. Grey water footprint as an indicator for diffuse nitrogen pollution: The case of Navarra, Spain. Sci. Total Environ. 2020, 698, 134338. [Google Scholar] [CrossRef] [PubMed]
  13. Kong, Y.; He, W.; Zhang, Z.; Shen, J.; Yuan, L.; Gao, X.; An, M.; Ramsey, T.S. Spatial-temporal variation and driving factors decomposition of agricultural grey water footprint in China. J. Environ. Manag. 2022, 318, 115601. [Google Scholar] [CrossRef] [PubMed]
  14. INE. Cifras oficiales de población de los municipios españoles en aplicación de la Ley de Bases del Régimen Local (Art. 17). Instituto Nacional de Estadística (INE) 2022. Available online: https://www.ine.es/jaxiT3/Datos.htm?t=2861 (accessed on 13 January 2024).
  15. Yalcinkaya, S. Spatiotemporal analysis and mitigation potential of GHG emissions from the livestock sector in Turkey. Environ. Impact Assess. Rev. 2024, 105, 107441. [Google Scholar] [CrossRef]
  16. Hoekstra, A.Y.; Mekonnen, M.M. The water footprint of humanity. Proc. Natl. Acad. Sci. USA 2012, 109, 3232–3237. [Google Scholar] [CrossRef] [PubMed]
  17. Brauman, K.A.; Siebert, S.; Foley, J.A. Improvements in crop water productivity increase water sustainability and food security—A global analysis. Environ. Res. Lett. 2013, 8, 024030. [Google Scholar] [CrossRef]
  18. Allen, R.G.; Pereira, L.S.; Raes, D.; Smith, M. Crop evapotranspiration: Guidelines for computing crop water requirements. Fao Rome 1998, 300, D05109. [Google Scholar]
  19. FAO. Cropwat 8.0; FAO: Rome, Italy, 2010. [Google Scholar]
  20. Mekonnen, M.M.; Hoekstra, A.Y. The green, blue and grey water footprint of crops and derived crop products. Hydrol. Earth Syst. Sci. 2011, 15, 1577–1600. [Google Scholar] [CrossRef]
  21. Mekonnen, M.M. The Green, Blue and Grey Water Footprint of Farm Animals and Animal Products; Appendix III; Department of Water Engineering and Management, University of Twente: Enschede, The Netherlands, 2010. [Google Scholar]
  22. Ajuntament de Gavà. Viabilitat del Subministrament D’hortalissa i Fruita del PABLL a les Escoles de Gavà; Ajuntament de Gavà: Barcelona, Spain, 2022. [Google Scholar]
  23. Superficies y Producciones Anuales de Cultivos; Ministerio de Agricultura, Pesca y Alimentación: Madrid, Spain, 2022.
  24. Mekonnen, M.M. The Green, Blue and Grey Water Footprint of Farm Animals and Animal Products; Appendix IV; Department of Water Engineering and Management, University of Twente: Enschede, The Netherlands, 2010. [Google Scholar]
  25. Chapagain, A.K.; Hoekstra, A.Y.; Hoekstra, A.I. Virtual Water Flows Between Nations in Relation to Trade in Livestock and Livestock Products; UNESCO-IHE: Delft, The Netherlands, 2003. [Google Scholar]
  26. Mekonnen, M.M.; Hoekstra, A.Y. A global assessment of the water footprint of farm animal products. Ecosystems 2012, 15, 401–415. [Google Scholar] [CrossRef]
  27. Nations, F.A.O. Egg Marketing: A Guide for the Production and Sale of Eggs; Food & Agriculture Organization: Rome, Italy, 2003. [Google Scholar]
  28. Schubert, H.; Wood, S.; Reyher, K.; Mills, H. Data-driven approach to using individual cattle weights to estimate mean adult dairy cattle weight. Vet. Rec. 2019, 185, 540. [Google Scholar] [CrossRef] [PubMed]
  29. Mekonnen, M.M. The Green, Blue and Grey Water Footprint of Farm Animals and Animal Products; Appendix V; Department of Water Engineering and Management, University of Twente: Enschede, The Netherlands, 2010. [Google Scholar]
  30. Orden ARM/2656/2008; Normativa sobre Calidad de las Aguas en España: Madrid, Spain, 2008.
  31. Lv, J.; Liu, Y.; Feng, J.; Liu, Q.; Nan, F.; Xie, S. Nutrients removal from undiluted cattle farm wastewater by the two-stage process of microalgae-based wastewater treatment. Bioresour. Technol. 2018, 264, 311–318. [Google Scholar] [CrossRef]
  32. Hena, S.; Fatimah, S.; Tabassum, S. Cultivation of algae consortium in a dairy farm wastewater for biodiesel production. Water Resour. Ind. 2015, 10, 1–14. [Google Scholar] [CrossRef]
  33. Zheng, T.; Li, P.; Ma, X.; Sun, X.; Wu, C.; Wang, Q.; Gao, M. Pilot-scale experiments on multilevel contact oxidation treatment of poultry farm wastewater using saran lock carriers under different operation model. J. Environ. Sci. 2019, 77, 336–345. [Google Scholar] [CrossRef] [PubMed]
  34. Zhang, R.; Wang, L.; Hussain Lakho, F.; Yang, X.; Depuydt, V.; Igodt, W.; Quan Le, H.; Rousseau, D.P.L.; Van Hulle, S. Iron oxide coated sand (IOS): Scale-up analysis and full-scale application for phosphorus removal from goat farm wastewater. Sep. Purif. Technol. 2022, 284, 120213. [Google Scholar] [CrossRef]
  35. Conservation, G.F.A. Biodiversity and Tourism: Conflicts on the World’s Seacoasts and Strategies for Their Solution; Springer Science & Business Media: Berlin, Germany, 2012. [Google Scholar]
  36. Rico-Amorós, A.M.; Olcina-Cantos, J.; Sauri, D. Tourist land use patterns and water demand: Evidence from the Western Mediterranean. Land Use Policy 2009, 26, 493–501. [Google Scholar] [CrossRef]
  37. Eurostat. MEDSTAT II: “Water and Tourism” Pilot Study; European Commission: Brussel, Belgium, 2009.
  38. INE. Establecimientos, plazas estimadas, grados de ocupación y personal empleado por zonas turísticas. Instituto Nacional de Estadística (INE) 2023. Available online: https://www.ine.es/jaxiT3/Tabla.htm?t=2013&L=0 (accessed on 21 March 2024).
  39. Somoza-Tornos, A.; Rives-Jiménez, M.; Espuña, A.; Graells, M. A circular economy approach to the design of a water network targeting the use of regenerated water. Comput. Aided Chem. Eng. 2019, 47, 119–124. [Google Scholar] [CrossRef]
  40. MAPAMA. Mapa de Cultivos y Aprovechamientos de España 1:50.000 del Año 2000–2010. 2017. Available online: https://www.mapama.gob.es/ide/metadatos/srv/spa/catalog.search#/metadata/d50803e5-e53b-4c55-b643-dcc964c5f677 (accessed on 22 February 2024).
  41. Idecat. Nombre de caps per espècies. Institut d’Estadística de Catalunya 2022. Available online: https://www.idescat.cat/pub/?id=censag&n=5107&lang=es&by=mun (accessed on 12 November 2023).
  42. Tokhun, N.; Iwai, C.B.; Ta-Oun, M. Piggery Farm Wastewater: Alternative Solution for Agriculture and Soil Fertility. Int. J. Environ. Rural. Dev. 2010, 1, 58–61. [Google Scholar] [CrossRef]
  43. Huang, W.; Shuai, C.; Xiang, P.; Chen, X.; Zhao, B. Mapping water scarcity risk in China with the consideration of spatially heterogeneous environmental flow requirement. Environ. Impact Assess. Rev. 2024, 105, 107400. [Google Scholar] [CrossRef]
Figure 1. Land uses studied in RWF and their distribution in Gavà.
Sustainability 17 02302 g001
Figure 2. Gavà agriculture WF (m3).
Sustainability 17 02302 g002
Figure 3. Livestock direct (left) and indirect (right) WF.
Sustainability 17 02302 g003
Figure 4. Gavà’s RWF (m3).
Sustainability 17 02302 g004
Table 1. Average lifetime and animal weight at end of lifetime [26,27,28] and WF in Spanish farms.
AnimalAverage Life Time (year)Average Animal Weight at End of Lifetime (kg)WF in Grazing Systems (m3/Animal in the Facility·Year)WF in Mixed Systems (m3/Animal in the Facility·Year)WF in Industrial Systems (m3/Animal in the Facility·Year)
Beef cattle3253767.08712.16474.83
Dairy cattle106171368.651270.66847.20
Broiler chicken0.251.9027.2416.2327.53
Layer chicken1.41.521.5012.8121.73
Pig0.751021109.951069.56729.31
Sheep2.131.3-71.41-
Goat2.324.6-38.85-
Horse12473--1479.94
Table 2. WF of animals in Spain (animal in the facility/year) [26,27,28].
AnimalGrazingMixedIndustrial
Green WFBlue WFGrey WFTotal WFGreen WFBlue WFGrey WFTotal WFGreen WFBlue WFGrey WFTotal WF
Beef cattle696.5632.4438.08767.08636.2634.6341.27712.16379.2543.7151.87474.83
Dairy cattle1242.8357.8867.941368.651135.2461.7973.631270.66676.6777.9992.54847.20
Broiler chicken21.202.543.5027.2412.621.532.0816.2321.442.563.5327.53
Layer chicken16.742.002.7621.509.961.211.6412.8116.922.022.7921.73
Pig869.54116.62123.791109.95833.70114.28121.581069.56562.7784.2782.27729.31
Sheep----67.064.330.0271.41----
Goat----35.603.250.0038.85----
Horse--------1090.40291.2398.311479.94
Table 3. Fraction (%) of concentrate feed in total feed dry matter, per animal category, production system in West Europe [29].
Animal% of Concentrate Feed in Grazing Systems% of Concentrate Feed in Mixed Systems% of Concentrate Feed in Industrial Systems
Beef cattle0.902.0020.40
Dairy cattle14.8041.7092.90
Broiler chicken37.2048.5090.90
Layer chicken33.3044.4089.70
Pig32.7078.7099.70
Sheep00.40-
Goat---
Horse *0.902.0020.40
* % is assumed for beef cattle in the absence of information.
Table 4. Gavà’s livestock WF.
AnimalGreen RWF (m3)Blue RWF (m3)Grey RWF (m3)Total RWF (m3)RWF Per Animal/Year (m3)
Pig187424,919276,227303,019273.01
Horse80282179328413,4921499.06
Disclaimer/Publisher’s Note: The statements, opinions and data contained in all publications are solely those of the individual author(s) and contributor(s) and not of MDPI and/or the editor(s). MDPI and/or the editor(s) disclaim responsibility for any injury to people or property resulting from any ideas, methods, instructions or products referred to in the content.

