
Assessing Urban Park Equity in China Through Supply and Demand Balance: A Case Study of Wuhan City, China


Abstract
1. Introduction
2. Data and Methods
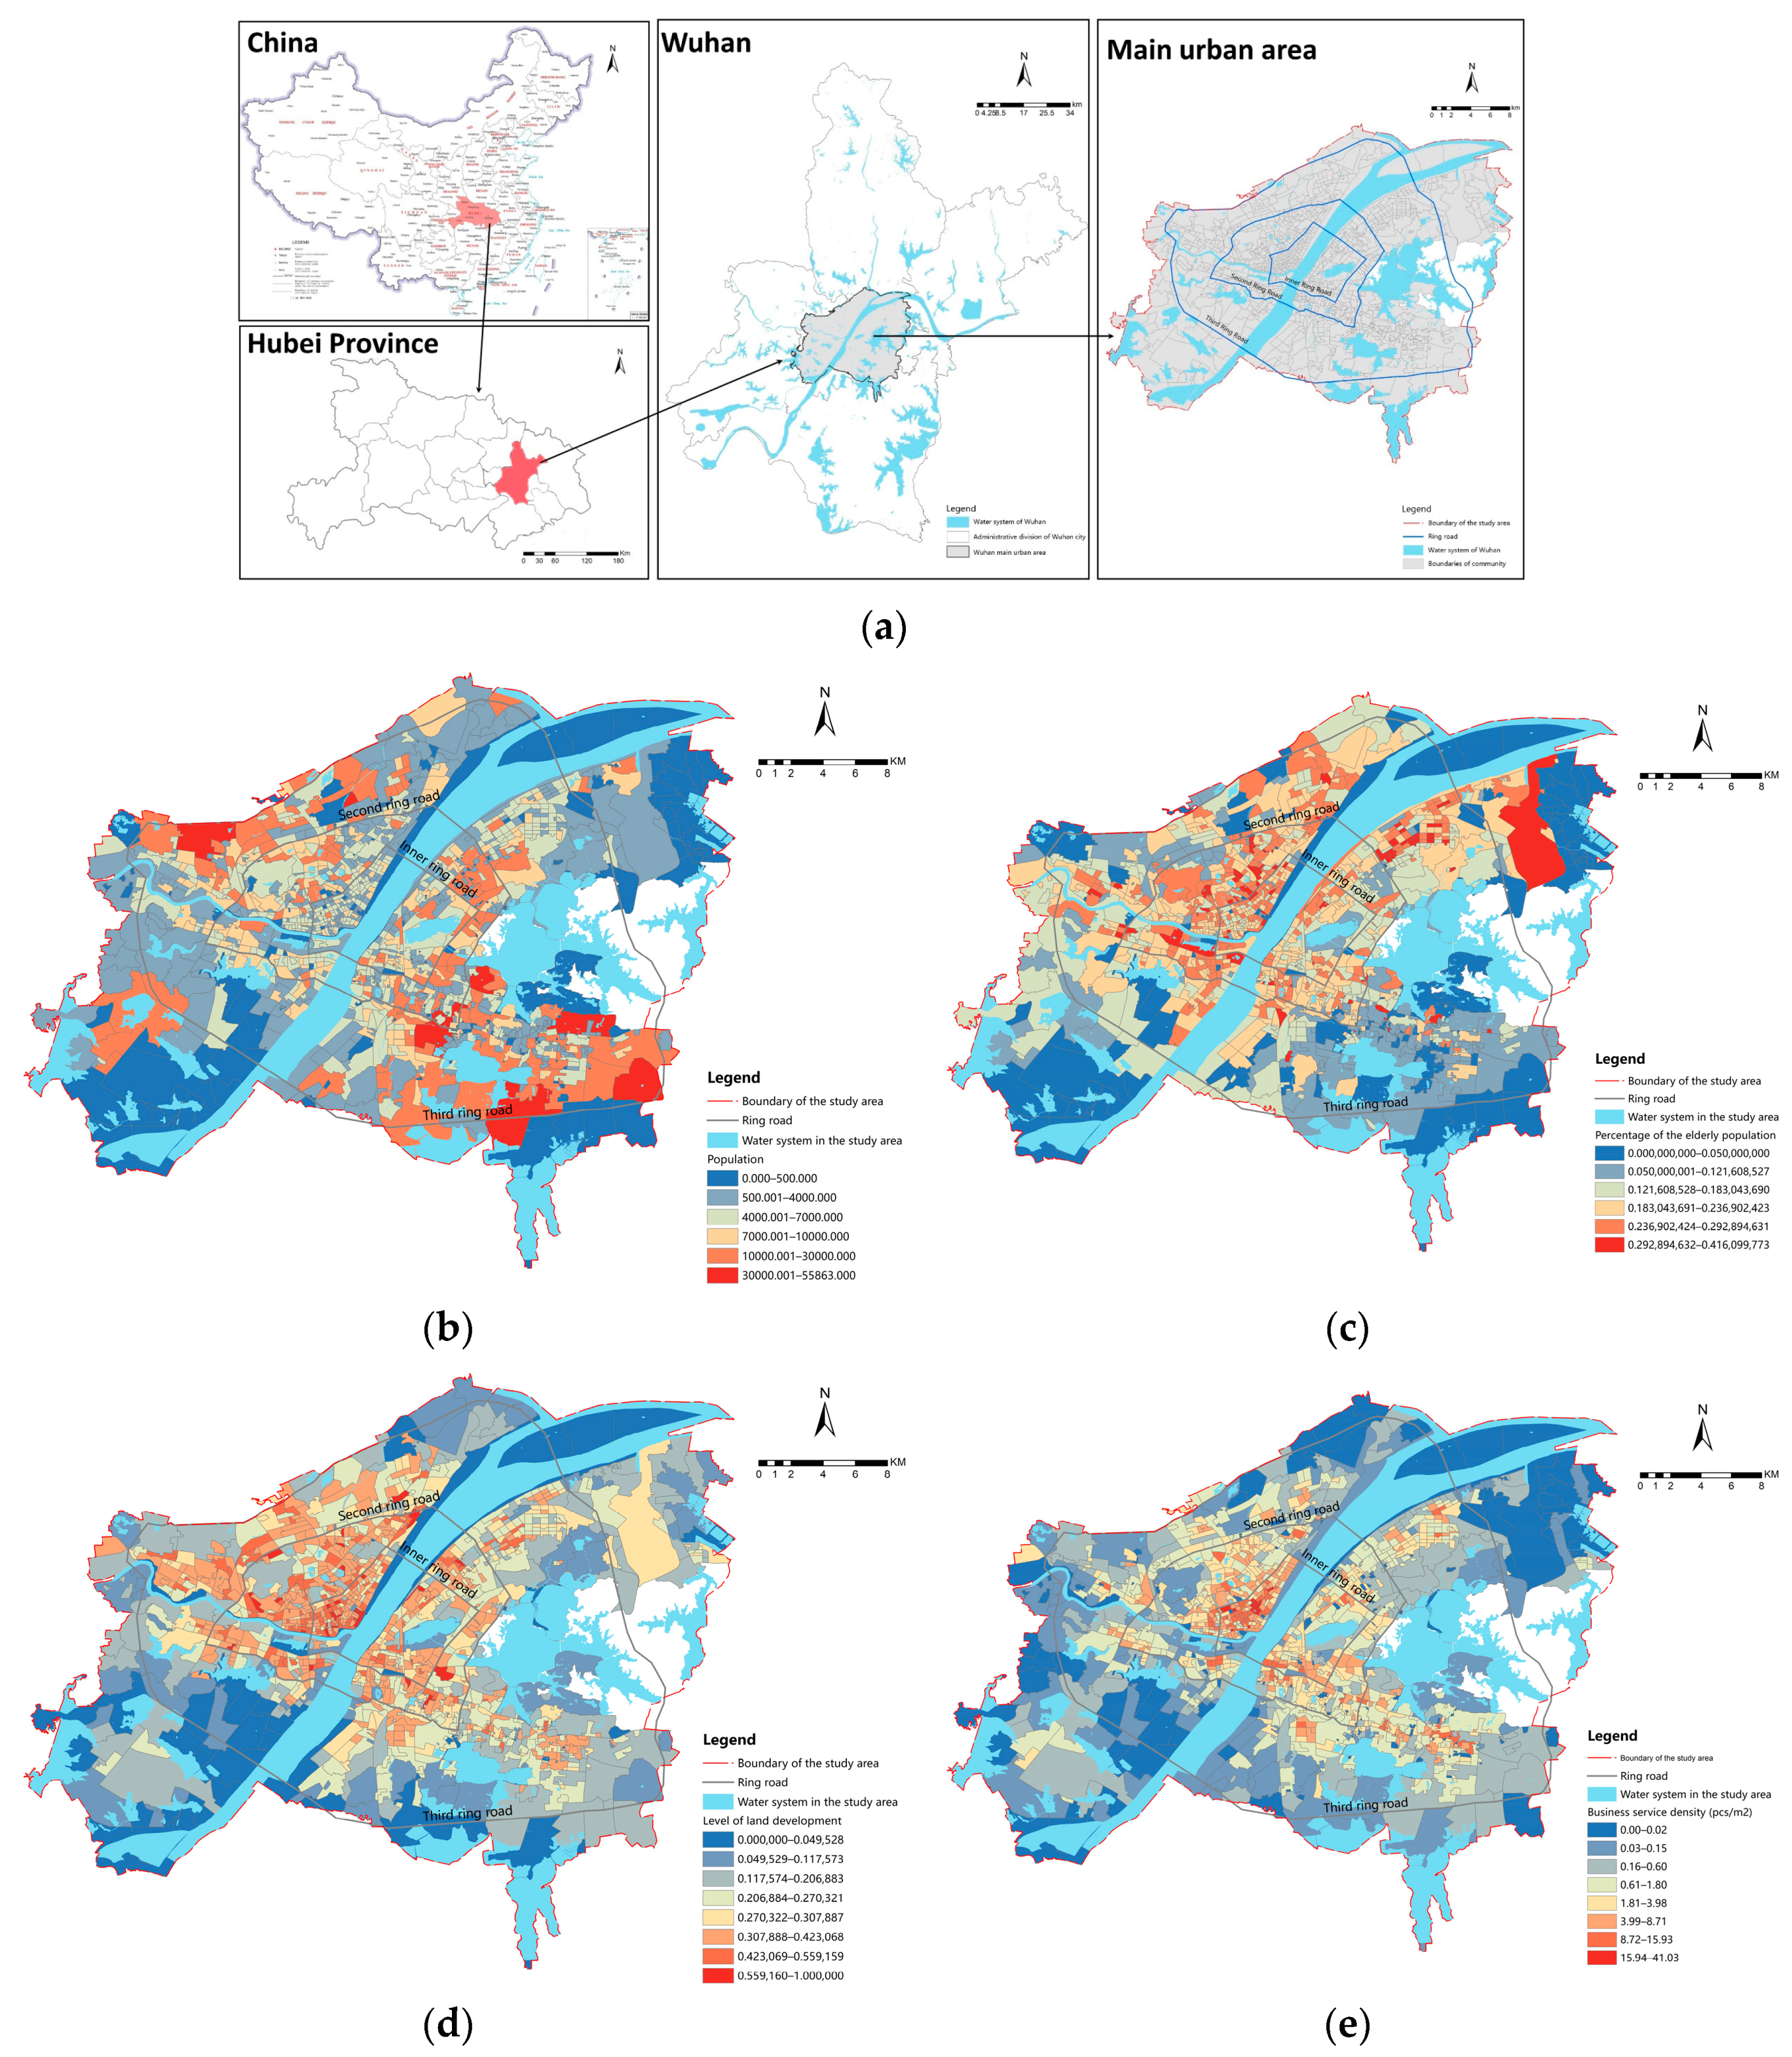
2.1. Study Area
2.2. Data Sources
2.3. Methods
2.3.1. The Calculation Method of Park Supply and Demand
Park Supply Calculation
Park Demand Calculation
Regional Disparities in Park Supply and Demand
2.3.2. Analysis of Supply–Demand Spatial Relationships
Supply and Demand Space Matching Identification
Priority Intervention Area Identification
3. Analysis of Park Supply and Demand
4. Analysis of Park Supply–Demand Patterns
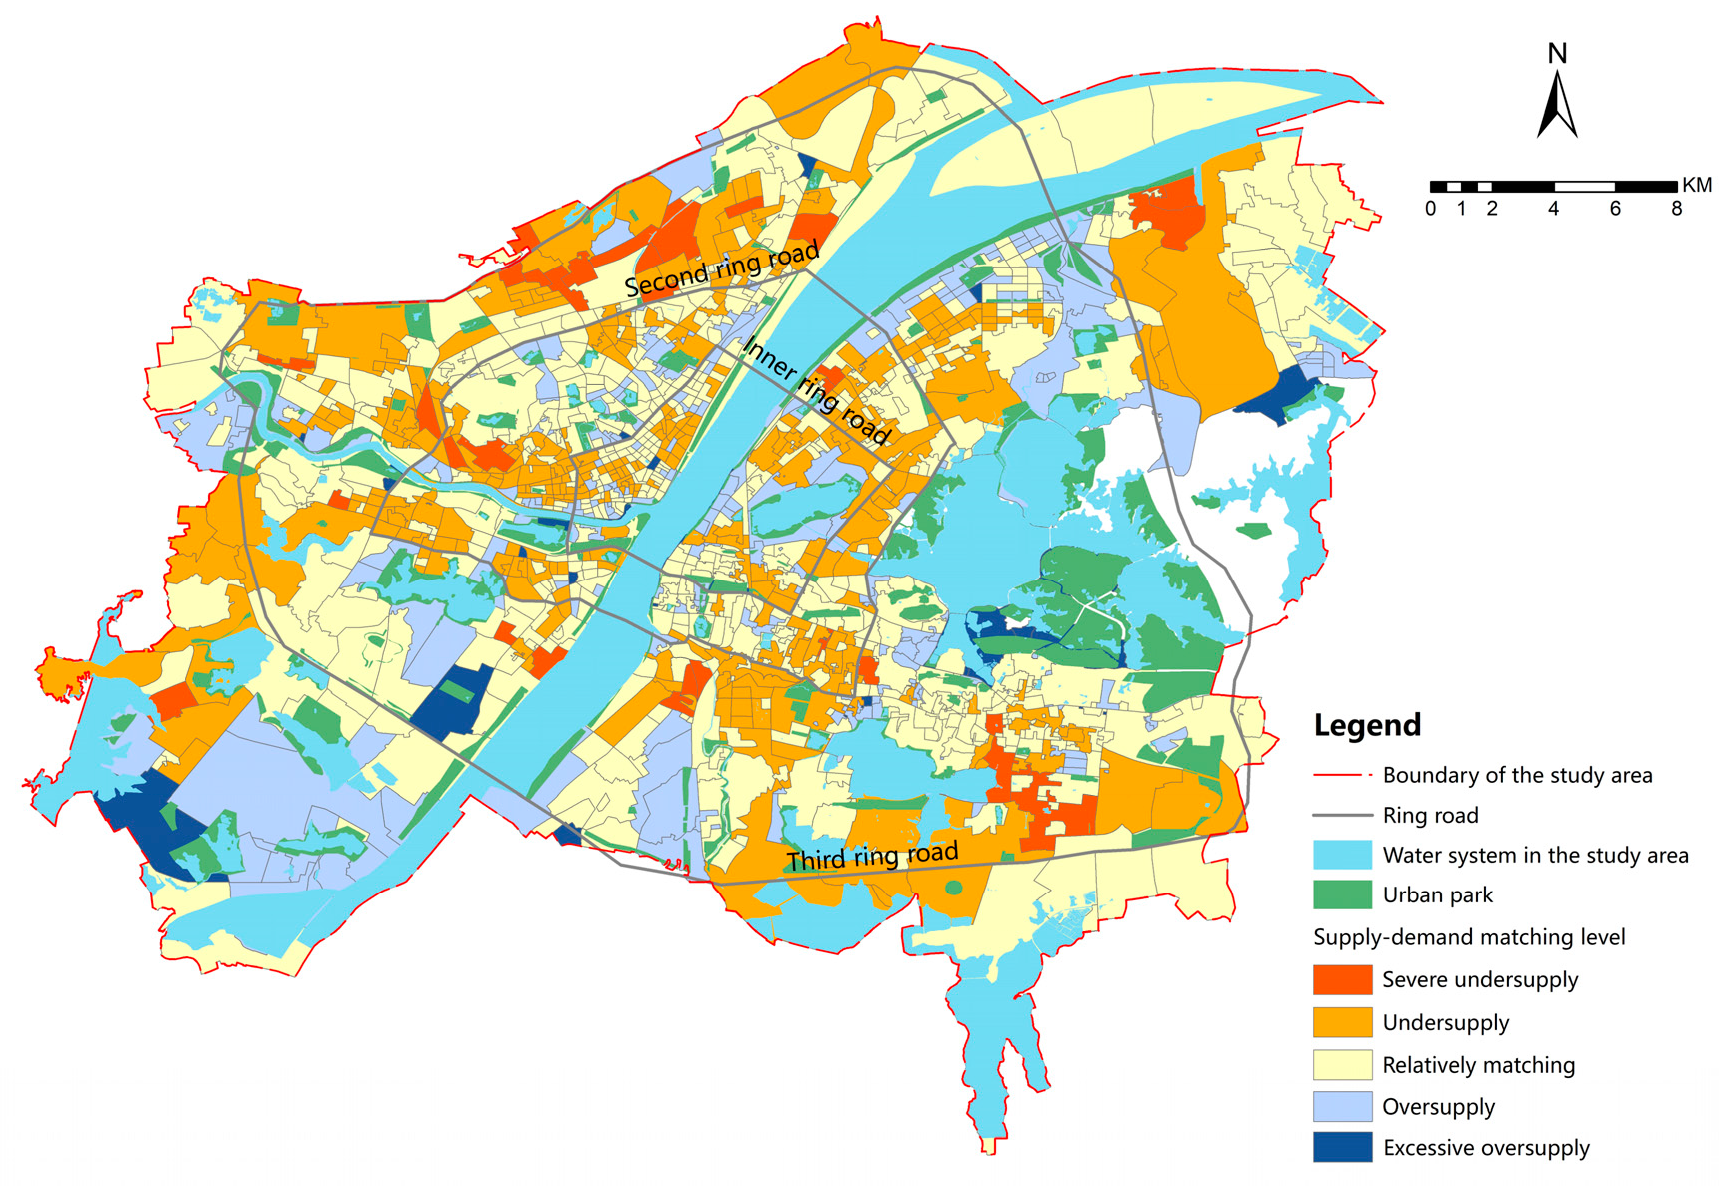
4.1. Identifying Regions of Mismatch Between Park Supply and Demand
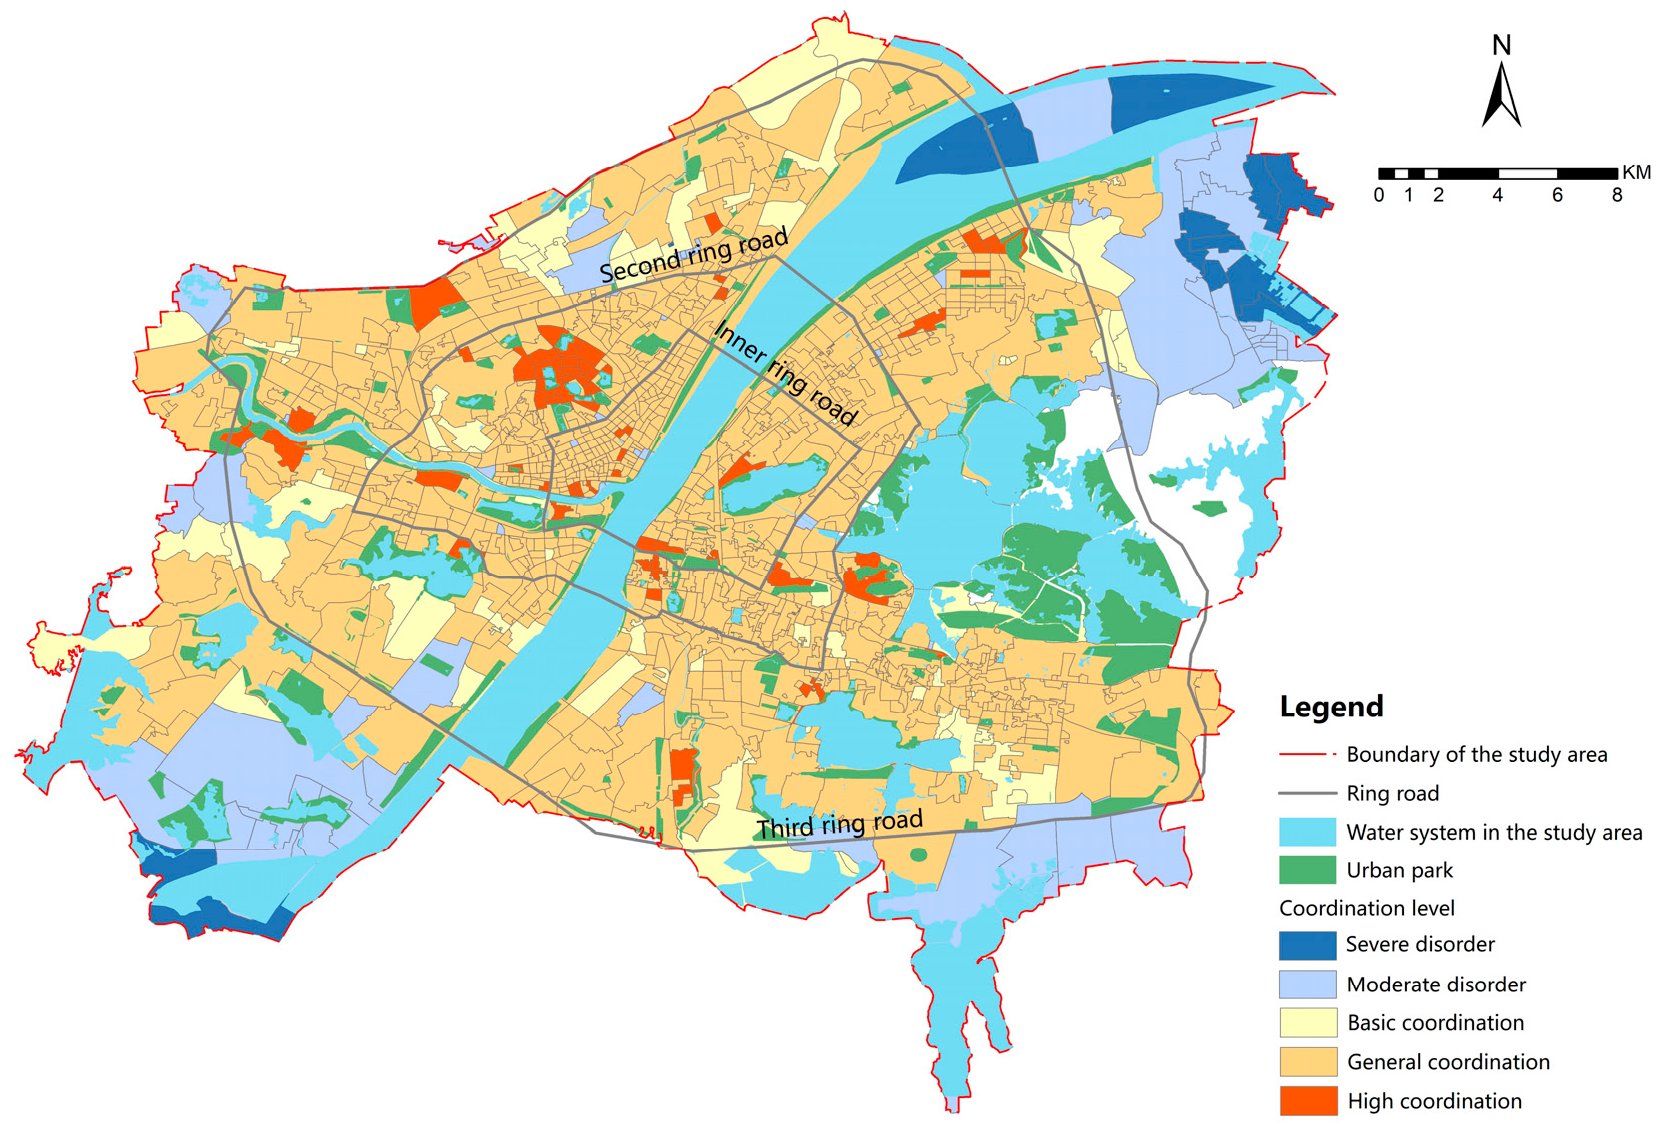
4.2. Discovering Priority Management Areas
5. Discussion and Suggestions
5.1. Discussion
5.2. Suggestions for Urban Planning and Policies
6. Conclusions
Author Contributions
Funding
Institutional Review Board Statement
Informed Consent Statement
Data Availability Statement
Conflicts of Interest
Appendix A
- Which of the following is your age range?
- A. 0–18;
- B. 19–35;
- C. 36–60;
- D. Above 60;
- E. not for disclosure.
- Is Wuhan your permanent place of residence?
- A. yes;
- B. no;
- C. not for disclosure.
- Which of the following ranges do you live in?
- A. Inside the inner ring road;
- B. Inner ring road to the second ring road;
- C. Second ring road to the third ring road;
- D. Outside the third ring road;
- E. not for disclosure.
- Which of the following options is closest to the frequency of your visits to the park?
- A. daily visits and above;
- B. 3–4 weekly visits;
- C. 2–3 monthly visits;
- D. 2–3 quarterly visits;
- E. lower frequencies;
- F. not for disclosure.
References
- Kabisch, N.; Haase, D. Green justice or just green? Provision of urban green spaces in Berlin, Germany. Landsc. Urban Plan. 2014, 122, 129–139. [Google Scholar] [CrossRef]
- Wendel, H.E.W.; Zarger, R.K.; Mihelcic, J.R. Accessibility and usability: Green space preferences, perceptions, and barriers in a rapidly urbanizing city in Latin America. Landsc. Urban Plan. 2012, 107, 272–282. [Google Scholar] [CrossRef]
- Smith, L.M.; Case, J.L.; Smith, H.M.; Harwell, L.C.; Summers, J.K. Relating ecoystem services to domains of human well-being: Foundation for a U.S. index. Ecol. Indic. 2013, 28, 79–90. [Google Scholar] [CrossRef]
- Chiesura, A. The role of urban parks for the sustainable city. Landsc. Urban Plan. 2004, 68, 129–138. [Google Scholar] [CrossRef]
- Heidt, V.; Neef, M. Benefits of Urban Green Space for Improving Urban Climate. In Ecology, Planning, and Management of Urban Forests: International Perspectives; Carreiro, M.M., Song, Y.-C., Wu, J., Eds.; Springer: New York, NY, USA, 2008; pp. 84–96. [Google Scholar]
- Liu, B.; Tian, Y.; Guo, M.; Tran, D.; Alwah, A.A.Q.; Xu, D. Evaluating the disparity between supply and demand of park green space using a multi-dimensional spatial equity evaluation framework. Cities 2022, 121, 103484. [Google Scholar] [CrossRef]
- De Valck, J.; Broekx, S.; Liekens, I.; De Nocker, L.; Van Orshoven, J.; Vranken, L. Contrasting collective preferences for outdoor recreation and substitutability of nature areas using hot spot mapping. Landsc. Urban Plan. 2016, 151, 64–78. [Google Scholar] [CrossRef]
- Helfenstein, J.; Kienast, F. Ecosystem service state and trends at the regional to national level: A rapid assessment. Ecol. Indic. 2014, 36, 11–18. [Google Scholar] [CrossRef]
- Yao, L.; Liu, J.; Wang, R.; Yin, K.; Han, B. Effective green equivalent—A measure of public green spaces for cities. Ecol. Indic. 2014, 47, 123–127. [Google Scholar] [CrossRef]
- Gupta, K.; Kumar, P.; Pathan, S.K.; Sharma, K.P. Urban Neighborhood Green Index—A measure of green spaces in urban areas. Landsc. Urban Plan. 2012, 105, 325–335. [Google Scholar] [CrossRef]
- Dalvi, M.Q.; Martin, K.M. The measurement of accessibility: Some preliminary results. Transportation 1976, 5, 17–42. [Google Scholar] [CrossRef]
- Dadashpoor, H.; Rostami, F.; Alizadeh, B. Is inequality in the distribution of urban facilities inequitable? Exploring a method for identifying spatial inequity in an Iranian city. Cities 2016, 52, 159–172. [Google Scholar] [CrossRef]
- Shen, Y.; Sun, F.; Che, Y. Public green spaces and human wellbeing: Mapping the spatial inequity and mismatching status of public green space in the Central City of Shanghai. Urban For. Urban Green. 2017, 27, 59–68. [Google Scholar] [CrossRef]
- Guo, M.; Liu, B.; Tian, Y.; Xu, D. Equity to Urban Parks for Elderly Residents: Perspectives of Balance between Supply and Demand. Int. J. Environ. Res. Public Health 2020, 17, 8506. [Google Scholar] [CrossRef]
- Christoforidi, I.; Kollaros, D.; Papadakaki, M.; Psaroudaki, A.; Antoniou, T.; Daliakopoulos, I.N. A novel index for assessing perceived availability and public demand for urban green space: Application in a Mediterranean island. Urban For. Urban Green. 2022, 69, 127498. [Google Scholar] [CrossRef]
- Schrammeijer, E.A.; Malek, Ž.; Verburg, P.H. Mapping demand and supply of functional niches of urban green space. Ecol. Indic. 2022, 140, 109031. [Google Scholar] [CrossRef]
- Lee, K.J.; Scott, D. Bourdieu and African Americans’ Park Visitation: The Case of Cedar Hill State Park in Texas. Leis. Sci. 2016, 38, 424–440. [Google Scholar] [CrossRef]
- Larson, K.L.; Brown, J.A.; Lee, K.J.; Pearsall, H. Park equity: Why subjective measures matter. Urban For. Urban Green. 2022, 76, 127733. [Google Scholar] [CrossRef]
- Bennett, R. The Geography of Public Finance. In The Human Geography of Contemporary Britain; Short, R.J., Kirby, A., Eds.; Red Globe Press: London, UK, 1984; pp. 64–81. [Google Scholar]
- Nicholls, S. Measuring the accessibility and equity of public parks: A case study using GIS. Manag. Leis. 2001, 6, 201–219. [Google Scholar] [CrossRef]
- Wu, J.S.; Si, M.L.; Li, W.F. Spatial equity analysis of urban green space from the perspective of balance between supply and demand: A case study of Futian District, Shenzhen, China. J. Appl. Ecol. 2016, 27, 2831–2838. [Google Scholar]
- Zhai, T.; Wang, J.; Jin, Z.; Qi, Y.; Fang, Y.; Liu, J. Did improvements of ecosystem services supply-demand imbalance change environmental spatial injustices? Ecol. Indic. 2020, 111, 106068. [Google Scholar] [CrossRef]
- Liu, Z.; Huang, Q.; Yang, H. Supply-demand spatial patterns of park cultural services in megalopolis area of Shenzhen, China. Ecol. Indic. 2021, 121, 107066. [Google Scholar] [CrossRef]
- Zhang, J.; Tan, P.Y. Demand for parks and perceived accessibility as key determinants of urban park use behavior. Urban For. Urban Green. 2019, 44, 126420. [Google Scholar] [CrossRef]
- Nahuelhual, L.; Carmona, A.; Lozada, P.; Jaramillo, A.; Aguayo, M. Mapping recreation and ecotourism as a cultural ecosystem service: An application at the local level in Southern Chile. Appl. Geogr. 2013, 40, 71–82. [Google Scholar] [CrossRef]
- Guo, S.; Yang, G.; Pei, T.; Ma, T.; Song, C.; Shu, H.; Du, Y.; Zhou, C. Analysis of factors affecting urban park service area in Beijing: Perspectives from multi-source geographic data. Landsc. Urban Plan. 2019, 181, 103–117. [Google Scholar] [CrossRef]
- Burkhard, B.; Kroll, F.; Nedkov, S.; Müller, F. Mapping ecosystem service supply, demand and budgets. Ecol. Indic. 2012, 21, 17–29. [Google Scholar] [CrossRef]
- Paracchini, M.L.; Zulian, G.; Kopperoinen, L.; Maes, J.; Schägner, J.P.; Termansen, M.; Zandersen, M.; Perez-Soba, M.; Scholefield, P.A.; Bidoglio, G. Mapping cultural ecosystem services: A framework to assess the potential for outdoor recreation across the EU. Ecol. Indic. 2014, 45, 371–385. [Google Scholar] [CrossRef]
- Schirpke, U.; Meisch, C.; Marsoner, T.; Tappeiner, U. Revealing spatial and temporal patterns of outdoor recreation in the European Alps and their surroundings. Ecosyst. Serv. 2018, 31, 336–350. [Google Scholar] [CrossRef]
- Gaston, K.J.; Ávila-Jiménez, M.L.; Edmondson, J.L.; Jones, J. REVIEW: Managing urban ecosystems for goods and services. J. Appl. Ecol. 2013, 50, 830–840. [Google Scholar] [CrossRef]
- Caynes, R.J.C.; Mitchell, M.G.E.; Wu, D.S.; Johansen, K.; Rhodes, J.R. Using high-resolution LiDAR data to quantify the three-dimensional structure of vegetation in urban green space. Urban Ecosyst. 2016, 19, 1749–1765. [Google Scholar] [CrossRef]
- Tian, Y.; Jim, C.Y.; Wang, H. Assessing the landscape and ecological quality of urban green spaces in a compact city. Landsc. Urban Plan. 2014, 121, 97–108. [Google Scholar] [CrossRef]
- Chen, K. A systematic review of alternative protocols for evaluating non-spatial dimensions of urban parks. Urban For. Urban Green. 2020, 53, 126718. [Google Scholar] [CrossRef]
- Hughey, S.M.; Walsemann, K.M.; Child, S.; Powers, A.; Reed, J.A.; Kaczynski, A.T. Using an environmental justice approach to examine the relationships between park availability and quality indicators, neighborhood disadvantage, and racial/ethnic composition. Landsc. Urban Plan. 2016, 148, 159–169. [Google Scholar] [CrossRef]
- Rigolon, A. A complex landscape of inequity in access to urban parks: A literature review. Landsc. Urban Plan. 2016, 153, 160–169. [Google Scholar] [CrossRef]
- Willemen, L.; Verburg, P.H.; Hein, L.; van Mensvoort, M.E.F. Spatial characterization of landscape functions. Landsc. Urban Plan. 2008, 88, 34–43. [Google Scholar] [CrossRef]
- Sonter, L.J.; Watson, K.B.; Wood, S.A.; Ricketts, T.H. Spatial and Temporal Dynamics and Value of Nature-Based Recreation, Estimated via Social Media. PLoS ONE 2016, 11, e0162372. [Google Scholar] [CrossRef] [PubMed]
- Keeler, B.L.; A Wood, S.; Polasky, S.; Kling, C.; Filstrup, C.T.; A Downing, J. Recreational demand for clean water: Evidence from geotagged photographs by visitors to lakes. Front. Ecol. Environ. 2015, 13, 76–81. [Google Scholar] [CrossRef]
- Ode, Å.; Fry, G.; Tveit, M.S.; Messager, P.; Miller, D. Indicators of perceived naturalness as drivers of landscape preference. J. Environ. Manag. 2009, 90, 375–383. [Google Scholar] [CrossRef]
- Kienast, F.; Degenhardt, B.; Weilenmann, B.; Wäger, Y.; Buchecker, M. GIS-assisted mapping of landscape suitability for nearby recreation. Landsc. Urban Plan. 2012, 105, 385–399. [Google Scholar] [CrossRef]
- Peña, L.; Casado-Arzuaga, I.; Onaindia, M. Mapping recreation supply and demand using an ecological and a social evaluation approach. Ecosyst. Serv. 2015, 13, 108–118. [Google Scholar] [CrossRef]
- Thompson, C.W. Linking landscape and health: The recurring theme. Landsc. Urban Plan. 2011, 99, 187–195. [Google Scholar] [CrossRef]
- Wolff, S.; Schulp, C.J.E.; Verburg, P.H. Mapping ecosystem services demand: A review of current research and future perspectives. Ecol. Indic. 2015, 55, 159–171. [Google Scholar] [CrossRef]
- Schirpke, U.; Scolozzi, R.; De Marco, C.; Tappeiner, U. Mapping beneficiaries of ecosystem services flows from Natura 2000 sites. Ecosyst. Serv. 2014, 9, 170–179. [Google Scholar] [CrossRef]
- Wood, S.A.; Guerry, A.D.; Silver, J.M.; Lacayo, M. Using social media to quantify nature-based tourism and recreation. Sci. Rep. 2013, 3, 2976. [Google Scholar] [CrossRef] [PubMed]
- Wang, J.; Zhai, T.; Lin, Y.; Kong, X.; He, T. Spatial imbalance and changes in supply and demand of ecosystem services in China. Sci. Total Environ. 2019, 657, 781–791. [Google Scholar] [CrossRef]
- Ali, M.J.; Rahaman, M.; Hossain, S.I. Urban green spaces for elderly human health: A planning model for healthy city living. Land Use Policy 2022, 114, 105970. [Google Scholar] [CrossRef]
- Egger, G.; Dixon, J. Beyond obesity and lifestyle: A review of 21st century chronic disease determinants. BioMed Res. Int. 2014, 2014, 731685. [Google Scholar] [CrossRef] [PubMed]
- Yung, E.H.K.; Conejos, S.; Chan, E.H.W. Social needs of the elderly and active aging in public open spaces in urban renewal. Cities 2016, 52, 114–122. [Google Scholar] [CrossRef]
- Guo, S.; Song, C.; Pei, T.; Liu, Y.; Ma, T.; Du, Y.; Chen, J.; Fan, Z.; Tang, X.; Peng, Y.; et al. Accessibility to urban parks for elderly residents: Perspectives from mobile phone data. Landsc. Urban Plan. 2019, 191, 103642. [Google Scholar] [CrossRef]
- Haase, D.; Haase, A.; Rink, D. Conceptualizing the nexus between urban shrinkage and ecosystem services. Landsc. Urban Plan. 2014, 132, 159–169. [Google Scholar] [CrossRef]
- Zoderer, B.M.; Tasser, E.; Erb, K.-H.; Lupo Stanghellini, P.S.; Tappeiner, U. Identifying and mapping the tourists perception of cultural ecosystem services: A case study from an Alpine region. Land Use Policy 2016, 56, 251–261. [Google Scholar] [CrossRef]
- Palomo, I.; Martín-López, B.; Potschin, M.; Haines-Young, R.; Montes, C. National Parks, buffer zones and surrounding lands: Mapping ecosystem service flows. Ecosyst. Serv. 2013, 4, 104–116. [Google Scholar] [CrossRef]
- Rosenberger, R.S.; Needham, M.D.; Morzillo, A.T.; Moehrke, C. Attitudes, willingness to pay, and stated values for recreation use fees at an urban proximate forest. J. For. Econ. 2012, 18, 271–281. [Google Scholar] [CrossRef]
- Panduro, T.E.; Veie, K.L. Classification and valuation of urban green spaces—A hedonic house price valuation. Landsc. Urban Plan. 2013, 120, 119–128. [Google Scholar] [CrossRef]
- Alessandro, R.; Matthew, B.; Viniece, J. Inequities in the quality of urban park systems: An environmental justice investigation of cities in the United States. Landsc. Urban Plan. 2018, 178, 156–169. [Google Scholar]
- De, S.; Das, A.; Mazumder, T.N. A systematic literature review of remote sensing approaches in urban green space research: Towards achieving sustainable development goals. Urban Clim. 2025, 59, 102332. [Google Scholar] [CrossRef]
- Li, J.; Gao, J.; Zhang, Z.; Fu, J.; Shao, G.; Zhao, Z.; Yang, P. Insights into citizens’ experiences of cultural ecosystem services in urban green spaces based on social media analytics. Landsc. Urban Plan. 2024, 244, 104999. [Google Scholar] [CrossRef]
- Cui, N.; Malleson, N.; Houlden, V.; Comber, A. Using social media data to understand the impact of the COVID-19 pandemic on urban green space use. Urban For. Urban Green. 2022, 74, 127677. [Google Scholar] [CrossRef]
- Chen, J.; Liu, B.; Li, S.; Jiang, B.; Wang, X.; Lu, W.; Hu, Y.; Wen, T.; Feng, Y. Actual supply-demand of the urban green space in a populous and highly developed city: Evidence based on mobile signal data in Guangzhou. Ecol. Indic. 2024, 169, 112839. [Google Scholar] [CrossRef]
- Li, W.; Song, Y.; Herr, C.M.; Stouffs, R. A review of big data applications in studies of urban green space. Urban For. Urban Green. 2024, 101, 128524. [Google Scholar] [CrossRef]
- Wu, H.-L.; Cheng, W.-C.; Shen, S.-L.; Lin, M.-Y.; Arulrajah, A. Variation of hydro-environment during past four decades with underground sponge city planning to control flash floods in Wuhan, China: An overview. Undergr. Space 2020, 5, 184–198. [Google Scholar] [CrossRef]
- Xing, L.; Liu, Y.; Liu, X.; Wei, X.; Mao, Y. Spatio-temporal disparity between demand and supply of park green space service in urban area of Wuhan from 2000 to 2014. Habitat Int. 2018, 71, 49–59. [Google Scholar] [CrossRef]
- Xing, L.; Liu, Y.; Liu, X. Measuring spatial disparity in accessibility with a multi-mode method based on park green spaces classification in Wuhan, China. Appl. Geogr. 2018, 94, 251–261. [Google Scholar] [CrossRef]
- Plieninger, T.; Dijks, S.; Oteros-Rozas, E.; Bieling, C. Assessing, mapping, and quantifying cultural ecosystem services at community level. Land Use Policy 2013, 33, 118–129. [Google Scholar] [CrossRef]
- Ryan, R.L. The social landscape of planning: Integrating social and perceptual research with spatial planning information. Landsc. Urban Plan. 2011, 100, 361–363. [Google Scholar] [CrossRef]
- Emrich, C.T.; Cutter, S.L. Social Vulnerability to Climate-Sensitive Hazards in the Southern United States. Weather Clim. Soc. 2011, 3, 193–208. [Google Scholar] [CrossRef]
- Shen, J.; Du, S.; Huang, Q.; Yin, J.; Zhang, M.; Wen, J.; Gao, J. Mapping the city-scale supply and demand of ecosystem flood regulation services—A case study in Shanghai. Ecol. Indic. 2019, 106, 105544. [Google Scholar] [CrossRef]
- Xu, D.; Hou, G. The Spatiotemporal Coupling Characteristics of Regional Urbanization and Its Influencing Factors: Taking the Yangtze River Delta as an Example. Sustainability 2019, 11, 822. [Google Scholar] [CrossRef]
- Wilkerson, M.L.; Mitchell, M.G.E.; Shanahan, D.; Wilson, K.A.; Ives, C.D.; Lovelock, C.E.; Rhodes, J.R. The role of socio-economic factors in planning and managing urban ecosystem services. Ecosyst. Serv. 2018, 31, 102–110. [Google Scholar] [CrossRef]
- Brown, G. Mapping Spatial Attributes in Survey Research for Natural Resource Management: Methods and Applications. Soc. Nat. Resour. 2004, 18, 17–39. [Google Scholar] [CrossRef]
- Jim, C.Y.; Shan, X. Socioeconomic effect on perception of urban green spaces in Guangzhou, China. Cities 2013, 31, 123–131. [Google Scholar] [CrossRef]
- Chen, W.Y.; Hu, F.Z.Y. Producing nature for public: Land-based urbanization and provision of public green spaces in China. Appl. Geogr. 2015, 58, 32–40. [Google Scholar] [CrossRef]
- Zhang, W.; Yang, J.; Ma, L.; Huang, C. Factors affecting the use of urban green spaces for physical activities: Views of young urban residents in Beijing. Urban For. Urban Green. 2015, 14, 851–857. [Google Scholar] [CrossRef]
- Wang, X.; Meng, Q.; Liu, X.; Allam, M.; Zhang, L.; Hu, X.; Bi, Y.; Jancsó, T. Evaluation of Fairness of Urban Park Green Space Based on an Improved Supply Model of Green Space: A Case Study of Beijing Central City. Remote Sens. 2023, 15, 244. [Google Scholar] [CrossRef]
- Haaland, C.; van den Bosch, C.K. Challenges and strategies for urban green-space planning in cities undergoing densification: A review. Urban For. Urban Green. 2015, 14, 760–771. [Google Scholar] [CrossRef]


| Evaluation Projects | Secondary Indicators | Meaning | Calculation Method |
|---|---|---|---|
| Park quality B3 | Morphological index C1 | The larger the morphological index, the fewer the traces of human disturbance in the park and the more stable the internal ecosystem. | —park area; —park perimeter |
| Hydrophilic index C2 | The higher the water coverage and the greater the percentage of waterfront, the higher the quality of the park. | —water area inside the park; —circumference of water | |
| Nature index C3 | The higher the green coverage and the more balanced the vegetation species, the higher the naturalness of the park. | , , —area of grass, shrubs, and trees in the park; —standard deviation of the area of trees, shrubs, and grasses | |
| Comprehensive facility index C4 | The greater the number and variety of recreational facilities, the better the quality of the park. | Points are given for measurable facilities such as badminton courts by number and for non-measurable facilities such as running tracks by whether they are equipped or not. |
| Scope | Average_Supply | Gini Coefficient_Supply | Average_Demand | Gini Coefficient_Demand |
|---|---|---|---|---|
| Inner ring road | 0.4239 | 0.0920 | 0.5504 | 0.0971 |
| Inner ring road to the second ring road | 0.3893 | 0.1528 | 0.5244 | 0.1056 |
| Second ring road to the third ring road | 0.3468 | 0.1867 | 0.4815 | 0.1395 |
| Outside the third ring road | 0.2301 | 0.3854 | 0.2272 | 0.5580 |
| Scope | Severe Undersupply/Ratio (%) | Undersupply/Ratio (%) | Relatively Matching/Ratio (%) | Oversupply/Ratio (%) | Excessive Oversupply/Ratio (%) |
|---|---|---|---|---|---|
| Inner ring road | 0/0 | 73/30.42 | 112/46.67 | 51/21.25 | 4/1.67 |
| Inner ring road to the second ring road | 5/1.23 | 113/27.9 | 216/53.33 | 65/16.05 | 6/1.48 |
| Second ring road to the third ring road | 21/3.76 | 134/23.97 | 276/49.37 | 113/20.21 | 15/2.68 |
| Outside the third ring road | 4/4.21 | 17/17.89 | 44/46.32 | 28/29.47 | 2/2.11 |
| Total | 30 | 337 | 648 | 257 | 27 |
| Scope | Severe Disorder/Ratio (%) | General Disorder/Ratio (%) | Basic Coordination/Ratio (%) | General Coordination/Ratio (%) | High Coordination/Ratio (%) |
|---|---|---|---|---|---|
| Inner ring road | 0/0 | 6/2.5 | 4/1.67 | 218/90.83 | 12/5 |
| Inner ring road to the second ring road | 0/0 | 10/2.47 | 16/3.95 | 348/85.93 | 31/7.65 |
| Second ring road to the third ring road | 3/0.54 | 20/3.58 | 74/13.24 | 447/79.96 | 15/2.68 |
| Outside the third ring road | 14/14.74 | 41/41.16 | 10/10.53 | 30/31.58 | 0/0 |
| Total | 17 | 77 | 104 | 1043 | 58 |
| Scope | Park Supply and Demand Matching Patterns | ||||||
|---|---|---|---|---|---|---|---|
| Severe Undersupply | Undersupply | Relatively Matching | Oversupply | Excessive Oversupply | |||
| Coupling coordination degree (CCD) | severe disorder | I | 0 | 0 | 17 | 0 | 0 |
| general disorder | II | 0 | 7 | 15 | 41 | 14 | |
| basic coordination | III | 16 | 40 | 19 | 22 | 7 | |
| general coordination | IV | 14 | 290 | 550 | 183 | 6 | |
| high coordination | V | 0 | 0 | 47 | 11 | 0 | |
Disclaimer/Publisher’s Note: The statements, opinions and data contained in all publications are solely those of the individual author(s) and contributor(s) and not of MDPI and/or the editor(s). MDPI and/or the editor(s) disclaim responsibility for any injury to people or property resulting from any ideas, methods, instructions or products referred to in the content. |
© 2025 by the authors. Licensee MDPI, Basel, Switzerland. This article is an open access article distributed under the terms and conditions of the Creative Commons Attribution (CC BY) license (https://creativecommons.org/licenses/by/4.0/).
Share and Cite
Yang, Y.; Wu, Y.; Jiao, H. Assessing Urban Park Equity in China Through Supply and Demand Balance: A Case Study of Wuhan City, China. Sustainability 2025, 17, 2255. https://doi.org/10.3390/su17052255
Yang Y, Wu Y, Jiao H. Assessing Urban Park Equity in China Through Supply and Demand Balance: A Case Study of Wuhan City, China. Sustainability. 2025; 17(5):2255. https://doi.org/10.3390/su17052255
Chicago/Turabian StyleYang, Yunzi, Yangyi Wu, and Hongzan Jiao. 2025. "Assessing Urban Park Equity in China Through Supply and Demand Balance: A Case Study of Wuhan City, China" Sustainability 17, no. 5: 2255. https://doi.org/10.3390/su17052255
APA StyleYang, Y., Wu, Y., & Jiao, H. (2025). Assessing Urban Park Equity in China Through Supply and Demand Balance: A Case Study of Wuhan City, China. Sustainability, 17(5), 2255. https://doi.org/10.3390/su17052255