
Remote Sensing Insights into Urban–Rural Imbalance and Sustainable Development: A Case Study in Guangdong, China


Abstract
1. Introduction
2. Data
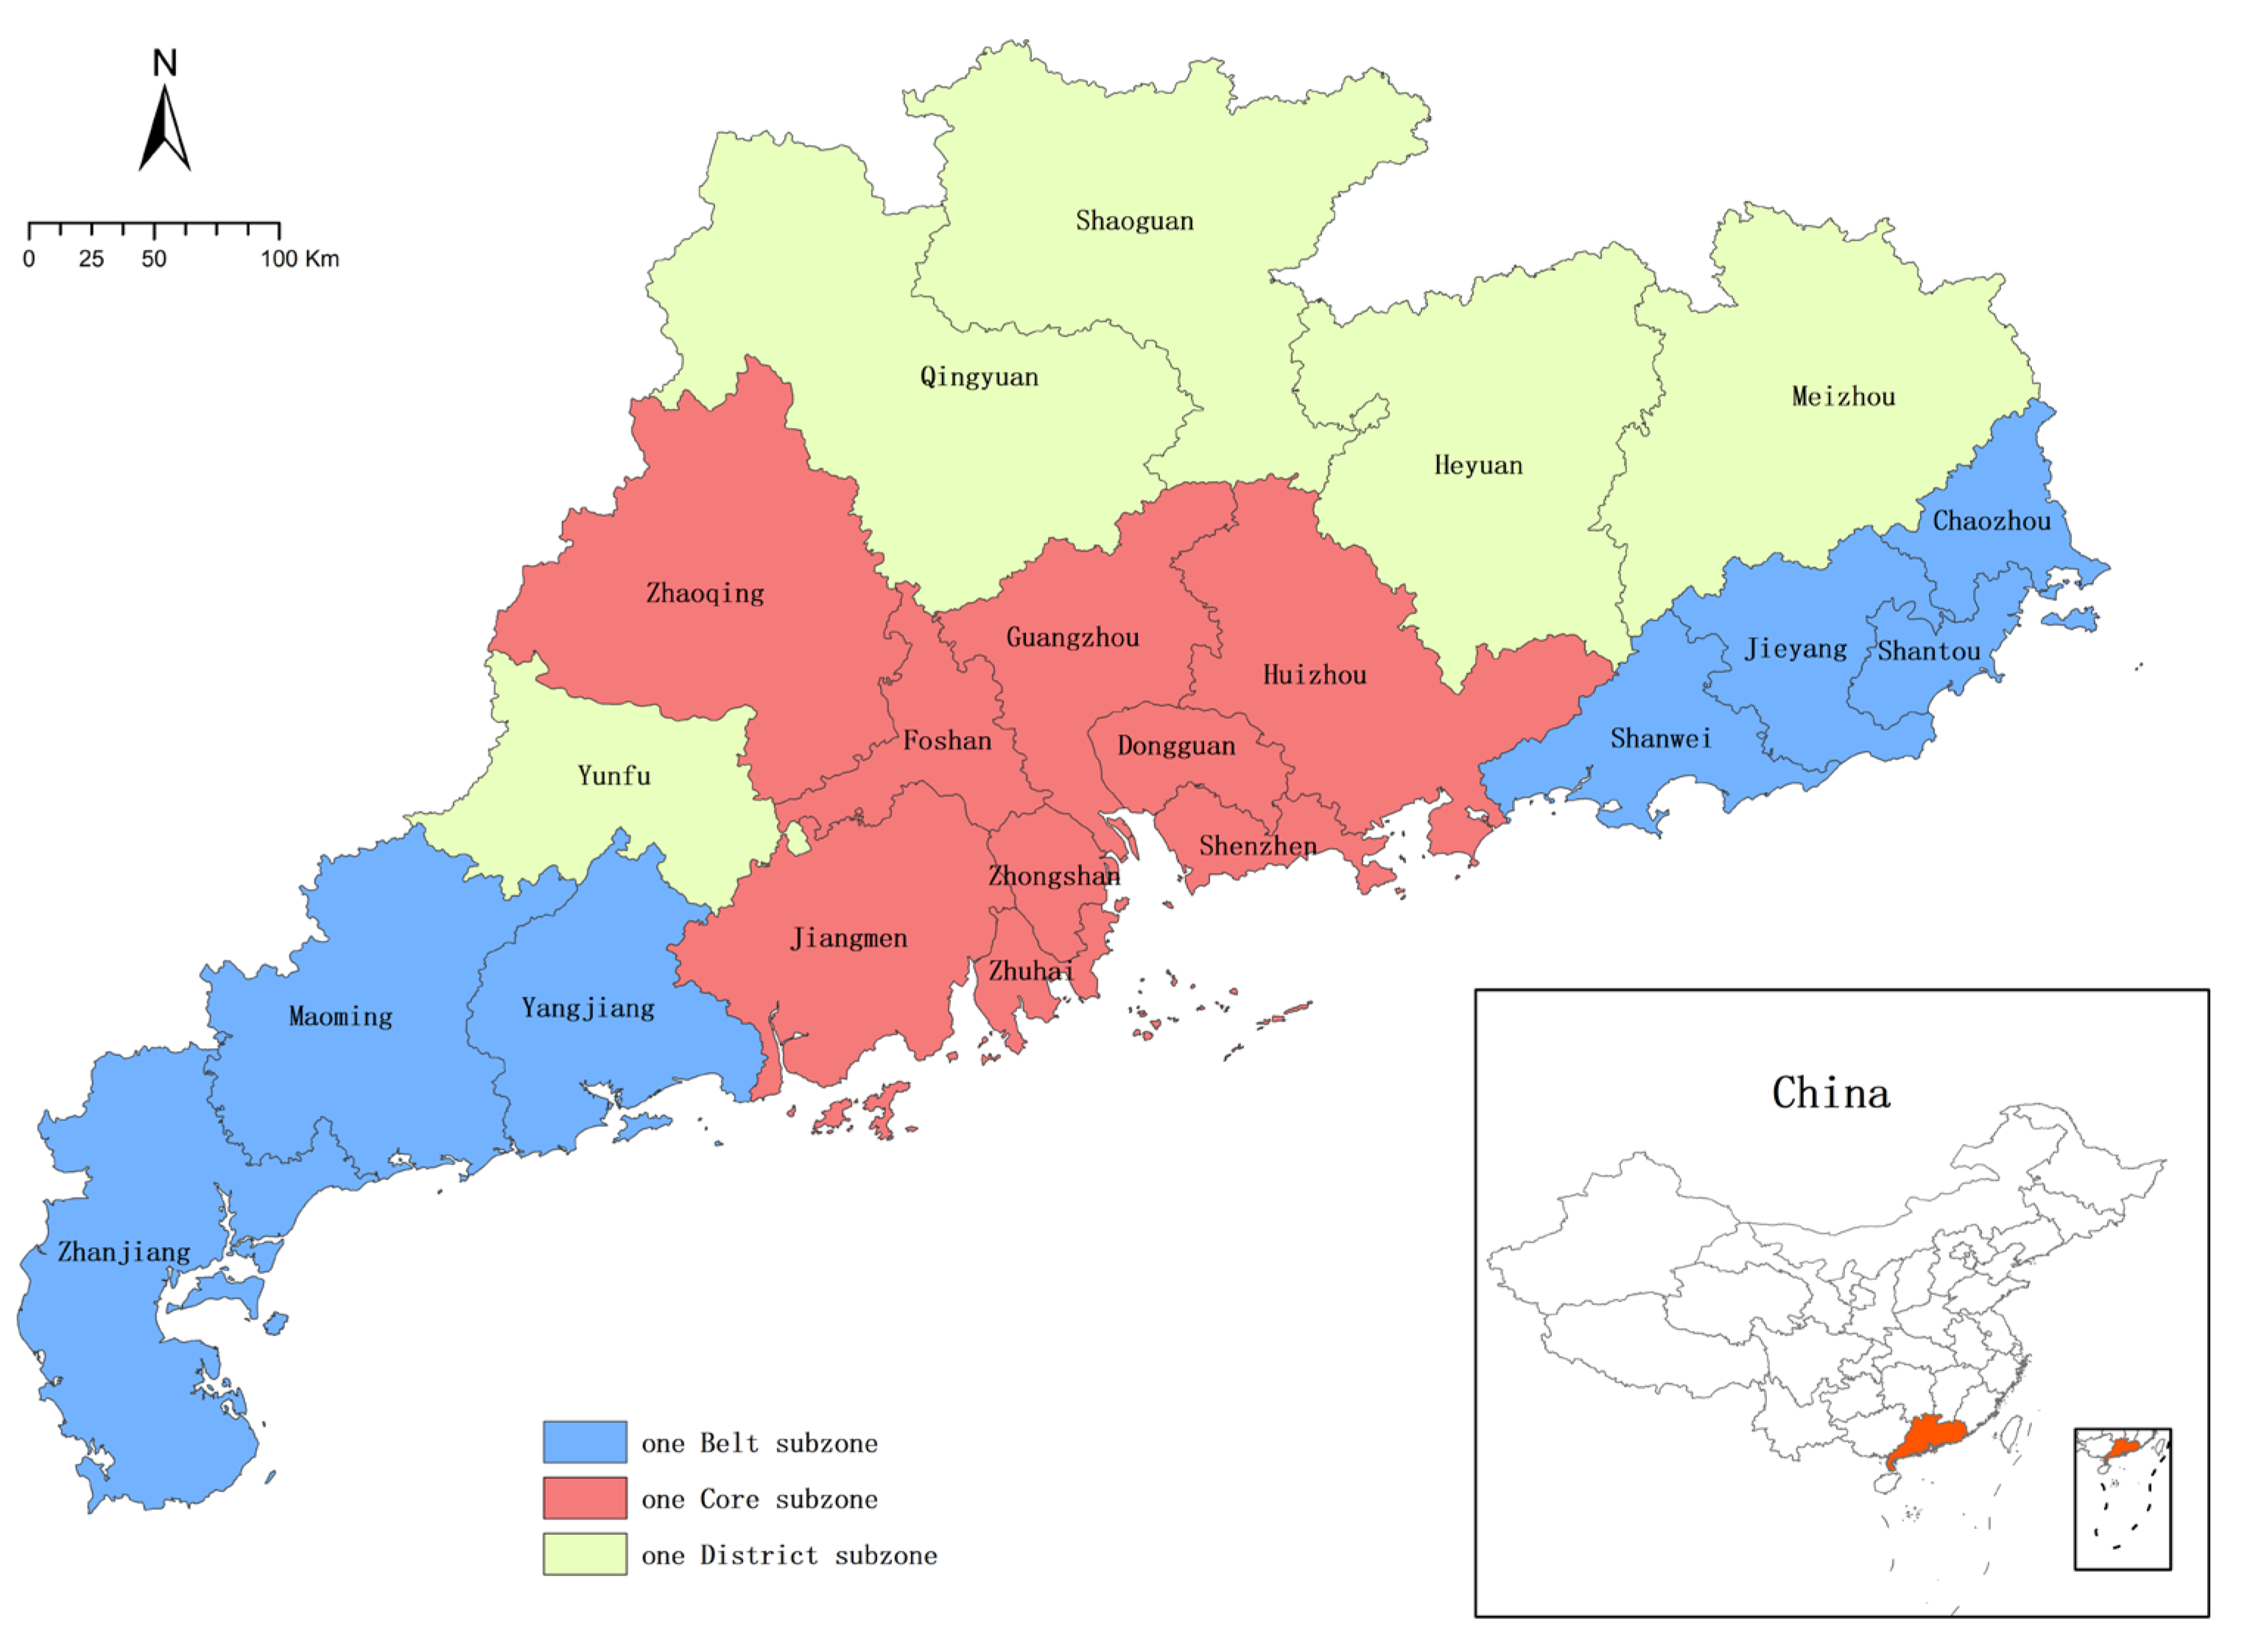
2.1. Study Area
2.2. Data Source
2.2.1. World Settlement Footprint
2.2.2. DMSP-OLS
3. Methods
3.1. NTL-Based Urban–Rural Classification
3.2. Indicator for Imbalanced Expansion
3.3. Indicator for Imbalanced Degree
4. Results
4.1. Pattern of Settlement Distribution on NTL Intensity
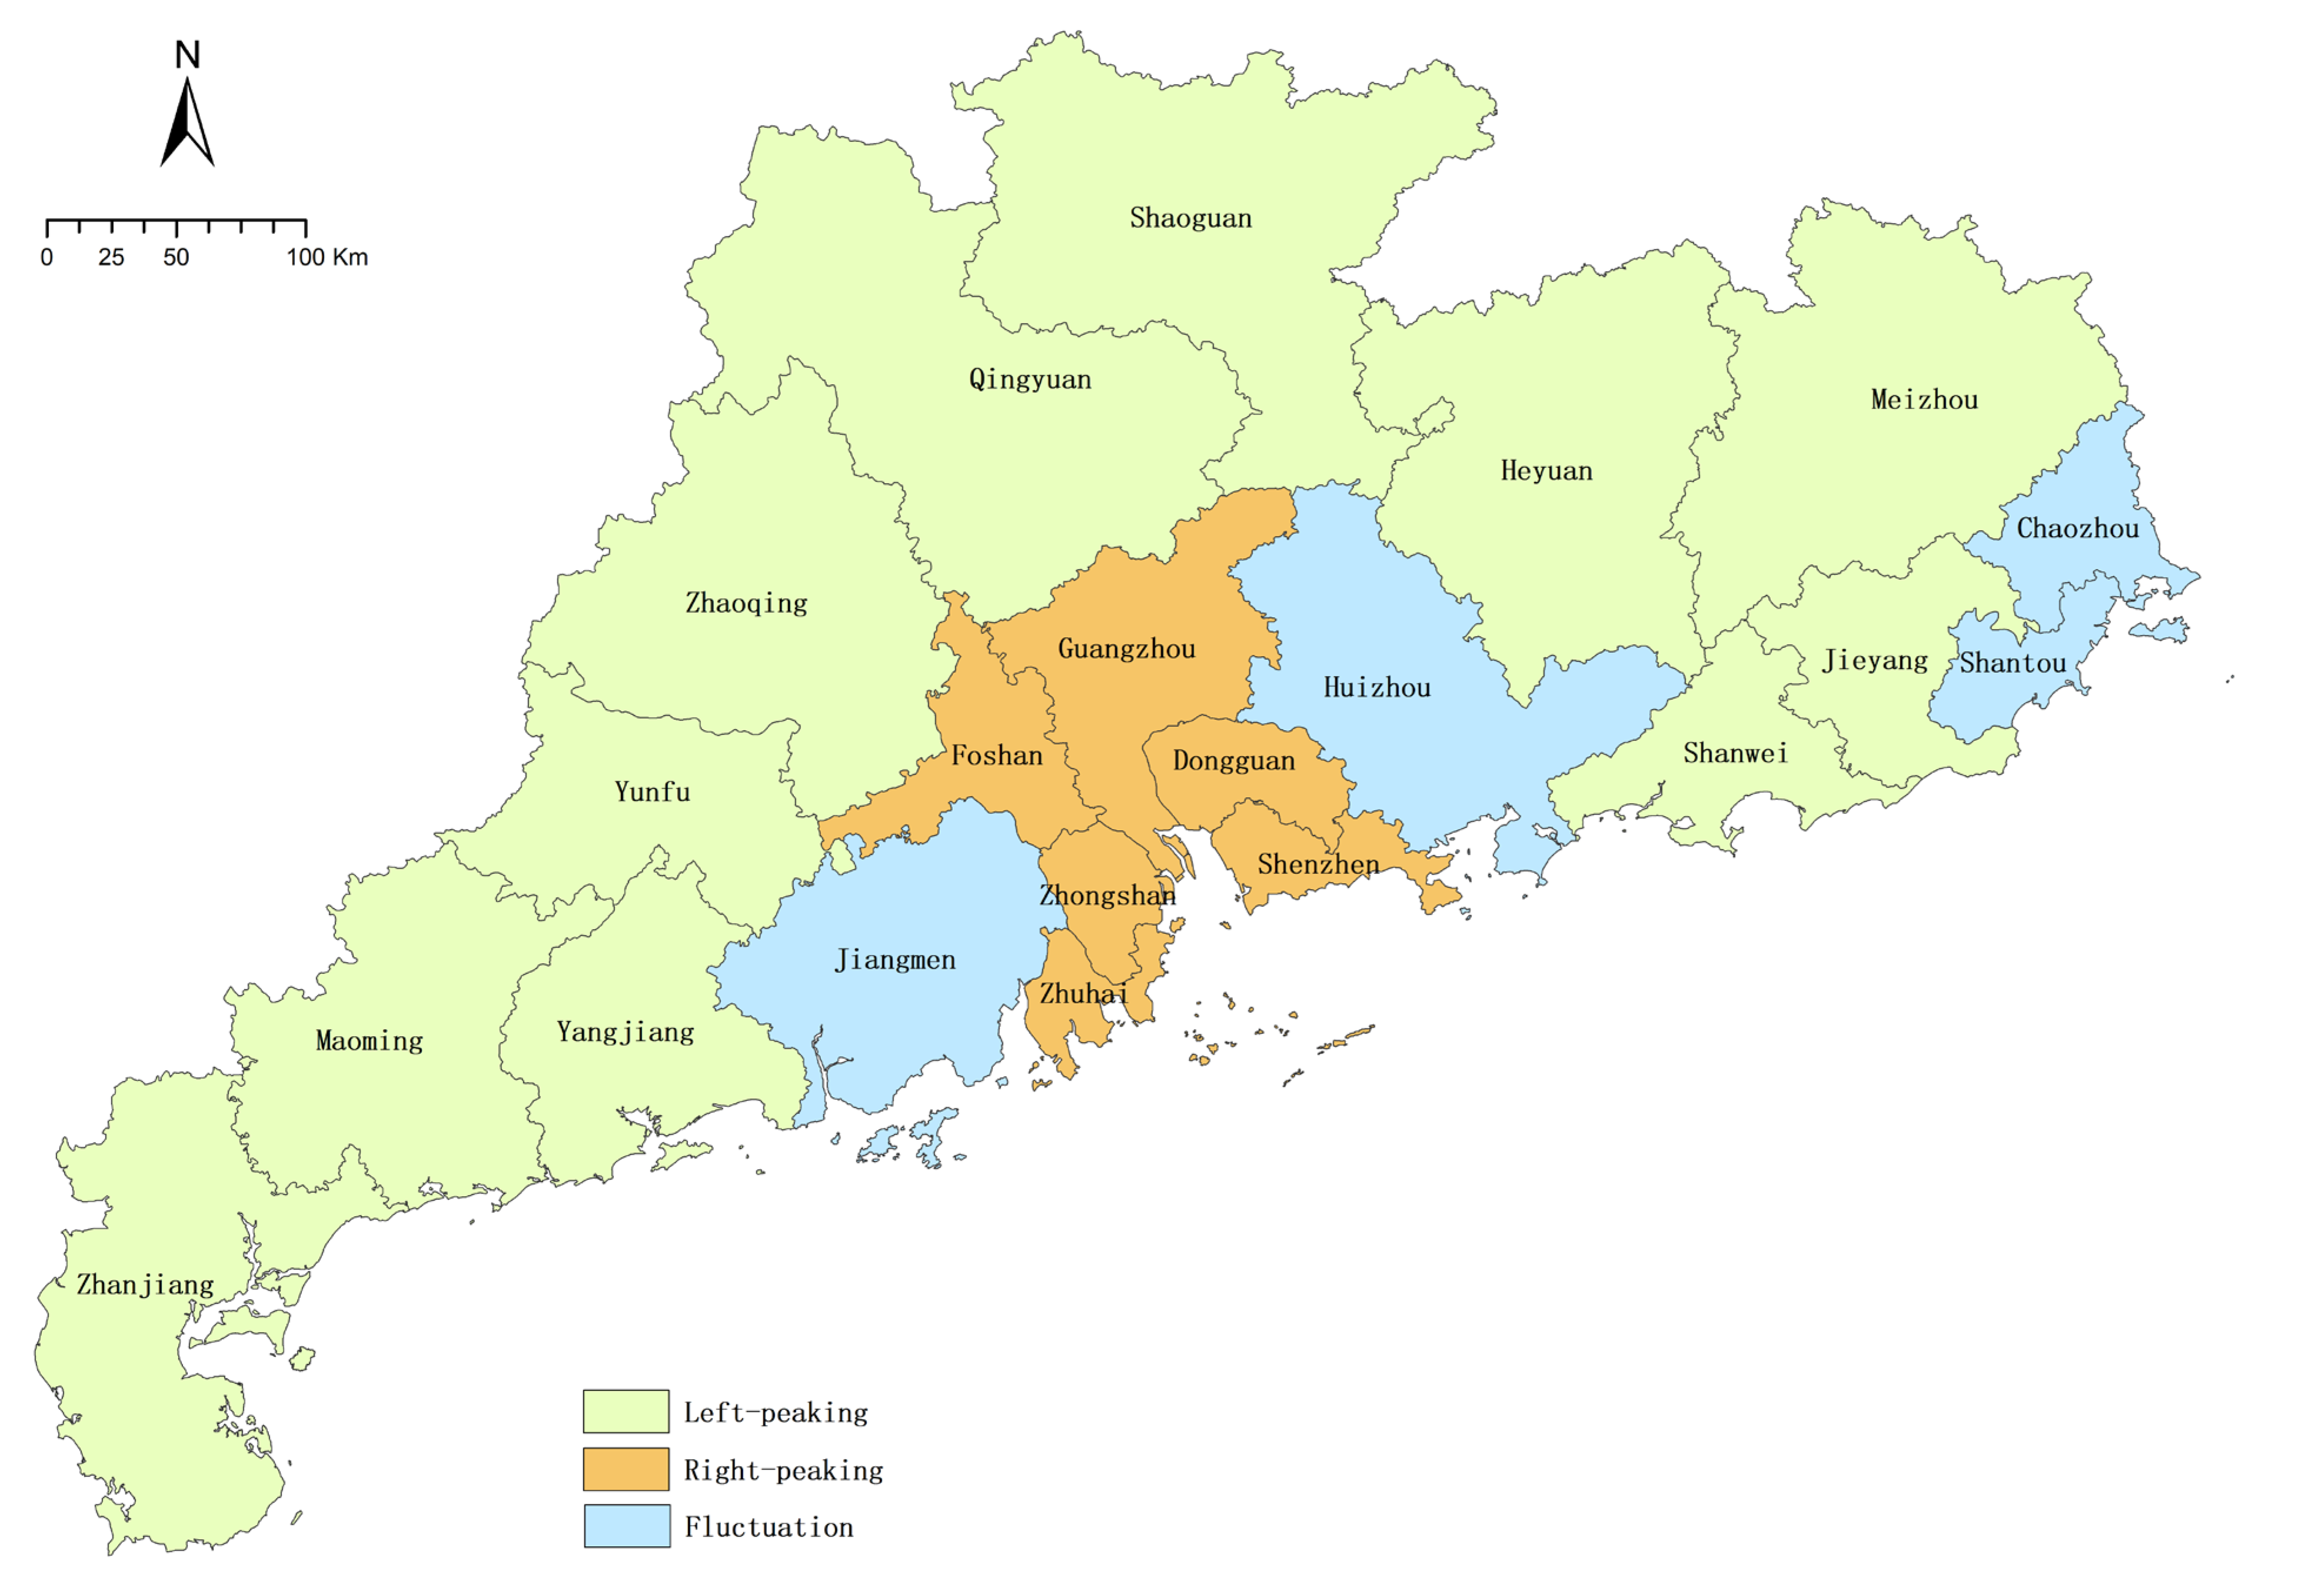
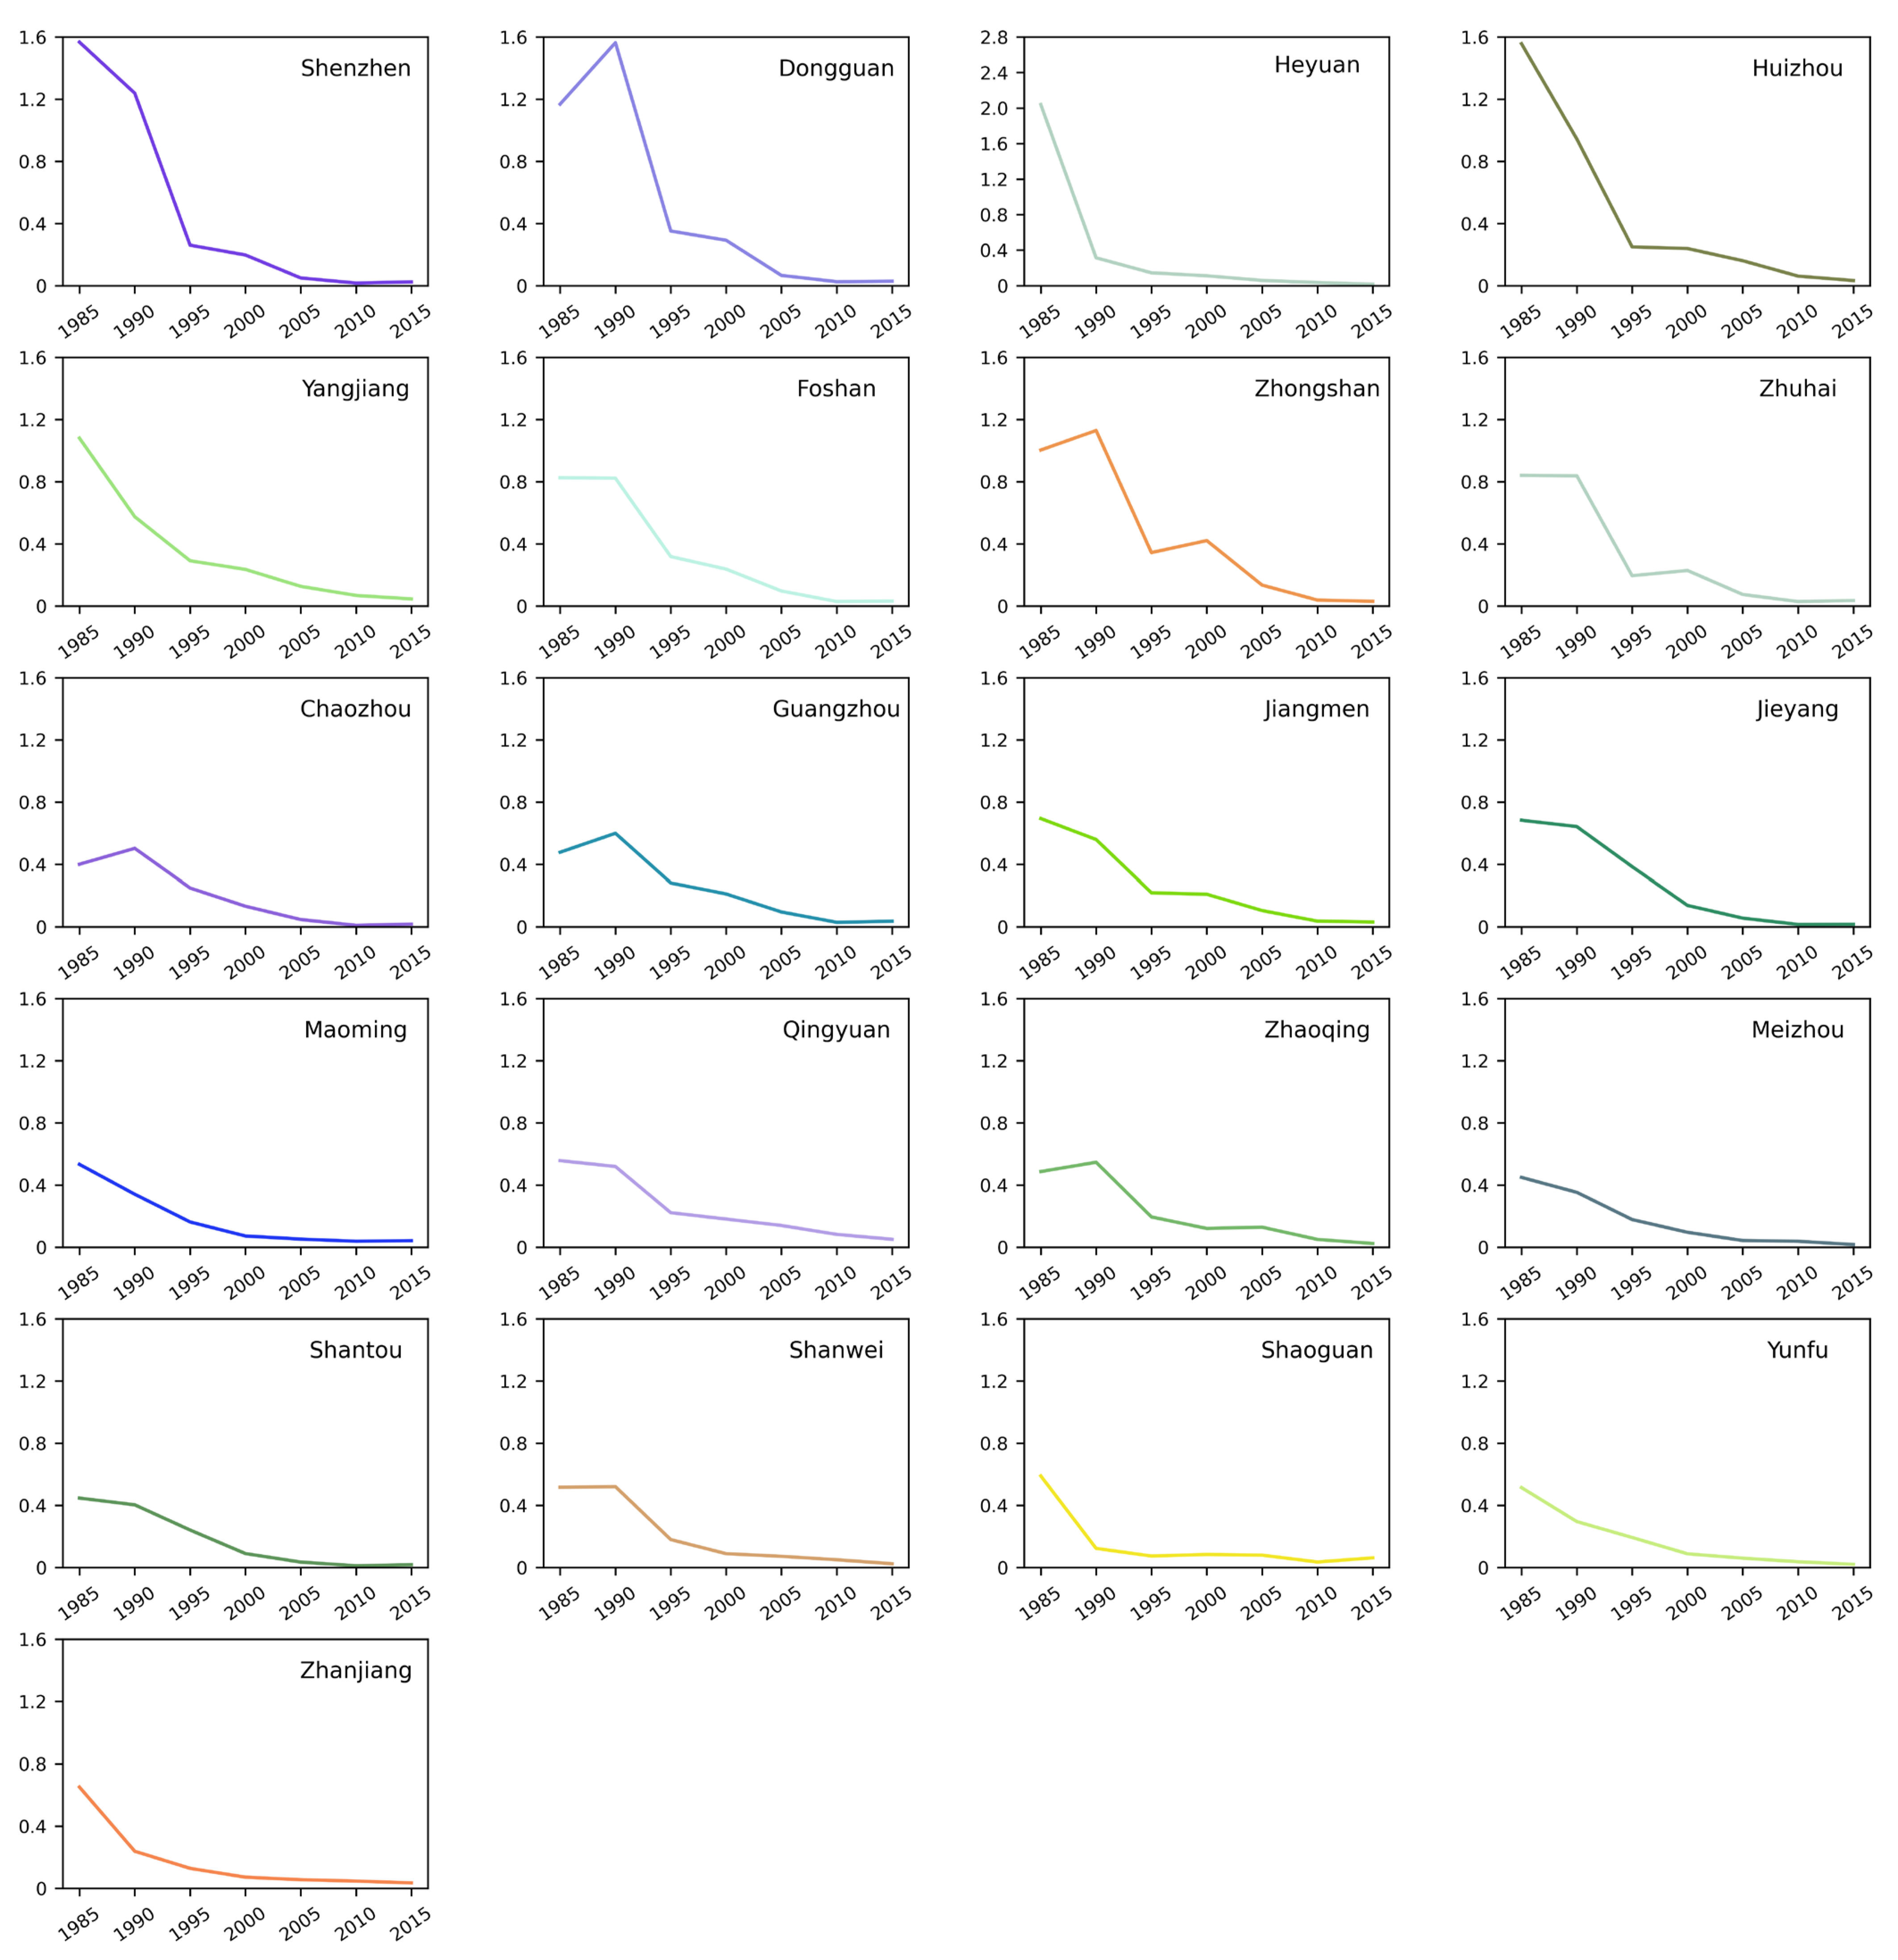
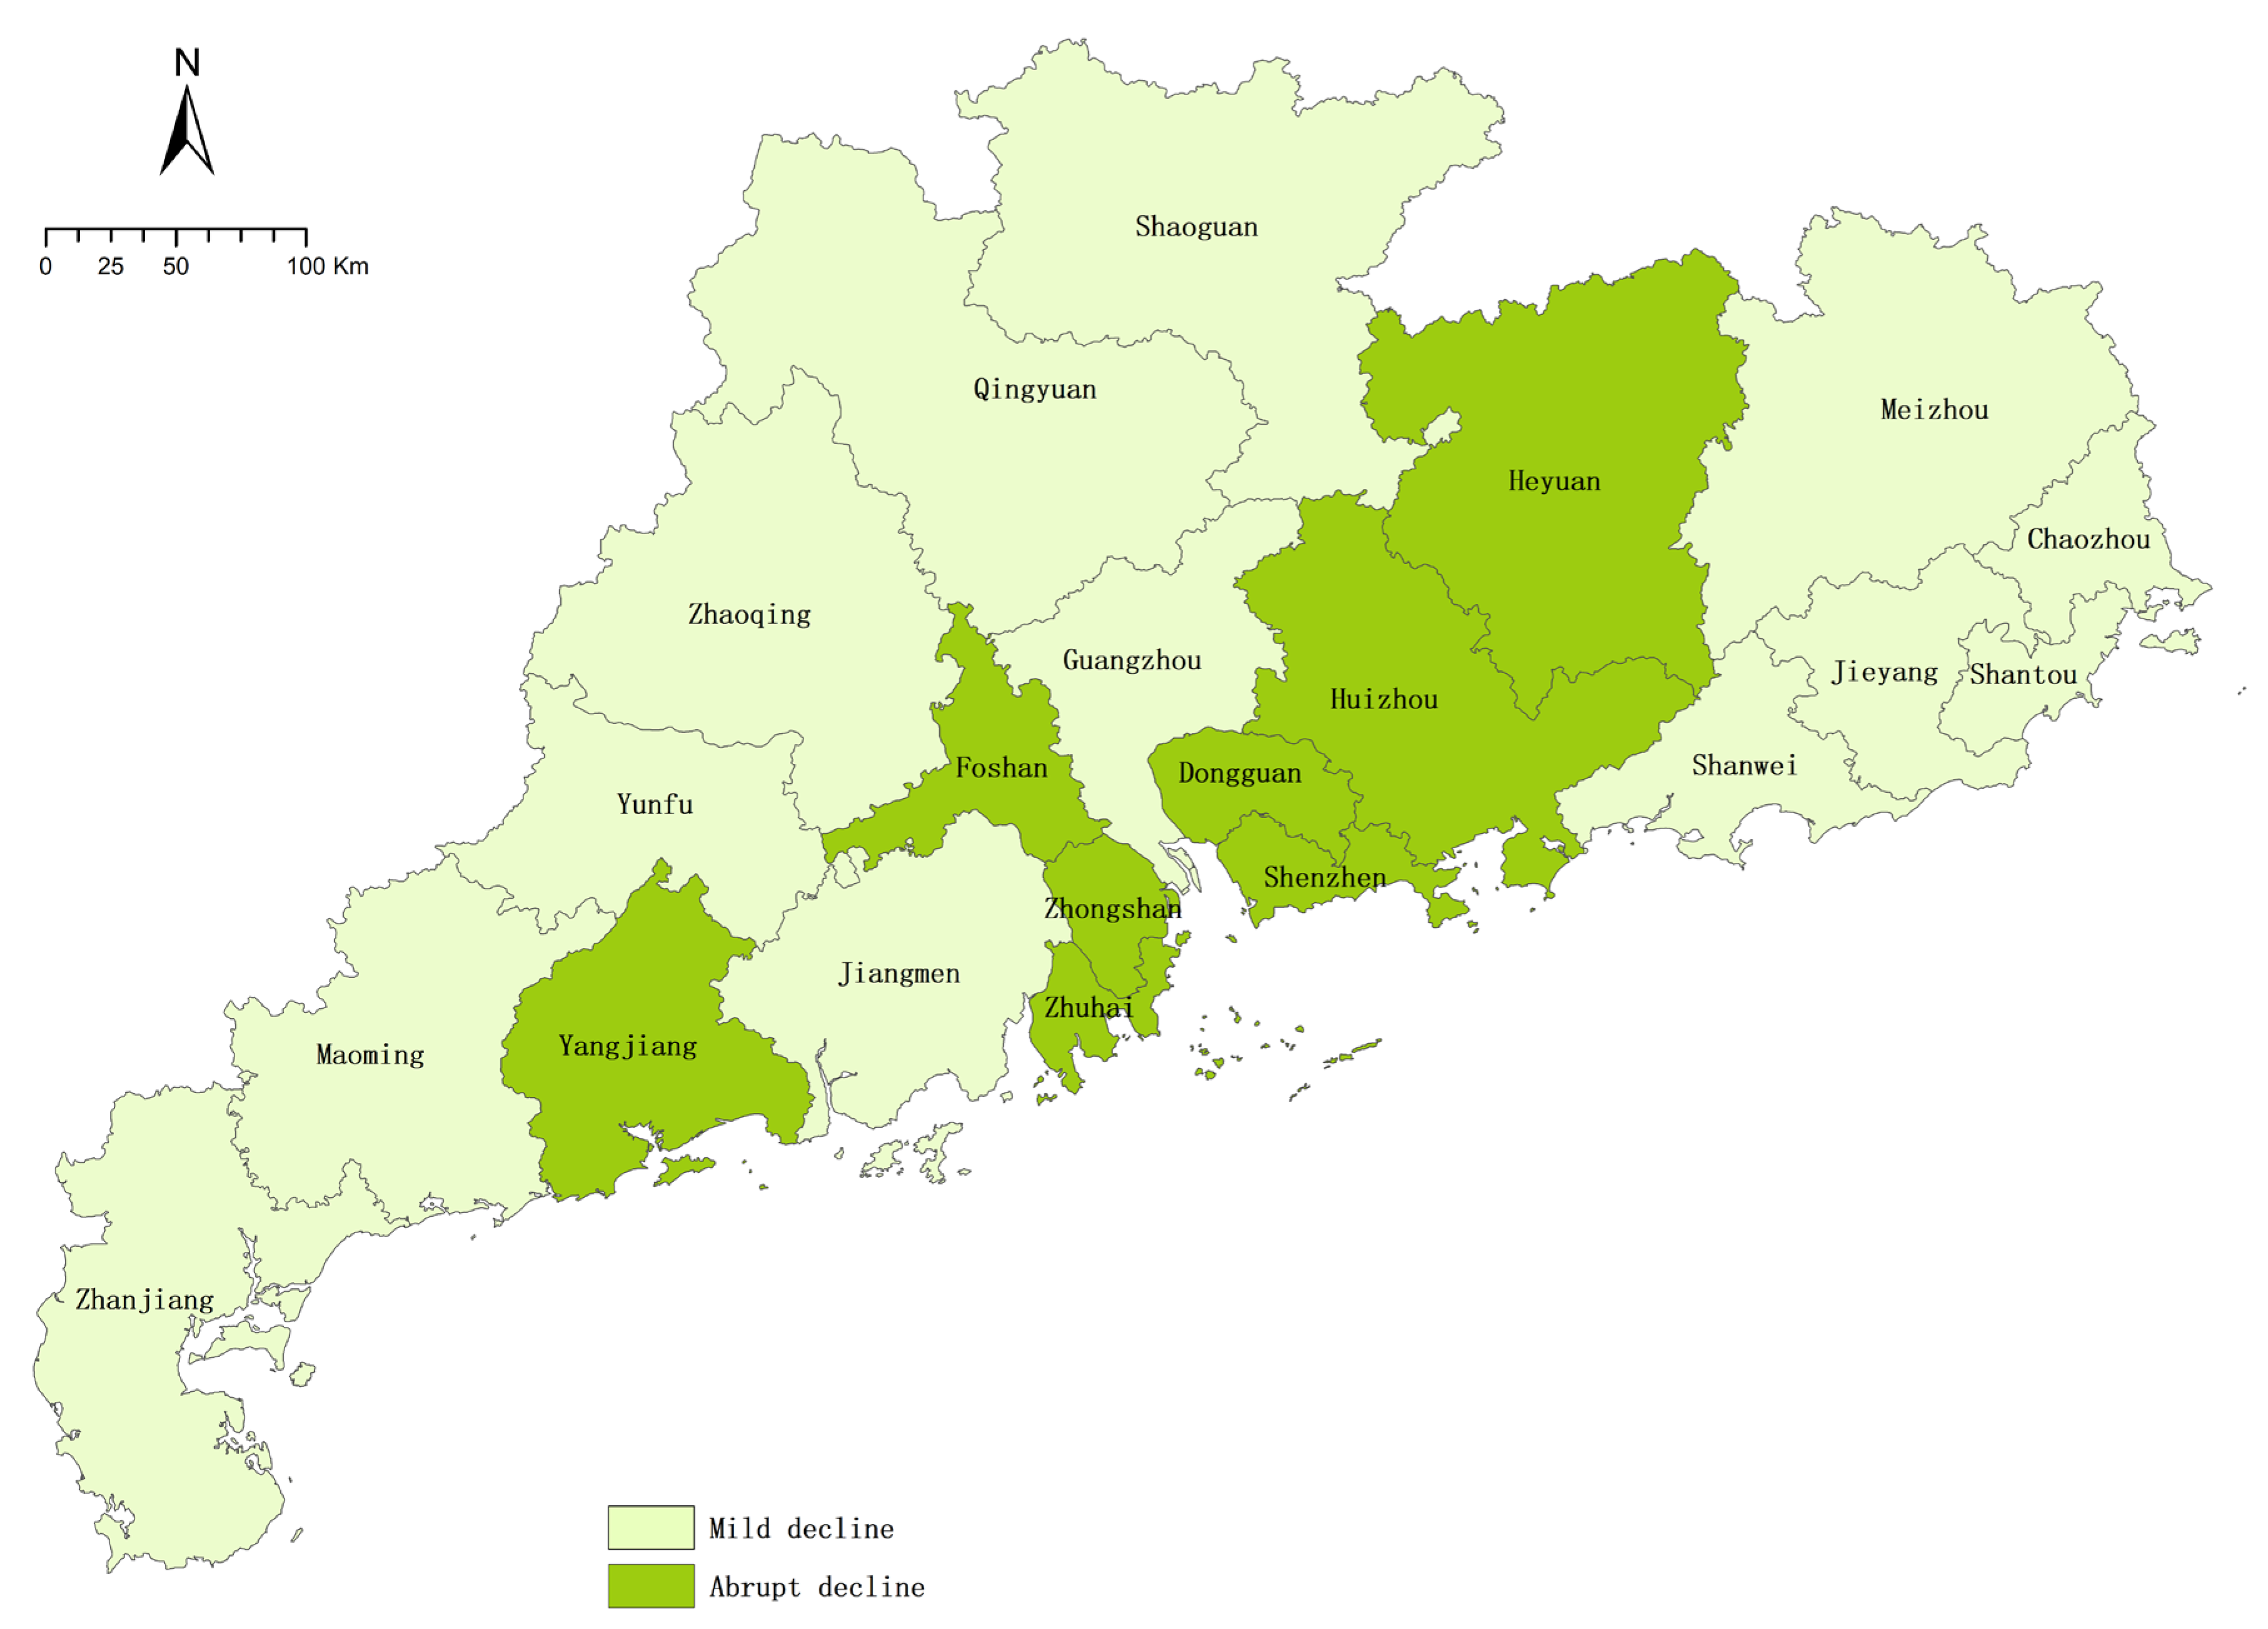
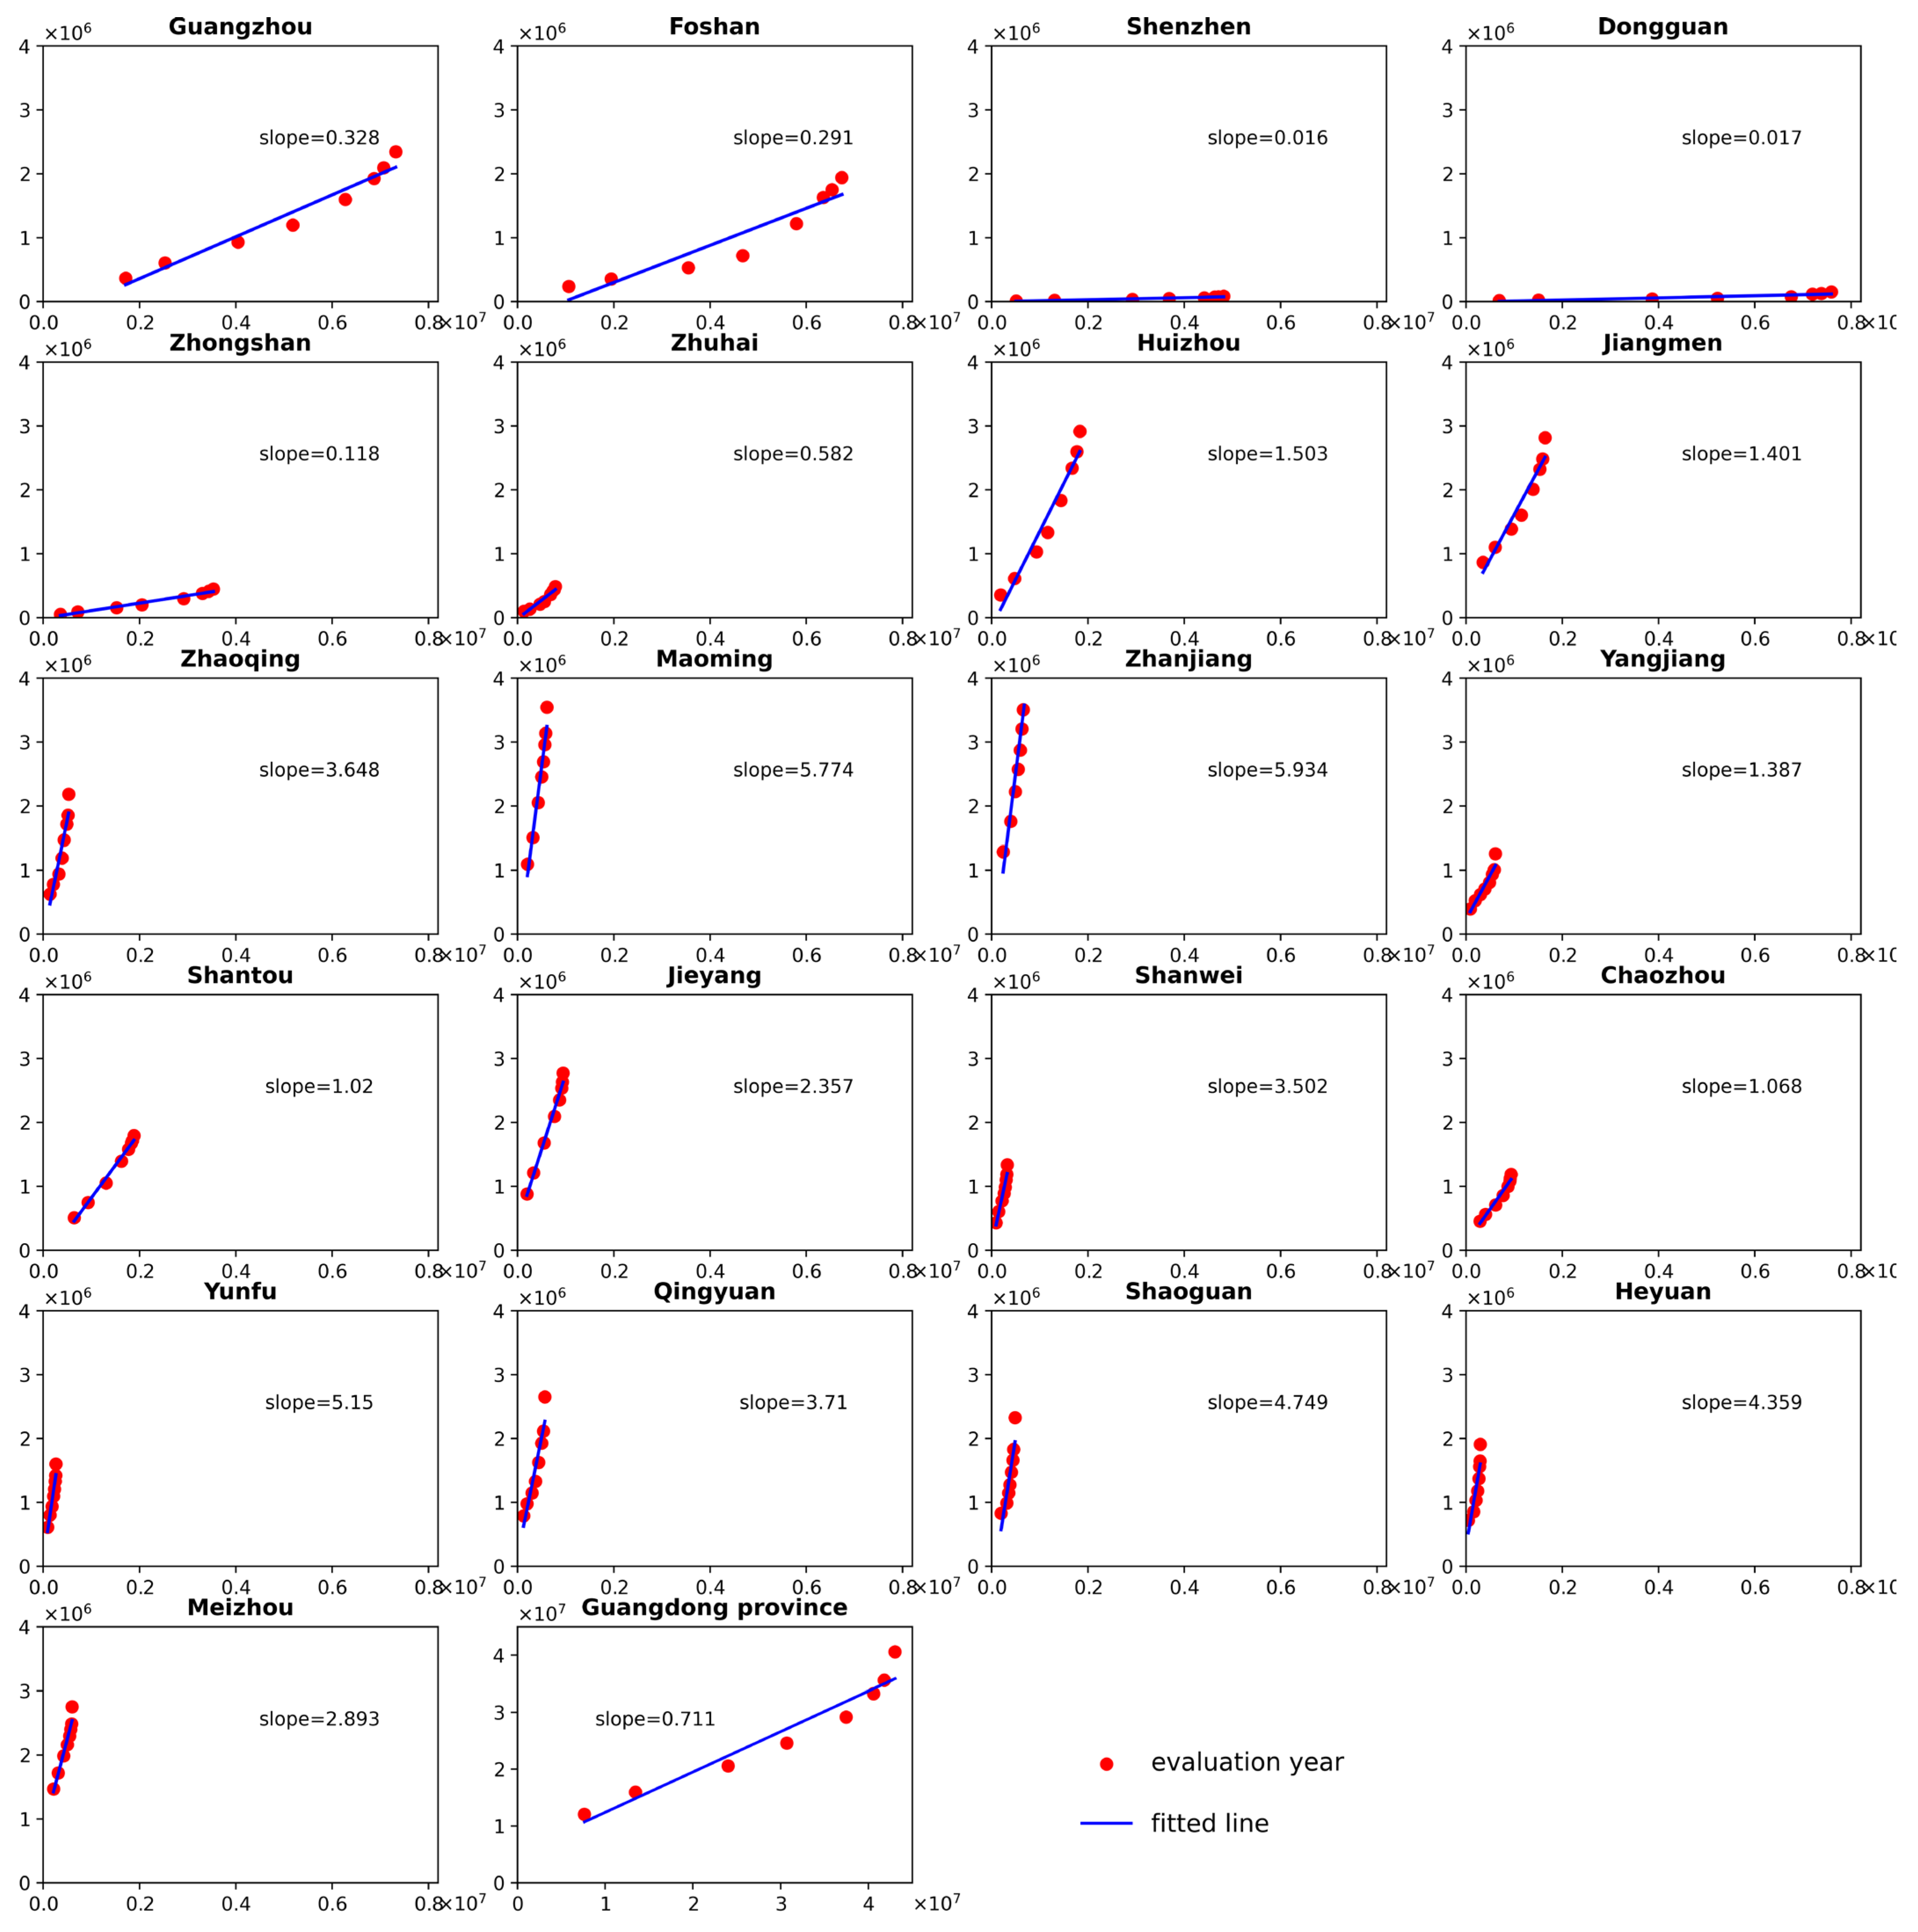
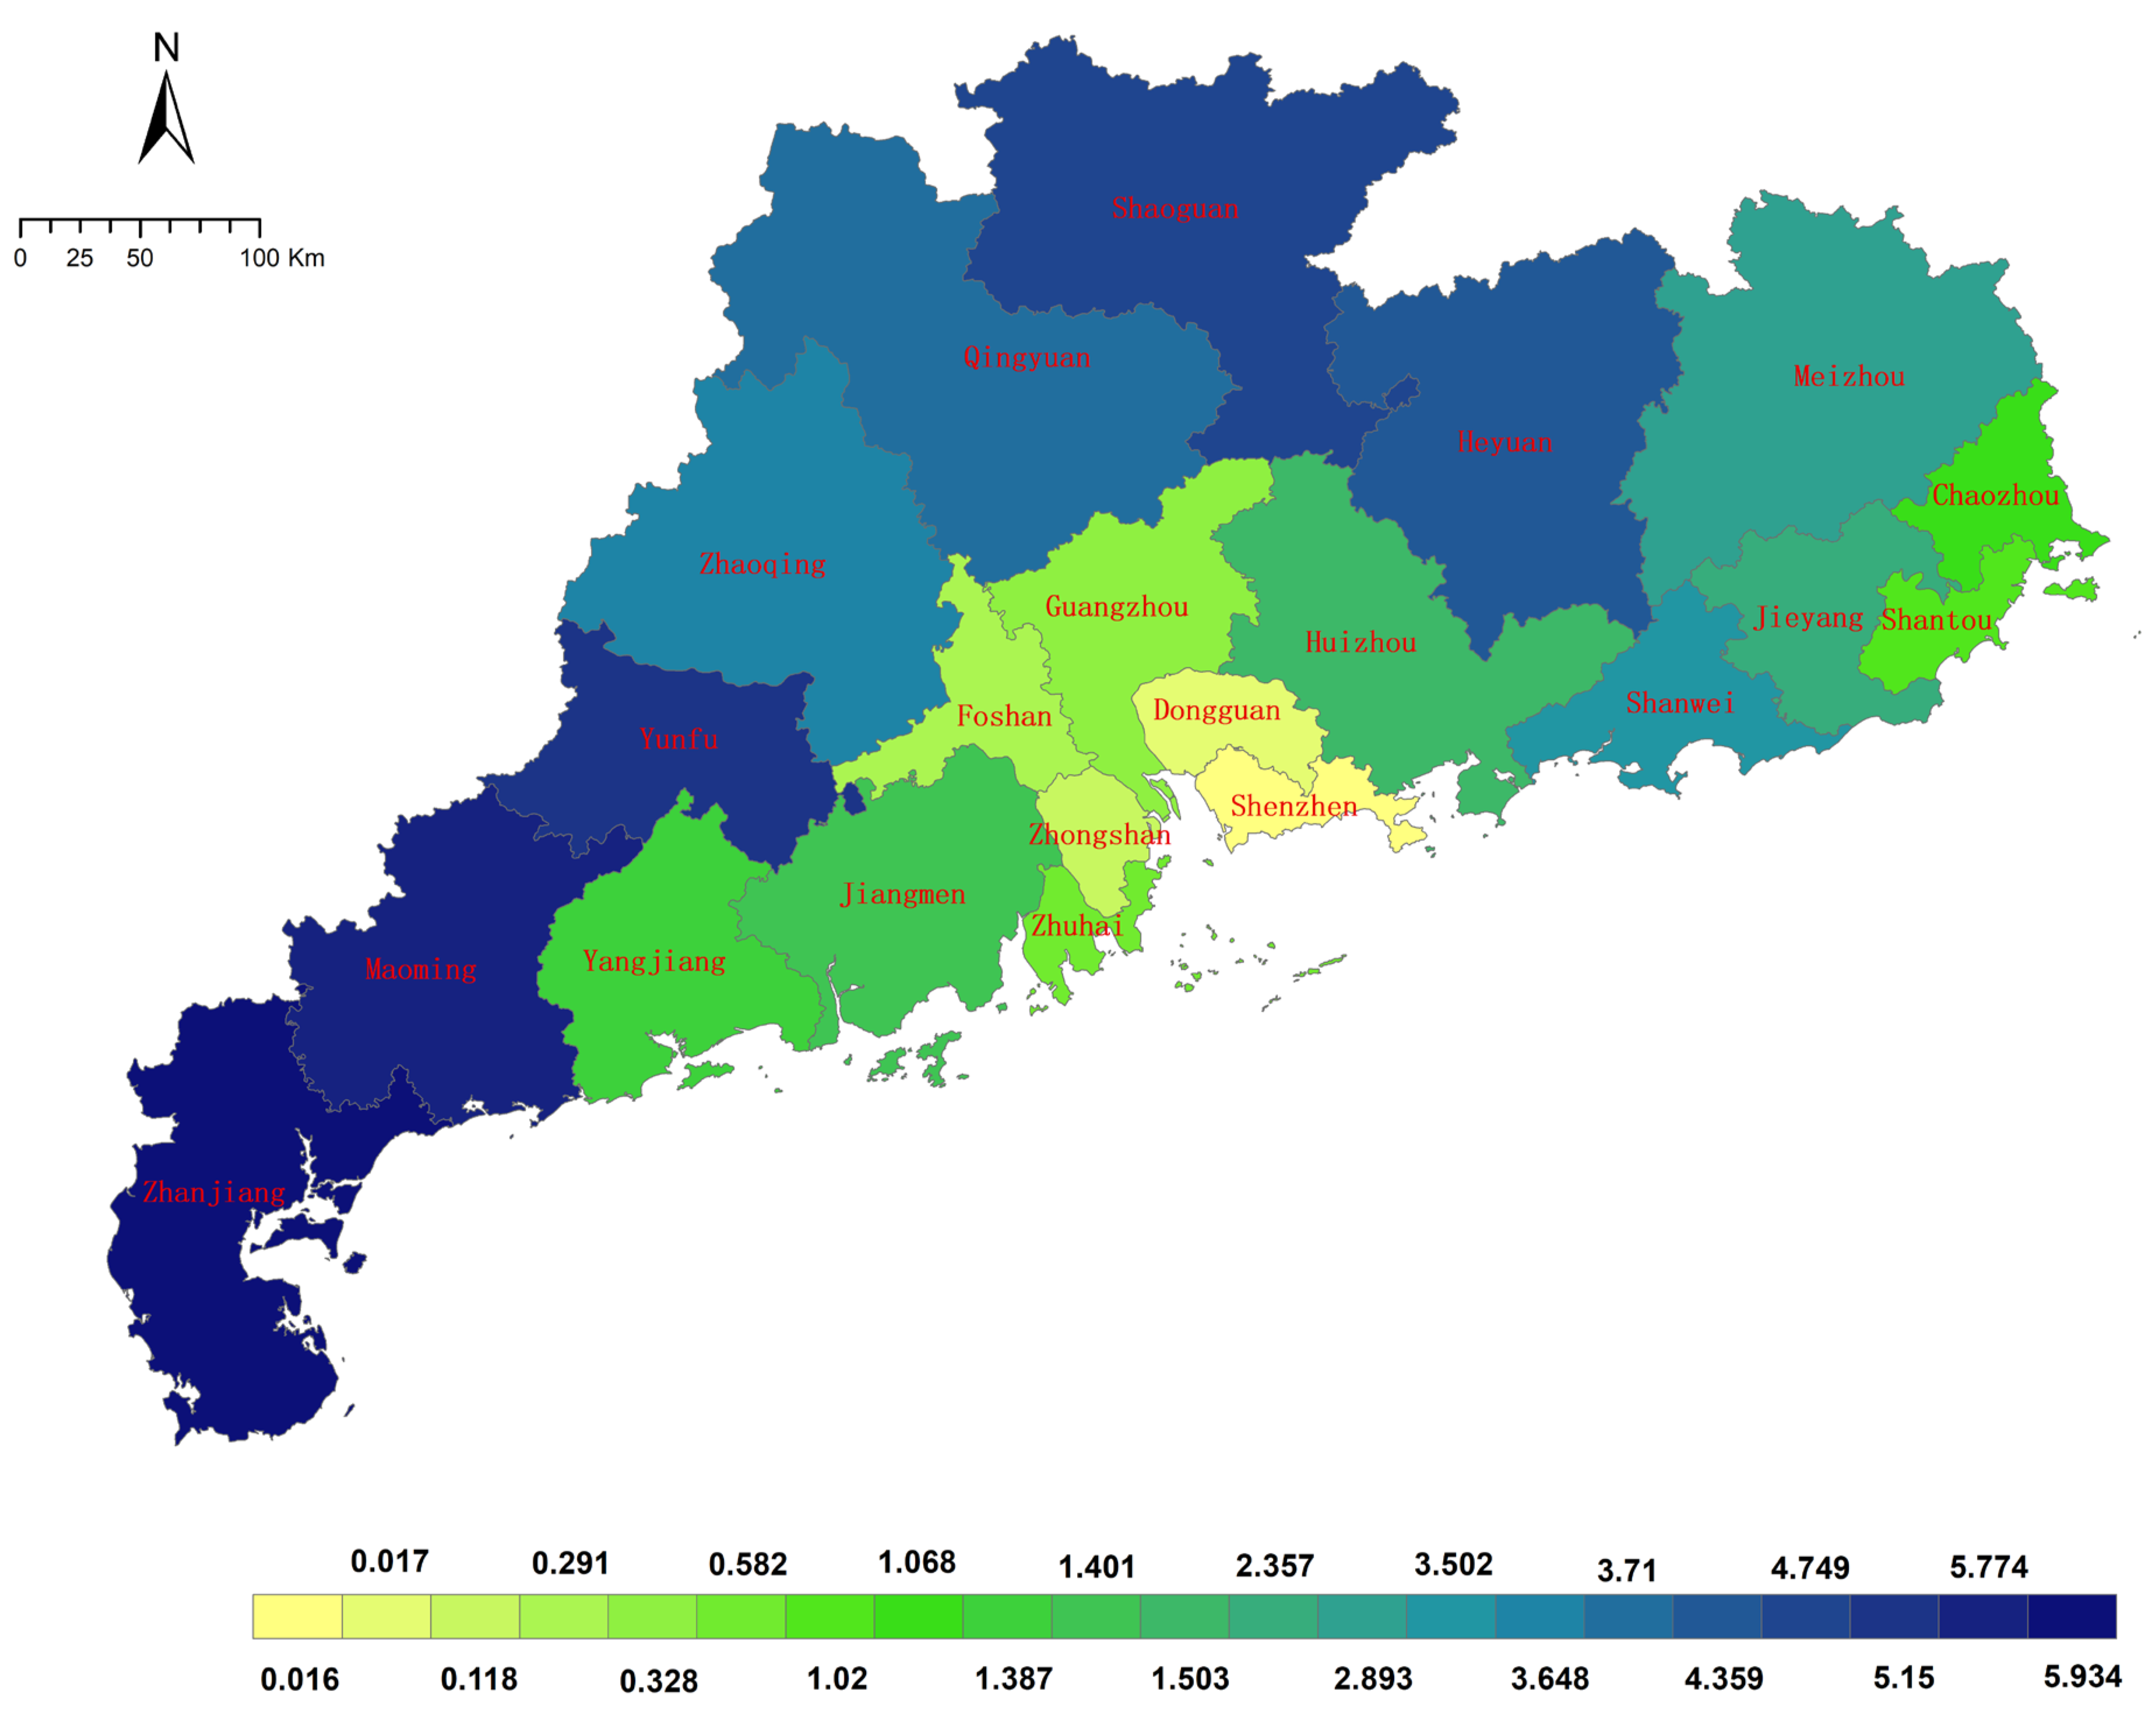
4.2. Characteristics and Evolving Pattern of Expansion Rate
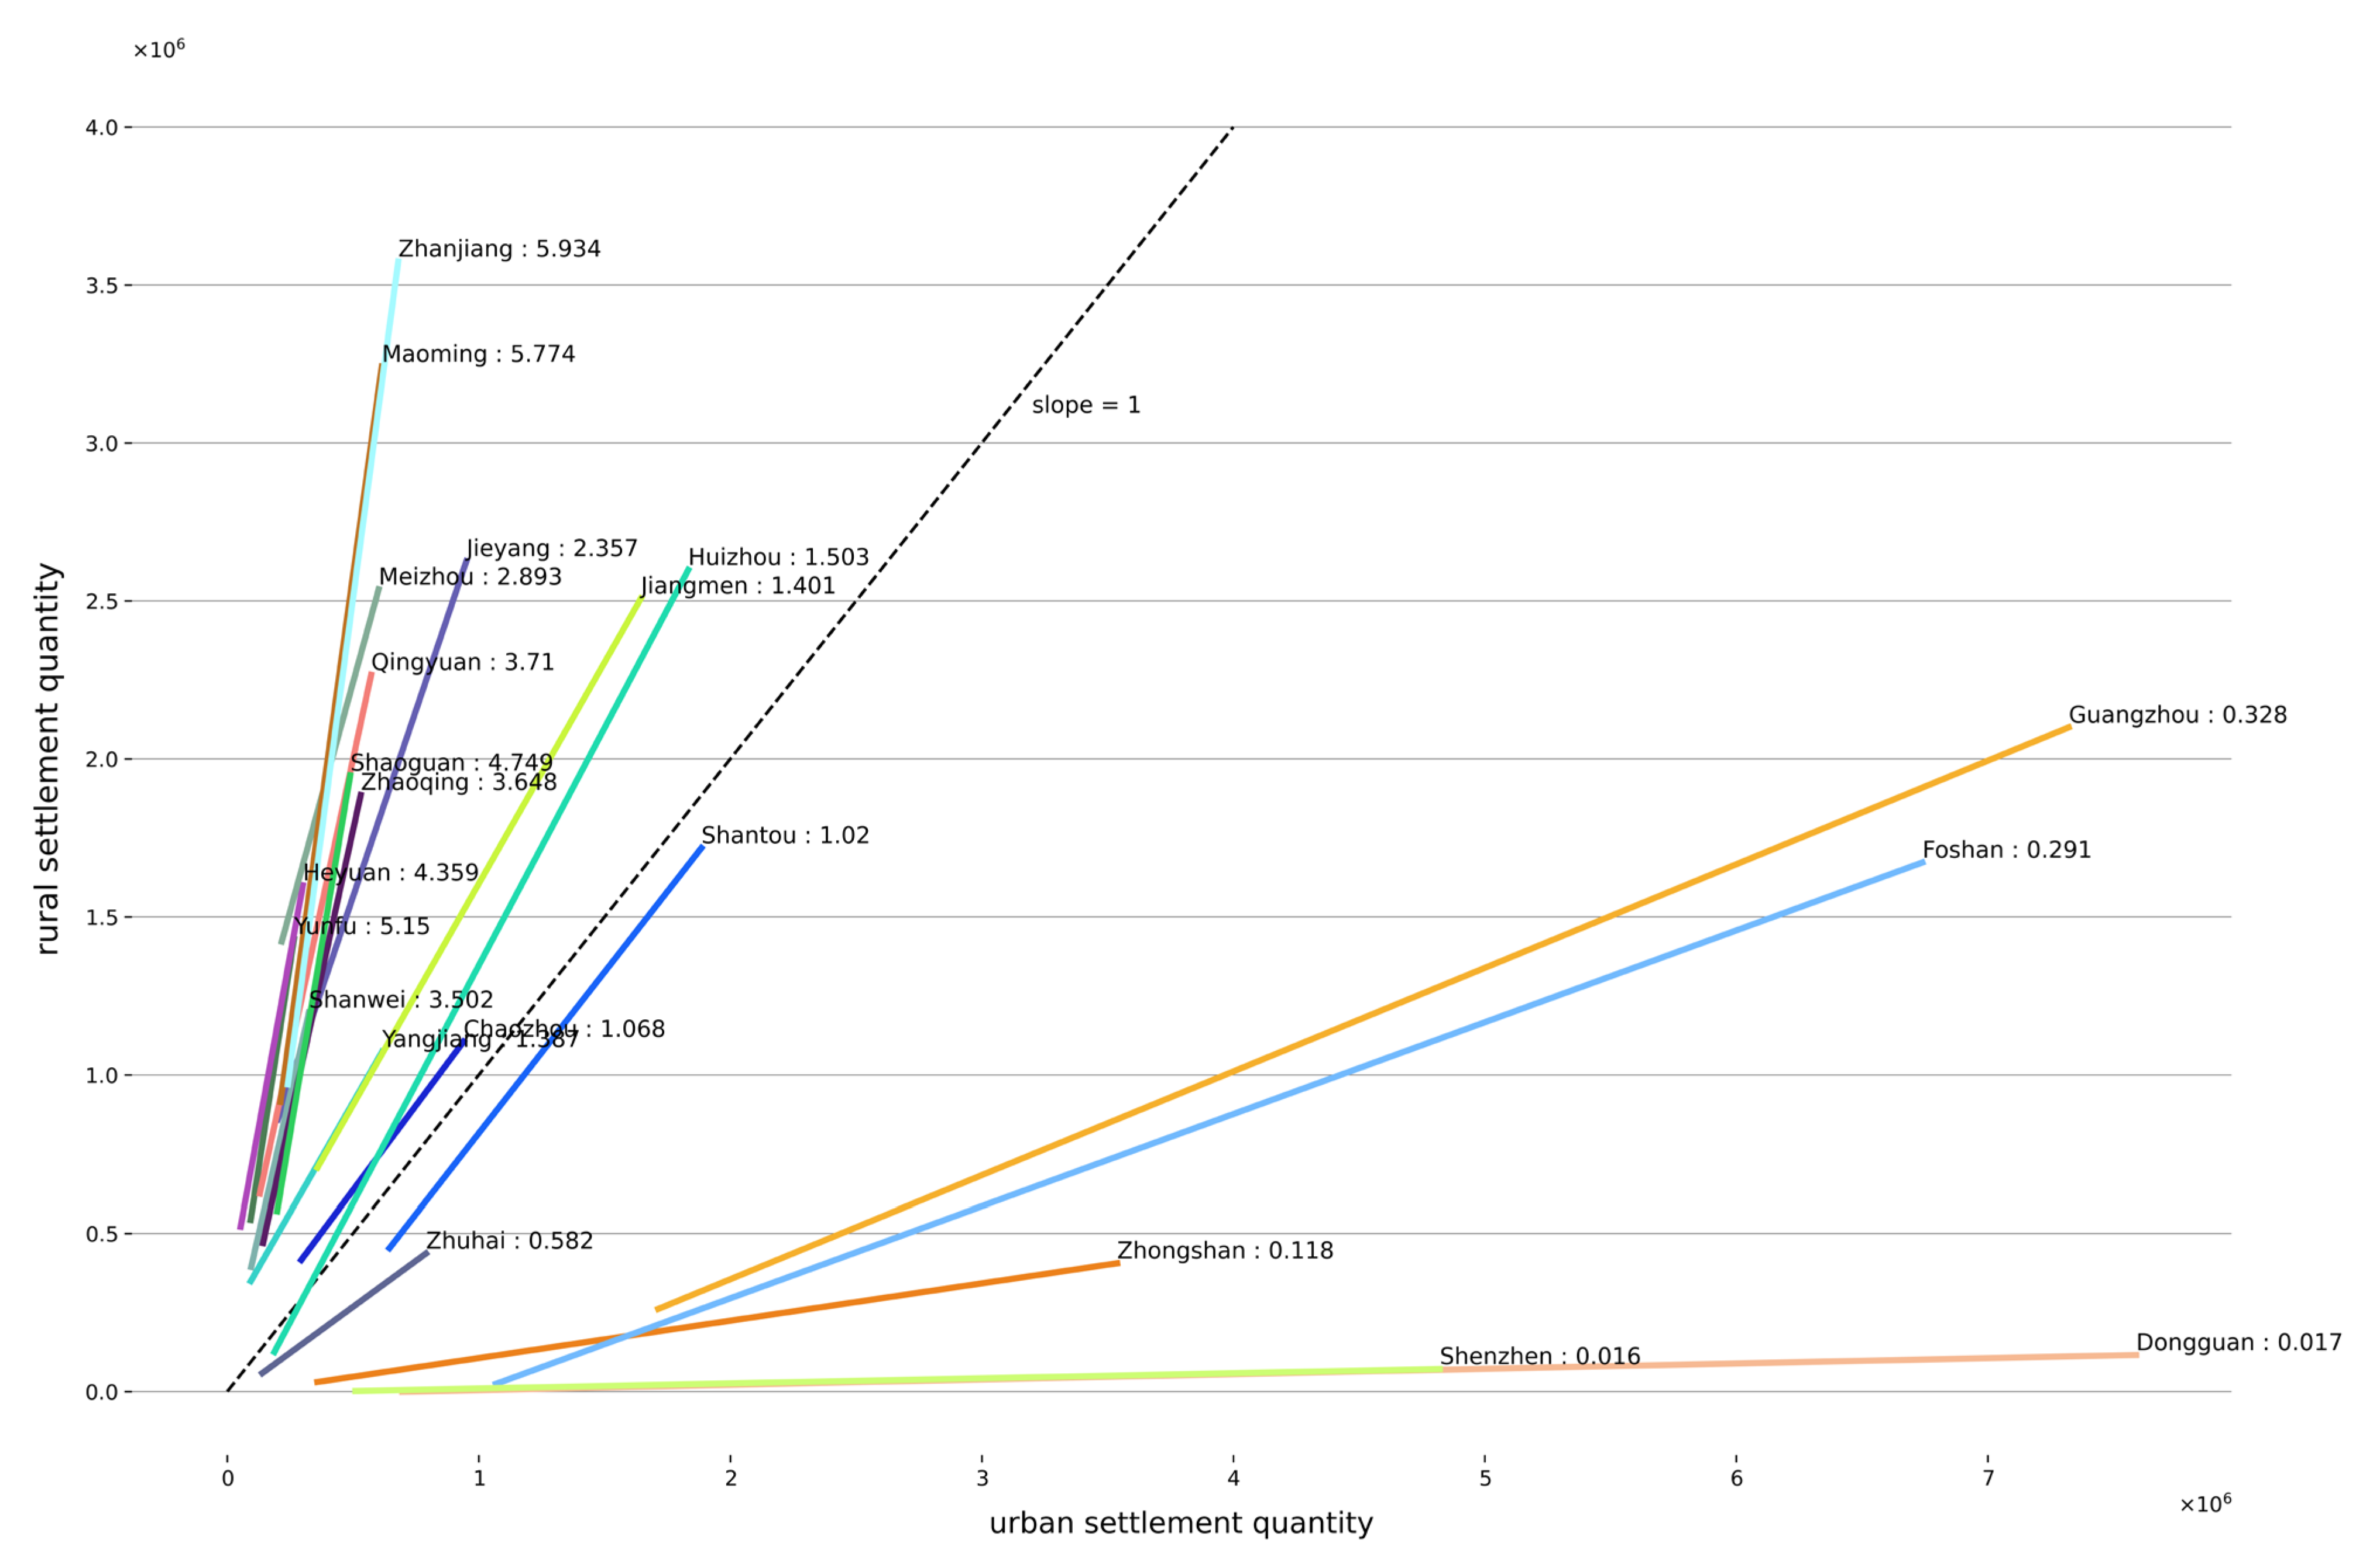
4.3. Relationship Between Settlement Expansion
5. Discussion
6. Future Works
7. Conclusions
Author Contributions
Funding
Institutional Review Board Statement
Informed Consent Statement
Data Availability Statement
Acknowledgments
Conflicts of Interest
References
- Feng, W.; Liu, Y.; Qu, L. Effect of Land-Centered Urbanization on Rural Development: A Regional Analysis in China. Land Use Policy 2019, 87, 104072. [Google Scholar] [CrossRef]
- Guan, X.; Wei, H.; Lu, S.; Dai, Q.; Su, H. Assessment on the Urbanization Strategy in China: Achievements, Challenges and Reflections. Habitat Int. 2018, 71, 97–109. [Google Scholar] [CrossRef]
- Zhang, G.; Guo, X.; Li, D.; Jiang, B. Evaluating the Potential of LJ1-01 Nighttime Light Data for Modeling Socio-Economic Parameters. Sensors 2019, 19, 1465. [Google Scholar] [CrossRef]
- Wang, Y. The Challenges and Strategies of Food Security under Rapid Urbanization in China. Sustainability 2019, 11, 542. [Google Scholar] [CrossRef]
- Foley, J.A.; DeFries, R.; Asner, G.P.; Barford, C.; Bonan, G.; Carpenter, S.R.; Chapin, F.S.; Coe, M.T.; Daily, G.C.; Gibbs, H.K.; et al. Global Consequences of Land Use. Science 2005, 309, 570–574. [Google Scholar] [CrossRef]
- Steffen, W.; Richardson, K.; Rockström, J.; Cornell, S.E.; Fetzer, I.; Bennett, E.M.; Biggs, R.; Carpenter, S.R.; de Vries, W.; de Wit, C.A.; et al. Planetary Boundaries: Guiding Human Development on a Changing Planet. Science 2015, 347, 1259855. [Google Scholar] [CrossRef] [PubMed]
- Smith, R.J.; Rey, S.J. Spatial Approaches to Measure Subnational Inequality: Implications for Sustainable Development Goals. Dev. Policy Rev. 2018, 36, O657–O675. [Google Scholar] [CrossRef]
- Ye, X.; Ma, L.; Ye, K.; Chen, J.; Xie, Q. Analysis of Regional Inequality from Sectoral Structure, Spatial Policy and Economic Development: A Case Study of Chongqing, China. Sustainability 2017, 9, 633. [Google Scholar] [CrossRef]
- Chen, M.; Zhang, H.; Liu, W.; Zhang, W. The Global Pattern of Urbanization and Economic Growth: Evidence from the Last Three Decades. PLoS ONE 2014, 9, e103799. [Google Scholar] [CrossRef]
- Chu, Z.; Liu, C.; Li, G.; Guan, K. Sustainable Development of the Economic Circle around Beijing: A View of Regional Economic Disparity. Sustainability 2018, 10, 3691. [Google Scholar] [CrossRef]
- Gu, C.; Shen, J.; Wong, K.-Y.; Zhen, F. Regional Polarization under the Socialist-Market System since 1978: A Case Study of Guangdong Province in South China. Environ. Plan A 2001, 33, 97–119. [Google Scholar] [CrossRef]
- Yuan, Y.; Wu, F. Regional Social Inequalities and Social Deprivation in G Uangdong Province, China. Growth Change 2013, 44, 149–167. [Google Scholar] [CrossRef]
- Wang, S.; Gao, S.; Li, S.; Feng, K. Strategizing the Relation between Urbanization and Air Pollution: Empirical Evidence from Global Countries. J. Clean. Prod. 2020, 243, 118615. [Google Scholar] [CrossRef]
- Hu, Y.; Liu, X.; Bai, J.; Shih, K.; Zeng, E.Y.; Cheng, H. Assessing Heavy Metal Pollution in the Surface Soils of a Region That Had Undergone Three Decades of Intense Industrialization and Urbanization. Environ. Sci. Pollut. Res. 2013, 20, 6150–6159. [Google Scholar] [CrossRef]
- Freeman, L.A.; Corbett, D.R.; Fitzgerald, A.M.; Lemley, D.A.; Quigg, A.; Steppe, C.N. Impacts of Urbanization and Development on Estuarine Ecosystems and Water Quality. Estuaries Coasts 2019, 42, 1821–1838. [Google Scholar] [CrossRef]
- Dempsey, N.; Brown, C.; Bramley, G. The Key to Sustainable Urban Development in UK Cities? The Influence of Density on Social Sustainability. Prog. Plan. 2012, 77, 89–141. [Google Scholar] [CrossRef]
- Slach, O.; Bosák, V.; Krtička, L.; Nováček, A.; Rumpel, P. Urban Shrinkage and Sustainability: Assessing the Nexus between Population Density, Urban Structures and Urban Sustainability. Sustainability 2019, 11, 4142. [Google Scholar] [CrossRef]
- Abdullahi, S.; Pradhan, B.; Jebur, M.N. GIS-Based Sustainable City Compactness Assessment Using Integration of MCDM, Bayes Theorem and RADAR Technology. Geocarto Int. 2015, 30, 365–387. [Google Scholar] [CrossRef]
- Fan, P.; Lee, Y.-C.; Ouyang, Z.; Huang, S.-L. Compact and Green Urban Development—Towards a Framework to Assess Urban Development for a High-Density Metropolis. Environ. Res. Lett. 2019, 14, 115006. [Google Scholar] [CrossRef]
- Liu, C.; Valentine, G.; Vanderbeck, R.M.; Diprose, K.; McQuaid, K. Rural–Urban Inequality and the Practice of Promoting Sustainability in Contemporary China. GeoJournal 2019, 84, 1187–1198. [Google Scholar] [CrossRef]
- Young, A. Inequality, the Urban-Rural Gap, and Migration. Q. J. Econ. 2013, 128, 1727–1785. [Google Scholar] [CrossRef]
- Ridd, M.K. Exploring a V-I-S (Vegetation-Impervious Surface-Soil) Model for Urban Ecosystem Analysis through Remote Sensing: Comparative Anatomy for Cities†. Int. J. Remote Sens. 1995, 16, 2165–2185. [Google Scholar] [CrossRef]
- Microsoft/GlobalMLBuildingFootprints. 2024. Available online: https://github.com/microsoft/GlobalMLBuildingFootprints (accessed on 4 March 2025).
- Li, R.; Sun, T.; Ghaffarian, S.; Tsamados, M.; Ni, G. GLAMOUR: GLobAl Building MOrphology Dataset for URban Hydroclimate Modelling. Sci. Data 2024, 11, 618. [Google Scholar] [CrossRef] [PubMed]
- O’Regan, B.; Morrissey, J.; Foley, W.; Moles, R. The Relationship between Settlement Population Size and Sustainable Development Measured by Two Sustainability Metrics. Environ. Impact Assess. Rev. 2009, 29, 169–178. [Google Scholar] [CrossRef]
- Thinh, N.X.; Arlt, G.; Heber, B.; Hennersdorf, J.; Lehmann, I. Evaluation of Urban Land-Use Structures with a View to Sustainable Development. Environ. Impact Assess. Rev. 2002, 22, 475–492. [Google Scholar] [CrossRef]
- de Bellefon, M.-P.; Combes, P.-P.; Duranton, G.; Gobillon, L.; Gorin, C. Delineating Urban Areas Using Building Density. J. Urban Econ. 2021, 125, 103226. [Google Scholar] [CrossRef]
- Davoudi, S.; Stead, D. Urban-Rural Relationships: An Introduction and Brief History. Built Environ. 2002, 28, 268–277. [Google Scholar]
- Giannakis, E.; Bruggeman, A. Regional Disparities in Economic Resilience in the European Union across the Urban–Rural Divide. Reg. Stud. 2020, 54, 1200–1213. [Google Scholar] [CrossRef]
- Zhou, Y.; Liu, Y.; Wu, W.; Li, Y. Effects of Rural–Urban Development Transformation on Energy Consumption and CO2 Emissions: A Regional Analysis in China. Renew. Sustain. Energy Rev. 2015, 52, 863–875. [Google Scholar] [CrossRef]
- Li, G.; Cao, Y.; He, Z.; He, J.; Cao, Y.; Wang, J.; Fang, X. Understanding the Diversity of Urban–Rural Fringe Development in a Fast Urbanizing Region of China. Remote Sens. 2021, 13, 2373. [Google Scholar] [CrossRef]
- Ghosh, T.; Anderson, S.; Elvidge, C.; Sutton, P. Using Nighttime Satellite Imagery as a Proxy Measure of Human Well-Being. Sustainability 2013, 5, 4988–5019. [Google Scholar] [CrossRef]
- Small, C.; Elvidge, C.D. Night on Earth: Mapping Decadal Changes of Anthropogenic Night Light in Asia. Int. J. Appl. Earth Obs. Geoinf. 2013, 22, 40–52. [Google Scholar] [CrossRef]
- Liu, X.; Ning, X.; Wang, H.; Wang, C.; Zhang, H.; Meng, J. A Rapid and Automated Urban Boundary Extraction Method Based on Nighttime Light Data in China. Remote Sens. 2019, 11, 1126. [Google Scholar] [CrossRef]
- Zhang, J.; Yuan, X.; Tan, X.; Zhang, X. Delineation of the Urban-Rural Boundary through Data Fusion: Applications to Improve Urban and Rural Environments and Promote Intensive and Healthy Urban Development. Int. J. Environ. Res. Public Health 2021, 18, 7180. [Google Scholar] [CrossRef]
- Huang, L.; Du, J. Research on Zhanjiang’s Marine Economic Development Strategy Under the Strategic Background of “One Core, One Belt and One Zone”. Haiyang Kaifa Yu Guanli 2023, 40, 107–112. [Google Scholar]
- Du, Z.; Jin, L.; Ye, Y.; Zhang, H. Characteristics and Influences of Urban Shrinkage in the Exo-Urbanization Area of the Pearl River Delta, China. Cities 2020, 103, 102767. [Google Scholar] [CrossRef]
- Marconcini, M.; Metz-Marconcini, A.; Üreyen, S.; Palacios-Lopez, D.; Hanke, W.; Bachofer, F.; Zeidler, J.; Esch, T.; Gorelick, N.; Kakarla, A.; et al. Outlining Where Humans Live, the World Settlement Footprint 2015. Sci. Data 2020, 7, 242. [Google Scholar] [CrossRef]
- Li, X.; Zhou, Y. A Stepwise Calibration of Global DMSP/OLS Stable Nighttime Light Data (1992–2013). Remote Sens. 2017, 9, 637. [Google Scholar] [CrossRef]
- Small, C.; Pozzi, F.; Elvidge, C.D. Spatial Analysis of Global Urban Extent from DMSP-OLS Night Lights. Remote Sens. Environ. 2005, 96, 277–291. [Google Scholar] [CrossRef]
- Chen, X.; Nordhaus, W.D. Using Luminosity Data as a Proxy for Economic Statistics. Proc. Natl. Acad. Sci. USA 2011, 108, 8589–8594. [Google Scholar] [CrossRef]
- Shi, K.; Chen, Y.; Yu, B.; Xu, T.; Yang, C.; Li, L.; Huang, C.; Chen, Z.; Liu, R.; Wu, J. Detecting Spatiotemporal Dynamics of Global Electric Power Consumption Using DMSP-OLS Nighttime Stable Light Data. Appl. Energy 2016, 184, 450–463. [Google Scholar] [CrossRef]
- Amaral, S.; Monteiro, A.M.V.; Camara, G.; Quintanilha, J.A. DMSP/OLS Night-time Light Imagery for Urban Population Estimates in the Brazilian Amazon. Int. J. Remote Sens. 2006, 27, 855–870. [Google Scholar] [CrossRef]
- Kohiyama, M.; Hayashi, H.; Maki, N.; Higashida, M.; Kroehl, H.W.; Elvidge, C.D.; Hobson, V.R. Early Damaged Area Estimation System Using DMSP-OLS Night-Time Imagery. Int. J. Remote Sens. 2004, 25, 2015–2036. [Google Scholar] [CrossRef]
- Gorelick, N.; Hancher, M.; Dixon, M.; Ilyushchenko, S.; Thau, D.; Moore, R. Google Earth Engine: Planetary-Scale Geospatial Analysis for Everyone. Remote Sens. Environ. 2017, 202, 18–27. [Google Scholar] [CrossRef]
- L.Imhoff, M.; Lawrence, W.T.; Stutzer, D.C.; Elvidge, C.D. A Technique for Using Composite DMSP/OLS “City Lights” Satellite Data to Map Urban Area. Remote Sens. Environ. 1997, 61, 361–370. [Google Scholar] [CrossRef]
- Zhou, Y.; Smith, S.J.; Elvidge, C.D.; Zhao, K.; Thomson, A.; Imhoff, M. A Cluster-Based Method to Map Urban Area from DMSP/OLS Nightlights. Remote Sens. Environ. 2014, 147, 173–185. [Google Scholar] [CrossRef]
- Wei, Y.; Liu, H.; Song, W.; Yu, B.; Xiu, C. Normalization of Time Series DMSP-OLS Nighttime Light Images for Urban Growth Analysis with Pseudo Invariant Features. Landsc. Urban Plan. 2014, 128, 1–13. [Google Scholar] [CrossRef]
- Wu, J.; He, S.; Peng, J.; Li, W.; Zhong, X. Intercalibration of DMSP-OLS Night-Time Light Data by the Invariant Region Method. Int. J. Remote Sens. 2013, 34, 7356–7368. [Google Scholar] [CrossRef]
- Zhang, Q.; Pandey, B.; Seto, K.C. A Robust Method to Generate a Consistent Time Series From DMSP/OLS Nighttime Light Data. IEEE Trans. Geosci. Remote Sens. 2016, 54, 5821–5831. [Google Scholar] [CrossRef]
- Li, X.; Chen, X.; Zhao, Y.; Xu, J.; Chen, F.; Li, H. Automatic Intercalibration of Night-Time Light Imagery Using Robust Regression. Remote Sens. Lett. 2013, 4, 45–54. [Google Scholar] [CrossRef]
- Bennie, J.; Davies, T.W.; Duffy, J.P.; Inger, R.; Gaston, K.J. Contrasting Trends in Light Pollution across Europe Based on Satellite Observed Night Time Lights. Sci. Rep. 2014, 4, 3789. [Google Scholar] [CrossRef] [PubMed]
- Hsu, F.-C.; Baugh, K.; Ghosh, T.; Zhizhin, M.; Elvidge, C. DMSP-OLS Radiance Calibrated Nighttime Lights Time Series with Intercalibration. Remote Sens. 2015, 7, 1855–1876. [Google Scholar] [CrossRef]
- Lu, Y.; Zhang, Y.; Cao, X.; Wang, C.; Wang, Y.; Zhang, M.; Ferrier, R.C.; Jenkins, A.; Yuan, J.; Bailey, M.J.; et al. Forty Years of Reform and Opening up: China’s Progress toward a Sustainable Path. Sci. Adv. 2019, 5, eaau9413. [Google Scholar] [CrossRef] [PubMed]
- Leyk, S.; Uhl, J.H.; Connor, D.S.; Braswell, A.E.; Mietkiewicz, N.; Balch, J.K.; Gutmann, M. Two Centuries of Settlement and Urban Development in the United States. Sci. Adv. 2020, 6, eaba2937. [Google Scholar] [CrossRef]


| Study Region | Linear Regression Model Parameter | (PDP-UP)/UP | |
|---|---|---|---|
| b | a | ||
| Guangdong province | 52.597 × 10⁵ | 0.711 | 0.919 |
| Guangzhou | −3.012 × 10⁵ | 0.328 | 0.395 |
| Shenzhen | −6.657 × 10³ | 0.016 | 1.5 × 10⁻⁴ |
| Dongguan | −1.265 × 10⁴ | 0.017 | 1.8 × 10⁻³ |
| Foshan | −2.869 × 10⁵ | 0.291 | 0.168 |
| Zhongshan | −1.205 × 10⁴ | 0.118 | 2.45 |
| Zhuhai | −2.401 × 10⁴ | 0.582 | 0.22 |
| Jiangmen | 2.017 × 10⁵ | 1.401 | 0.49 |
| Huizhou | −1.595 × 10⁵ | 1.503 | 0.38 |
| Zhaoqing | −5.702 × 10⁴ | 3.648 | 1.19 |
| Jieyang | 3.810 × 10⁵ | 2.357 | 1.50 |
| Chaozhou | 9.999 × 10⁴ | 1.068 | 1.03 |
| Shantou | −2.061 × 10⁵ | 1.020 | 1.30 |
| Shanwei | 5.394 × 10⁴ | 3.502 | 0.71 |
| Yangjiang | 2.165 × 10⁵ | 1.387 | 1.19 |
| Zhanjiang | −4.711 × 10⁵ | 5.934 | 0.98 |
| Maoming | −3.170 × 10⁵ | 5.774 | 2.23 |
| Meizhou | 7.895 × 10⁵ | 2.893 | 1.2 |
| Qingyuan | 1.369 × 10⁵ | 3.709 | 1.95 |
| Shaoguan | −3.822 × 10⁵ | 4.749 | 0.44 |
| Heyuan | 2.805 × 10⁵ | 4.359 | 0.22 |
| Yunfu | 5.361 × 10⁴ | 5.149 | 1.5 |
Disclaimer/Publisher’s Note: The statements, opinions and data contained in all publications are solely those of the individual author(s) and contributor(s) and not of MDPI and/or the editor(s). MDPI and/or the editor(s) disclaim responsibility for any injury to people or property resulting from any ideas, methods, instructions or products referred to in the content. |
© 2025 by the authors. Licensee MDPI, Basel, Switzerland. This article is an open access article distributed under the terms and conditions of the Creative Commons Attribution (CC BY) license (https://creativecommons.org/licenses/by/4.0/).
Share and Cite
Zhang, F.; Zhang, Q.; Xu, M. Remote Sensing Insights into Urban–Rural Imbalance and Sustainable Development: A Case Study in Guangdong, China. Sustainability 2025, 17, 2247. https://doi.org/10.3390/su17052247
Zhang F, Zhang Q, Xu M. Remote Sensing Insights into Urban–Rural Imbalance and Sustainable Development: A Case Study in Guangdong, China. Sustainability. 2025; 17(5):2247. https://doi.org/10.3390/su17052247
Chicago/Turabian StyleZhang, Fushan, Qingling Zhang, and Minduan Xu. 2025. "Remote Sensing Insights into Urban–Rural Imbalance and Sustainable Development: A Case Study in Guangdong, China" Sustainability 17, no. 5: 2247. https://doi.org/10.3390/su17052247
APA StyleZhang, F., Zhang, Q., & Xu, M. (2025). Remote Sensing Insights into Urban–Rural Imbalance and Sustainable Development: A Case Study in Guangdong, China. Sustainability, 17(5), 2247. https://doi.org/10.3390/su17052247