Article

Sustainability Transformation Through Green Supply Chain Management Practices and Green Innovations in Pakistan’s Manufacturing and Service Industries

1
Business School of Hohai University, Hohai University, Nanjing 211100, China
2
School of Economics and Management, North China Electric Power University, Beijing 102206, China
*
Author to whom correspondence should be addressed.
Sustainability 2025, 17(5), 2204; https://doi.org/10.3390/su17052204
Submission received: 30 January 2025 / Revised: 26 February 2025 / Accepted: 28 February 2025 / Published: 3 March 2025

Abstract

:
The increasing global emphasis on sustainability necessitates the integration of environmentally responsible practices within supply chains. This study explores the impact of green supply chain management practices (GSCMPs) on firm sustainable performance in Pakistan’s manufacturing and service industries. Unlike prior research, which primarily focuses on the direct impact of GSCMPs, this study advances knowledge by incorporating green technological innovation (GTI) and green managerial innovation (GMI) as mediators and green organizational culture (GOC) as a moderator. The study looks at survey data from 480 industry professionals and uses partial least squares structural equation modeling (PLS-SEM) and multi-group analysis (MGA). It discovers that GSCMPs greatly enhance sustainability outcomes, especially when green innovations are used. Furthermore, the impact of GSCMPs is more pronounced in the manufacturing sector, emphasizing the role of regulatory pressures and technological advancements. This study makes a significant contribution to the literature by integrating post-pandemic sustainability challenges, highlighting industry-specific dynamics, and providing actionable strategies to enhance green supply chain adoption in emerging markets. The study provides applicable strategies for managers and policymakers to embed sustainability deeper into corporate strategies, ensuring resilience and competitive advantages in evolving global markets.

1. Introduction

The adoption of green supply chain management practices has become a critical imperative for businesses aiming to address the growing challenges of sustainability. With rising global concerns about environmental degradation, resource scarcity, and climate change, industries are under unprecedented pressure to innovate and implement sustainable practices [1]. GSCMPs, encompassing green design, purchasing, manufacturing, and marketing, not only mitigate environmental impacts, but also enhance operational efficiencies and competitive advantages [2]. Recent studies emphasize that integrating green innovations into supply chain processes can significantly contribute to global sustainability goals, particularly in high-impact industries such as manufacturing and services [3,4]. However, existing research often lacks discussion about external contingency factors and long-term sustainability, particularly in low- and middle-income economies. This study aims to bridge that gap by integrating industry-specific insights and Institutional Theory to understand the contextual pressures shaping sustainability adoption.
Green supply chain practices involve the integration of environmental thinking into supply chain management, from sourcing raw materials to product delivery and disposal [5]. The manufacturing and service industries play critical roles in sustainability, with manufacturing sectors like textiles, pharmaceuticals, and cement contributing to significant environmental impacts and service sectors like logistics, IT, and healthcare influencing indirect environmental outcomes. While these industries face increasing regulatory and consumer demands for sustainability, they also present opportunities to innovate through green technological and managerial practices. For instance, resource-efficient production processes in manufacturing and energy-efficient operational systems in services [6] are gaining traction as drivers of both environmental performance and stakeholder satisfaction [7].
Despite the recognized importance of GSCMPs, the understanding of how these practices translate into firm sustainability performance, particularly through green innovations, remains fragmented. Existing studies often generalize their findings across industries, overlooking the unique challenges and dynamics faced by the manufacturing and service sectors [8,9]. Additionally, limited research examines the role of GOC as a moderating factor that amplifies the impact of GSCMPs on sustainability outcomes. This gap in the literature underscores the need for industry-specific insights into the mechanisms linking GSCMPs to firm performance.
While prior research highlights the positive outcomes of green supply chain practices [10], there is insufficient evidence on how GTI and GMI mediate the relationship between GSCMPs and sustainable performance. Moreover, the moderating influence of GOC in this context has received scant attention, particularly in low- and middle-income economies like Pakistan, where cultural and institutional factors significantly shape sustainability.
Recent studies have begun to explore the transformative potential of green innovations in enhancing environmental, economic, and social performance [11,12]. For instance, G. Wu et al. [13,14] linked GTI to reductions in carbon footprints and energy consumption, while Farrukh Shahzad et al. [15] linked GMI to improved stakeholder collaboration and compliance with sustainability standards. However, these insights remain scattered, and a comprehensive framework integrating these constructs within specific industrial contexts is lacking. Furthermore, the limited focus on low- and middle-income economies restricts our understanding of how GSCMPs operate in regions with distinct institutional and resource constraints [16]. The manufacturing and service industries in Pakistan provide a fertile ground for examining these dynamics due to their environmental impacts, significant contributions to GDP, and growing emphasis on sustainable practices.
In Pakistan, the manufacturing and service industries are among the largest contributors to economic activity [17,18], yet they are also major sources of environmental degradation. For instance, the textile and cement manufacturing sectors are resource-intensive and emit significant greenhouse gases, while the logistics and IT service sectors face challenges in optimizing their energy consumption. The increasing global demand for sustainable solutions has compelled firms in these sectors to adopt green supply chain practices. However, inadequate infrastructure, regulatory inefficiencies, and cultural resistance to change often hinder the implementation of such practices [19]. Addressing these barriers requires tailored strategies that consider the unique characteristics of these industries and their operating environments.
This study aims to address these gaps by examining the role of GSCMPs in enhancing firm sustainability performance in the manufacturing and service industries in Pakistan. Specifically, it investigates the mediating effects of GTI and GMI and the moderating role of GOC. By doing so, the study seeks to provide actionable insights for practitioners and policymakers striving to achieve sustainability goals in these critical sectors. This paper presents an integrative framework that links GSCMPs, green innovations, and sustainability performance with empirical evidence from the manufacturing and service industries in Pakistan. The findings aim to advance the theoretical understanding of green supply chains while offering practical solutions for fostering sustainability in resource-intensive and service-oriented industries.

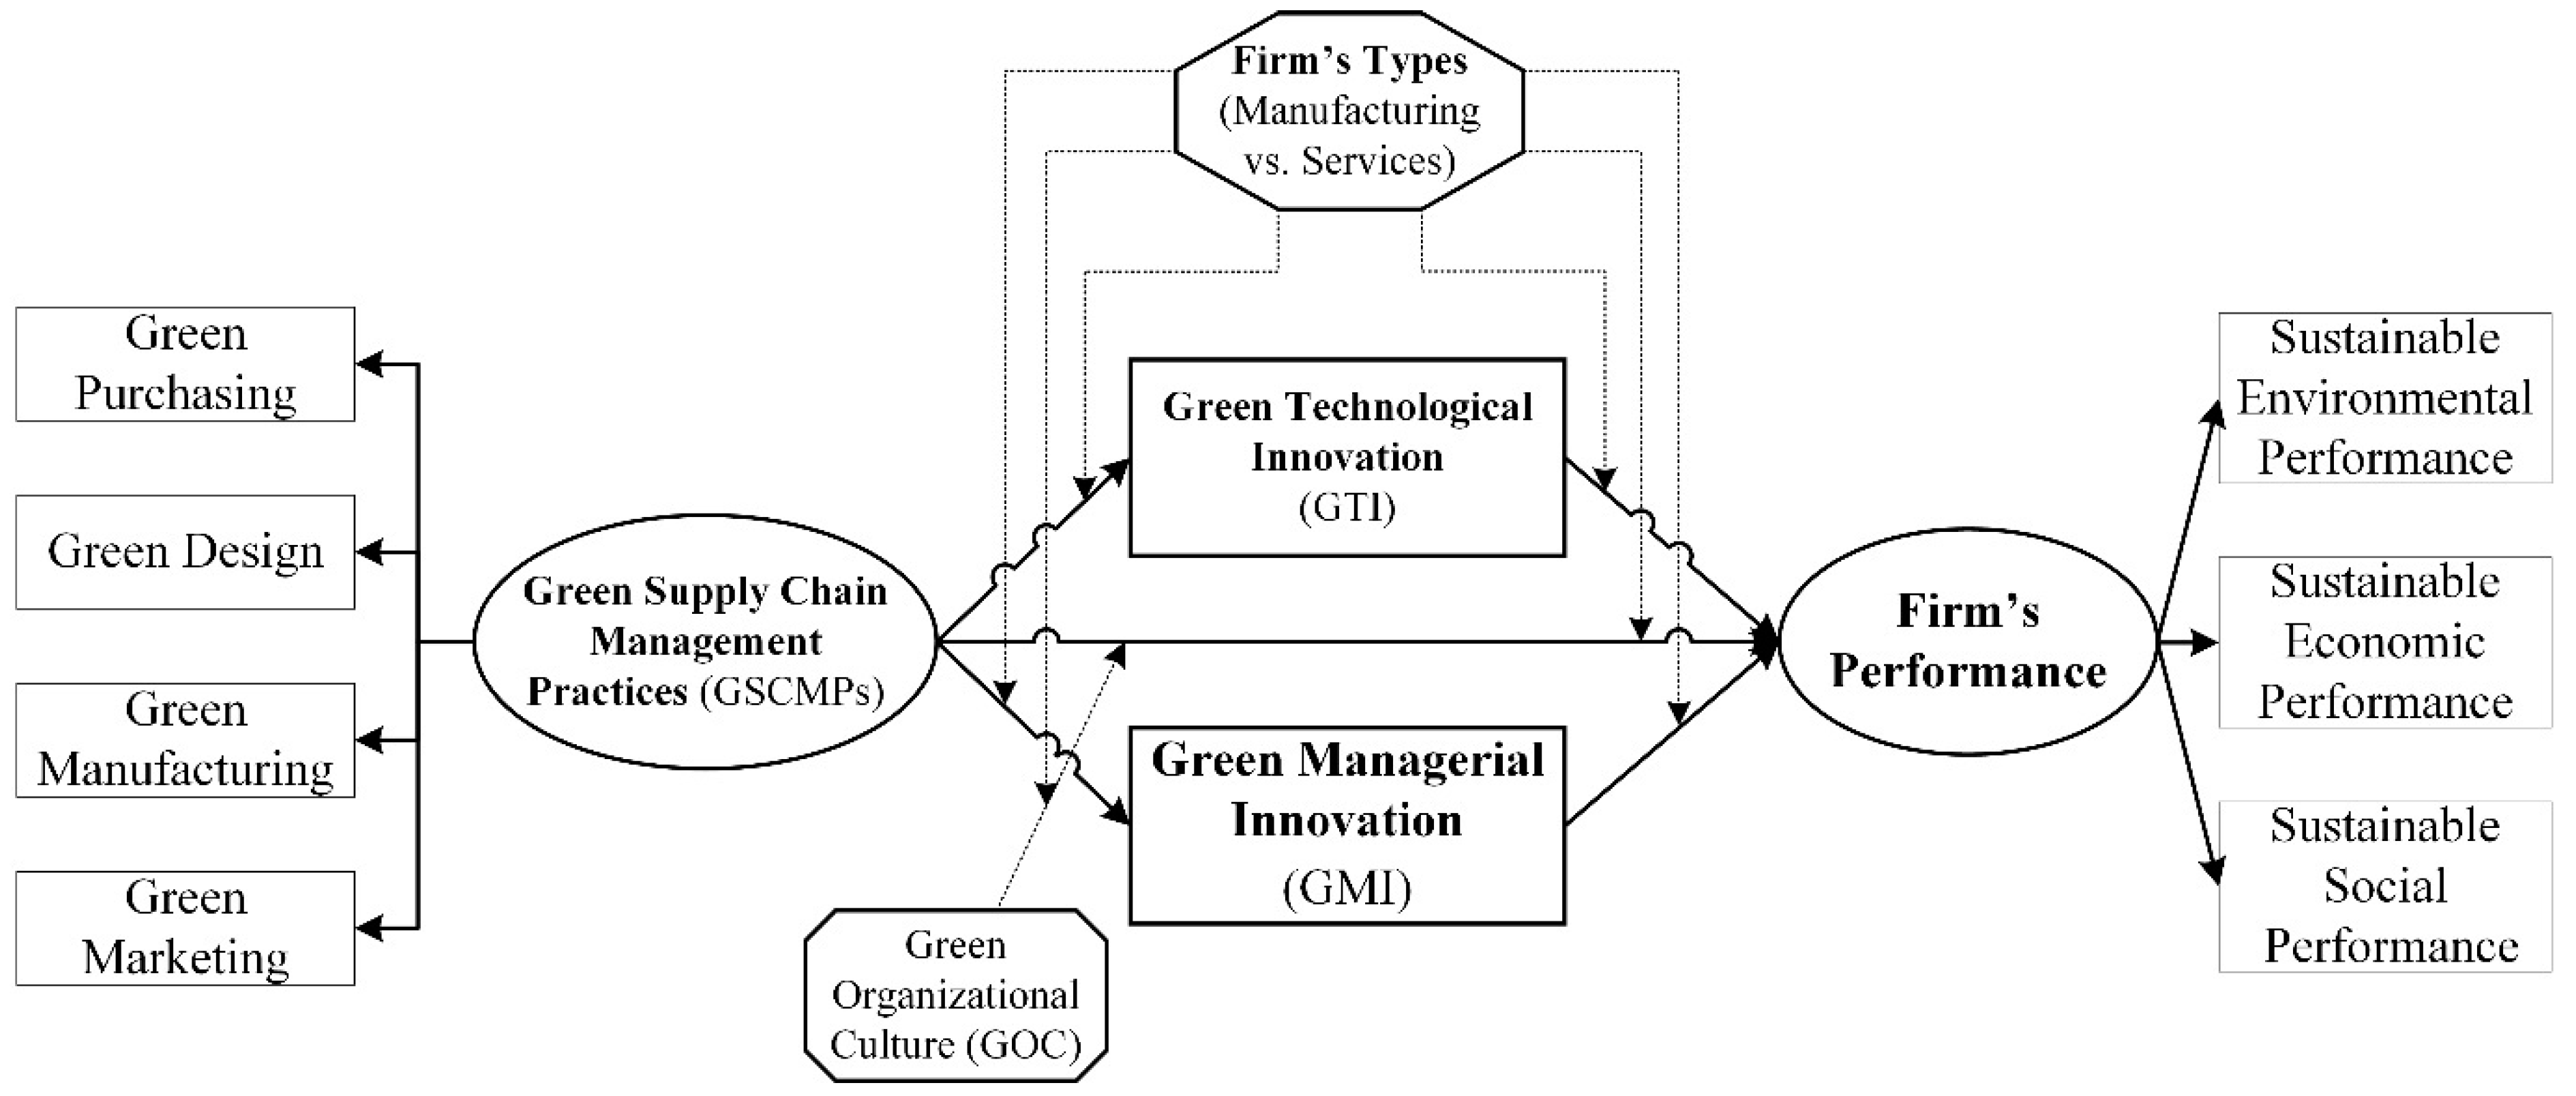
2. Literature Review and Framework Development

2.1. Theoretical Base of the Study

This study draws on the following primary theoretical perspectives: the resource-based view (RBV), Institutional Theory, and the dynamic capabilities theory. The RBV posits that firms achieve competitive advantages by leveraging valuable, rare, inimitable, and non-substitutable resources [20]. Munizu et al. [21] view GSCMPs, such as green purchasing, manufacturing, and marketing, as strategic resources that enhance operational efficiency and environmental stewardship, thereby contributing to sustainability.
The dynamic capabilities theory complements the RBV by emphasizing the need for firms to develop capabilities that allow them to adapt to changing environments [22]. Green innovations, such as GTI and GMI, represent such dynamic capabilities, enabling firms to respond effectively to regulatory pressures and market demands for sustainability [23]. Institutional Theory explains how external forces—such as government policies, market competition, and consumer expectations—shape firms’ sustainability adoption. Organizations respond to institutional pressures (e.g., regulatory frameworks and industry standards) by integrating sustainability practices into their supply chains [24]. In the Pakistani context, regulatory inefficiencies and cultural resistance to change serve as barriers to green supply chain adoption. Addressing these issues requires industry-specific strategies that cater to the unique operational challenges in both the manufacturing and service sectors. Furthermore, sub-sectoral challenges within manufacturing (e.g., textiles and pharmaceuticals) and services (e.g., logistics and IT) require deeper exploration to understand variations in sustainability adoption.

2.2. Literature Review

2.2.1. Green Supply Chain Management Practices (GSCMPs)

Green supply chain management practices integrate environmental concerns into supply chain processes, ranging from procurement to production, delivery, and disposal. These practices encompass green purchasing, green design, green manufacturing, and green marketing, all of which are aimed at minimizing the environmental impact of supply chains [25]. Studies have shown that GSCMPs not only help companies to reduce their ecological footprints, but also to enhance their operational efficiency and profitability, highlighting the role of external pressures (e.g., regulatory standards and market competition) in influencing firms to adopt GSCMPs. For instance, government regulations such as carbon taxes and emission reduction policies play a pivotal role in driving firms towards greener practices. Moreover, the increasing demand for eco-friendly products has spurred firms to implement sustainable practices to maintain a competitive advantage [26]. For instance, green manufacturing minimizes waste and emissions while improving resource utilization, and green marketing strategies align brand image with consumer expectations for sustainability [27,28]. In manufacturing industries, such as textiles and cement, GSCMPs play a critical role in addressing resource-intensive processes, while in service industries like logistics and IT, they help reduce indirect environmental impacts [2]. However, despite the established direct effects of GSCMPs on firm sustainability, their role in fostering innovations such as green technological and managerial practices remain underexplored.
However, institutional and market pressures significantly influence the effectiveness of GSCMPs. Studies have shown that carbon taxation, trade credit policies, and sustainability-related financial incentives impact GSCM adoption [29]. Firms often need to navigate complex regulatory landscapes, where government incentives or penalties play a critical role in shaping sustainability strategies. Market competition further compels firms to enhance their sustainability efforts, as differentiation through green initiatives is becoming a competitive advantage [30]. Moreover, evolving consumer behavior toward choosing environmentally friendly products forces firms to align their supply chains with sustainability expectations [31].

2.2.2. Green Technological Innovation (GTI)

Green technological innovation refers to the development and adoption of technologies aimed at reducing environmental harm and improving resource efficiency [12,32]. These innovations include renewable energy systems, energy-efficient production processes, and eco-friendly materials. Recent advancements in renewable energy technologies, energy-efficient production processes, and eco-friendly materials have been recognized as key drivers of sustainability. Studies also show that GTI plays a significant environmental role by reducing carbon emissions and optimizing energy consumption. In the manufacturing industry, GTI can lead to significant improvements in energy consumption and waste reduction, while in the service industry, it often involves adopting IT solutions and optimizing operational efficiency [33]. Studies highlight that GTI significantly enhances environmental performance by reducing carbon footprints and improving energy efficiency [34,35]. Moreover, GTI strengthens firms’ competitive advantage by aligning their offerings with evolving consumer preferences and regulatory requirements [36]. Despite their importance, the mechanisms through which GSCMPs drive GTI and its subsequent impact on sustainability outcomes warrant further empirical investigation, especially in low- and middle-income economies like Pakistan.

2.2.3. Green Managerial Innovation (GMI)

Green managerial innovation involves adopting innovative managerial practices, systems, and processes that promote sustainability [5]. GMI is critical in aligning organizational goals with sustainability objectives. For instance, sustainability reporting, supplier collaboration, and cross-functional teams focused on environmental outcomes have been shown to improve sustainability performance. In manufacturing industries, GMI focuses on implementing green management systems and fostering cross-functional collaboration to optimize production processes [37]. In service industries, GMI often includes sustainability-oriented policies, such as energy-efficient logistics solutions or customer-centric, eco-friendly service models. Recent research underscores the importance of GMI in achieving social and economic performance goals, as it fosters a culture of sustainability and drives organizational alignment with environmental objectives [38]. However, the dynamics of how GSCMPs influence GMI, particularly across diverse industrial contexts, remain underexplored.

2.2.4. Green Organizational Culture (GOC)

Green organizational culture represents the shared values, beliefs, and practices within an organization that emphasize environmental sustainability [39]. A strong GOC enhances the adoption of green practices by fostering employee engagement and aligning organizational goals with sustainability objectives [40]. Recent studies have demonstrated that GOC acts as a moderator, strengthening the relationship between green practices and sustainability outcomes [41]. For example, in manufacturing industries, a strong GOC facilitates the integration of eco-friendly technologies into production, while in service industries, it supports the adoption of energy-efficient and customer-centric green practices [42,43]. However, empirical evidence on the moderating role of GOC, particularly in Pakistan’s manufacturing and service sectors, remains limited.

2.2.5. Firm Sustainable Performance

Firm sustainable performance refers to an organization’s ability to achieve long-term value creation while addressing social, environmental, and economic objectives [44]. This multidimensional construct evaluates a firm’s success beyond financial metrics and ensures that operations align with stakeholder expectations.
Social Sustainability Performance: Social sustainability performance focuses on a firm’s ability to positively impact stakeholders, including employees, customers, and communities [45]. In the manufacturing industry, this may involve ensuring fair labor practices and maintaining safe working conditions [46]. In the service industry, social performance may include ethical customer engagement and active community involvement. Firms that prioritize social sustainability often build stronger stakeholder relationships, enhancing their reputation and fostering customer loyalty [47]. For instance, implementing green marketing practices in manufacturing, such as ethical sourcing and labeling, can attract eco-conscious consumers. Similarly, service firms engaging in community development initiatives and offering sustainable services contribute to long-term societal benefits [48].
Economic Sustainability Performance: Economic sustainability performance focuses on achieving financial outcomes through sustainable practices, emphasizing profitability, cost efficiency, and market competitiveness [49]. In the manufacturing sector, green manufacturing practices reduce waste and energy consumption, lowering operational costs and enhancing resource efficiency [50]. In the service industry, practices like green logistics and energy-efficient IT systems drive cost savings and improve service quality. For example, logistics firms adopting optimized route management systems can reduce fuel costs while enhancing their operational performance. Additionally, regulatory compliance and eco-certifications improve firms’ market competitiveness by reducing penalties and appealing to sustainability-conscious stakeholders [51].
Environmentally Sustainability Performance: Environmental sustainability performance measures a firm’s ability to minimize its ecological footprint by reducing emissions, conserving resources, and managing waste effectively [12]. The manufacturing sector achieves environmental performance by adopting green manufacturing techniques like renewable energy integration and waste recycling [52]. Service industries achieve environmental sustainability by optimizing energy consumption in operations and transitioning to paperless systems or eco-friendly transportation solutions. According to Baah et al. [53], firms that implemented renewable energy solutions significantly reduced their carbon emissions. Additionally, meeting strict environmental regulations enhances firms’ market competitiveness and positions them as sustainability leaders [54].

2.3. Hypothesis Development

2.3.1. Green Supply Chain Management Practices and Green Technological Innovation

Green supply chain management practices provide a foundation for green technological innovation by creating an environment that prioritizes sustainability and resource efficiency. GSCMPs, such as green purchasing and green manufacturing, encourage firms to adopt advanced technologies that reduce their environmental impact [55]. For example, green purchasing practices involve sourcing eco-friendly materials, necessitating innovative technologies to process and utilize these materials efficiently [56]. Similarly, green manufacturing emphasizes energy efficiency, waste reduction, and process optimization, all of which require technological advancements.
Jum’a et al. [57] demonstrated that firms implementing GSCMPs in the manufacturing and service industries were more likely to adopt renewable energy technologies and eco-friendly systems. These innovations improve environmental performance and align firms with consumer preferences for sustainable products. In manufacturing industries, GTI enables energy-efficient production, while in service industries, it facilitates IT-based solutions to optimize resource use. Thus, the following is hypothesized:
H1. 
Green supply chain management practices positively influence green technological innovation.

2.3.2. Green Supply Chain Management Practices and Green Managerial Innovation

Green supply chain management practices also foster green managerial innovation by promoting organizational practices that integrate sustainability into managerial processes. Green purchasing and marketing encourage firms to adopt innovative approaches, such as supplier collaboration and sustainability-focused reporting, to comply with environmental goals [58]. For instance, firms practicing green marketing in the manufacturing industry often implement sustainability certifications or labels, while service firms adopt sustainable procurement policies to enhance organizational efficiency.
Nazir et al. [59] argue that GMI plays a pivotal role in transforming traditional managerial practices into ones that prioritize sustainability. By embedding environmental objectives into decision making, firms can better align their operations with sustainability goals. This is particularly relevant in the manufacturing and service industries in low- and middle-income economies like Pakistan, where operational complexities require innovative managerial strategies. Thus, the following is hypothesized:
H2. 
Green supply chain management practices positively influence green managerial innovation.

2.3.3. Green Supply Chain Management Practices and Firm Sustainable Performance

Green supply chain management practices directly impact firm sustainable performance by improving environmental, social, and economic outcomes. Green purchasing reduces environmental footprint by sourcing raw materials responsibly, while green manufacturing minimizes waste and emissions. Additionally, green marketing enhances brand reputation and customer loyalty by promoting eco-friendly products [60].
Research shows that firms implementing GSCMPs experience an enhanced operational efficiency and reduced costs, which contribute to economic sustainability [61]. In manufacturing, these practices improve resource efficiency and reduce emissions, while in services, they optimize processes to enhance customer satisfaction. Moreover, GSCMPs facilitate ethical labor practices and community engagement initiatives to achieve social sustainability. For example, Li and He [62] found that firms with comprehensive GSCMPs achieved a superior performance in terms of stakeholder relationships and regulatory compliance. Thus, the following is hypothesized:
H3. 
Green supply chain management practices positively influence firm sustainable performance.

2.3.4. Green Innovations and Firm Sustainable Performance

Green technological innovation enhances firm sustainable performance by enabling the development of eco-friendly products and processes that align with environmental and economic goals. In the manufacturing industry, GTI involves adopting energy-efficient machinery and renewable energy systems to reduce resource use and emissions [63]. In the service industry, GTI enables process optimization through IT-based solutions, reducing operational inefficiencies.
Visamitanan et al. [64] demonstrated that GTI improves social sustainability by fostering consumer trust through environmentally responsible practices. For example, logistics firms adopting route optimization technology reduce their fuel consumption and emissions, benefiting both the environment and customers. Thus, the following is hypothesized:
H4. 
Green technological innovation positively influences firm sustainable performance.
Moreover, green managerial innovation promotes firm sustainable performance by aligning managerial processes with sustainability objectives. In manufacturing, GMI includes practices such as sustainability certifications and eco-friendly inventory management. In service industries, it involves energy-efficient logistics operations and customer-centric green service strategies [1]. Miar et al. [65] argue that GMI strengthens economic sustainability by optimizing supply chain efficiency and reducing costs associated with resource wastage. For instance, adopting green certifications in manufacturing ensures compliance with international standards, while in service industries, GMI enhances employee engagement and stakeholder collaboration. Thus, the following is hypothesized:
H5. 
Green managerial innovation positively influences firm sustainable performance.

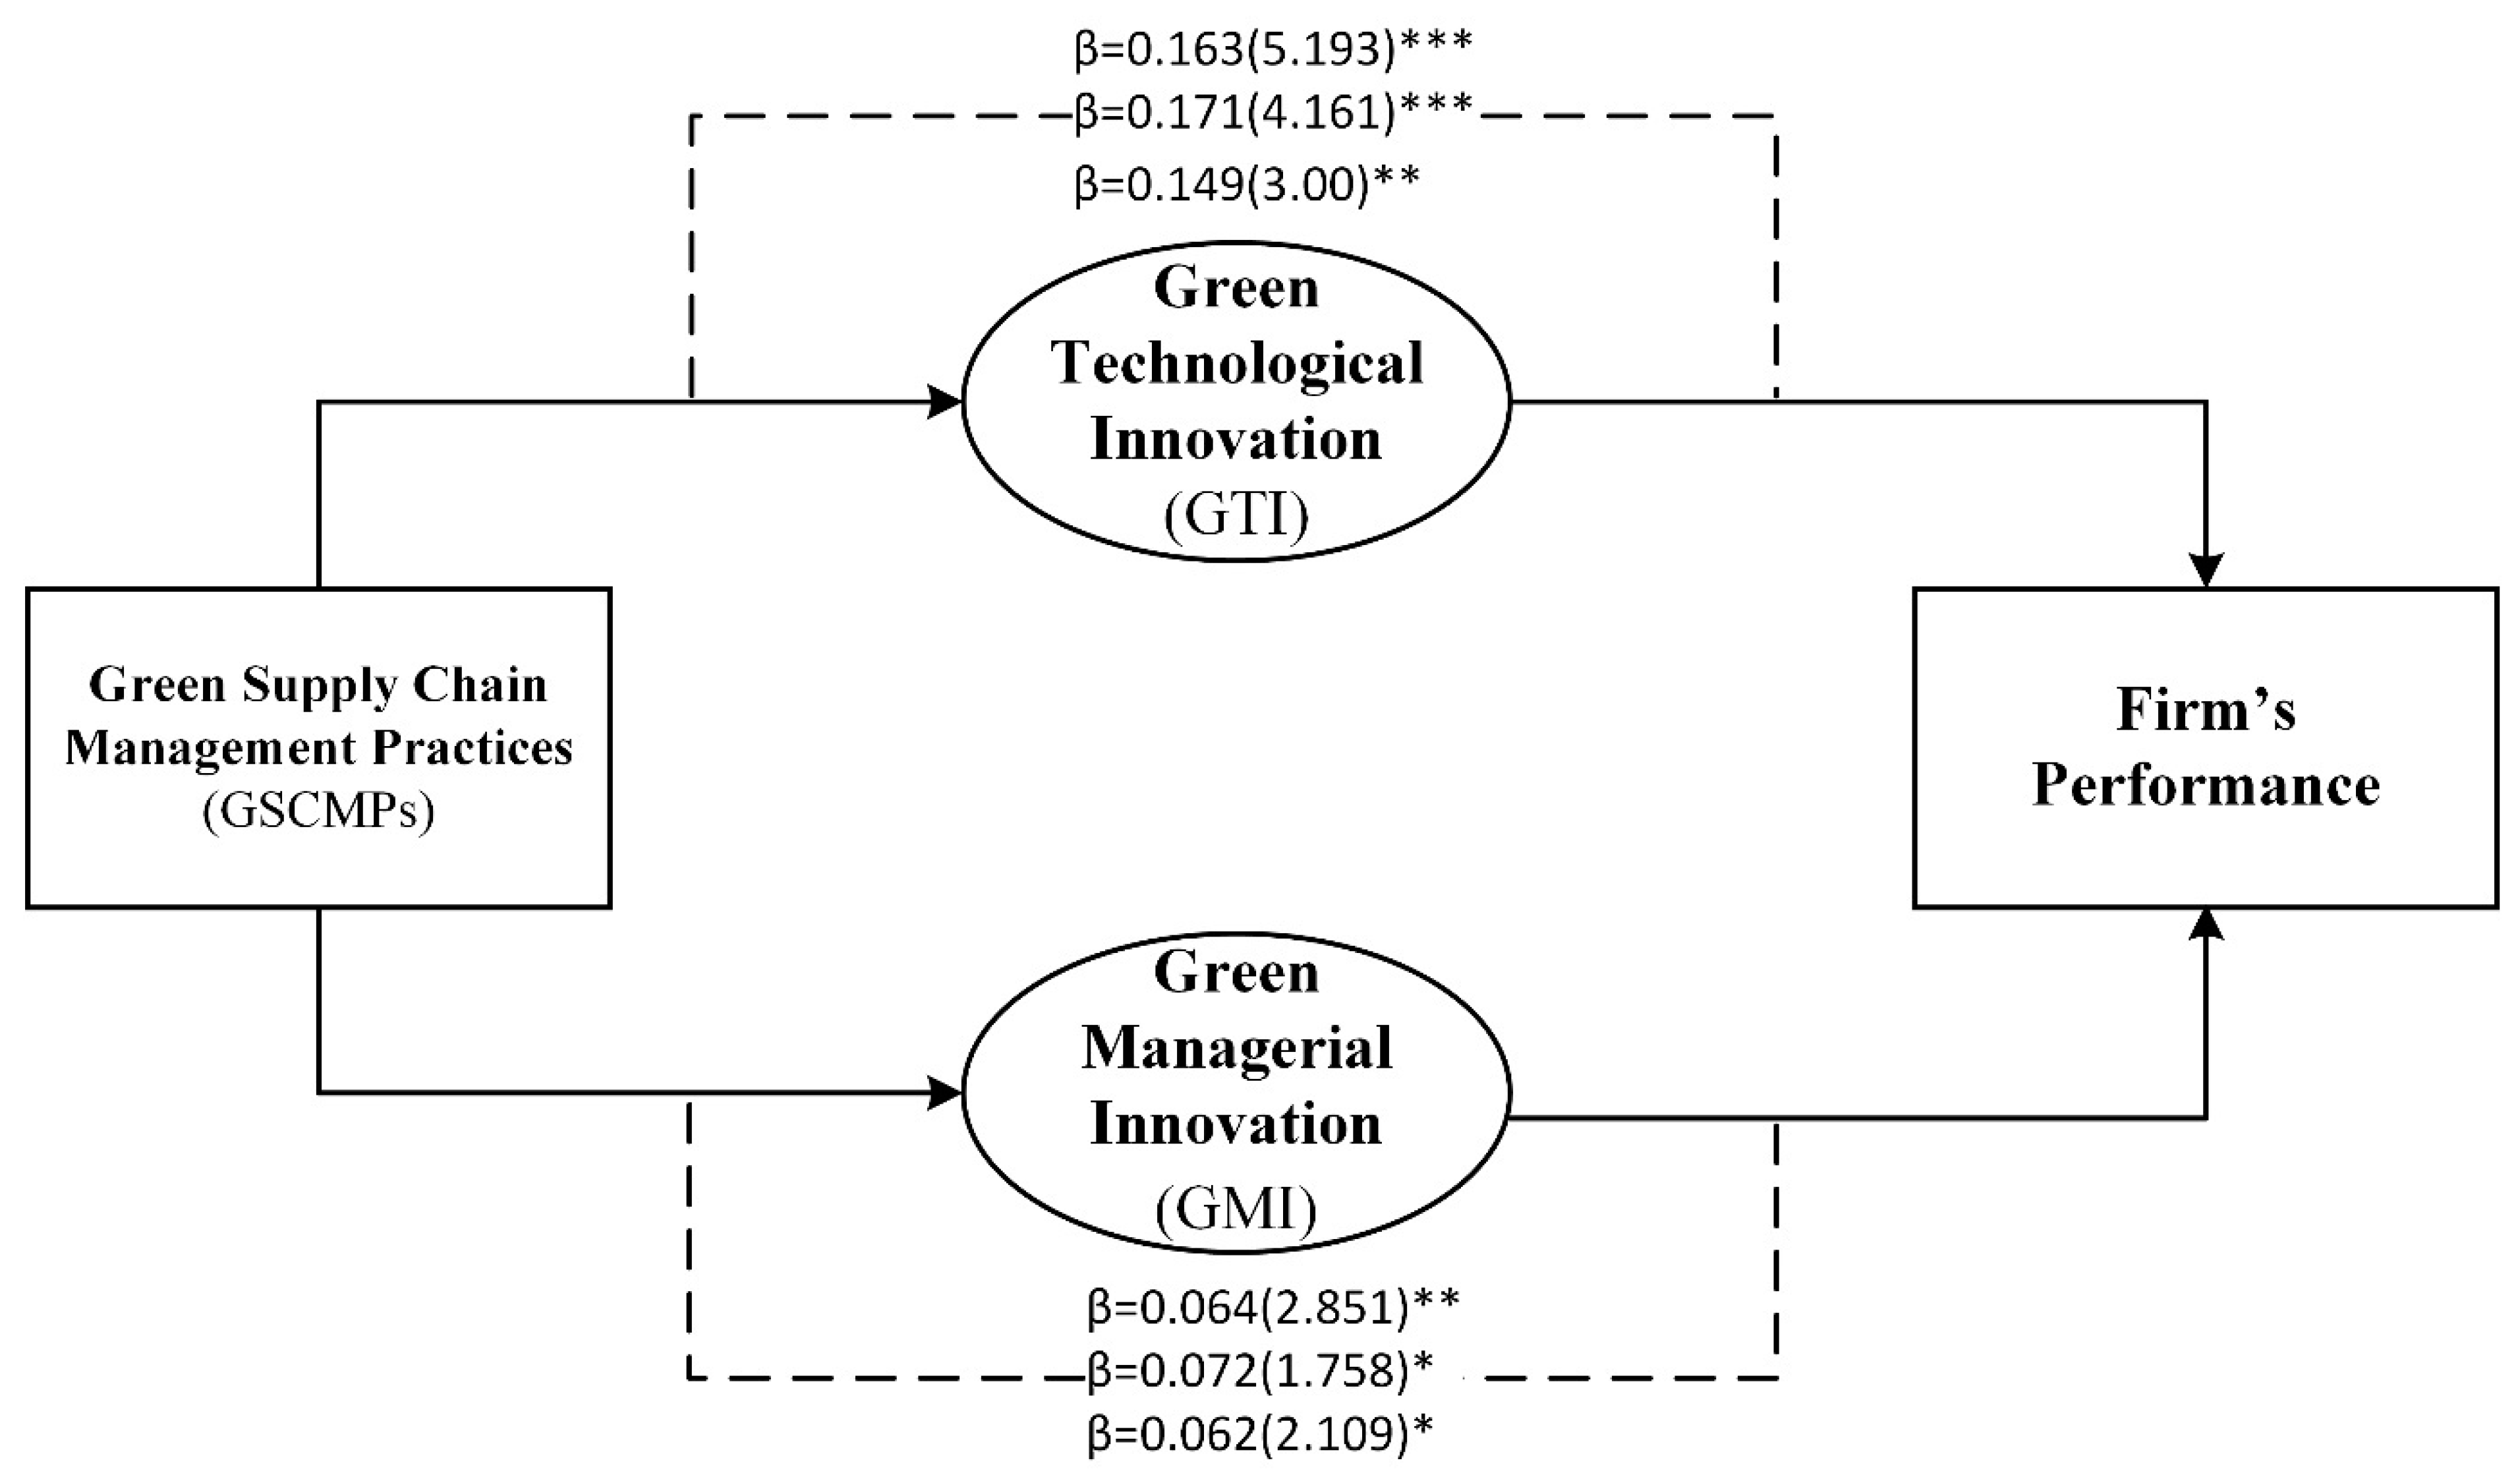
2.3.5. Mediating Effects of Green Innovations

Green innovations act as mediators by transforming the impacts of GSCMPs into tangible sustainability outcomes. GTI enables firms to leverage advanced technologies for energy efficiency and waste reduction, maximizing the benefits of GSCMPs [66]. Similarly, GMI facilitates the integration of sustainability into managerial processes, ensuring that operational benefits are realized across an organization [67].
Khan et al. [68] highlighted the complementary roles of GTI and GMI in enhancing firm sustainability. For instance, a manufacturing firm implementing green manufacturing practices can achieve a greater environmental performance when coupled with sustainability-focused decision-making frameworks. Therefore, the following are hypothesized:
H6. 
Green technological innovation mediates the relationship between green supply chain management practices and firm sustainable performance.
H7. 
Green managerial innovation mediates the relationship between green supply chain management practices and firm sustainable performance.

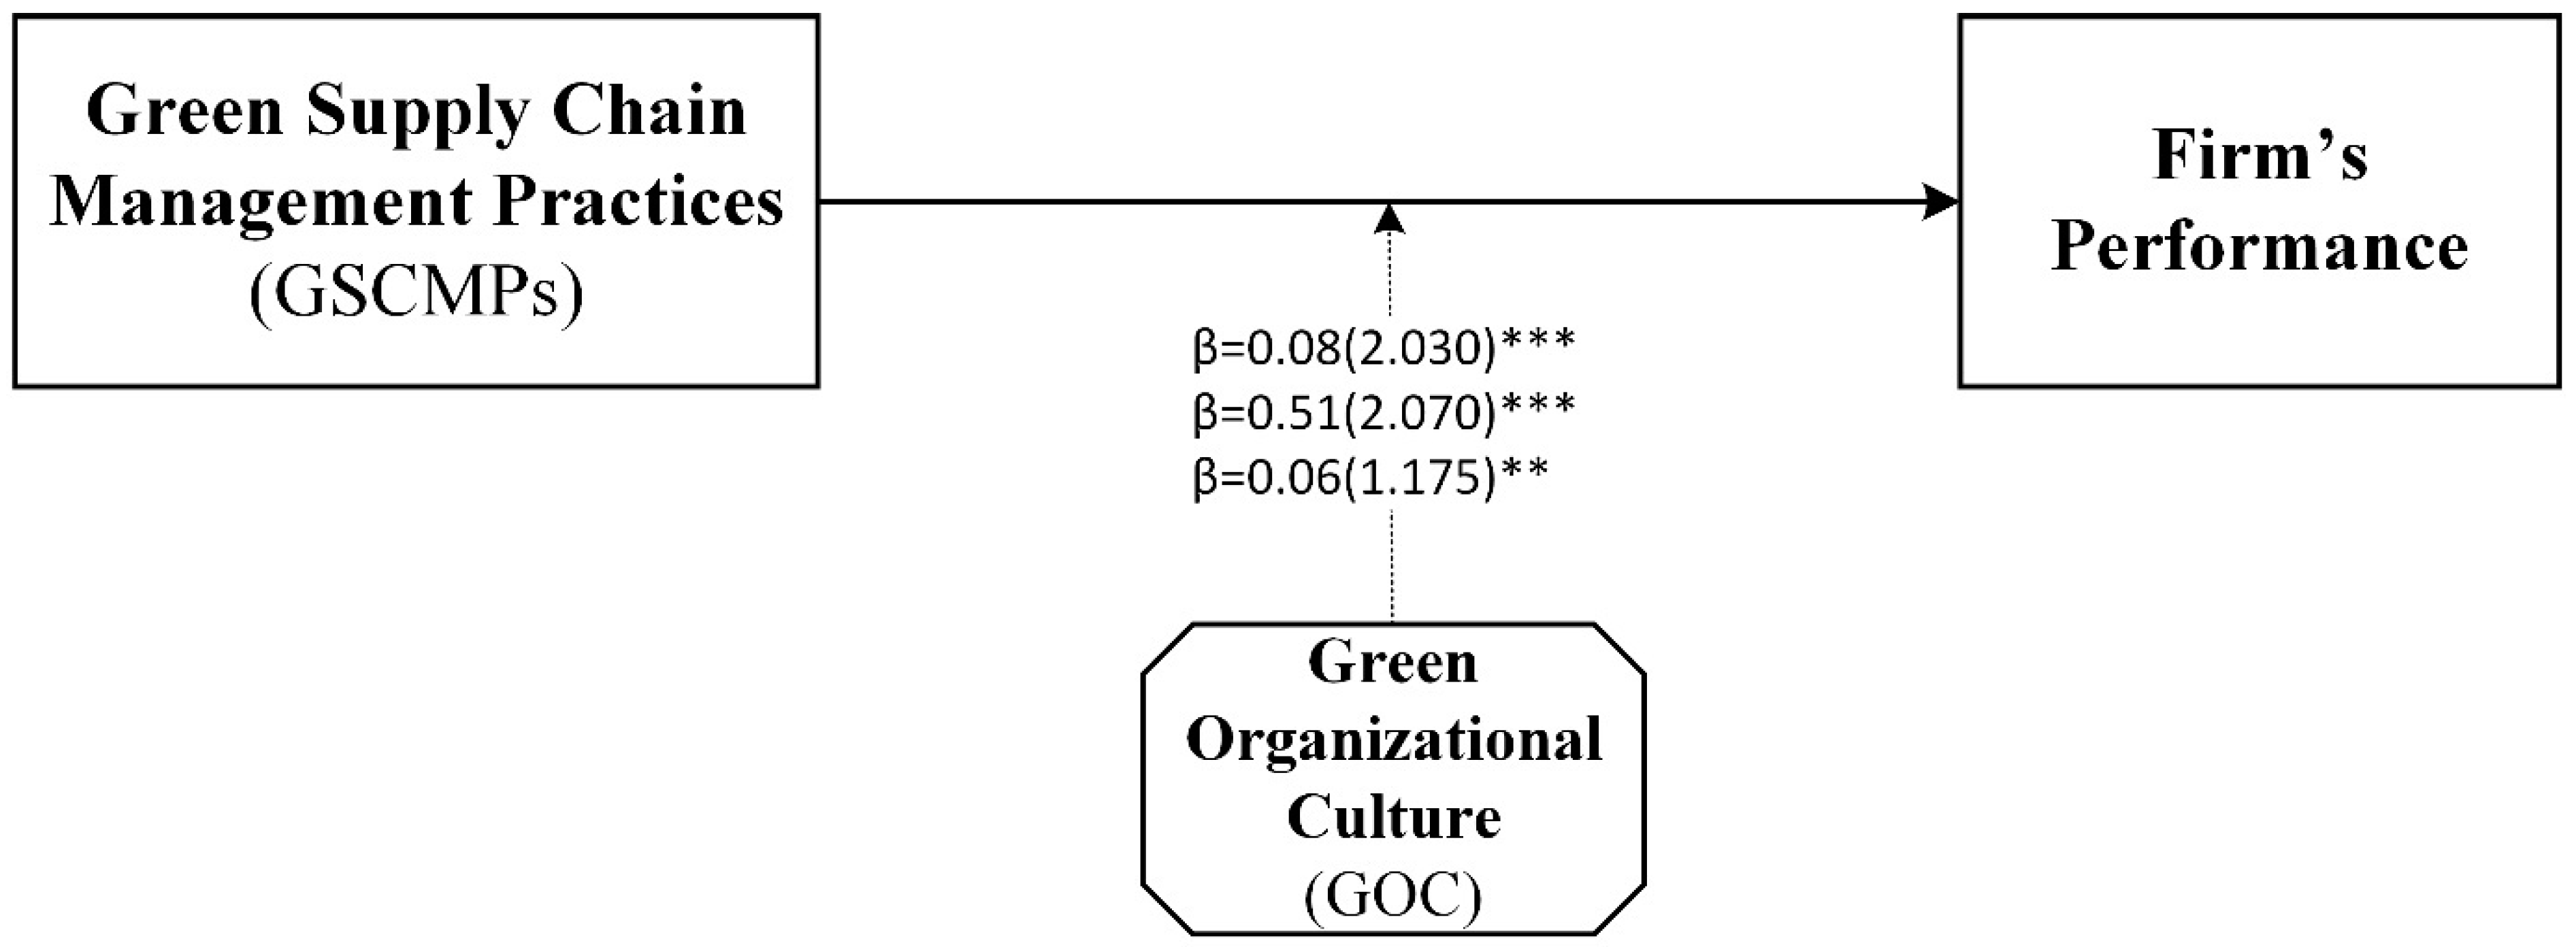
2.3.6. Moderating Role of Green Organizational Culture

Green organizational culture amplifies the effectiveness of GSCMPs by fostering an environment that supports sustainability. A strong GOC aligns employee behaviors and organizational goals with environmental priorities, ensuring the successful implementation of green practices [69]. A study by Radakovich [70] demonstrated that firms with a robust GOC were better able to translate GSCMPs into an improved environmental, social, and economic performance.
In industries like manufacturing and services, where regulatory pressures are significant, GOC provides a cultural foundation that drives employee engagement and sustainability-focused innovations [71]. By promoting shared values and norms, GOC enhances the impact of GSCMPs on firm sustainable performance. Thus, the following is hypothesized:
H8. 
Green organizational culture moderates the relationship between green supply chain management practices and firm sustainable performance.
By incorporating the recent literature, this study aligns with contemporary sustainability discussions and enhances its theoretical contribution. Figure 1 represents the proposed conceptual framework of the study.

3. Research Methodology

3.1. Sampling and Data Collection

This study employed a purposive sampling technique to ensure that respondents are knowledgeable about sustainability practices and actively involved in supply chain management within their organizations. Although purposive sampling allows for targeted data collection, potential biases should be acknowledged. The study mitigated bias by ensuring a diverse representation of industries and firm sizes. The target population consisted of middle to senior management professionals from the manufacturing and service industries in Pakistan. These industries were selected due to their substantial contributions to the economy, significant environmental impacts, and increasing adoption of sustainability initiatives. The sampling frame was developed using industry directories, trade associations, and professional networks to identify firms that aligned with the study’s objectives.
An online questionnaire was utilized for data collection, leveraging professional networks such as LinkedIn, email distribution, and industry associations to reach potential respondents. The questionnaire link was disseminated to over 600 professionals, resulting in 480 complete responses, achieving an 80% response rate. To address potential non-response bias (NRB), a wave analysis was conducted, comparing early and late respondents across key variables. The results indicated no significant differences, confirming the absence of non-response bias. To encourage participation, the study emphasized its academic purpose and assured the respondents of confidentiality and anonymity. These measures were taken to ensure high-quality responses and foster trust among the participants.
The manufacturing industry participants were drawn from sectors such as textiles, pharmaceuticals, and cement, covering roles in production, processing, and operations. The service industry participants represented fields such as logistics, IT, and healthcare, with responsibilities in operations, procurement, and service delivery. By employing a systematic and targeted approach to sampling and data collection, this study ensured that the data accurately captured the dynamics of GSCMPs and their impacts on firm performance in these industries.
This study employed a cross-sectional research design, which, while limiting causal inference, is widely used in sustainability research to capture firm-level practices at a specific point in time. To mitigate common method bias (CMB), we followed procedural and statistical remedies. First, we used the proximal separation of key constructs within the survey and assured the respondents of anonymity to reduce social desirability bias. Second, Harman’s single-factor test was performed, revealing that the largest factor accounted for only 32% of variance, well below the 50% threshold, indicating that CMB is not a major concern. The results are presented in Table 1.
The detailed demographic breakdown (presented in Table 2) further strengthens the contextual relevance and applicability of the findings, providing a comprehensive view of the participants’ backgrounds and their firms’ operational contexts. This approach ensures that the study’s conclusions are both reliable and representative of the realities within Pakistan’s manufacturing and service sectors.

3.2. Assumptions

This study is based on several key assumptions, including that the responses provided by industry professionals accurately reflect organizational practices and strategies, external environmental factors (such as government policies and technological advancements) influence sustainability adoption but are not explicitly modeled, and green supply chain management practices have a direct and indirect impact on firm sustainability, moderated by green organizational culture.

3.3. Measurement Instrument Development

The measurement instrument was developed based on established scales from prior studies, ensuring its validity and reliability. All constructs were measured on a 5-point Likert scale, ranging from 1 (strongly disagree) to 5 (strongly agree). A pre-test and pilot study were conducted with 30 respondents from the manufacturing and service industries to refine the questionnaire. The feedback from this phase was used to improve clarity, remove ambiguous items, and ensure the reliability of the scales. A description and details of the measurement items are presented below in Table 3.

3.4. Data Analysis Approach

Data were analyzed using PLS-SEM, which is suitable for exploratory and predictive research involving complex models [76]. The analysis was conducted in SmartPLS 4.0, following a two-step process. First, the measurement model was evaluated for its reliability and validity. Second, the structural model was assessed to test the hypothesized relationships, including direct, mediating, and moderating effects.
Despite its advantages, PLS-SEM has limitations, including assumptions of linear relationships and challenges in handling endogeneity. To address potential biases, we followed recent best practices by including bootstrapping with 5000 resamples to ensure robust coefficient estimation.
PLS-MGA was performed to compare the results between the manufacturing and services industries. Measurement invariance of composite models (MICOM) was also conducted to ensure the validity of cross-group comparisons. To make the framework, a simultaneous equation system can be used. This system models the relationships among all variables jointly, as follows:
G T I = α 0 + α 1 G S C P + ξ 1 G M I = β 0 + β 1 G S C P + ξ 2 F S P = γ 0 + γ 1 G S C P + γ 2 G T I + γ 3 G M I + γ 4 ( G S C P G O C ) + ξ 3
where α1 is the effect of GSCPs on GTI, β1 is the effect of GSCPs on GMI, γ1, γ2, γ3, and γ4 are the effects of GSCPs, GTI, GMI, and their interactions on FSP, and ξ1, ξ2, and ξ3 are error terms. This system accounts for direct, indirect, and moderated effects simultaneously.

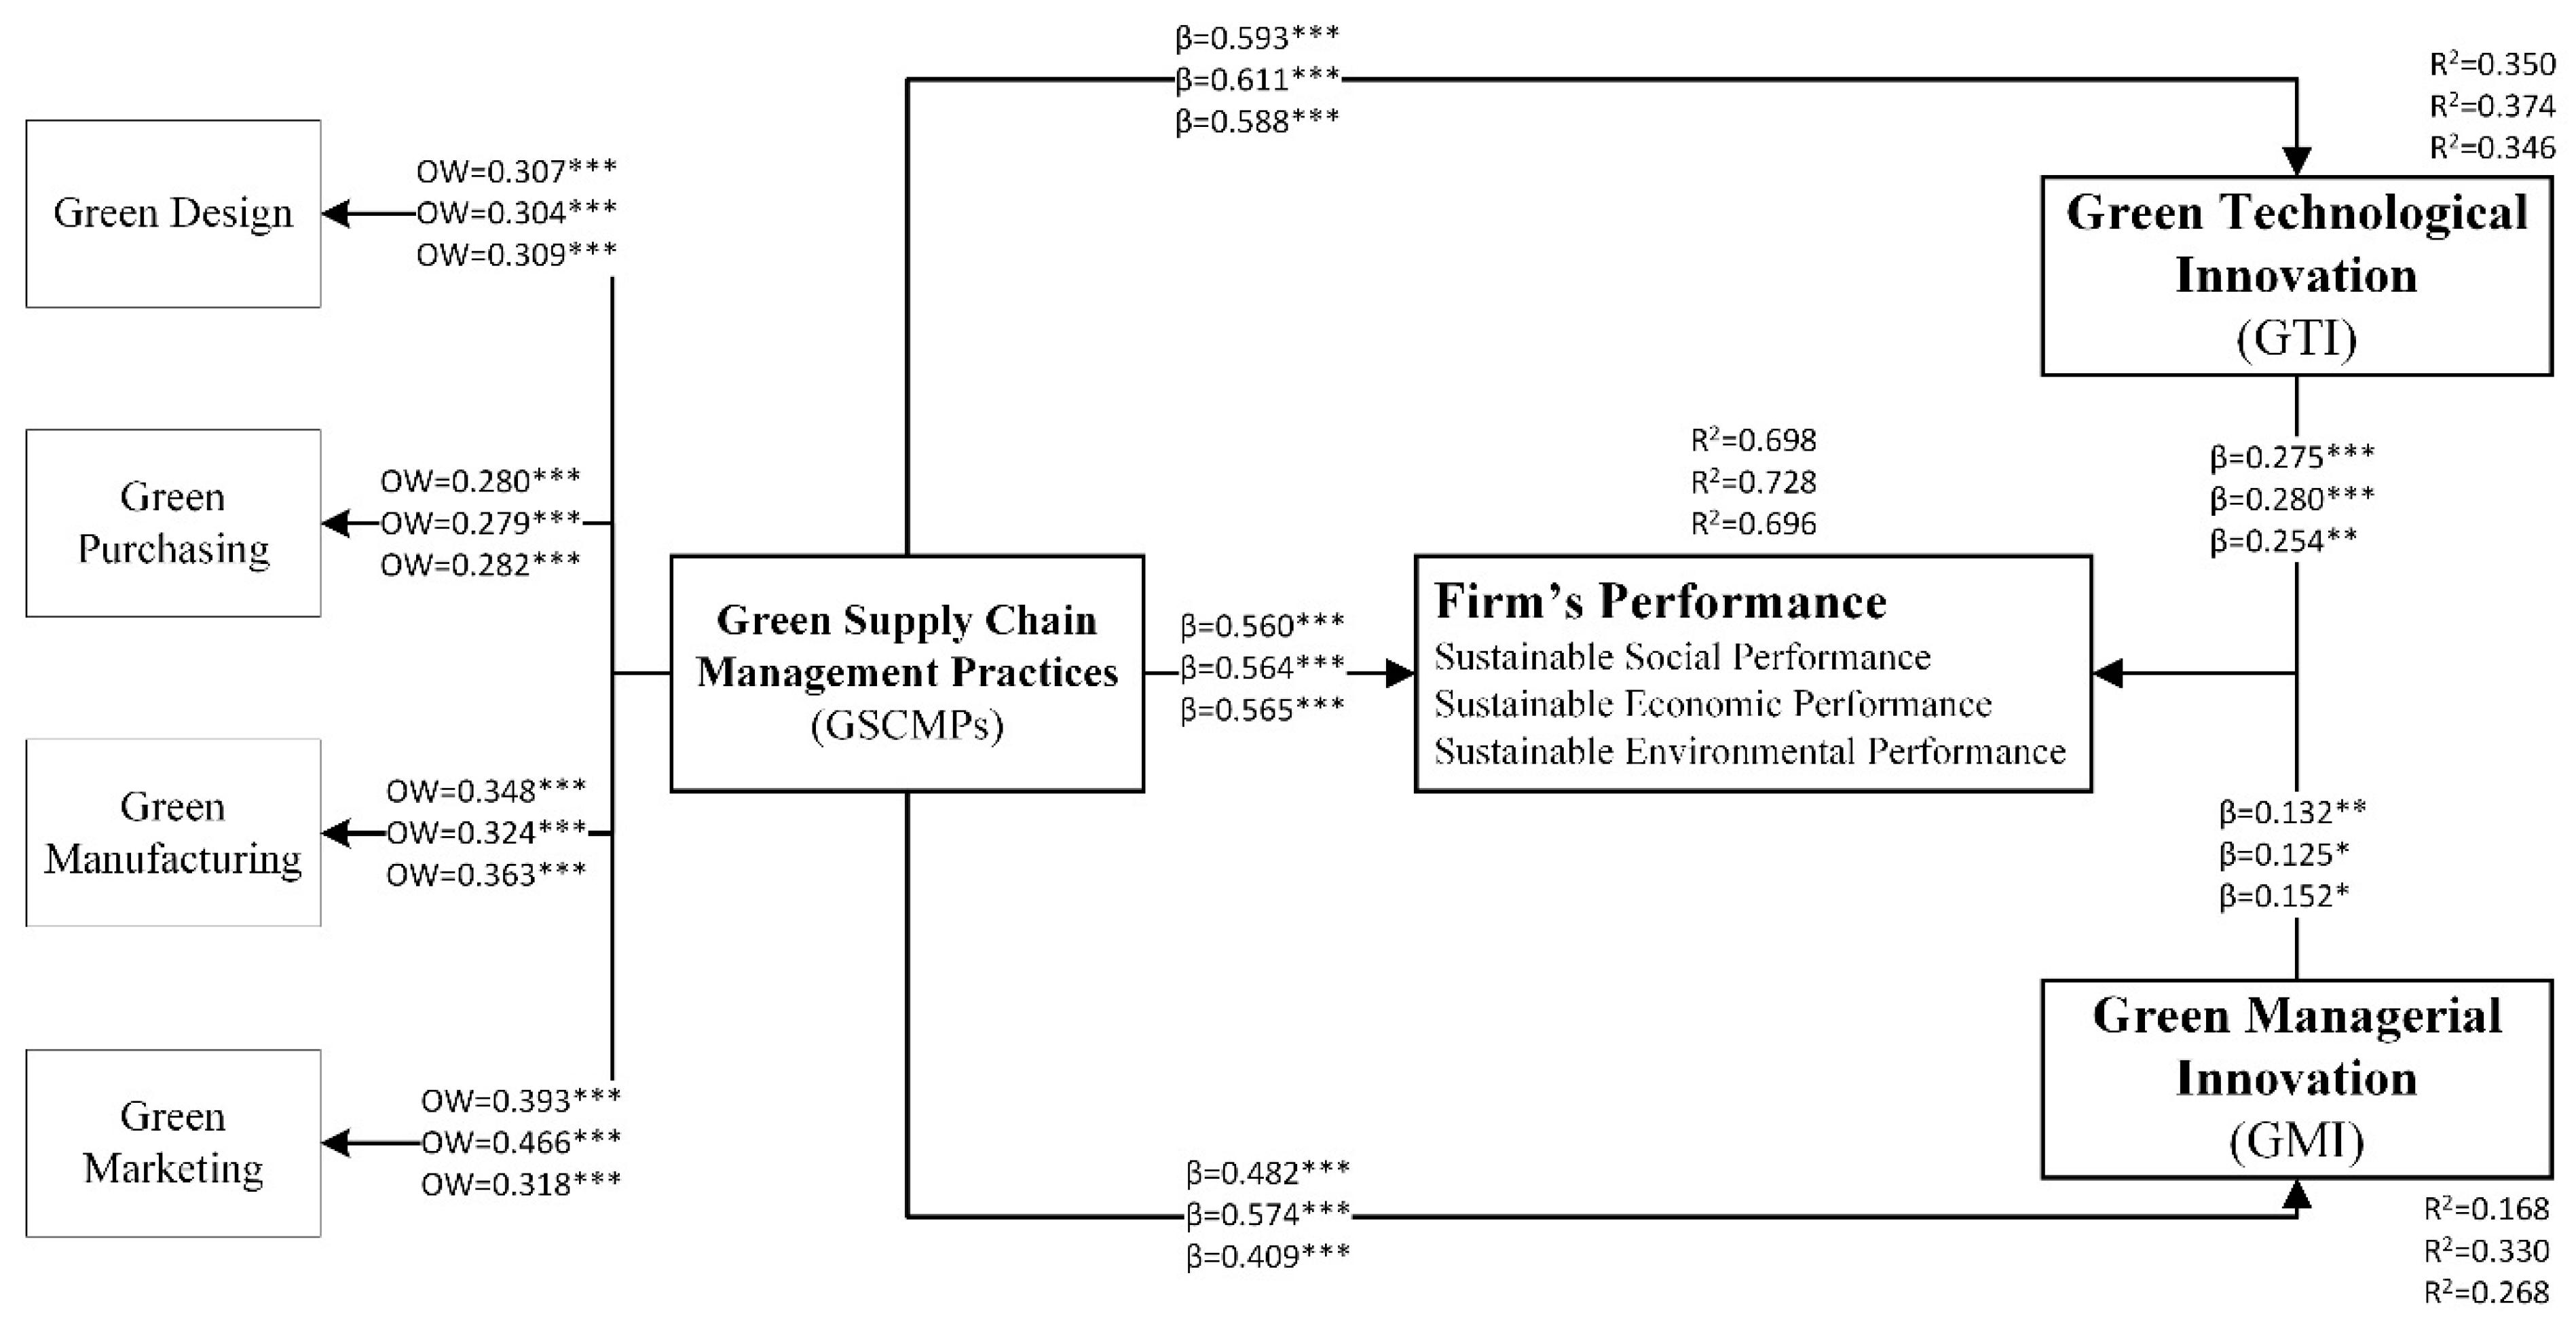
4. Data Analysis Results

The measurement model evaluation results confirm the reliability and validity of all constructs across the complete sample, as well as the manufacturing and services industries. The outer loadings (λ) for all items exceed the recommended threshold of 0.70 [77], demonstrating a strong indicator reliability. Internal consistency reliability is supported, as the Cronbach’s alpha (Cα) and composite reliability (CR) values for all constructs surpass the minimum threshold of 0.70. Convergent validity is established, with the average variance extracted (AVE) for all constructs exceeding the threshold of 0.50, indicating that the constructs explain more than 50% of the variance of their indicators. Additionally, we employ the variance inflation factor (VIF) analysis to check for multicollinearity, with all VIF values being below the threshold of three, confirming no multicollinearity issues (presented in Table 4).
The measurement model meets the requirements for discriminant validity based on both the Fornell–Larcker criterion and the Heterotrait–Monotrait (HTMT) ratio. This means that the study’s constructs are actually different from each other. To meet the Fornell–Larcker standard, the square root of the AVE for each construct must be higher than its correlations with all other constructs. This proves that the discriminant validity at the latent variable level is true [78]. Similarly, the HTMT ratios for all construct pairs are well below the recommended threshold of 0.85, further establishing discriminant validity and addressing potential concerns about construct overlap [79,80]. The results in Table 5 provide strong evidence that the constructs are unique and measure distinct theoretical concepts, supporting the reliability and validity of the measurement model in both the manufacturing and services industry contexts.
The second-order construct validity results confirm the robustness of the measurement model across the complete sample and both industry groups (manufacturing and services). All outer weights are significant (p < 0.001), with high t-values across the complete sample, the manufacturing industry, and the services industry, indicating the strong contribution of the first-order constructs to the second-order constructs. The VIF values for all indicators across the groups are below the threshold of three, suggesting no issues with multicollinearity. Additionally, the outer weights remain stable across the manufacturing and services industries, indicating consistent indicator relevance to the second-order construct in both contexts. The results provided in the Table 6 present strong support for the validity and reliability of the second-order constructs, establishing their applicability for MGA in this study.
The results in Table 7 indicate a strong predictive accuracy for the model across the complete dataset, manufacturing industry, and service industry groups using the criteria of Chicco et al. [70]. Firm sustainable performance has a high R-square value of 0.698 for the whole dataset. The manufacturing group has a slightly higher predictive power (R-square = 0.728) than the services group (R-square = 0.698), which means that the manufacturing group has a better model fit. GMI exhibits a moderate R-square of 0.168 in the complete dataset, but shows a substantially higher predictive accuracy in the manufacturing group (R-square = 0.33), reflecting the industry’s reliance on managerial practices for sustainability. GTI demonstrates a consistent predictive accuracy across all groups, with R-squares ranging from 0.35 to 0.374, highlighting its importance across both industries. The Q-square values further validate the model’s predictive relevance, particularly for firm sustainable performance and GTI.
To strengthen the validity of the results, bootstrapping with 5000 resamples was conducted, ensuring robust coefficient estimation and standard errors. Effect sizes (f2) were computed to evaluate the relative impacts of exogenous variables. The results of the structural model demonstrated significant direct effects across all hypothesized relationships. GSCMPs positively influence both GTI (β = 0.593, p < 0.001) and GMI (β = 0.482, p < 0.001), with slightly stronger effects observed in Group 1 (manufacturing industry) compared to Group 2 (services industry). GSCMPs also have a direct positive impact on firm sustainable performance (β = 0.560, p < 0.001) in both groups, with nearly identical effects. Additionally, both GTI (β = 0.275, p < 0.001) and GMI (β = 0.132, p = 0.002) significantly enhance firm sustainable performance, although the effect of GMI is weaker and marginally non-significant in the manufacturing industry (p = 0.059). These results are presented in Figure 2 and Table 8 and support all hypothesized direct relationships, confirming the importance of GSCMPs and green innovations in driving sustainability outcomes.
The mediating effect analysis reveals that both GTI and GMI partially mediate the relationship between GSCMPs and firm sustainable performance. The mediation via GTI (β = 0.163, p < 0.001) is stronger and significant in both the manufacturing (β = 0.171, p < 0.001) and services industries (β = 0.149, p = 0.003). Mediation via GMI is comparatively weaker (β = 0.064, p = 0.004) but significant overall in the services industry (p = 0.035), while it is marginally significant in the manufacturing industry (p = 0.05). These findings are presented in Figure 3 and Table 9 and highlight the critical role of green innovations, particularly technological innovations, as mechanisms through which GSCMPs enhance sustainable performance.
The moderating analysis results presented in Figure 4 and Table 10 indicate that GOC significantly strengthens the impact of GSCMPs on firm sustainable performance (β = 0.080, p = 0.042). This moderating effect is more pronounced in the manufacturing industry (β = 0.510, p = 0.038) than in the services industry (β = 0.081, p = 0.024), suggesting that a strong GOC enhances the effectiveness of GSCMPs in driving sustainability, particularly in the manufacturing sector. These results presented in Figure 5 underscore the importance of fostering a supportive green culture within organizations to maximize the benefits of green supply chain practices.
To further validate our findings, we conducted robustness checks by performing split-sample analysis across industry types. The results remained consistent, reinforcing the stability of our model. To examine industry differences, a Multi-Group Analysis (MGA) was performed, comparing the results between the manufacturing and service industries. The results of the PLS-MGA analysis revealed limited significant differences between the manufacturing and services industries in the hypothesized relationships. Among the direct effects, the impact of GSCMPs on GMI showed a marginally significant difference (difference = 0.165, p = 0.047, one-tailed), with the effect being stronger in the manufacturing industry. However, no significant differences were observed for other direct relationships, such as GSCMPs → GTI (difference = 0.023, p = 0.388, one-tailed) and GSCMPs → firm sustainable performance (difference = −0.002, p = 0.506, one-tailed). Similarly, mediating effects via GTI (difference = 0.022, p = 0.367, one-tailed) and GMI (difference = 0.090, p = 0.427, one-tailed) did not differ significantly between groups. The moderating effect of GOC on the relationship between GSCMPs and firm sustainable performance also showed no significant variation between industries (difference = 0.030, p = 0.637, one-tailed). These findings, as presented in Table 11, suggest that, while GSCMPs and green innovations are critical across both industries, their relative effects and interactions remain largely consistent, with the exception of GMI, which is more strongly influenced by GSCMPs in the manufacturing industry.
The MICOM procedure further confirmed measurement invariance for the constructs across the manufacturing and services industries, ensuring valid comparisons between the two groups. MICOM involves three stages. In step 1, it is ensured that the measurement model is structurally identical across groups (e.g., the same items load onto the same constructs in both manufacturing and services). Step 2 tests whether the construct scores are similar across groups. For this, we used permutation testing to compare the correlation between composite scores (ρ), as follows:
ρ ( c ( M ) , c ( S ) ) 5 %   quantile   of   permuted   correlations c ( M ) , c ( S ) : C o m p o s i t e   s c o r e s   f o r   m a n u f a c t u r i n g   a n d s e r v i c e s   g r o u p s
The results represent that all constructs achieved compositional invariance, as the original correlations exceeded the 5% quantile thresholds and the permutation p-values were greater than 0.05. In Step 3, the equality of means (μ) and variances (σ2) are ensured across groups. To compare group specific means, we used the following:
( μ ( M ) , μ ( S ) ) : | μ ( M ) μ ( S ) | Δ μ t h r e s h o l d
Δ μ t h r e s h o l d is the maximum allowable difference (typically 0.1 or 0.2). Furthermore, to compare the results of group-specific variance ( σ 2 ) , we used the following:
( σ 2 ) : | σ 2 ( M ) σ 2 ( S ) | Δ σ t h r e s h o l d 2
The results presented in Table 12 indicate that all constructs achieved compositional invariance, as the original correlations exceeded the 5% quantile thresholds and the permutation p-values were greater than 0.05. In Step 3, the equality of means was satisfied for all constructs, with differences lying within the 2.5% and 97.5% quantile ranges and non-significant permutation p-values. However, GMI did not achieve equality of variances, as its permutation p-value (0.022) fell below the 0.05 threshold. This indicates variability in GMI responses between the manufacturing and services industries, potentially reflecting industry-specific differences in managerial innovation practices. Despite this, the results establish at least partial measurement invariance for all constructs, allowing for valid group comparisons and meaningful MGA.
Importance-performance map analysis (IPMA), also known as impact-performance map analysis, is a technique used to compare the importance and performance of different constructs or indicators. The main objective of IPMA is to extend standard path modeling by evaluating both the importance (total effects) and performance (mean scores) of latent variables or indicators. It helps in identifying areas where managerial actions should be prioritized. The importance of a construct or indicator is derived from the total effects in the PLS-SEM path model. Let η be a latent endogenous variable and ξ be a latent exogenous variable. The total effect of ξ on η is the sum of direct and indirect effects, as follows:
T E ξ η = D E ξ η + m = 1 M   ( I E ξ η m η )
The performance of a construct is typically measured using the mean scores of its indicators or latent variable scores. For a given latent variable ξ, its performance score is calculated as follows:
P ξ = 1 N i = 1 N   X i
The importance-performance map analysis (IPMA) results (presented in Table 13) highlight the relative impact and effectiveness of key constructs in driving firm sustainable performance across the complete dataset, manufacturing, and service industries. GSCMPs emerge as the most influential factor, with the highest total effects across all groups (complete: 0.787, manufacturing: 0.807, services: 0.777) and strong performance values, indicating their critical role in sustainability. GTI also plays a significant role, showing a consistently high performance and substantial total effects, reinforcing its importance in both industries. GMI has a lower total effect (complete: 0.132), but it is more impactful in the service industry (0.152) than in manufacturing (0.125), suggesting that managerial practices contribute more significantly to sustainability outcomes in service firms. Green organizational culture, while having the lowest total effect (complete: 0.072), still demonstrates a strong performance (71.898), especially in the service industry (0.106 total effect), indicating that a sustainability-driven organizational culture plays a more vital role in services compared to manufacturing. These findings suggest that firms should prioritize GSCMPs and GTI while enhancing GMI in services and strengthening GOC in both sectors to maximize sustainability outcomes.

5. Discussion

Our findings demonstrate that GSCMPs are pivotal in driving firm sustainability through their influence on green innovations and organizational culture within the manufacturing and service industries. This study adds to earlier research [3,69,81] on sustainable supply chains by showing that GTI and GMI do play mediating roles and that GOC has a moderating effect. Using GSCMPs has important direct and indirect effects that show that they improve environmental, economic, and social performance. This helps to solve important sustainability problems in industries that use a lot of resources and have a big effect on the environment.
This study contributes to the growing body of literature on green supply chain management by offering new insights into industry-specific dynamics. Previous research like [63,82] has established the importance of GSCMPs in promoting sustainability. Our study differentiates between the manufacturing and service industries, demonstrating that, while the direct impacts of GSCMPs are consistent across industries, the effects on GMI are more pronounced in the manufacturing industry. This is likely due to its stricter regulatory environment and greater reliance on managerial practices for sustainability outcomes. Additionally, the service industry, with its emphasis on energy efficiency and process optimization, benefits more significantly from GTI. These findings align with recent work by Chen et al. and Harfouche et al. [83,84], which emphasize the role of technological and managerial innovations as critical enablers of sustainability.
The study provides several findings supporting the RBV [20] and dynamic capabilities theory [22]. This shows that GTI and GMI play a part in connecting GSCMPs to long-term firm sustainable performance. These findings suggest that firms must strategically invest in both technological and managerial innovations to maximize the benefits of green supply chain practices. Second, the moderating role of GOC highlights the importance of cultivating a sustainability-oriented organizational culture, which amplifies the effectiveness of GSCMPs. The moderating effect of GOC is weak. This may indicate that, while organizational culture plays a role in sustainability adoption, external factors such as government policies and competitive pressures have a stronger influence. This finding highlights the need for a multi-faceted approach to sustainability, combining internal cultural initiatives with external regulatory support. This finding is particularly relevant for the manufacturing and service industries, where cultural alignment is essential for embedding sustainability into core operations. These results echo calls in the recent literature [70,85] for integrating organizational culture into sustainability frameworks.
Using advanced statistical methods like PLS-MGA and second-order constructs, this study provides a model that can be used to look at the effects of GSCMPs in different industries and locations. By accounting for cultural and industry-specific variations, the study provides a robust framework that future research can build upon. To strengthen industry-specific insights, we explored key sub-sectors within the manufacturing (textiles and pharmaceuticals) and services (logistics and IT) industries. Findings suggest that regulatory pressures and resource constraints differ significantly across sub-sectors, affecting the adoption rate and impact of green innovations. Future studies should investigate these sectoral differences in greater depth. Furthermore, the multi-group analysis (MGA) of our research provides industry-specific insights but does not yield significant differences. This suggests that, while industry context plays a role, the fundamental relationships between GSCMPs and sustainability performance remain robust across manufacturing and service sectors. Future research should explore additional moderating factors, such as firm size and regulatory environment, to uncover nuanced differences.
The findings from MICOM, MGA, and IPMA highlight key differences in how green supply chain practices impact sustainability in the manufacturing versus service industries. Manufacturing firms benefit more from GTI, as they rely heavily on energy-efficient production, resource optimization, and compliance with environmental regulations. The higher total effects and performance scores of GTI in manufacturing indicate that technological advancements directly enhance environmental and economic sustainability in this sector. In contrast, service firms experience greater benefits from GMI, as process optimization, stakeholder collaboration, and managerial decision making primarily drive sustainability in services, rather than direct technological interventions. The stronger impact of GOC in services also suggests that fostering a sustainability-oriented culture is crucial for improving social and environmental performance in industries that rely on human capital and service delivery.
As the global focus on sustainability intensifies, there is an urgent need for interdisciplinary research to tackle complex challenges in supply chain management. Future investigations should explore how external factors, such as market competition, regulatory policies, and consumer behavior, interact with internal capabilities like GSCMPs and green innovations. Additionally, advancements in digital technologies present opportunities for the real-time monitoring and optimization of sustainability metrics, enabling firms to dynamically adapt to evolving environmental challenges. This research highlights the necessity of integrating technological, managerial, and cultural dimensions to achieve comprehensive sustainability outcomes. While green supply chain management practices are widely acknowledged for their sustainability benefits, their effectiveness is often contingent on external factors such as technological advancements. For instance, the lack of financial incentives and high initial costs serve as key barriers to green innovation adoption in Pakistan. Future policies must address these gaps to facilitate industry-wide sustainability transformations.

6. Theoretical Contributions

This study makes several theoretical advancements in the field of green supply chain management and sustainability. First, it extends the RBV by demonstrating how firms can achieve competitive advantages through GSCMPs, particularly by leveraging GTI and GMI as key resources. Unlike previous studies that focus on static resource accumulation, this study incorporates dynamic capabilities theory, highlighting how firms must continuously develop sustainability-driven capabilities to adapt to environmental regulations and shifting consumer expectations. Second, this research introduces GOC as a moderating factor, offering a fresh perspective on how cultural alignment strengthens the impact of GSCMPs on sustainability outcomes. Third, this study contributes to Institutional Theory by providing empirical evidence on how regulatory pressures, stakeholder expectations, and industry-specific conditions shape sustainability practices, particularly in low- and middle-income economies like Pakistan. Finally, our findings emphasize the importance of integrating green innovations into long-term corporate strategies. With rapid technological advancements, firms must remain agile in adapting to emerging trends such as blockchain-enabled supply chains, artificial intelligence-driven energy efficiency, and circular economy models. Additionally, balancing green technological innovation (GTI) and green managerial innovation (GMI) is crucial, as GTI has a stronger impact on sustainability in manufacturing. Future research should explore why this discrepancy exists and how firms can optimize both types of innovation for enhanced sustainability outcomes.

7. Practical and Managerial Implications

The findings of this study offer critical implications for managers, industry practitioners, and policymakers. First, firms must prioritize GSCMPs as a strategic imperative rather than merely a compliance requirement. The results confirm that companies implementing green supply chain strategies achieve a superior economic, social, and environmental performance, thereby securing long-term resilience and market leadership. Second, investments in GTI and GMI are essential to maximize the benefits of GSCMPs. Manufacturing firms should focus on adopting energy-efficient production technologies, while service firms can leverage digital innovations to optimize supply chain sustainability. Third, fostering a sustainability-driven organizational culture (GOC) is crucial for reinforcing green supply chain practices. To deeply embed sustainability across all levels of the organization, managers should implement sustainability training, incentives, and leadership commitment. Lastly, policymakers must develop sector-specific sustainability guidelines and financial incentives to encourage firms to integrate green innovations and adopt best practices. In the manufacturing sector, mandatory energy efficiency standards should be introduced, grants for the research and development (R&D) of green technologies should be provided, and eco-certification programs should be enforced to promote sustainable production. In the service sector, digital transformation incentives such as tax credits for cloud-based sustainable logistics and mandatory sustainability reporting for IT and service firms should be implemented. Additionally, governments should support sustainability adoption through tax breaks for carbon footprint reduction, low-interest green loans for energy-efficient technologies, and subsidies for firms implementing waste reduction strategies. Regulatory bodies should also develop public–private partnerships to drive sustainability programs and introduce circular economy frameworks that support resource optimization across industries.
To provide practical guidance, this study proposes a three-phase implementation model for sustainability adoption. In Phase 1 (short-term, 0–2 years), organizations should adopt basic green procurement policies, implement energy-efficient processes, and initiate carbon footprint reduction strategies. In Phase 2 (mid-term, 3–5 years), firms should integrate advanced green technological innovations, AI-driven sustainability solutions, and obtain sustainability certifications. Finally, in Phase 3 (long-term, 5+ years), the transition should focus on a full-scale shift towards a circular economy model, AI-driven automation, and government-regulated sustainability standards. Financial barriers often hinder sustainability adoption, making cost considerations an essential aspect of policy implementation. To address these constraints, governments should introduce tax incentives for companies investing in renewable energy and low-carbon technologies. Additionally, government-backed low-interest loans should be made available for sustainability-focused projects, while subsidies should be provided to small and medium enterprises (SMEs) adopting green supply chain practices. By aligning regulatory frameworks with industry needs, governments can drive broader sustainability adoption across diverse industrial sectors, positioning firms for competitive success in global markets.

8. Conclusions

In conclusion, this research provides valuable insights into the role of GSCMPs in enhancing firm sustainability performance, with a focus on the manufacturing and service industries in Pakistan. The findings demonstrate that GSCMPs significantly improve environmental, social, and economic outcomes through the mediating effects of GTI and GMI. Additionally, the presence of GOC amplifies these effects, emphasizing the importance of fostering a sustainability-oriented organizational culture. This study highlights the need for industry-specific strategies to integrate sustainable practices into supply chain processes, particularly in resource-intensive and service-oriented sectors. Beyond these findings, the broader implications underscore the necessity of investing in green innovations and organizational culture to achieve sustainability goals. The research contributes theoretical frameworks and empirical evidence, offering actionable insights for practitioners and policymakers to design effective sustainability strategies. This study contributes to the field of sustainable supply chain management by addressing external validity concerns, strengthening conceptual foundations, and providing actionable insights for practitioners. Future research should explore the integration of emerging technologies, such as artificial intelligence and blockchain, into GSCMPs to further enhance their effectiveness. This study calls for a collaborative effort among firms, regulators, and consumers to prioritize sustainable supply chains and contribute to a sustainable future.

9. Limitations and Future Work Recommendations

Despite the robustness of these findings, we must acknowledge some limitations. This study relies on cross-sectional data, which limits the ability to establish causal relationships. Future research should adopt longitudinal designs to track the long-term impacts of GSCMPs and green innovations over time. Data collection was based on self-reported measures, which may introduce social desirability bias. Future studies should incorporate multi-source data collection, such as secondary data or expert validation, to enhance validity. Moreover, the study is region-specific to Pakistan, making it less generalizable to economies with different regulatory frameworks, cultural influences, and market structures. Future research should conduct cross-regional comparisons to explore how sustainability adoption varies across diverse economic and institutional environments. External factors such as government policies, financial constraints, and consumer awareness may impact the effectiveness of GSCMPs. Future research should examine these factors in greater detail to provide a more comprehensive understanding of sustainability adoption. Furthermore, the current study focuses on industry-wide trends, but future research should delve deeper into sub-sectoral differences (e.g., textiles, pharmaceuticals, logistics, and IT) to understand industry-specific sustainability challenges and opportunities.

Author Contributions

A.S.M., methodology, validation; Y.Z., data curation, conceptualization; B.S., writing and original draft preparation, formal analysis; R.F.G., resources, supervision. All authors have read and agreed to the published version of the manuscript.

Funding

This research received no external funding.

Institutional Review Board Statement

The study was conducted in accordance with the Declaration of Helsinki, and approved by the Ethics Committee of Business School of Hohai University (Approval Code: HHU-IRB-2024-078, Date: 9 January 2024).

Informed Consent Statement

Informed consent was obtained from all subjects involved in the study.

Data Availability Statement

The datasets used and analyzed during the current study are available from the corresponding author upon reasonable request.

Conflicts of Interest

The authors declare no conflicts of interest.

References

  1. Rapdecho, C.; Aunyawong, W. The relationship among operational efficiency, esg implementation, green supply chain management, and sustainable supply chain performance. In Proceedings of the International Academic Multidisciplinary Research Conference in Fukuoka 2024, Fukuoka, Japan, 22–25 March 2024; pp. 186–193. [Google Scholar]
  2. Alkaraan, F.; Elmarzouky, M.; de Sousa Jabbour, A.B.L.; Jabbour, C.J.C.; Gulko, N. Maximising Sustainable Performance: Integrating Servitisation Innovation into Green Sustainable Supply Chain Management under the Influence of Governance and Industry 4.0. J. Bus. Res. 2025, 186, 115029. [Google Scholar] [CrossRef]
  3. Alkhatib, A.W. Fostering Green Innovation: The Roles of Big Data Analytics Capabilities and Green Supply Chain Integration. Eur. J. Innov. Manag. 2024, 27, 2818–2840. [Google Scholar] [CrossRef]
  4. Iqbal, M.; Ma, J.; Ahmad, N.; Ullah, Z.; Hassan, A. Energy-Efficient Supply Chains in Construction Industry: An Analysis of Critical Success Factors Using ISM-MICMAC Approach. Int. J. Green Energy 2023, 20, 265–283. [Google Scholar] [CrossRef]
  5. Wiredu, J.; Yang, Q.; Sampene, A.K.; Gyamfi, B.A.; Asongu, S.A. The Effect of Green Supply Chain Management Practices on Corporate Environmental Performance: Does Supply Chain Competitive Advantage Matter? Bus. Strategy Environ. 2024, 33, 2578–2599. [Google Scholar] [CrossRef]
  6. Khan, M.; Hamza, F. Impression of Internal and External Green Supply Chain Management Practices on Consumer Purchasing Behavior. J. Future Sustain. 2025, 5, 81–90. [Google Scholar] [CrossRef]
  7. Tian, H.; Pertheban, T.R.; Han, X. Navigating Industrial Performance: Impact of Corporate Social Responsibility on Sustainable Development with Moderation of Reverse Supply Chain Management. Corp. Soc. Responsib. Environ. Manag. 2025, 32, 1346–1357. [Google Scholar] [CrossRef]
  8. García Alcaraz, J.L.; Díaz Reza, J.R.; Arredondo Soto, K.C.; Hernández Escobedo, G.; Happonen, A.; Puig, I.; Vidal, R.; Jiménez Macías, E. Effect of Green Supply Chain Management Practices on Environmental Performance: Case of Mexican Manufacturing Companies. Mathematics 2022, 10, 1877. [Google Scholar] [CrossRef]
  9. Roh, T.; Noh, J.; Oh, Y.; Park, K.-S. Structural Relationships of a Firm’s Green Strategies for Environmental Performance: The Roles of Green Supply Chain Management and Green Marketing Innovation. J. Clean. Prod. 2022, 356, 131877. [Google Scholar] [CrossRef]
  10. Wu, D.; Ding, H.; Wang, W.; Cheng, Y. Green Technology Investment and Supply Chain Coordination Strategies Considering Marketing Efforts and Risk Aversion under Carbon Tax Policy. J. Ind. Manag. Optim. 2025, 21, 418–453. [Google Scholar] [CrossRef]
  11. Taamneh, M.M.; Al-Okaily, M.; Abudoleh, J.D.; Albdareen, R.; Taamneh, A.M. Nexus between Green Human Resource Management Practices and Corporate Social Responsibility: Does Transformational Leadership Make Difference? Int. J. Organ. Anal. 2025, 33, 1–24. [Google Scholar] [CrossRef]
  12. Pham, T.; Luong, T.; Huynh, N. The Impact of Sustainable Supply Chain Management Practices on Environmental Performance of Viet-Namese Agricultural Enterprises. Manag. Sci. Lett. 2025, 15, 71–80. [Google Scholar] [CrossRef]
  13. Wu, G.; Xu, Q.; Niu, X.; Tao, L. How Does Government Policy Improve Green Technology Innovation: An Empirical Study in China. Front. Environ. Sci. 2022, 9, 799794. [Google Scholar] [CrossRef]
  14. Iqbal, M.; Ismail, M.; Ibrahim, M.; Khalil, C.H.; Ahmad, I. Evaluation of International Logistics and Supply Chain Disruption During the COVID-19 Pandemic Through Scientometric Techniques. In Emerging Trends in Sustainable Supply Chain Management and Green Logistics; IGI Global: Hershey, PA, USA, 2023; pp. 15–40. [Google Scholar]
  15. Farrukh Shahzad, M.; Liu, H.; Zahid, H. Industry 4.0 Technologies and Sustainable Performance: Do Green Supply Chain Collaboration, Circular Economy Practices, Technological Readiness and Environmental Dynamism Matter? J. Manuf. Technol. Manag. 2025, 36, 1–22. [Google Scholar] [CrossRef]
  16. Bekele, A.A.; Mahesh, G.; Ingle, P.V. Enhancing SMCs’ Competitiveness through Improving Material Supply Chain Management Practice. Int. J. Constr. Manag. 2025, 25, 77–88. [Google Scholar] [CrossRef]
  17. Sarjana, S.; Najib, M.A.A.; Hanun, J. Digitalization of Supply Chain Technology to Encourage Green Supply Chain. In Proceedings of the E3S Web of Conferences; EDP Sciences: Les Ulis, France, 2024; Volume 577, p. 03005. [Google Scholar]
  18. Bhadoriya, A.; Jani, M.Y.; Chaudhari, U. Combined Effect of Carbon Emission, Exchange Scheme, Trade Credit, and Advertisement Efforts in a Buyer’s Inventory Decision. Process Integr. Optim. Sustain. 2022, 6, 1043–1061. [Google Scholar] [CrossRef]
  19. Ali, S.R.; Hossain, M.A.; Islam, K.M.Z.; Alam, S.M.S. Weaving a Greener Future: The Impact of Green Human Resources Management and Green Supply Chain Management on Sustainable Performance in Bangladesh’s Textile Industry. Clean. Logist. Supply Chain 2024, 10, 100143. [Google Scholar] [CrossRef]
  20. Barney, J.B.; Arikan, A.M. The Resource-based View: Origins and Implications. In The Blackwell Handbook of Strategic Management; Wiley: Hobkon, NJ, USA, 2005; pp. 123–182. [Google Scholar]
  21. Munizu, M.; Alam, S.; Pono, M.; Riyadi, S. Do Digital Marketing, Integrated Supply Chain, and Innovation Capability Affect Competitiveness, and Creative Industry Performance? Int. J. Data Netw. Sci. 2024, 8, 1025–1034. [Google Scholar] [CrossRef]
  22. Correia, R.J.; Teixeira, M.S.; Dias, J.G. Dynamic Capabilities: Antecedents and Implications for Firms’ Performance. Int. J. Product. Perform. Manag. 2022, 71, 3270–3292. [Google Scholar] [CrossRef]
  23. Yuan, B.; Cao, X. Do Corporate Social Responsibility Practices Contribute to Green Innovation? The Mediating Role of Green Dynamic Capability. Technol. Soc. 2022, 68, 101868. [Google Scholar] [CrossRef]
  24. Amenta, E.; Ramsey, K.M. Institutional Theory. In Handbook of Politics: State and Society in Global Perspective; Springer: New York, NY, USA, 2010; pp. 15–39. [Google Scholar]
  25. Rashid, A.; Baloch, N.; Rasheed, R.; Ngah, A.H. Big Data Analytics-Artificial Intelligence and Sustainable Performance through Green Supply Chain Practices in Manufacturing Firms of a Developing Country. J. Sci. Technol. Policy Manag. 2025, 16, 42–67. [Google Scholar] [CrossRef]
  26. Mahapatra, A.S.; Sengupta, S.; Dasgupta, A.; Sarkar, B.; Goswami, R.T. What Is the Impact of Demand Patterns on Integrated Online-Offline and Buy-Online-Pickup in-Store (BOPS) Retail in a Smart Supply Chain Management? J. Retail. Consum. Serv. 2025, 82, 104093. [Google Scholar] [CrossRef]
  27. Fayyaz, A.; Liu, C.; Xu, Y.; Ramzan, S. Effects of Green Human Resource Management, Internal Environmental Management and Developmental Culture between Lean Six Sigma and Operational Performance. Int. J. Lean Six Sigma 2025, 16, 109–140. [Google Scholar] [CrossRef]
  28. Iqbal, M.; Waqas, M.; Ahmad, N.; Hussain, K.; Hussain, J. Green Supply Chain Management as a Pathway to Sustainable Operations in the Post-COVID-19 Era: Investigating Challenges in the Chinese Scenario. Bus. Process Manag. J. 2024, 30, 1065–1087. [Google Scholar] [CrossRef]
  29. Singh, R.K.; Mathiyazhagan, K.; Gunasekaran, A. Advancing towards Sustainable and Net-Zero Supply Chains: A Comprehensive Analysis of Knowledge Capabilities and Industry Dynamism. J. Knowl. Manag. 2025, 29, 148–170. [Google Scholar] [CrossRef]
  30. Gao, J.Q.; Li, D.; Qiao, G.H.; Jia, Q.R.; Li, S.R.; Gao, H.L. Circular Economy Strategies in Supply Chains, Enhancing Resource Efficiency and Sustainable Development Goals. Environ. Sci. Pollut. Res. 2024, 31, 8751–8767. [Google Scholar] [CrossRef] [PubMed]
  31. Kareem, S.; Fehrer, J.A.; Shalpegin, T.; Stringer, C. Navigating Tensions of Sustainable Supply Chains in Times of Multiple Crises: A Systematic Literature Review. Bus Strategy Environ. 2025, 34, 316–337. [Google Scholar] [CrossRef]
  32. Shah, N.H.; Jani, M.Y.; Chaudhari, U. Study of Imperfect Manufacturing System with Preservation Technology Investment under Inflationary Environment for Quadratic Demand: A Reverse Logistic Approach. J. Adv. Manuf. Syst. 2017, 16, 17–34. [Google Scholar] [CrossRef]
  33. Miswanto, M.; Tarigan, S.; Wardhani, S.; Khuan, H.; Rahmadyanti, E.; Jumintono, J.; Ranatarisza, M.; Machmud, M. Investigating the Influence of Financial Literacy and Supply Chain Management on the Financial Performance and Sustainability of SMEs. Uncertain Supply Chain Manag. 2024, 12, 407–416. [Google Scholar] [CrossRef]
  34. Pellegrino, R.; Gaudenzi, B.; Qazi, A. Capturing Key Interdependences among Supply Chain Disruptions and Mitigation Strategies to Enhance Firm Performance. Int. J. Qual. Reliab. Manag. 2025, 42, 254–284. [Google Scholar] [CrossRef]
  35. Jani, M.Y.; Chaudhari, U.; Sarkar, B. How Does an Industry Control a Decision Support System for a Long Time? RAIRO-Oper. Res. 2021, 55, 3141–3152. [Google Scholar] [CrossRef]
  36. Jia, F.; Xu, Y.; Chen, L.; Fernandes, K. Does Supply Chain Concentration Improve Sustainability Performance: The Role of Operational Slack and Information Transparency. Int. J. Oper. Prod. Manag. 2025, 45, 269–300. [Google Scholar] [CrossRef]
  37. Arianpoor, A.; Lamloom, I.T.; Moghaddampoor, B.; Khayoon, H.M.; Zaidan, A.S. The Impact of Managerial Psychological Characteristics on the Supply Chain Management Efficiency. TQM J. 2025, 37, 150–170. [Google Scholar] [CrossRef]
  38. Sahu, A.K.; Sharma, M.; Raut, R.; Gedam, V.V.; Agrawal, N.; Priyadarshinee, P. Effect of Lean-Green Practice and Green Human Resource on Supply Chain Performance: A Resource-Based View. Benchmarking Int. J. 2024, 32, 636–665. [Google Scholar] [CrossRef]
  39. El-Garaihy, W.H.; Farag, T.; Al Shehri, K.; Centobelli, P.; Cerchione, R. Driving Sustainability in Supply Chain Management for a More Inclusive and Responsible Future. Int. J. Product. Perform. Manag. 2024, 73, 43–84. [Google Scholar] [CrossRef]
  40. Mulyani, S.; Basrowi, B. The Effect of Environmentally Oriented Leadership and Public Sector Management Quality on Supply Chain Performance: The Moderating Role of Public Sector Environmental Policy. Uncertain Supply Chain Manag. 2024, 12, 471–480. [Google Scholar] [CrossRef]
  41. Chiang, C.; Chuang, M.-C. Effect of Sustainable Supply Chain Management on Procurement Environmental Performance: A Perspective on Resource Dependence Theory. Sustainability 2024, 16, 586. [Google Scholar] [CrossRef]
  42. Zaman, S.I.; Ali, M.R.; Khan, S.A. Exploring Interrelationships among Barriers and Enablers of Green Procurement for a Sustainable Supply Chain. Int. J. Procure Manag. 2024, 19, 226–252. [Google Scholar] [CrossRef]
  43. Chaudhari, U.; Bhadoriya, A.; Jani, M.Y.; Sarkar, B. A Generalized Payment Policy for Deteriorating Items When Demand Depends on Price, Stock, and Advertisement under Carbon Tax Regulations. Math Comput. Simul. 2023, 207, 556–574. [Google Scholar] [CrossRef]
  44. Al Karim, R.; Kabir, M.R.; Rabiul, M.K.; Kawser, S.; Salam, A. Linking Green Supply Chain Management Practices and Environmental Performance in the Manufacturing Industry: A Hybrid SEM-ANN Approach. Environ. Sci. Pollut. Res. 2024, 31, 13925–13940. [Google Scholar] [CrossRef] [PubMed]
  45. Liao, F.; Hu, Y.; Ye, S. Corporate Social Responsibility and Green Supply Chain Efficiency: Conditioning Effects Based on CEO Narcissism. Humanit Soc. Sci. Commun. 2024, 11, 1. [Google Scholar] [CrossRef]
  46. Lu, H.T.; Li, X.; Yuen, K.F. Digital Transformation as an Enabler of Sustainability Innovation and Performance–Information Processing and Innovation Ambidexterity Perspectives. Technol. Forecast Soc. Chang. 2023, 196, 122860. [Google Scholar] [CrossRef]
  47. Kong, L.; Akbar, M.; Poulova, P. The Role of Environment, Social, and Governance Performance in Shaping Corporate Current and Future Value: The Case of Global Tech Leaders. Sustainability 2023, 15, 13114. [Google Scholar] [CrossRef]
  48. Chavez, R.; Yu, W.; Jajja, M.S.S.; Song, Y.; Nakara, W. The Relationship between Internal Lean Practices and Sustainable Performance: Exploring the Mediating Role of Social Performance. Prod. Plan. Control 2022, 33, 1025–1042. [Google Scholar] [CrossRef]
  49. Sun, X.; El Askary, A.; Meo, M.S.; Hussain, B. Green Transformational Leadership and Environmental Performance in Small and Medium Enterprises. Econ. Res.-Ekon. Istraživanja 2022, 35, 5273–5291. [Google Scholar] [CrossRef]
  50. Kiet, H.V.T.T.; Sang, M.V.; Truc, T.B.; Lan, T.K.N.; Dinh, H.Q.; Dao, P.T.B. Impact of Green Supply Chain Management on Social Performance through Economic Undergraduate’s View. J. Infrastruct. Policy Dev. 2024, 8, 3075. [Google Scholar] [CrossRef]
  51. Feng, Y.; Akram, R.; Hieu, V.M.; Tien, N.H. The Impact of Corporate Social Responsibility on the Sustainable Financial Performance of Italian Firms: Mediating Role of Firm Reputation. Econ. Res.-Ekon. Istraživanja 2022, 35, 4740–4758. [Google Scholar] [CrossRef]
  52. Jan, A.; Salameh, A.A.; Rahman, H.U.; Alasiri, M.M. Can Blockchain Technologies Enhance Environmental Sustainable Development Goals Performance in Manufacturing Firms? Potential Mediation of Green Supply Chain Management Practices. Bus. Strategy Environ. 2024, 33, 2004–2019. [Google Scholar] [CrossRef]
  53. Baah, C.; Agyabeng-Mensah, Y.; Afum, E.; Lascano Armas, J.A. Exploring Corporate Environmental Ethics and Green Creativity as Antecedents of Green Competitive Advantage, Sustainable Production and Financial Performance: Empirical Evidence from Manufacturing Firms. Benchmarking Int. J. 2024, 31, 990–1008. [Google Scholar] [CrossRef]
  54. Noja, G.G.; Cristea, M.; Panait, M.; Trif, S.M.; Ponea, C. Ștefan The Impact of Energy Innovations and Environmental Performance on the Sustainable Development of the EU Countries in a Globalized Digital Economy. Front. Environ. Sci. 2022, 10, 934404. [Google Scholar] [CrossRef]
  55. Zhang, D.; Shi, L.; Liu, G. Supply Chain in Transition Navigating Economic Growth and Environmental Sustainability through Education. Environ. Sci. Pollut. Res. 2024, 31, 12321–12339. [Google Scholar] [CrossRef]
  56. Liao, F.; Hu, Y.; Chen, M.; Xu, S. Digital Transformation and Corporate Green Supply Chain Efficiency: Evidence from China. Econ. Anal. Policy 2024, 81, 195–207. [Google Scholar] [CrossRef]
  57. Jum’a, L.; Alkalha, Z.; Alaraj, M. Towards Environmental Sustainability: The Nexus between Green Supply Chain Management, Total Quality Management, and Environmental Management Practices. Int. J. Qual. Reliab. Manag. 2024, 41, 1209–1234. [Google Scholar] [CrossRef]
  58. Ardini, L.; Fahlevi, M. Circular Economy from an Environmental Accounting Perspective: Strengthening Firm Performance through Green Supply Chain Management and Import Regulation in Indonesia’s Plastic Recycling Industry. Uncertain Supply Chain Manag. 2024, 12, 1633–1646. [Google Scholar] [CrossRef]
  59. Nazir, S.; Zhaolei, L.; Mehmood, S.; Nazir, Z. Impact of Green Supply Chain Management Practices on the Environmental Performance of Manufacturing Firms Considering Institutional Pressure as a Moderator. Sustainability 2024, 16, 2278. [Google Scholar] [CrossRef]
  60. Galdos-Urbizu, L.; Zubeltzu-Jaka, E.; Erauskin-Tolosa, A.; Etxeberria, I.A. The Impact of Green Supply Chain Management on Corporate Environmental Performance and the Moderating Roles: A Meta-analysis. Bus. Strategy Dev. 2024, 7, e351. [Google Scholar] [CrossRef]
  61. Manigandan, P.; Alam, M.S.; Murshed, M.; Ozturk, I.; Altuntas, S.; Alam, M.M. Promoting Sustainable Economic Growth through Natural Resources Management, Green Innovations, Environmental Policy Deployment, and Financial Development: Fresh Evidence from India. Resour. Policy 2024, 90, 104681. [Google Scholar] [CrossRef]
  62. Li, X.; He, J. Mechanism of the Green Supply Chain Profit of Building Materials Considering the Duopoly Competition Model and Consumer Green Preference. Int. J. Syst. Sci. Oper. Logist. 2024, 11, 2311283. [Google Scholar] [CrossRef]
  63. Aunyawong, W.; Waiyawuththanapoom, P.; Thitart, P.; Kerdpitak, C.; Vaiyavuth, R.; Sritapanya, K.; Shaharudin, M. The Effect of Green Supply Chain Management Practices on Performances of Herb Manufacturers in Thailand. Uncertain Supply Chain Manag. 2024, 12, 417–424. [Google Scholar] [CrossRef]
  64. Visamitanan, K.; Assarut, N. Impact of Green Supply Chain Management Practices on Employee Engagement and Organizational Commitment: Mediating Role of Firm Performance. Glob. Bus. Rev. 2024, 25, 1336–1355. [Google Scholar] [CrossRef]
  65. Miar, M.; Rizani, A.; Pardede, R.; Basrowi, B. Analysis of the Effects of Capital Expenditure and Supply Chain on Economic Growth and Their Implications on the Community Welfare of Districts and Cities in Central Kalimantan Province. Uncertain Supply Chain Manag. 2024, 12, 489–504. [Google Scholar] [CrossRef]
  66. Alexandro, R.; Basrowi, B. The Influence of Macroeconomic Infrastructure on Supply Chain Smoothness and National Competitiveness and Its Implications on a Country’s Economic Growth: Evidence from BRICS Countries. Uncertain Supply Chain Manag. 2024, 12, 167–180. [Google Scholar] [CrossRef]
  67. Hebaz, A.; Oulfarsi, S.; Eddine, A.S. Prioritizing Institutional Pressures, Green Supply Chain Management Practices for Corporate Sustainable Performance Using Best Worst Method. Clean. Logist. Supply Chain 2024, 10, 100146. [Google Scholar] [CrossRef]
  68. Khan, T.; Emon, M.M.H.; Siam, S.A.J. Impact of Green Supply Chain Practices on Sustainable Development in Bangladesh. Malays. Bus. Manag. J. 2024, 3, 73–83. [Google Scholar] [CrossRef]
  69. Vargas-Hernández, J.G.; Maillard, C.A.R.; Vargas-González, O.C. Green Organizational Culture, Green Innovation, and Green Performance for Achieving Environmental Sustainability. In Research Anthology on Business Law, Policy, and Social Responsibility; IGI Global: Hershey, PA, USA, 2024; pp. 932–953. [Google Scholar]
  70. Radakovich, P.S. The Relationship Between Organizational Culture, Intrinsic Motivation, and Employee Performance: A Systematic Review and Meta-Analysis; Wayne State University: Detroit, MI, USA, 2016; ISBN 1369434855. [Google Scholar]
  71. Manigandan, R.; Raghuram, J.N.V. Examining the Pathways to Success: Investigating the Mediating Role of Green Innovation in the Relationship between Green Entrepreneurial Orientation, Green Organisational Culture, and Competitive Advantage in the Hotel Industry. Int. J. Work Innov. 2024, 5, 99–121. [Google Scholar] [CrossRef]
  72. Epoh, L.R.; Mafini, C. Green Supply Chain Management in Small and Medium Enterprises: Further Empirical Thoughts from South Africa. J. Transp. Supply Chain Manag. 2018, 12, 495. [Google Scholar] [CrossRef]
  73. Sahoo, S.; Kumar, A.; Upadhyay, A. How Do Green Knowledge Management and Green Technology Innovation Impact Corporate Environmental Performance? Understanding the Role of Green Knowledge Acquisition. Bus. Strategy Environ. 2023, 32, 551–569. [Google Scholar] [CrossRef]
  74. Ma, Y.; Hou, G.; Yin, Q.; Xin, B.; Pan, Y. The Sources of Green Management Innovation: Does Internal Efficiency Demand Pull or External Knowledge Supply Push? J. Clean Prod. 2018, 202, 582–590. [Google Scholar] [CrossRef]
  75. Silva, G.M.; Gomes, P.J.; Sarkis, J. The Role of Innovation in the Implementation of Green Supply Chain Management Practices. Bus. Strategy Environ. 2019, 28, 819–832. [Google Scholar] [CrossRef]
  76. Hair, J.F.; Risher, J.J.; Sarstedt, M.; Ringle, C.M. When to Use and How to Report the Results of PLS-SEM. Eur. Bus. Rev. 2019, 31, 2–24. [Google Scholar] [CrossRef]
  77. Sarstedt, M.; Ringle, C.M.; Hair, J.F. Partial Least Squares Structural Equation Modeling. In Handbook of Market Research; Springer: Berlin/Heidelberg, Germany, 2021; pp. 587–632. [Google Scholar]
  78. Ab Hamid, M.R.; Sami, W.; Sidek, M.H.M. Discriminant Validity Assessment: Use of Fornell & Larcker Criterion versus HTMT Criterion. In Journal of Physics: Conference Series; IOP Publishing: Bristol, UK, 2017; Volume 890, p. 012163. [Google Scholar]
  79. Rasoolimanesh, S.M. Discriminant Validity Assessment in PLS-SEM: A Comprehensive Composite-Based Approach. Data Anal. Perspect. J. 2022, 3, 1–8. [Google Scholar]
  80. Chicco, D.; Warrens, M.J.; Jurman, G. The Coefficient of Determination R-Squared Is More Informative than SMAPE, MAE, MAPE, MSE and RMSE in Regression Analysis Evaluation. PeerJ Comput. Sci. 2021, 7, e623. [Google Scholar] [CrossRef] [PubMed]
  81. Karim, R.A.; Kawser, S.; Rabiul, M.K.; Chowdhury, T.; Murtaza, F.N.Y. Green Supply Chain Management Practices and Environmental Performance in the Healthcare Sector: The Mediating Role of Green Innovation. Glob. Knowl. Mem. Commun. 2024; ahead of print. [Google Scholar] [CrossRef]
  82. Islam, H. Nexus of Economic, Social, and Environmental Factors on Sustainable Development Goals: The Moderating Role of Technological Advancement and Green Innovation. Innov. Green Dev. 2025, 4, 100183. [Google Scholar] [CrossRef]
  83. Harfouche, A.; Merhi, M.I.; Albizri, A.; Dennehy, D.; Thatcher, J.B. Sustainable Development through Technological Innovations and Data Analytics. Inf. Syst. Front. 2025, 26, 1989–1996. [Google Scholar] [CrossRef]
  84. Zada, M.; Khan, S.; Zada, S.; Dhar, B.K. Driving Sustainable Development Through CSR Leadership: Insights Into Organizational Learning and Technological Innovation. Sustain. Dev. 2025, 33, 1–15. [Google Scholar] [CrossRef]
  85. Şengüllendi, M.F.; Bilgetürk, M.; Afacan Fındıklı, M. Ethical Leadership and Green Innovation: The Mediating Role of Green Organizational Culture. J. Environ. Plan. Manag. 2024, 67, 1702–1723. [Google Scholar] [CrossRef]
Figure 1. Conceptual framework.
Sustainability 17 02204 g001
Figure 2. Direct effect results. *: p < 0.05, **: p < 0.01, ***: p < 0.001.
Sustainability 17 02204 g002
Figure 3. Indirect effect results. Dashed Line = Mediating Effect, *: p < 0.05, **: p < 0.01, ***: p < 0.001.
Sustainability 17 02204 g003
Figure 4. Moderating effect results. Dotted Line = Moderating Effect, **: p < 0.01, ***: p < 0.001.
Sustainability 17 02204 g004
Figure 5. Moderating effects.
Sustainability 17 02204 g005
Table 1. Common method bias results.
Total Variance Explained
ComponentInitial EigenvaluesExtraction Sums of
Squared Loadings
Rotation Sums of
Squared Loadings
Total% of
Variance
Cumulative %Total% of
Variance
Cumulative %Total% of
Variance
Cumulative %
112.32631.60431.60412.32631.60431.6044.42311.34011.340
23.1208.00039.6053.1208.00039.6053.4318.79720.137
32.5156.44946.0542.5156.44946.0543.1938.18728.324
42.3225.95552.0092.3225.95552.0092.9617.59135.915
52.0005.12957.1382.0005.12957.1382.9167.47843.393
61.5003.84560.9841.5003.84560.9842.9047.44550.838
Extraction method: Principal Component Analysis.
Table 2. Demographics profile of respondents.
VariablesItemsFrequencyPercentage
GenderMale26855.83%
Female21244.16%
Age30–35 years21745.20%
36–40 years15933.12%
>40 years10421.66%
EducationGraduates9620.00%
Post-Graduate19340.20%
Doctorate11323.54%
Others7816.25%
Experience5–7 years21544.79%
8–10 years17235.83%
>10 years9319.37%
Industry TypeManufacturingTextiles92 (19.16%)
Pharmaceuticals78 (16.25%)
Cements56 (11.66%)
ServicesLogistics95 (19.79%)
IT83 (17.29%)
Healthcare76 (15.83%)
Total 480
Table 3. Description of measurement scale items.
VariablesDescriptionVariable TypeItemsSource
Green Supply Chain Management PracticesIntegration of environmental considerations into supply chain operations, from procurement to delivery.
Green DesigningDeveloping products and processes that prioritize environmental sustainability throughout their lifecycle.Ordinal“4 items using Five-point Likert Scale”[72]
Green PurchasingProcuring eco-friendly raw materials and products from environmentally responsible suppliers.Ordinal“4 items using Five-point Likert Scale”[73]
Green ManufacturingImplementing energy-efficient, waste-minimizing, and eco-friendly production processes.Ordinal“5 items using Five-point Likert Scale”[73]
Green MarketingPromoting sustainability-oriented products and practices to enhance brand reputation and meet consumer expectations.Ordinal“3 items using Five-point Likert Scale”[73]
Green Technological InnovationAdoption of advanced technologies to reduce environmental impact and improve operational efficiency.Ordinal“4 items using Five-point Likert Scale”[74]
Green Managerial InnovationAdoption of innovative managerial practices and systems to integrate sustainability into organizational strategies.Ordinal“3 items using Five-point Likert Scale”[74]
Green Organizational CultureShared values and practices within a firm that emphasize sustainability and environmental stewardship.Ordinal“4 items using Five-point Likert Scale”[69]
Firm Sustainable PerformanceA firm’s ability to achieve long-term environmental, social, and economic goals.
Environmental Sustainable PerformanceThe reduction in ecological footprints through emissions control, resource conservation, and waste management.Ordinal“4 items using Five-point Likert Scale”[75]
Social Sustainable PerformanceEnhancing stakeholder well-being, including fair labor practices, community development, and ethical engagement.Ordinal“4 items using Five-point Likert Scale”[75]
Economic Sustainable PerformanceAchieving financial gains while adopting cost-effective and sustainable business practices.Ordinal“4 items using Five-point Likert Scale”[75]
Table 4. Measurement model reliability and convergent validity results.
ConstructsItemsCompleteManufacturingServices
λCRAVEVIFλCRAVEVIFλCRAVEVIF
Green DesigningGD10.7990.8380.8910.6721.7050.8190.8690.910.7181.7990.7750.80.8670.6211.699
GD20.8051.7910.8572.3120.7581.52
GD30.8482.590.8772.7780.8052.494
GD40.8252.4430.8342.3330.8122.673
Green PurchasingGP10.7840.8430.8940.681.8880.8190.8640.9070.7092.1450.7340.820.8810.651.69
GP20.8462.3410.8352.3350.8542.373
GP30.8632.2480.8622.3660.872.234
GP40.8031.7540.8512.1540.7591.516
Green ManufacturingGM10.7560.8560.8970.6351.7010.7310.8430.8880.6131.5730.7990.8540.9060.6582.036
GM20.8492.6470.8422.1510.8482.577
GM30.7912.1510.7962.6780.7871.892
GM40.811.7980.7721.6130.8422.141
GM50.7751.6890.771.7260.7781.697
Green MarketingGMKT10.8720.8140.890.7291.9630.8660.8020.8840.7181.9620.8770.8270.8970.7432.001
GMKT20.8792.0450.8812.1160.881.983
GMKT30.8091.5770.7911.4790.8281.731
Green Technological InnovationGTI10.7980.860.9050.7051.7430.7910.8490.8980.6881.8080.8050.8730.9130.7251.853
GTI20.8271.9880.8492.1050.812.031
GTI30.8612.2240.8241.8820.8972.936
GTI40.8712.3950.8522.0860.892.979
Green Managerial InnovationGMI10.8860.8630.9160.7851.4140.8970.8680.9190.7922.5110.8760.8540.9110.7742.123
GMI20.9081.3440.9082.6260.9072.744
GMI30.8631.4960.8641.9690.8561.958
Green Organizational CulturalGOC10.850.8720.910.7161.8420.7560.8280.8830.6541.7120.910.9090.9120.7222.017
GOC20.8372.1750.8371.7150.8222.838
GOC30.8242.6130.8412.5350.7652.91
GOC40.8742.5560.7982.4580.8942.238
Sustainable Environmental PerformanceSENP10.850.8840.920.7422.1930.8520.8730.9120.7232.1610.8480.890.9240.7522.215
SENP20.8422.1180.8391.890.8492.302
SENP30.8992.0430.8812.8530.9062.186
SENP40.8552.4750.8282.2330.8642.645
Sustainable Social PerformanceSSCP10.7870.7960.8670.6211.510.8190.810.8770.6421.7990.7630.7820.8580.6021.395
SSCP20.8282.0860.8772.510.7711.853
SSCP30.82.0210.8232.10.7792.007
SSCP40.7331.3940.721.2760.7911.566
Sustainable Economic PerformanceSECP10.8950.8840.920.7422.6210.8960.8710.9130.7252.70.8930.850.8960.6842.604
SECP20.7981.880.8191.9630.7631.815
SECP30.8452.20.8832.6940.7951.95
SECP40.8191.7790.8031.8980.851.789
Note: λ = factor loadings; Cα = Cronbach’s Alpha; CR = Composite reliability, AVE = Average variance extracted; VIF = variance inflation factor.
Table 5. Discriminant validity.
Discriminant Validity (HTMT Ratios)Discriminant Validity (Fornell–Lacker Criteria)
Complete Sample
GDGMGMIGMKTGOCGPGTISECPSENPSSCP GDGMGMIGMKTGOCGPGTISECPSENPSSCP
GD GD0.82
GM0.428 GM0.3620.797
GMI0.3910.389 GMI0.3410.3420.886
GMKT0.5020.5440.536 GMKT0.420.4630.4470.854
GOC0.0960.0740.0670.089 GOC0.0810.0220.0190.0640.846
GP0.2950.6770.3440.5030.067 GP0.250.5790.2960.4150.0190.824
GTI0.4990.5530.5980.5860.0790.425 GTI0.430.4770.5180.4920.0540.3630.84
SECP0.4560.6090.4210.7890.060.4420.635 SECP0.3980.5360.3650.6680.0290.3810.5520.84
SENP0.5260.5510.4870.4840.10.470.6050.373 SENP0.4550.4820.4260.4130.090.4070.530.3310.862
SSCP0.4560.5380.620.7120.1010.4920.6050.5710.674 SSCP0.3810.4590.5160.5770.0780.4130.5130.4780.5750.788
Manufacturing Industry
GDGMGMIGMKTGOCGPGTISECPSENPSSCP GDGMGMIGMKTGOCGPGTISECPSENPSSCP
GD GD0.847
GM0.292 GM0.2510.783
GMI0.4020.385 GMI0.3560.3430.89
GMKT0.4820.5140.667 GMKT0.4110.4340.5540.847
GOC0.1460.10.1280.112 GOC0.110.0310.0680.0630.809
GP0.1640.5950.3970.4230.064 GP0.1470.5110.3480.3540.0210.842
GTI0.5270.4730.6120.6730.080.329 GTI0.4560.4080.5290.560.050.2840.829
SECP0.4420.4690.530.7950.1070.3560.762 SECP0.3890.4190.4630.6710.0080.3150.6590.851
SENP0.4230.4870.480.5720.1670.4910.4870.312 SENP0.3730.4230.4250.4870.1580.4330.4230.280.85
SSCP0.3010.5180.6340.7570.1260.4670.5990.4710.685 SSCP0.2550.4430.5330.6140.10.4010.50.4060.5820.801
Services Industry
GDGMGMIGMKTGOCGPGTISECPSENPSSCP GDGMGMIGMKTGOCGPGTISECPSENPSSCP
GD GD0.788
GM0.581 GM0.4840.811
GMI0.3870.411 GMI0.3380.3630.88
GMKT0.5260.5760.385 GMKT0.4290.4960.3240.862
GOC0.0850.0610.0820.093 GOC0.0620.0090.0610.0460.85
GP0.4570.7620.2970.5980.112 GP0.370.6480.2510.4890.0210.806
GTI0.4710.6290.5870.4960.1060.533 GTI0.4140.5510.510.4240.0550.4550.852
SECP0.4710.750.2930.780.0580.5370.5 SECP0.4090.6550.2650.6620.0480.4660.4570.827
SENP0.6390.5940.5330.4210.0740.4520.7120.427 SENP0.5480.5270.4680.3630.0860.3840.6320.3920.867
SSCP0.650.560.6070.6640.1270.5330.6090.6780.687 SSCP0.5320.490.50.5390.0810.4370.530.5590.5910.776
Note: All the values are less than 0.85, validating HTMT criteria; diagonal values are the square roots of the AVE (average variance extracted). Under the diagonal elements are the correlations between the constructs.
Table 6. Second-order construct validity.
Second-Order Constructs Overall SampleManufacturing Industry GroupServices Industry Group
Outer-WeightsSTDEVt-Valuep-ValueVIFOuter-WeightsSTDEVt-Valuep-ValueVIFOuter-WeightsSTDEVt-Valuep-ValueVIF
Green Supply Chain Management PracticesGreen Designing0.3070.02910.479***1.2690.3040.0486.369***1.2150.3090.0349.098***1.393
Green Purchasing0.280.02113.145***1.5690.2790.0348.157***1.3950.2820.02710.56***1.842
Green Manufacturing0.3480.0217.367***1.7150.3240.02911.328***1.5160.3630.02812.975***2.025
Green Marketing0.3930.02416.273***1.460.4660.03911.892***1.4450.3180.02612.108***1.5
Firm’s Sustainable PerformanceSustainable Environmental Performance0.3980.02119.37***1.5040.3910.02714.247***1.5170.4050.02814.255***1.549
Sustainable Social Performance0.4180.01724.949***1.7360.4250.02616.426***1.6730.4110.02119.784***1.907
Sustainable Economic Performance0.4330.02219.834***1.3040.4620.03413.599***1.2010.3990.02814.422***1.467
Note: Significance level = ***: p < 0.001.
Table 7. Predictive power of model.
CompleteManufacturing Industry GroupServices Industry Group
R-SquareR-Square AdjustedQ-SquareR-SquareR-Square AdjustedQ-SquareR-SquareR-Square AdjustedQ-Square
Firm Sustainable Performance0.6980.6880.5850.7280.7180.530.6980.6880.585
Green Managerial Innovation0.1680.1630.1530.330.3260.6020.1680.1630.153
Green Technological Innovation0.350.3450.3320.3740.370.3930.350.3450.332
Note: R-Square = Coefficient of determination, Q-Square = Predictive relevance.
Table 8. Direct effect results.
HypothesisCompleteManufacturing Industry GroupServices Industry Group
βSTDEVt-Valuep-ValueF-SquareβSTDEVt-Valuep-ValueF-SquareβSTDEVt-Valuep-ValueF-Square
H1: G T I / G S C P > 0 Green Supply Chain Management Practices → Green Technological Innovation0.5930.04114.5150.0000.5430.6110.05610.88500.5960.5880.05510.6180.0000.530
H2: G M I / G S C P > 0 Green Supply Chain Management Practices → Green Managerial Innovation0.4820.0519.5180.0000.3030.5740.0648.93700.4900.4090.0755.4390.0000.201
H3: F S P / G S C P > 0 Green Supply Chain Management Practices → Firm Sustainable Performance0.560.04512.4580.0000.6310.5640.0619.30300.6220.5650.0727.8690.0000650
H4: F S P / G T I > 0 Green Technological Innovation → Firm Sustainable Performance0.2750.055.4850.0000.1440.280.0614.57200.1660.2540.0833.0620.0020.116
H5: F S P / G M I > 0 Green Managerial Innovation → Firm Sustainable Performance0.1320.0433.0640.0020.0400.1250.0661.8890.0590.0350.1520.0612.4910.0130.053
Note: STDEV = Standard Deviation; β = Path Coefficient.
Table 9. Indirect effect results.
HypothesisCompleteManufacturing Industry GroupServices Industry Group
βSTDEVt-Valuep-ValueβSTDEVt-Valuep-ValueβSTDEVt-Valuep-Value
H6, H7:   F S P / G S C P = ( F S P / G T I ) ( G T I / G S C P ) Green Supply Chain Management Practices → Green Technological Innovation → Firm Sustainable Performance0.1630.0315.19300.1710.0414.16100.1490.0530.003
Green Supply Chain Management Practices → Green Managerial Innovation → Firm Sustainable Performance0.0640.0222.8510.0040.0720.0411.7580.050.0620.0292.1090.035
Note: STDEV = Standard Deviation; β = Path Coefficient.
Table 10. Moderating effect results.
HypothesisCompleteManufacturing Industry GroupServices Industry Group
βSTDEVt-Valuep-ValueβSTDEVt-Valuep-ValueβSTDEVT-Valuep-Value
H 8 :   2 F S P / ( G S C P G O C ) > 0 Green Supply Chain Management Practices * Green Organizational Culture → Firm Sustainable Performance0.080.0392.030.0420.510.0532.070.0380.0810.0691.1750.024
Note: STDEV = Standard Deviation; β = Path Coefficient.
Table 11. Multi-group analysis results.
Difference
(Manufacturing—Services)
One-Tailed (Manufacturing vs. Services) p ValueTwo-Tailed (Manufacturing vs. Services) p Value
Direct Effects
Green Supply Chain Management Practices → Green Technological Innovation0.0230.3880.776
Green Supply Chain Management Practices → Green Managerial Innovation0.1650.0470.095
Green Supply Chain Management Practices → Firm Sustainable Performance−0.0020.5060.988
Green Technological Innovation → Firm Sustainable Performance0.0270.40.799
Green Managerial Innovation → Firm Sustainable Performance−0.0270.6180.763
Mediating Effects
Green Supply Chain Management Practices → Green Technological Innovation → Firm Sustainable Performance0.0220.3670.734
Green Supply Chain Management Practices → Green Managerial Innovation → Firm Sustainable Performance0.090.4270.854
Moderating Effects
Green Supply Chain Management Practices * Green Organizational Culture → Firm Sustainable Performance0.030.6370.726
Table 12. Measurement invariance assessment results.
ConstructCompositional Invariance (c)5% Quantile (Threshold)Permutation
p-Value (Step 2)
Equality of MeanEquality of VarianceMeasurement Invariance Achieved
FSP0.9990.9970.262YesYesFull
GMI10.9970.823YesNoPartial
GOC0.9630.1570.87YesYesFull
GSCMPs0.9950.9920.138YesYesFull
GTI0.9990.9980.428YesYesFull
Table 13. Importance-performance map analysis results.
CompleteManufacturingServices
Total EffectsPerformanceTotal EffectsPerformanceTotal EffectsPerformance
GMI0.13268.1710.12566.6570.15269.567
GOC0.07271.8980.05671.8760.10671.533
GSCMPs0.78774.7440.80775.4140.77774.064
GTI0.27577.1440.2876.9190.25477.345
Disclaimer/Publisher’s Note: The statements, opinions and data contained in all publications are solely those of the individual author(s) and contributor(s) and not of MDPI and/or the editor(s). MDPI and/or the editor(s) disclaim responsibility for any injury to people or property resulting from any ideas, methods, instructions or products referred to in the content.

