1. Introduction
Urban expansion is increasingly recognized as a critical issue in the contemporary world, shaped by rapid population growth, industrialization, and the global shift toward urban living. This ongoing process involves the conversion of natural and agricultural lands into urban areas, resulting in significant environmental, social, and economic consequences. Among these, ecological disruptions are particularly alarming, as urban growth encroaches upon forests, wetlands, and croplands, fragmenting habitats and threatening biodiversity. The effects of urbanization on ecosystem services (ESs) are especially pronounced in arid regions, where fragile ecological balances are particularly susceptible to disruption. For instance, rapid urban expansion in the Yangtze River Delta has significantly reduced terrestrial carbon storage due to the large-scale conversion of fertile croplands and natural ecosystems into built-up areas, impairing carbon sequestration and exacerbating climate change [
1]. Similarly, urban sprawl in Wuhan, China, has resulted in substantial vegetation loss, diminishing the region’s net primary productivity and contributing to further ecological degradation [
2]. In Ethiopia, urban expansion has encroached upon forested regions and croplands, posing serious threats to biodiversity and food security [
3].
Beyond biodiversity loss, urbanization amplifies other ecological challenges, including soil degradation, water pollution, and disruptions to hydrological cycles. The proliferation of impervious surfaces such as roads and buildings diminishes groundwater recharge by obstructing rainwater infiltration, leading to increased surface runoff and heightening the risks of urban flooding. Additionally, urban growth contributes significantly to air pollution due to anthropogenic emissions from industrial and residential sources, increasing concentrations of airborne pollutants such as particulate matter (PM2.5), which pose severe risks to both environmental and public health [
4]. These changes also intensify the urban heat island effect, a phenomenon observed in cities such as Hefei, China, where dense built-up areas trap and retain heat, intensifying local temperatures and imposing additional stress on both human populations and ecosystems while reducing biodiversity [
3].
Urban expansion in developing countries, including Ethiopia and parts of Asia, has further exacerbated food security concerns by converting vast areas of agricultural land into urban settlements, thereby undermining ecological balance and agricultural productivity. The broader implications of urban expansion extend beyond localized environmental changes, influencing critical ecosystem services such as carbon sequestration, water filtration, and soil fertility—essential functions for maintaining ecological stability and human well-being. Studies focusing on urban agglomerations, such as the Shanghai–Hangzhou Bay Urban Agglomeration, have demonstrated that urban sprawl disrupts key ecosystem services, resulting in substantial declines in carbon sequestration, food production, and habitat quality [
5]. Given these challenges, it is essential to assess Saudi Arabia’s urban expansion within a comparative global framework, drawing insights from similarly arid regions to develop informed and sustainable urban development policies.
The nature and trend of rapid urban expansion are shaped by various interrelated factors, primarily driven by population growth, economic development, and changes in land use policies. Population increases in urban areas, often fueled by rural-to-urban migration and natural population growth, have accelerated the demand for housing, infrastructure, and services. Economic activities, particularly in industries and services, tend to concentrate in urban centers, further promoting expansion as individuals and businesses seek opportunities in these areas. For instance, in cities like Mangalore, India, rapid urbanization has led to a 400% increase in built-up land between 1972 and 2018, primarily driven by population growth and economic activity [
6]. Similarly, studies in North America indicate that urban areas are expanding at an unprecedented rate, driven by a combination of economic growth and population density [
7]. Land use policies, including zoning regulations and urban planning strategies, play a pivotal role in directing the growth of cities. In Europe, the spatial delocalization of economic activities and discontinuous settlement expansion have reshaped urban areas, with a significant decline in peri-urban agricultural lands, as observed in the metropolitan region of Rome, Italy [
8].
To better understand and manage urban expansion, various methods have been developed to measure trends and delineate urban areas. Remote sensing and geographic information systems (GISs) are widely used to track changes in land use and land cover over time, providing high-resolution spatial data that enable the detection of sprawl patterns and the quantification of expansion rates [
9,
10,
11]. For example, a study in Lagos, Nigeria, used remote sensing techniques alongside the Cellular Automata–Markov model to analyze urban growth trends, showing a 25% increase in artificial terrain between 2000 and 2020 [
12]. Population density thresholds, often based on census data, are also used to classify urban versus non-urban areas. In Sylhet Sadar, Bangladesh, a Cellular Automata model predicted a 220% increase in urban sprawl from 2020 to 2035 by analyzing population data alongside land-use patterns [
13]. Nighttime light data from satellites, such as those used in China, also offer a proxy for human settlement patterns by capturing the intensity of artificial lighting, showing significant expansion in urban areas, especially in rapidly developing regions [
14].
A key methodological approach in this study is the integration of multiple machine learning (ML) techniques to analyze land-use change. While ML applications in remote sensing and urban studies have expanded, the theoretical basis for combining multiple models remains underexplored. This study integrates algorithms such as Random Forest, artificial neural networks, gradient boosting machine, and convolutional neural networks to enhance classification accuracy, particularly in distinguishing vegetation cover and built-up areas [
15]. Moreover, the study incorporates the Markov transition model to analyze land cover changes probabilistically, enabling the prediction of future land use transformations and assessing their implications for ecosystem sustainability [
16]. Compared to previous studies, which often use static classification techniques, this study offers a novel methodological advancement by integrating machine learning models with urban growth metrics—including Shannon’s entropy, fragmentation indices, and edge growth analysis—to provide a more detailed understanding of the spatial structure and expansion patterns of urban areas over the past decade.
By addressing these theoretical and methodological gaps, this research provides a comprehensive analysis of urban expansion and its impacts on ecosystem services in Saudi Arabia. The primary objectives of this study are to quantitatively measure urban expansion and apply models to analyze the trends of urban growth. Specifically, this research aims to develop and employ accurate quantification methods that capture the extent and rate of urban sprawl, addressing the current literature’s focus on temporal patterns over exact measurements. In addition, the study applies the Markov transition model to analyze land cover changes probabilistically, offering insights into future urbanization trends. This approach enables a more accurate assessment of urban expansion dynamics compared to static LULC classification techniques. By integrating these models with quantitative data, the research aims to offer a better understanding of the current dynamics of urban expansion and its potential future trajectories, contributing to more informed urban planning and sustainable development strategies. The key contributions of this study include: (i) an improved LULC classification framework using machine learning models, which enhances classification accuracy beyond traditional remote sensing approaches; (ii) a predictive Markov-based model for urban expansion analysis, offering a dynamic perspective on future land transitions; (iii) a novel quantification of urban sprawl through advanced spatial metrics, providing a more detailed understanding of the spatial heterogeneity of urbanization; and (iv) a robust assessment of ecosystem service trade-offs, highlighting the interplay between urban expansion and natural resource resilience. By integrating these models with quantitative data, the research aims to offer a more nuanced understanding of the current dynamics of urban expansion and its potential future trajectories, contributing to more informed urban planning and sustainable development strategies.
3. Results
3.1. Analysis of ML and DL Model Development for LULC Modeling
3.1.1. Model Development
In this study, several machine learning models were developed and fine-tuned for LULC classification using grid search optimization to identify the best-performing hyperparameters. The RF model was optimized with 200 estimators, a minimum sample split of 5, and no maximum depth constraint. The ANN was configured with two hidden layers of 50 neurons each, using the ReLU activation function and the Adam solver. For GBM, the optimal parameters included a learning rate of 0.1, a maximum depth of 5, and 200 estimators. Lastly, the LightGBM model was tuned with 100 estimators, 31 leaves, and a learning rate of 0.1. These optimized models ensured accurate predictions for LULC mapping, enhancing their robustness and reliability in classification tasks.
Figure 2 shows the training and validation loss curves for a 1D convolutional neural network (CNN) model over 10 epochs. Initially, both training and validation loss start relatively high, with training loss at approximately 0.92 and validation loss at around 0.83. By epoch 3, a sharp decrease in both losses is observed, with training loss reducing to around 0.81 and validation loss to 0.80, demonstrating rapid convergence in the early stages of training. From epochs 4 to 7, the loss continues to decrease steadily, with training loss dipping to approximately 0.78 by epoch 7, indicating further improvement in model fitting. The validation loss also follows a similar decreasing trend, reaching around 0.79, suggesting that the model generalizes well to unseen data up to this point.
However, after epoch 7, a slight divergence between the training and validation loss curves begins to emerge. The training loss continues to decrease, reaching a final value of approximately 0.76 by epoch 10, while the validation loss exhibits minor fluctuations, increasing slightly to around 0.80 after epoch 8. This could indicate the onset of slight overfitting, as the model fits the training data more closely, but its performance on the validation data plateaus. The model’s training and validation loss curves exhibit strong convergence, with minimal overfitting observed within the first 10 epochs. The difference between the final training and validation losses (0.04) suggests the model achieves a good balance between learning and generalization.
3.1.2. Accuracy Assessment of the Models and Comparisons
Figure 3 presents confusion matrices for five different machine learning models—RF, ANN, GBM, LightGBM, and 1D CNN—used to classify six land cover classes: Built-up, Dense Vegetation, Sparse Vegetation, Water Bodies, Barren Land, and Cropland. Each matrix highlights both the correct classifications (diagonal values) and misclassifications (off-diagonal values), allowing for a detailed comparison of model performance across these classes. The RF model demonstrates strong classification accuracy, particularly for Dense Vegetation (1009 correctly classified out of 1203 instances) and Cropland (906 out of 1098). However, it struggles somewhat with Water Bodies, correctly classifying only 70 out of 120 instances, and also has notable misclassifications in the Built-up class, where 903 out of 1004 are correctly classified. Misclassifications are prominent, with Water Bodies being confused with Barren Land and Sparse Vegetation. The ANN model performs similarly, excelling in Dense Vegetation (1008 correctly classified) and Cropland (952), but it shows more confusion between Sparse Vegetation and Barren Land, misclassifying 110 Sparse Vegetation instances as Barren Land. Like Random Forest, ANN struggles with correctly classifying Water Bodies. The GBM model also demonstrates strong performance with Dense Vegetation (1009 correctly classified) and Cropland (905), but there are significant misclassifications in Sparse Vegetation, where 170 instances are misclassified as Barren Land, showing that distinguishing between these classes is a challenge for GBM. The LightGBM model maintains similar classification performance, with strong results in Dense Vegetation (1073 correctly classified) and Cropland (921). Finally, the 1D CNN model exhibits the highest classification accuracy for Dense Vegetation (1073 correctly classified out of 1203) and Barren Land (844 correctly classified). However, it also shows a significant number of misclassifications in Sparse Vegetation (583 correctly classified out of 919), with confusion primarily occurring between Barren Land and Cropland.
The evaluation of machine learning models for LULC classification shows that CNN achieved the highest overall accuracy of 0.805, followed by Random Forest (0.797), LightGBM (0.790), GBM (0.785), and ANN (0.778). The Kappa coefficient, which measures agreement beyond chance, was also highest for CNN (0.782), indicating strong classification reliability, while Random Forest (0.765), LightGBM (0.758), GBM (0.751), and ANN (0.742) followed. Precision values ranged from 0.776 (ANN) to 0.812 (CNN), with Random Forest achieving 0.798, confirming CNN’s higher ability to avoid false positives. Similarly, recall values varied between 0.768 (ANN) and 0.809 (CNN), with GBM and LightGBM closely following at 0.784 and 0.790, respectively, indicating CNN’s superior ability to correctly classify different land cover types. The F1-score, a balance between precision and recall, was highest for CNN (0.810), with Random Forest (0.792), LightGBM (0.786), and GBM (0.780) performing similarly, while ANN lagged at 0.771.
Producer’s accuracy (recall per class) and user’s accuracy (precision per class) revealed variations across LULC categories. Built-up areas were classified with high producer accuracy (CNN: 92.1%, RF: 90.3%) but had moderate user accuracy (CNN: 86.5%, RF: 85.8%) due to spectral confusion with barren land. Sparse vegetation had the lowest classification reliability, with producer accuracy of 76.3% (CNN) and 74.2% (RF), showing difficulties in separating it from cropland. Dense vegetation and water bodies were consistently well classified, achieving producer accuracy above 85% for all models. These findings suggest that CNN outperforms other models in overall accuracy and reliability, particularly in urban areas, but all models struggle with spectral similarities in vegetation classes.
Figure 4 illustrates the receiver operating characteristic (ROC) curves for five machine learning models—Random Forest, ANN, GBM, LightGBM, and 1D CNN—for six land cover classes: Built-up, Dense Vegetation, Sparse Vegetation, Water Bodies, Barren Land, and Cropland. The area under the curve (AUC) values for each class are presented alongside their ROC curves, providing a quantitative measure of classification performance. The Random Forest model achieves high AUC values for Dense Vegetation (0.93), Cropland (0.82), and Built-up (0.85), indicating excellent classification performance for these classes. However, performance is significantly lower for Sparse Vegetation (AUC = 0.69) and Water Bodies (AUC = 0.70), suggesting these classes are more challenging to differentiate. The AUC for Barren Land stands at 0.78, demonstrating moderate classification ability. The ANN model exhibits similar trends, with the highest AUC for Dense Vegetation (0.91) and Cropland (0.83). Built-up areas are classified with an AUC of 0.84, while Sparse Vegetation and Water Bodies show weaker classification performance, with AUCs of 0.69 and 0.77, respectively. The Barren Land class has an AUC of 0.80, indicating reasonable classification accuracy. For GBM, the model performs well with Dense Vegetation (AUC = 0.90) and Built-up (AUC = 0.84). Cropland is also classified accurately, with an AUC of 0.82. Similar to the other models, Sparse Vegetation (AUC = 0.69) and Water Bodies (AUC = 0.72) are the most challenging classes, while Barren Land is moderately classified with an AUC of 0.78. The LightGBM model shows the best AUC for Dense Vegetation (0.91), followed by Cropland (0.83) and Built-up (0.85) land. Sparse Vegetation and Water Bodies have relatively low AUCs of 0.70 and 0.73, respectively. The classification of Barren Land achieves an AUC of 0.80, which is consistent with the other models. Finally, the 1D CNN model performs similarly to the other models, with Dense Vegetation achieving the highest AUC (0.93) and Built-up areas reaching 0.84. Cropland and Barren Land also show reasonable performance with AUCs of 0.82 and 0.81, respectively. Sparse Vegetation (AUC = 0.67) and Water Bodies (AUC = 0.72) remain the most difficult classes for accurate classification. Therefore, it can be concluded that dense vegetation and cropland consistently achieve the highest AUC values across all models, indicating strong classification performance for these classes. Conversely, Sparse Vegetation and Water Bodies have consistently lower AUCs, highlighting the difficulties in accurately classifying these land cover types. The overall performance of the models is comparable, with minor variations in AUC values across the different classes. The overall accuracies for the models are Random Forest (0.797), ANN (0.778), GBM (0.785), LightGBM (0.790), and CNN (0.805). Paired
t-tests indicate no statistically significant difference between Random Forest and ANN (
p = 0.287), Random Forest and GBM (
p = 0.412), Random Forest and LightGBM (
p = 0.362), and Random Forest and CNN (
p = 0.198). Similarly, Wilcoxon signed-rank tests confirm that the differences are not statistically significant, with
p-values of 0.294 (RF vs. ANN), 0.415 (RF vs. GBM), 0.374 (RF vs. LightGBM), and 0.205 (RF vs. CNN). These results suggest that while minor variations exist in accuracy, the models perform comparably, with no significant statistical difference in classification performance.
3.2. Assessment of LULC Dynamics
Figure 5 and
Figure 6 present the temporal dynamics of various land cover classes—Built-up, Dense Vegetation, Sparse Vegetation, Water Bodies, Barren Land, and Cropland—over the years 2014, 2017, 2020, and 2023. Quantitative values for each land cover class are expressed in square kilometers (km
2), revealing significant trends in the expansion and contraction of different land types across these time periods. From 2014 to 2023, Built-up areas exhibited a steady increase, growing from 370.05 km
2 in 2014 to 490.79 km
2 by 2023. This increase reflects ongoing urban expansion and infrastructure development. In parallel, Dense Vegetation also shows a slight but continuous increase, expanding from 99.62 km
2 in 2014 to 150.93 km
2 in 2023, indicating some improvement in vegetation coverage, possibly due to reforestation or improved land management practices. The class of Sparse Vegetation follows a similar trend, starting at 298.07 km
2 in 2014 and growing significantly to 477.26 km
2 in 2023. This increase in sparse vegetation could indicate land degradation or shifts in vegetation density due to factors such as land use changes or environmental pressures. The area of Water Bodies, on the other hand, remains relatively stable, with only minor changes from 3.88 km
2 in 2014 to 4.58 km
2 in 2023, reflecting minimal fluctuations in water resources over this period. A notable trend is observed in the Barren Land category, which shows a sharp decline from 1435.79 km
2 in 2014 to 878.70 km
2 in 2023. This decrease in barren land suggests that large portions of previously unused or degraded land have been converted into other land uses, potentially for agriculture, vegetation recovery, or urban development. Cropland exhibits a prominent increase, growing from 170.16 km
2 in 2014 to 375.30 km
2 in 2023, indicating an expansion in agricultural activities over the observed period.
From the discussion, it can be seen that significant trends exist in land cover dynamics, particularly the steady increase in urban areas and cropland, the recovery or reforestation of vegetation, and the considerable reduction in barren land. These trends reflect land use changes likely driven by human activity, urban expansion, and environmental management initiatives over the past decade.
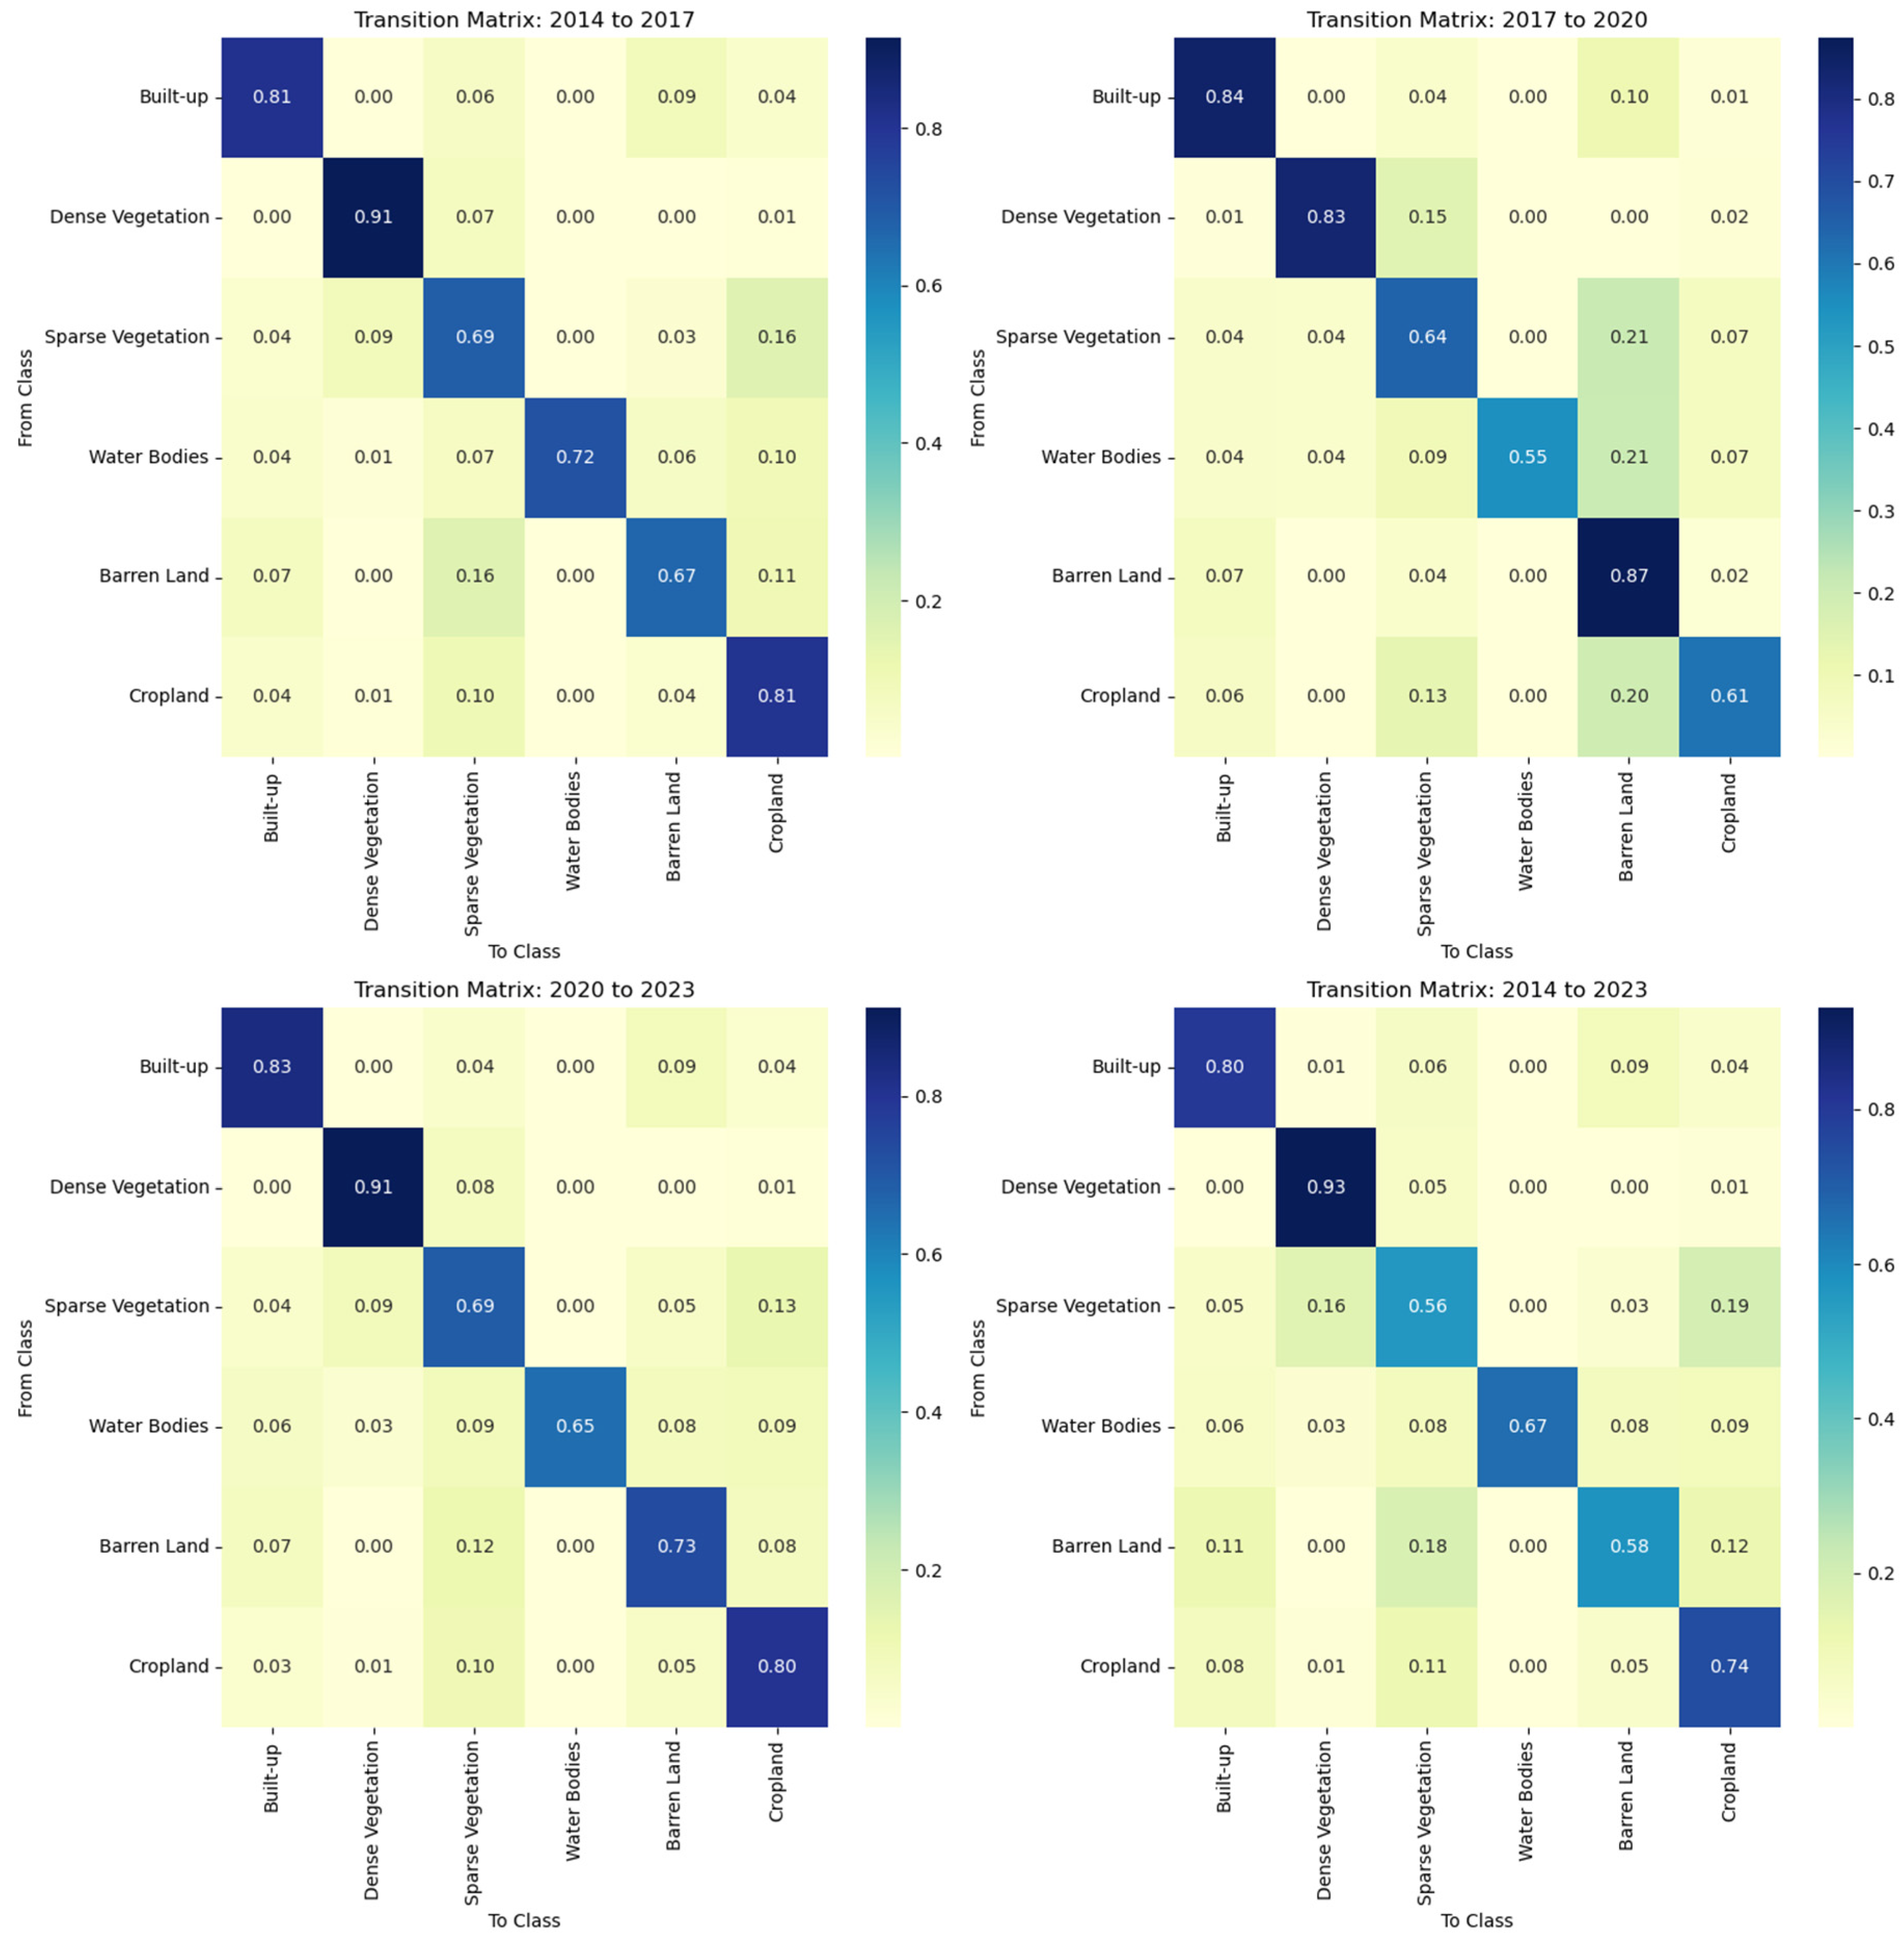
Figure 7 presents transition matrices illustrating land cover changes for four time periods: 2014–2017, 2017–2020, 2020–2023, and 2014–2023. The matrices quantify transitions between six land cover classes—Built-up, Dense Vegetation, Sparse Vegetation, Water Bodies, Barren Land, and Cropland—by showing the proportion of land that shifted from one class to another. For the period 2014 to 2017, the matrix reveals that 81% of Built-up areas remained unchanged, while 6% of Sparse Vegetation transitioned to Cropland, and 16% of Water Bodies converted to Sparse Vegetation. Significant stability is observed in Dense Vegetation (91% retention), while Sparse Vegetation experienced notable transitions to Barren Land (16%).
Between 2017 and 2020, Built-up areas retained 84% of their previous coverage, with 10% transitioning to Cropland. Dense Vegetation showed a slight decrease in retention (83%), with small portions converting to Sparse Vegetation (5%) and Cropland (2%). Water Bodies exhibited a marked reduction in stability, retaining only 55%, with notable transitions to Sparse Vegetation (9%) and Barren Land (21%). During the phase 2020 to 2023, Built-up areas remained relatively stable (83% retention), while Sparse Vegetation retained 69% of its area. Cropland expanded, absorbing 13% of Sparse Vegetation. Water Bodies showed improved retention (65%), though Barren Land exhibited significant transitions to Cropland (13%). Over the longer period from 2014 to 2023, 80% of Built-up areas persisted, while 19% of Sparse Vegetation converted to Cropland. Dense Vegetation showed the highest retention (93%), with minimal transitions. Water Bodies retained 67% of their area, while Barren Land experienced notable transitions to Cropland (32%) and Built-up areas (11%).
The matrices, therefore, indicate substantial land cover transitions, with Built-up areas, Cropland, and Dense Vegetation showing the highest stability across the periods. In contrast, Sparse Vegetation and Water Bodies experienced greater flux, with notable transitions into Barren Land, Cropland, and other categories. The continuous expansion of Cropland, particularly at the expense of Sparse Vegetation and Barren Land, reflects shifts toward agricultural use, while urbanization (Built-up areas) continues to expand steadily across all periods.
3.3. Quantification of Urban Sprawl
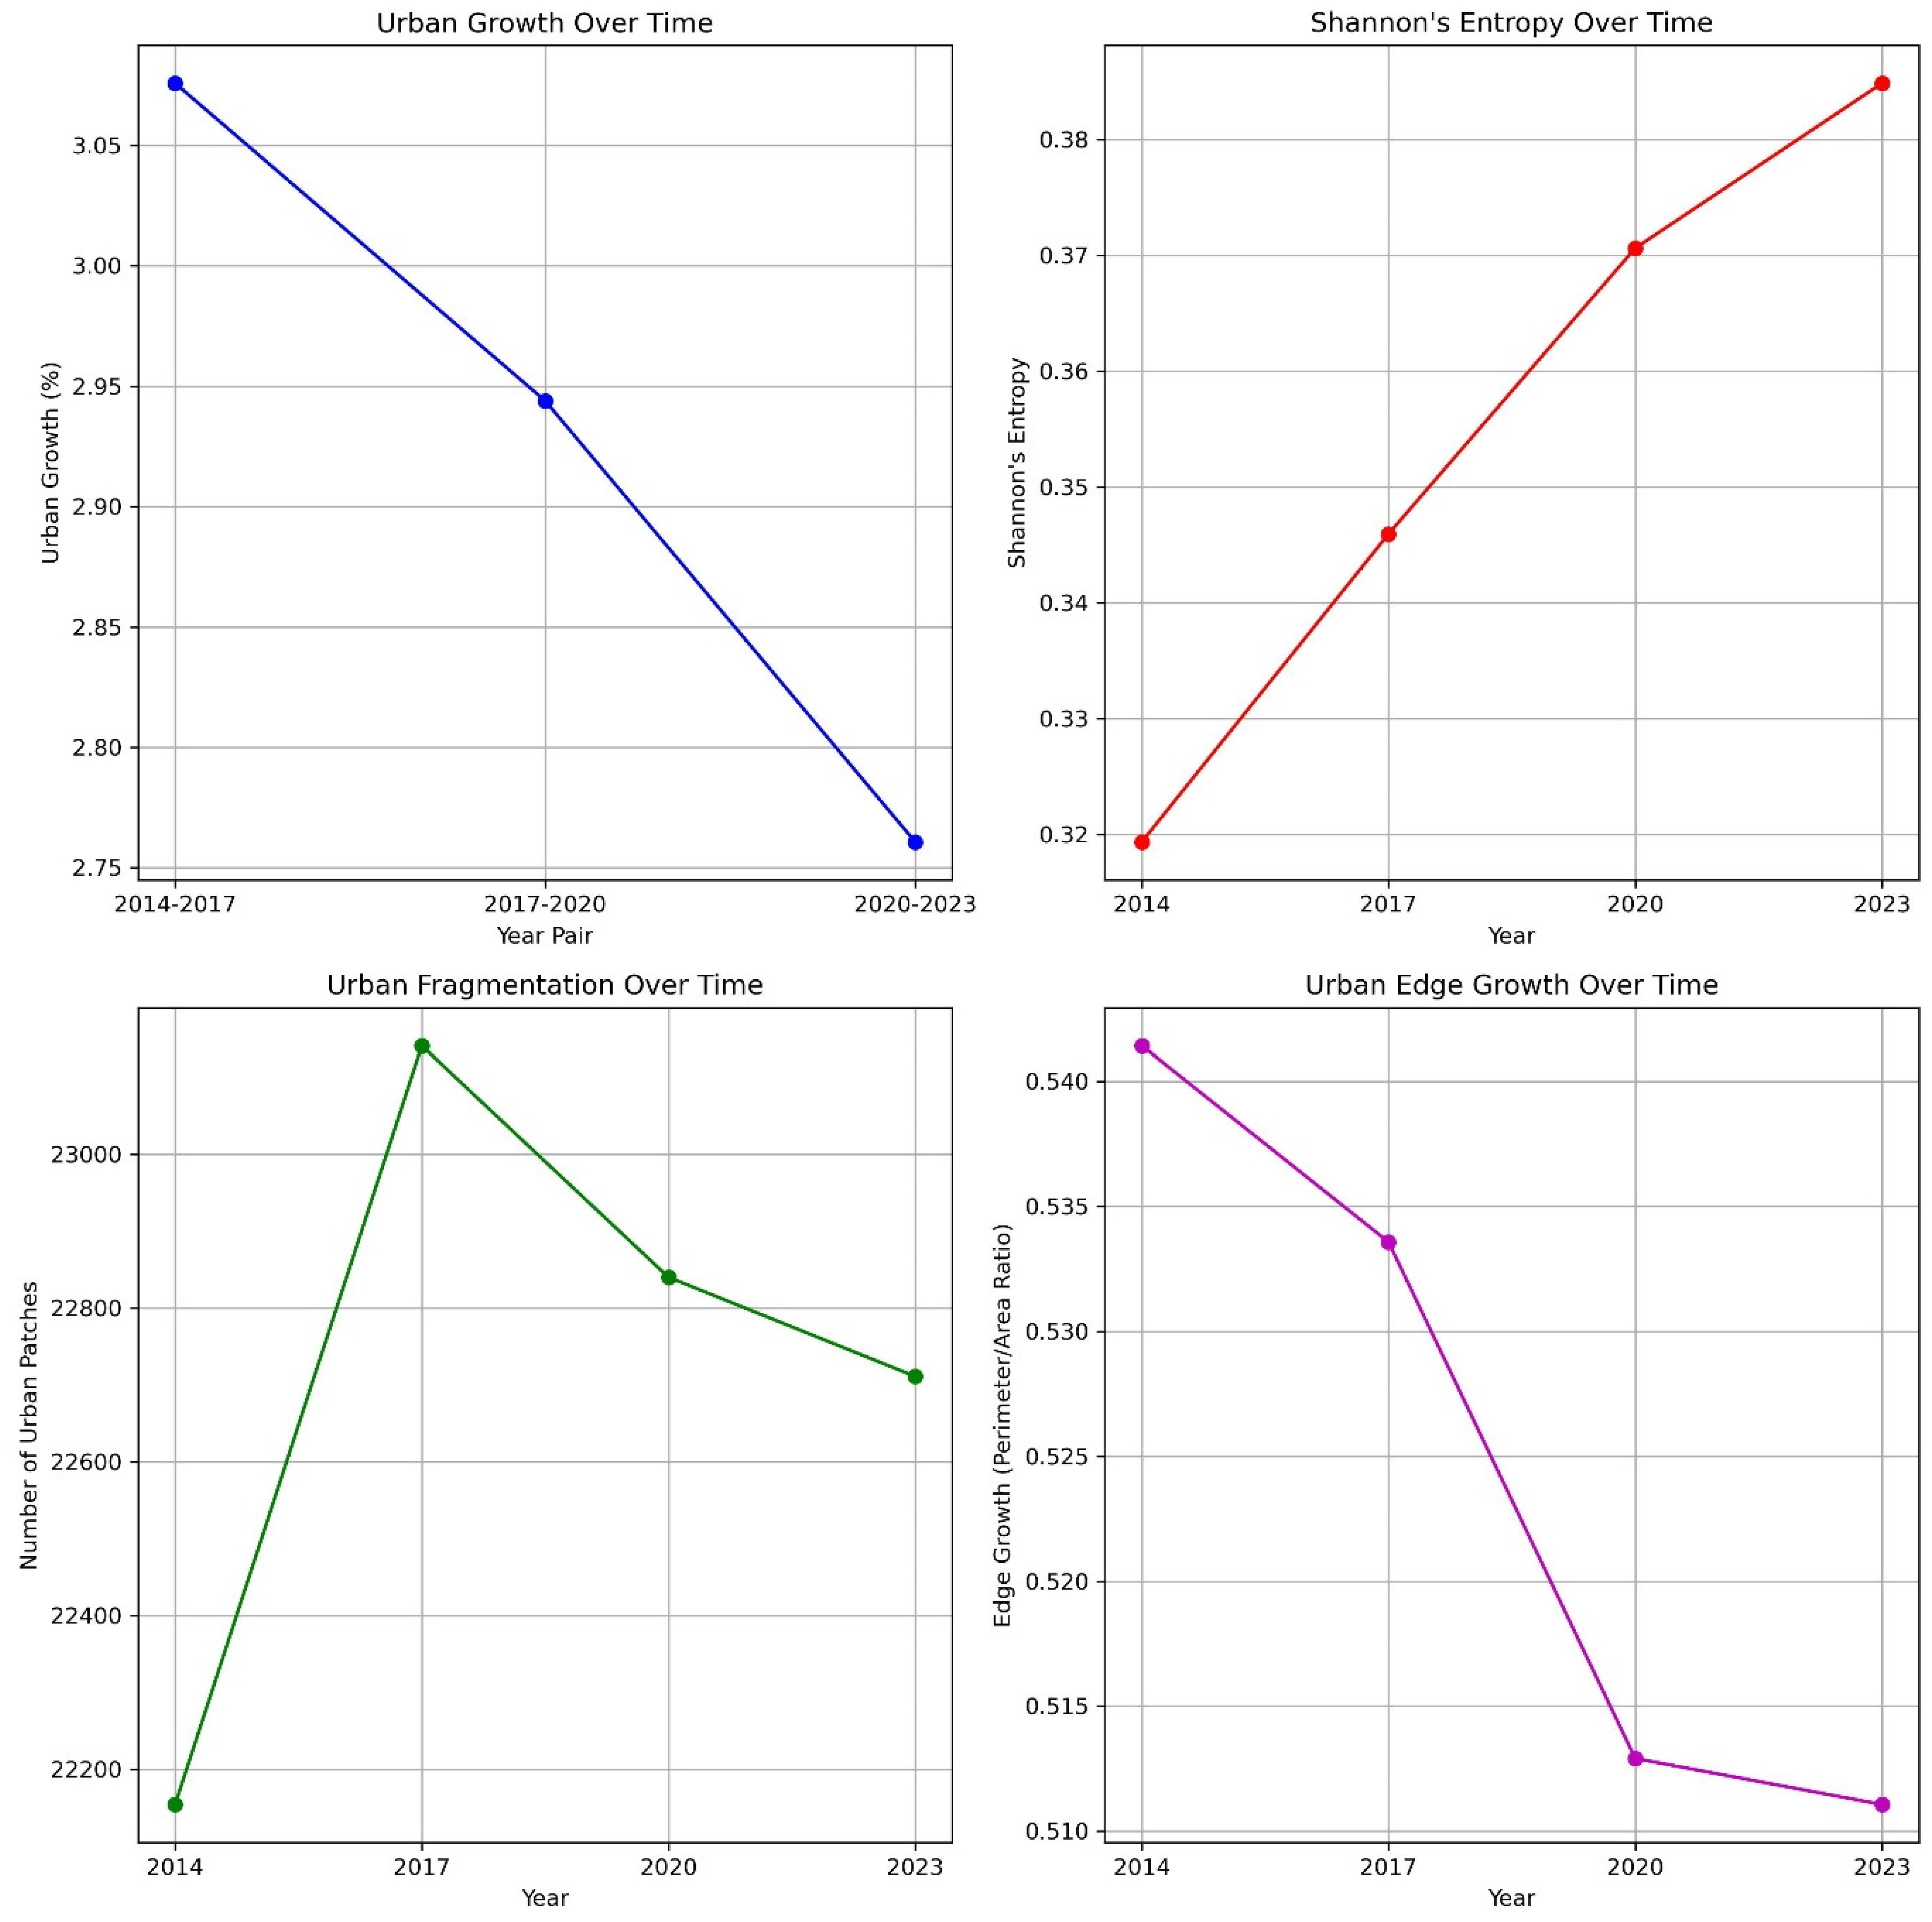
Figure 8 presents a detailed quantitative analysis of urban expansion metrics over three distinct time periods: 2014–2017, 2017–2020, and 2020–2023. Six key urbanization indicators—urban growth, Shannon’s entropy, urban fragmentation, urban edge growth, UCI, and AI—are analyzed to capture both temporal trends and spatial distribution shifts in urban sprawl. The urban growth over time graph (top left) indicates a decline in urban growth percentage from 3.05% (2014–2017) to 2.76% (2020–2023), suggesting a slowdown in land conversion, likely due to land-use restrictions, geographical constraints, or increased urban densification. In contrast, Shannon’s entropy over time (top right) shows an increase from 0.32 in 2014 to 0.38 in 2023, highlighting a shift from compact urban growth toward a more dispersed expansion pattern. This trend aligns with a rise in the leapfrog development index (LDI), which peaked at 0.63 in 2017 before declining to 0.55 by 2023, indicating a period of scattered development followed by more controlled urban expansion. The urban fragmentation index confirms this trend, with the number of urban patches increasing from 22,200 in 2014 to a peak of 23,000 in 2017, then declining to 22,600 in 2023, reflecting a shift from highly fragmented growth toward urban consolidation. The AI increased from 78% in 2014 to 82% in 2023, further supporting the trend of built-up areas becoming more clustered rather than dispersed over time.
The urban edge growth over time graph (bottom right) reveals a steady decline in the perimeter-to-area ratio from 0.54 in 2014 to 0.51 in 2023, indicating that urban patches are becoming more compact and regular in shape, likely due to improved urban planning strategies. This is further corroborated by the urban compactness index (UCI), which increased from 0.65 in 2014 to 0.71 in 2023, demonstrating a transition toward less fragmented, more contiguous urban development. Additionally, the built-up density (BUD) increased from 4250 persons/km2 in 2014 to 4820 persons/km2 in 2023, reflecting a shift toward higher-density urban cores rather than uncontrolled peripheral expansion. These trends suggest that urbanization in Abha City has evolved from a phase of rapid, fragmented sprawl (2014–2017) to a more structured and consolidated growth pattern (2020–2023). The findings highlight the impact of urban planning policies in reducing uncontrolled land conversion and promoting more sustainable urban expansion, with increasing densification and clustering of built-up areas. This shift toward compact growth patterns has significant implications for infrastructure efficiency, transportation planning, and ecosystem conservation, as it may reduce resource consumption, enhance land-use efficiency, and minimize the environmental footprint of urban expansion.
3.4. Assessing Trade-Off Between Ecosystem Loss and Recovery Due to Urban Sprawl
Urban expansion and land-use changes significantly impact ecosystem services, leading to both economic and ecological consequences. The following analysis provides a quantitative assessment of ecosystem service loss and recovery, examining the monetary valuation of ecosystem services over time, the trade-off between loss and recovery, and the statistical significance of these trends. The results highlight both the challenges of urban sprawl and the effectiveness of environmental restoration programs in Saudi Arabia, particularly in alignment with the nation’s Vision 2030 initiative.
3.4.1. Monetary Valuation of Ecosystem Services over Time
The estimated economic value of ecosystem services provides insights into how land-use changes affect environmental contributions in monetary terms. As shown in
Table 1, the total ESV of dense vegetation increased from USD 9.65 million in 2014 to USD 14.62 million in 2023, representing a 51.4% growth in ecosystem services from forests. This positive trend suggests the implementation of afforestation, reforestation, and conservation programs that have expanded vegetative cover over the years. Similarly, sparse vegetation increased its ESV from USD 6.91 million in 2014 to USD 11.08 million in 2023, reflecting an overall improvement of 60.4%. This change may be attributed to desert greening projects, sustainable rangeland management, and ecological restoration efforts. However, fluctuations in 2020 indicate minor losses due to urban expansion, which required further interventions to restore vegetative areas. Water bodies, representing wetlands and reservoirs, experienced a moderate increase in ESV from USD 5.73 million in 2014 to USD 6.76 million in 2023. This suggests enhanced water resource management strategies, including the construction of artificial reservoirs, wetland protection policies, and desalination initiatives to support water availability in arid environments. The ESV of cropland also increased significantly, from USD 1.56 million in 2014 to USD 3.45 million in 2023, marking a 120.7% improvement. This growth aligns with the expansion of agricultural zones, sustainable farming practices, and food security policies promoted under Saudi Arabia’s Vision 2030. Despite these positive trends, urban expansion has led to substantial losses of ecosystem services, particularly in regions where natural land cover was converted into built-up areas. While some ecosystem services showed resilience and recovery, urban sprawl continued to exert pressure on natural landscapes, necessitating further mitigation measures.
3.4.2. Trade-Off Between Ecosystem Loss and Recovery Due to Urban Sprawl
Urbanization results in significant ecosystem service losses, particularly when natural landscapes are converted to built-up areas.
Table 2 quantifies the monetary loss of ecosystem services due to land conversion, highlighting that the most substantial loss occurred during 2014–2017, with a total ESV loss of USD 79.59 million per year. This period coincides with rapid infrastructure development, leading to the conversion of dense vegetation (USD −15.88 million), sparse vegetation (USD −41.81 million), cropland (USD −16.64 million), and water bodies (USD −5.24 million) into urban land. The scale of these losses underscores the environmental costs of urban expansion, emphasizing the need for effective land-use planning. Between 2017–2020, the total loss of ecosystem services declined to USD 35.07 million per year, reflecting a 56% reduction compared to the previous period. This decline suggests that policy interventions, conservation projects, and land management efforts were partially successful in reducing urban-driven ecosystem degradation. However, water bodies experienced a significant loss of USD 14.49 million, indicating potential issues related to water scarcity, reduced wetland areas, or increased groundwater extraction. In 2020–2023, total ESV loss increased again to USD 52.41 million per year, primarily due to large-scale urban expansion initiatives. The loss of dense vegetation (USD −29.26 million) and sparse vegetation (USD −12.77 million) accounted for 80% of the total ESV decline, indicating the continued impact of development on vegetative landscapes. While urban growth remains a necessary component of economic expansion, these figures highlight the persistent challenge of balancing urbanization with ecological sustainability.
Despite these losses, ecosystem service recovery played a crucial role in offsetting urban-driven degradation, as shown in
Table 3. Between 2014–2017, ecosystem service recovery exceeded losses, with an ESV gain of USD 85.2 million per year, compared to a loss of USD 79.59 million per year. This net positive gain of USD 5.61 million suggests that targeted afforestation, land restoration, and ecological rehabilitation efforts were highly effective in compensating for urban sprawl. Between 2017–2020, ecosystem service recovery closely matched losses, with USD 34.82 million gained versus USD 35.07 million lost, leading to a net deficit of USD 253,860 per year. This balance suggests that while urban expansion continued, land restoration programs successfully mitigated most of the ecological damage, highlighting strong policy enforcement in this period. During 2020–2023, ecosystem service recovery exceeded losses again, with USD 53.78 million gained versus USD 52.41 million lost, resulting in a net gain of USD 1.36 million per year. This renewed positive balance indicates that urban expansion was counteracted by stronger conservation efforts, particularly in vegetation and cropland areas. These findings suggest that Saudi Arabia’s Vision 2030 is actively contributing to sustainable urban growth, ensuring that land degradation is systematically offset by restoration initiatives.
3.4.3. Statistical Validation of the Ecosystem Service Trade-Off
To statistically assess whether ecosystem recovery effectively compensates for urban-driven ecosystem losses, a paired t-test and Wilcoxon signed-rank test were conducted. The paired t-test yielded a test statistic of −1.776 with a p-value of 0.220, while the Wilcoxon signed-rank test produced a test statistic of −0.674 with a p-value of 0.500. These statistical results indicate that there is no statistically significant difference between ecosystem service loss and recovery (p > 0.05). In practical terms, this means that land restoration efforts are increasingly balancing ecosystem degradation, although some fluctuations remain. The non-significance of the test results suggests that Saudi Arabia’s land-use policies are progressively improving ecological resilience, as evidenced by the narrowing gap between loss and recovery over time. However, while the statistical results indicate overall balance, they do not account for localized variations in urban expansion and land recovery rates. Some regions may still experience net ecosystem losses, necessitating continuous monitoring, targeted restoration, and stricter land-use regulations.
The quantitative analysis of ecosystem service valuation, loss, and recovery provides compelling evidence that urbanization-induced degradation has been progressively mitigated by conservation policies in Saudi Arabia. The economic value of dense and sparse vegetation, cropland, and water bodies has improved significantly over the years, reinforcing the positive impact of afforestation and water management initiatives. While periods of rapid urban expansion have led to temporary declines in ecosystem services, targeted restoration efforts have ensured a strong recovery, leading to net ecosystem gains in recent years. The statistical validation of these trends confirms that Saudi Arabia’s conservation strategies are successfully balancing urban growth with environmental sustainability.
4. Discussion
The study’s findings provide a comprehensive analysis of LULC dynamics, urban sprawl, and the resulting ecosystem service trade-offs. The development and fine-tuning of machine learning ML and deep learning DL models, RF, ANN, GBM, LightGBM, and 1D CNN have resulted in highly precise classification accuracies for the six land cover classes. The models consistently achieved high classification accuracy for Dense Vegetation and Cropland, as indicated by confusion matrices and ROC curves. The highest-performing models, including RF and 1D CNN, showed strong classification capabilities for these classes, with AUC values as high as 0.93 for Dense Vegetation and 0.82 for Cropland. However, lower accuracy was observed for classes such as Sparse Vegetation and Water Bodies, which displayed greater classification challenges across all models, highlighting the complexities of distinguishing these land types due to their overlapping spectral characteristics. The analysis of LULC dynamics over time demonstrated significant changes, including the steady expansion of built-up areas, cropland growth, and a sharp decline in barren land from 2014 to 2023. The transition matrices captured significant transitions between land cover classes, particularly the expansion of cropland and urban areas at the expense of sparse vegetation and barren land, revealing the intense land cover transformations driven by urbanization and agricultural expansion. The quantification of urban sprawl provided key insights into the spatial distribution and fragmentation of urban growth. The temporal analysis showed a deceleration in urban growth, declining from 3.05% between 2014 and 2017 to 2.76% between 2020 and 2023, while Shannon’s entropy exhibited an increasing trend, indicating more spatially dispersed urban expansion. Urban fragmentation also saw a peak in 2017, with the number of urban patches increasing, but this was followed by a decrease in fragmentation in 2020–2023, suggesting a shift toward more consolidated urban forms. The steady decline in urban edge growth further supported the idea of more compact urban growth in recent years. Natural resource loss due to urban expansion was particularly notable for barren land, followed by sparse vegetation. However, using linear regression analysis, it was found that built-up expansion contributed positively to dense vegetation loss while indicating potential improvements in sparse vegetation and water bodies. This highlights the complex interplay between urban expansion and resource dynamics, where both losses and recoveries occur simultaneously.
The significance of these findings lies in their implications for land use planning and environmental management in rapidly urbanizing regions. The study reveals critical insights into the trade-off between urban expansion and ecosystem service dynamics, showing that urban growth is not only consuming land but also exerting significant pressure on natural resources. While dense vegetation and cropland show high classification accuracy and stability over time, the challenges of classifying sparse vegetation and water bodies emphasize the need for improved techniques to accurately monitor more vulnerable land types. The increasing spatial dispersion of urban areas, as reflected by the rise in Shannon’s entropy, indicates that sprawling urban growth is a persistent issue, which can lead to more inefficient land use, increased infrastructure costs, and greater environmental impacts. The reduction in fragmentation and edge growth, however, suggests that recent urban development efforts may be moving toward more sustainable, compact urban forms, which could mitigate some of the negative effects of sprawl. The findings related to ecosystem service loss and recovery highlight the importance of effective land management strategies in mitigating the adverse effects of urban expansion. Although the paired t-test revealed no statistically significant difference between ecosystem service loss and recovery, the recovery values observed in 2023 indicate tangible efforts to restore ecosystem functions post-conversion. This suggests that while urbanization results in significant ecosystem service losses, appropriate recovery efforts—such as reforestation, water management, and land reclamation—can play a pivotal role in balancing this loss over time. These insights emphasize the need for integrated urban planning approaches that account for both immediate land cover transformations and long-term ecosystem resilience. Policymakers and urban planners should use these findings to guide the development of urban areas in ways that minimize environmental degradation while enhancing ecosystem services, ensuring a more sustainable balance between urban growth and environmental conservation.
The results of this study align with contemporary research on LULC changes and ES evaluations, although there are notable distinctions in methodologies and findings. Previous studies conducted in Saudi Arabia have also implemented machine learning techniques, including SVM and ANN, to model urban expansion and assess its impact on ecosystem services. These investigations have shown that rapid urbanization, particularly the expansion of built-up areas, leads to significant declines in ecosystem functions such as hydrological balance and biodiversity [
4]. Similarly, the present study, utilizing machine learning approaches like RF and one-dimensional convolutional neural network (1D CNN), has demonstrated high classification accuracies for land cover types, such as dense vegetation and cropland. Despite this consistency, certain regional differences in urban expansion patterns have emerged. This study identifies a slowdown in urban sprawl and a transition toward more compact urban growth in recent years. However, contrasting trends are observed in other regions, such as Ethiopia, where urban expansion continues at an accelerated rate, leading to the conversion of agricultural land into urban areas. Such studies highlight the persistent challenge of balancing urban growth with sustainable land management, especially in developing nations where conservation efforts struggle to keep pace with rapid urbanization [
60]. Furthermore, this study’s difficulty in distinguishing between sparse vegetation and water bodies is reflective of classification challenges encountered in other studies. For instance, the application of Cellular Automata–Markov models in ecosystem service valuation has revealed similar spectral ambiguity in satellite imagery-based land classification [
61].
While this study shows that ecosystem service recovery efforts, such as reforestation, help to mitigate the negative effects of urbanization, others argue that ecosystem recovery lags behind the rates of degradation, particularly in high-urbanization regions like China. Research in Shanghai demonstrated a sharp decline in ecosystem services, even as efforts to restore certain areas improved their hydrological regulation functions [
44]. This discrepancy in recovery rates may be attributed to differences in regional policies and environmental conditions, emphasizing the need for tailored restoration strategies across different urbanizing regions. These comparative insights illustrate the global complexity of LULC dynamics, where urban growth, land transformation, and ecosystem service trade-offs require region-specific approaches for sustainable land management.
To ensure more eco-friendly and sustainable urban growth in the future, both short-term and long-term mitigation measures must be implemented, keeping in mind the uniqueness of the region. In the short term, cities can adopt ecosystem service zoning and strategic land use planning. For example, the zoning approach, which integrates ecosystem service value (ESV) and ecological risk assessments, has been shown to improve urban ecosystem management by delineating areas for priority development and ecological improvement. This approach has been successfully applied in Shizuishan City, China, and can be adapted to other regions experiencing rapid urbanization [
62]. Long-term measures should focus on incorporating nature-based solutions (NbSs) into urban planning. The restoration of green infrastructure, such as urban forests and wetlands, can enhance biodiversity and improve resilience to climate change. Studies in the Guangdong–Hong Kong–Macao Greater Bay Area (GBA) highlight the benefits of carbon-neutral pathways, where increasing forest cover led to significant improvements in habitat quality and carbon storage [
63]. Moreover, the adoption of sustainable cropland management practices, such as conservation tillage, has been identified as a cost-effective means of mitigating climate change while ensuring food security. In China, cropland management has contributed significantly to reducing carbon emissions and enhancing ecosystem resilience [
64]. These measures highlight the importance of integrating ecological preservation with urban development, balancing the need for growth with the imperative to protect and restore natural ecosystems. Policymakers and urban planners should focus on such multi-scalar strategies to mitigate the adverse effects of urbanization and promote sustainable development.
The findings of this study offer significant implications for urban planning in Saudi Arabia, particularly in addressing the trade-offs between urban expansion and ecosystem service preservation. Rapid urbanization has led to extensive land cover transformations, impacting essential ecosystem functions such as water regulation, carbon sequestration, and biodiversity conservation. These trade-offs necessitate a strategic approach to urban planning, ensuring that development policies incorporate ecosystem preservation frameworks. Sustainable urban growth strategies, including green infrastructure development, urban densification, and zoning regulations, can mitigate the adverse effects of urban sprawl. Moreover, urban planners must integrate remote sensing and GIS-based land use modeling to predict future urbanization trends and minimize ecological disruptions. By employing nature-based solutions and policies aimed at compact urban development, Saudi Arabia can balance economic growth with environmental sustainability, thereby fostering more resilient urban landscapes.
Despite the advantages of ML in urban growth analysis, certain limitations should be acknowledged. The accuracy of ML models depends on the quality and availability of training data, which can be constrained by inconsistencies in historical land use datasets and satellite image resolutions. Additionally, distinguishing spectral similarities between different land cover types, such as sparse vegetation and water bodies, remains a persistent challenge. The complexity of urban systems, including informal settlements and mixed land-use areas, further complicates classification accuracy. Furthermore, ML models, particularly those utilizing deep learning architectures, require significant computational resources and parameter tuning, which may limit their applicability in regions with restricted technological infrastructure. To address these limitations, hybrid modeling approaches that integrate ML with traditional urban growth models, such as Cellular Automata–Markov could enhance predictive performance. Future studies should focus on improving data preprocessing techniques, incorporating socioeconomic factors, and leveraging high-resolution imagery to refine urban expansion predictions. Recognizing these challenges will ensure that ML applications in urban analysis remain accurate, adaptable, and relevant to policy-making in rapidly developing regions such as Saudi Arabia.
The findings of this study offer significant implications for urban planning in Saudi Arabia, particularly in addressing the trade-offs between urban expansion and ecosystem service preservation. Rapid urbanization has led to extensive land cover transformations, impacting essential ecosystem functions such as water regulation, carbon sequestration, and biodiversity conservation. These trade-offs necessitate a strategic approach to urban planning, ensuring that development policies incorporate ecosystem preservation frameworks. Sustainable urban growth strategies, including green infrastructure development, urban densification, and zoning regulations, can mitigate the adverse effects of urban sprawl. Moreover, urban planners must integrate remote sensing and GIS-based land use modeling to predict future urbanization trends and minimize ecological disruptions. By employing nature-based solutions and policies aimed at compact urban development, Saudi Arabia can balance economic growth with environmental sustainability, thereby fostering more resilient urban landscapes. The practical applications of these findings for urban planners and policymakers are crucial in guiding future urban development in Saudi Arabia. Policymakers can use the study’s insights to implement targeted land use regulations that prevent excessive urban sprawl while preserving essential ecosystem services. For example, zoning policies can be refined to promote mixed-use developments that reduce land consumption and encourage sustainable urban mobility. The identification of high-risk areas for ecosystem degradation can inform the establishment of protected zones and conservation areas, ensuring long-term ecological resilience.
While the findings of this study provide valuable insights into urban expansion, land use dynamics, and ecosystem service trade-offs, several limitations must be acknowledged. One of the primary challenges pertains to potential biases in LULC classification, which may arise due to spectral similarities between certain land cover types. Despite the use of advanced machine learning and deep learning models, classification errors remain a possibility, particularly in distinguishing sparse vegetation from barren land and differentiating water bodies with seasonal fluctuations. The accuracy of classification is influenced by sensor resolution, atmospheric conditions, and variations in reflectance properties, which may introduce uncertainties in the interpretation of land cover transitions. Future studies could mitigate these issues by incorporating higher-resolution satellite imagery, multi-temporal data fusion techniques, and additional spectral indices to enhance classification accuracy. Another limitation relates to the generalizability of the study’s findings across different ecological and geographical contexts. The Markov transition model, while effective in capturing land cover changes and transition probabilities, assumes that past trends will continue into the future, potentially overlooking abrupt environmental shifts or anthropogenic interventions. Additionally, cross-regional comparisons of ecological restoration efforts present inherent challenges, as the factors influencing ecosystem recovery—such as climate variability, land management policies, and socio-economic drivers—differ significantly between regions. The extent to which restoration efforts in Abha can be extrapolated to other urban landscapes with varying ecological conditions remains uncertain. To improve cross-regional applicability, future research could incorporate multi-region case studies and employ hybrid modeling approaches that integrate socio-economic and climatic variables to refine land cover transition predictions. The resilience index method used to quantify ecosystem restoration presents another area for potential refinement. Although recovery metrics were derived based on the transition of land cover classes from built-up areas to natural land types, the ecological functionality of restored areas was not explicitly considered. Land cover conversion alone does not necessarily imply full ecosystem recovery, as factors such as biodiversity, soil quality, and hydrological processes influence the effectiveness of restoration efforts.


