1. Introduction
Carbon emissions pose a critical global environmental and socioeconomic challenge. This has driven countries to implement policies for carbon reduction and sustainable development [
1,
2]. As a major contributor to global carbon dioxide emissions, China accounted for 30.9% of total emissions in 2020, reaching 9.894 billion tons [
3]. In response, the Chinese government has introduced a series of policies and strategies. These aim to achieve carbon peaking and carbon neutrality [
4,
5]. These initiatives highlight China’s commitment to international climate governance. They also align with its national objective of fostering high-quality economic growth [
5,
6]. As the government continues to implement emission reduction policies, low-carbon development has become central to China’s national strategy. Consequently, identifying pathways for emission reduction and the key drivers of these pathways has become an increasingly important focus of academic and policy research [
7,
8].
Within this framework, scholars have increasingly recognized the digital economy as a fundamental catalyst for China’s economic transformation and a key driver of the transition toward a low-carbon economy [
9]. The digital economy enhances production efficiency through modernized production methods and drives industrial transformation by deeply integrating emerging technologies such as artificial intelligence (AI), the Internet of Things (IoT), and big data. These advancements effectively reduce carbon emissions [
10]. In cities like Hangzhou and Shenzhen, the integration of digital technologies, including AI, big data, and smart logistics, has played a pivotal role in driving carbon emission reductions [
11,
12,
13]. In Hangzhou, for instance, the application of AI in traffic management systems has significantly alleviated traffic congestion, thereby reducing fuel consumption and lowering transportation-related emissions [
14,
15]. Meanwhile, Shenzhen’s adoption of electric vehicles (EVs) alongside IoT-connected infrastructure has led to a notable decline in the city’s overall carbon intensity [
13,
14]. These initiatives exemplify the transformative impact of the digital economy in advancing urban sustainability and achieving substantial reductions in carbon emissions [
9,
12,
14]. According to the China Academy of Information and Communications Technology, the digital economy contributed 38.6% to China’s gross domestic product (GDP) by 2020, underscoring its crucial role in economic expansion and carbon mitigation [
16]. As digitalization continues to accelerate, experts project that the digital economy will remain a key driver of China’s future economic growth and sustainable development [
2,
12].
Digital infrastructure, big data and artificial intelligence, e-commerce, and the digital transformation of industries represent key pillars of the digital economy [
17]. In terms of digital infrastructure, the widespread adoption of fifth-generation (5G) networks, smart grids, and IoT devices enables cities to monitor and optimize energy usage in real time, improving energy efficiency and reducing unnecessary energy waste [
18]. Big data and AI-powered urban management systems enhance resource allocation and the efficiency of urban operations, reducing energy consumption in transportation, buildings, and public facilities [
19]. The rapid expansion of e-commerce has optimized transportation routes by digitizing logistics supply chains and reducing carbon emissions associated with transportation [
20]. Meanwhile, industrial digital transformation has improved resource utilization efficiency through intelligent and automated production processes, reducing carbon emission intensity in the manufacturing and energy sectors [
21,
22]. Thus, the digital economy directly supports low-carbon transitions through technology and promotes sustainable development goals by optimizing industrial structures [
5].
Existing research on the digital economy and carbon emissions concentrates on three core areas. First is the analysis of the interaction between the digital economy and carbon emissions, which examines the impact of the digital economy on carbon emissions across different periods and the evolution of this relationship [
10,
19]. However, these studies have not fully considered the effects of globalization, regional differences, and policy and social factors [
4,
21,
23]. Second, investigations into the mechanisms through which digital technologies modulate carbon emissions are imperative, with a particular emphasis on the role of emerging technologies (including artificial intelligence and the Internet of Things) in mitigating carbon emissions through the optimization of production processes and energy efficiency [
17,
18]. Nevertheless, existing studies have not adequately addressed the long-term effects of these technologies, their diffusion patterns, and their varying impacts across industries and regions. Third is the study of carbon emissions performance evaluations and policy responses within the context of the digital economy [
5,
9]. Although scholars have developed evaluation models to support policy formulation, significant scope remains for enhancing the complexity and practicality of the evaluation index systems and methodologies. Additionally, research on the specificity and effectiveness of policy responses remains insufficient.
This study builds on the above and posits the following research questions (RQ):
RQ1. What are the key success factors in reducing urban carbon emissions driven by the digital economy?
RQ2. How do these key success factors interact, and what is their influence?
This research focuses on the digital supply chain industry and the financial services sector in China, aiming to delineate the critical determinants that enable the digital economy to ameliorate urban carbon emissions. The analysis is structured around three key dimensions: (1) digital infrastructure and technology applications, (2) digital transformation of industry and the economy, and (3) sustainable development and green city construction. Through the expert evaluation method and the Decision-Making Trial and Evaluation Laboratory and Interpretive Structural Modeling (DEMATEL-ISM) approach, the study systematically identifies 13 key factors and conducts quantitative and qualitative analyses, constructing an analytical framework that integrates circular economy theory and behavioral economics theory. The DEMATEL-ISM methodology presents significant advantages in examining the interplay between the digital economy and carbon emissions. This approach discerns and quantifies intricate interdependencies, establishing causal frameworks that enable a holistic assessment of the long-term implications of digital technologies on carbon emissions, along with their multifaceted effects across diverse sectors and geographical areas [
24,
25]. Compared to traditional methods such as statistical analysis or regression analysis, DEMATEL-ISM captures the complex network of relationships among multiple factors, providing a more comprehensive and detailed analysis. This methodology elucidates direct and indirect linkages among internal factors, offering enhanced insights into the relationship between the digital economy and carbon emissions. The findings contribute to the development of more targeted and precise policy frameworks, supporting urban sustainability efforts [
26].
The results indicate that a circular economy driven by the digital economy, digital infrastructure, and e-commerce and logistics optimization plays a crucial role in urban carbon emission reduction. This study extends existing research by integrating Decision-Making Trial and Evaluation Laboratory and Interpretive Structural Modeling (DEMATEL-ISM), offering a structured approach to analyze the interdependencies among key factors. Unlike previous studies that focus on correlation, this research uncovers causal relationships and hierarchical structures within the digital economy-carbon reduction nexus. The findings provide a novel analytical framework, enabling policymakers, urban administrators, and corporate entities to formulate targeted digital strategies to optimize energy efficiency, reduce emissions, and promote sustainable urban ecosystems. By identifying 13 critical factors and their dynamic interactions, this study enhances theoretical understanding and offers practical decision-making tools for achieving low-carbon urban transformation. The proposed approach supports the design of evidence-based policies that accelerate the adoption of green digital innovations. These insights help cities strengthen their global competitiveness in carbon mitigation and sustainable development, ensuring resilience in the face of climate challenges and evolving economic landscapes.
The structure of this study is as follows:
Section 2 reviews the relevant literature on the relationship between the digital economy and carbon emissions, identifying research gaps and highlighting the need for a more comprehensive framework to analyze their interaction.
Section 3 introduces the Decision-Making Trial and Evaluation Laboratory and Interpretive Structural Modeling (DEMATEL-ISM) methodology, demonstrating its advantages over traditional methods in capturing causal relationships and hierarchical structures among key factors.
Section 4 presents research findings, emphasizing the role of circular economy-driven digital transformation, digital infrastructure development, and e-commerce and logistics optimization in mitigating urban carbon emissions.
Section 5 discusses these findings in relation to existing studies, elaborating on how our research extends prior work by integrating circular economy theory and behavioral economics theory to provide a structured analytical framework. This section also explores the implications of our findings for policy and business strategies aimed at enhancing urban sustainability. Finally,
Section 6 summarizes the study’s main theoretical and practical contributions, acknowledges its limitations, and proposes future research directions, particularly emphasizing the potential for broader applications of our framework in diverse urban contexts and industries.
3. Research Methodology
3.1. Methodological Framework
This study underwent a rigorous screening process to identify 13 key factors that influence urban carbon emissions in the digital economy. First, an extensive literature review was conducted using databases such as Google Scholar, Web of Science, and Scopus. This ensured a comprehensive review of previous research on the interaction between carbon emissions and the digital economy. The review identified a broad range of potential factors relevant to the study. Expert assessment was also incorporated to refine and validate the screening results. Three senior experts with more than ten years of experience in the digital economy, urban sustainability, and carbon emissions management were interviewed. Their insights confirmed the relevance and importance of the identified factors and ensured alignment with global regulations, industry standards, and emerging best practices. In addition, the factors were further cross-validated against the principles of circular economy theory and behavioral economics theory. This strengthened their theoretical foundation and relevance to urban carbon reduction strategies. Although this study focuses on 13 key factors, the selection process was guided by rigorous qualitative analysis, expert consensus, and theoretical validation, rather than sample size alone (see
Table 1).
In the second phase of the study, the researchers contacted more than 100 institutions in the fields of digital economics and urban low-carbon development in China, and finally identified 38 potential expert participants. After an initial email introduction to the research background, 22 individuals agreed to participate. However, due to scheduling conflicts, only 13 experts successfully completed the survey. To improve reliability and reduce subjectivity, the study took a number of rigorous measures. Experts were carefully selected based on their extensive experience in digital economy applications and carbon emission reduction policies, ensuring representation from academia, industry, and policymaking.
Table 2 provides demographic information on the participating experts.
After recruiting experts, this study quantitatively assessed 13 critical success factors using a Likert-scale questionnaire (from 0 = “no influence” to 4 = “strong influence”). To ensure clarity and relevance, the questionnaire was carefully designed through a systematic literature review and preliminary expert consultation. Initially, a matrix filling method was used, but expert feedback indicated that it was difficult to accurately match factor codes with descriptions. To address this issue, the method of the Likert Five-Point Scale was used, supplemented by detailed explanations to improve understandability. This structured approach greatly improved the clarity, repeatability, and transparency of expert assessments.
Appendix A presents a sample response from one of the experts to the questionnaire, showcasing their evaluation of factor influence scores, which serve as the basis for the DEMATEL analysis. The table follows a standardized Likert-scale scoring system (0 = ‘No Influence’, 4 = ‘Strong Influence’), where higher scores indicate stronger relationships between factors. Each row represents an influencing factor, and each column represents the influenced factor, with direct influence flowing from row factors to column factors. This structured format ensures clarity in presenting causal relationships and reduces ambiguity in interpretation. By leveraging expert judgment and structured scoring, it provides a transparent, data-driven foundation for subsequent analyses, facilitating a deeper understanding of how these factors interact and influence urban carbon emission reduction through the digital economy.
Reducing urban carbon emissions is a complex, multifaceted challenge involving numerous interconnected factors. While traditional quantitative models such as the Analytic Hierarchy Process (AHP) and Structural Equation Modeling (SEM) provide valuable analytical support, they are often limited in capturing the multidimensional interactions and hierarchical dependencies among these factors. In contrast, the Decision-Making Trial and Evaluation Laboratory and Interpretive Structural Modeling (DEMATEL-ISM) approach offers a comprehensive framework that allows for an in-depth examination of both causal relationships and hierarchical structures within the system [
43,
44,
45,
46,
47,
48]. This makes DEMATEL-ISM particularly suitable for assessing the role of the digital economy in reducing urban carbon emissions, as it enables the identification of direct and indirect influences among key success factors (
Table 3).
The DEMATEL method was employed to quantify and visualize the interdependencies between the 13 identified key success factors in the digital economy’s contribution to carbon reduction. Expert evaluations were collected using a structured Likert-scale questionnaire, where factors were assessed based on their level of influence on one another. The responses were then used to construct a direct influence matrix, which was normalized to ensure consistency across different factor evaluations. Through matrix operations, the total influence matrix was derived, revealing both direct and indirect interactions. Factors were then categorized based on their influence degree scores, distinguishing between causal factors that drive the system and effect factors that are primarily influenced by others. This process provided a clear understanding of the underlying mechanisms through which the digital economy contributes to carbon reduction.
Following the DEMATEL analysis, Interpretive Structural Modeling (ISM) was applied to further structure these relationships hierarchically [
24]. The influence matrix was transformed into a reachability matrix by setting a threshold to filter out insignificant relationships. Through this process, the hierarchical structure of the key success factors was established, differentiating fundamental drivers from secondary impact factors. The final ISM framework provided a structured representation of how digital economy enablers interact to drive urban carbon reduction.
By integrating DEMATEL and ISM, this study systematically revealed the complex interplay between digital economy factors and their impact on urban carbon emissions. The analysis highlighted that circular economy-driven digital transformation, digital infrastructure, and e-commerce and logistics optimization are the most influential factors in reducing urban carbon emissions. Additionally, elements such as smart city infrastructure, energy-efficient technologies, and digital payments played supporting roles in facilitating broader systemic improvements in urban carbon management. The hierarchical ISM model demonstrated that fundamental enablers, such as investments in digital infrastructure and industry digitalization, drive changes in other factors, ultimately leading to effective carbon reduction.
This approach enhances the rigor of the study by addressing concerns about subjectivity in expert evaluations. While expert opinions were critical in constructing the initial influence matrix, the use of structured matrix calculations, threshold-based filtering, and hierarchical structuring ensured that the results were not solely reliant on subjective judgment. The combination of DEMATEL and ISM also provided a methodological advantage over traditional statistical techniques by capturing both causal dynamics and structural dependencies, making it a robust tool for assessing policy and strategic interventions in the digital economy’s role in urban carbon reduction.
3.2. Research Approach and Techniques
As the DEMATEL-ISM method involves multiple steps and calculations, we present the overall process flow in
Figure 1 and detail the procedures below.
The following explains DEMATEL-ISM’s method. In the first step, the direct influence matrix, we use expert scoring to compare the influence of
on
, with no self-influence, so the diagonal elements are 0. This comparison yields the direct influence matrix
, as follows:
In Step 2, the normalized influence matrix, while there are various normalization methods, this paper adopts the row maximum method. First, we sum each row of matrix
, then take the maximum value from these sums. Then, we divide all elements in matrix
by this maximum value to obtain the normalized influence matrix
as follows:
Step 3 is the comprehensive influence matrix. It reflects the overall effect of interactions between elements within the system as follows:
In this equation, represents the identity matrix.
Step 4 calculates each factor’s influence degree, influenced degree, centrality, causality, and weight. The influence degree refers to the sum of each row in matrix
, representing the overall influence of each factor on all other factors. We denote it as
:
The influenced degree refers to the sum of each column in matrix
, representing the overall influence of each factor from all other factors, denoted as
Centrality represents the position of a factor within the evaluation system and the magnitude of its role. The centrality of a factor is the sum of its influence degree and influenced degree, denoted as
:
We obtain causality by subtracting the influenced degree from the influence degree of a factor, denoted as
By normalizing the centrality, we can obtain each factor’s weight.
In Step 5, we draw the causal relationship diagram by plotting the centrality on the horizontal axis and the causality on the vertical axis.
Next, in Step 6, we calculate the reachability matrix. The overall influence matrix is
, where
is the comprehensive influence matrix, and
is the identity matrix. In matrix
we set values smaller than the threshold
to 0, and all others to 1, yielding the reachability matrix
This study determined the value of by the average of the comprehensive influence matrix.
Step 7 involves calculating the reachability set, antecedent set, and intersection. We calculate the reachability set using . The columns with a value of 1 in each row correspond to the factors that we can start from the given factor. The antecedent set is . The rows with a value of 1 in each column correspond to the factors that can reach the given factor. Then, we calculate the intersection using .
Finally, there is factor layering. When a factor satisfies , it indicates that the factors in are at the highest level. At this point, we delete the rows and columns corresponding to the factors in from the reachability matrix . Then, we recalculate the reachability set, antecedent set, and intersection. We repeat this process to determine the next layer until we can fully classify all factors, eventually forming the hierarchical structure of the factors.
The mapping of full terms to abbreviations in influence and causality analysis is provided in
Appendix B.
4. Results
Table 4 and
Table 5 were created in accordance with Steps 1 to 5. In particular,
Table 6 describes the results of the factor analysis and lists the multiple attributes of the 13 factors (S1 to S13). These attributes include the degree of influence of each factor on other factors and results, the degree of influence of each factor, centrality, causality, and weight, as well as their ranking and classification (into cause or result factors). By comprehensively analyzing these attributes, this study can better understand their role.
Table 6 presents the influence analysis of key digital economy factors using the DEMATEL method. The analysis evaluates each factor based on four key aspects: influence degree (D), influenced degree (R), centrality (D + R), and causality (D − R). Influence degree reflects how much a factor affects others, while influenced degree indicates how much a factor is affected by others. Centrality represents the overall importance of the factor within the system, and causality shows whether a factor is a driving force or a result factor. A positive causality value (D − R > 0) identifies “cause” factors, which primarily drive change in other factors, while a negative causality value (D − R < 0) classifies the factor as a “result”, meaning it is mostly influenced by other factors. The ranking is determined by the computed weights, highlighting the relative importance of each factor in the digital economy system.
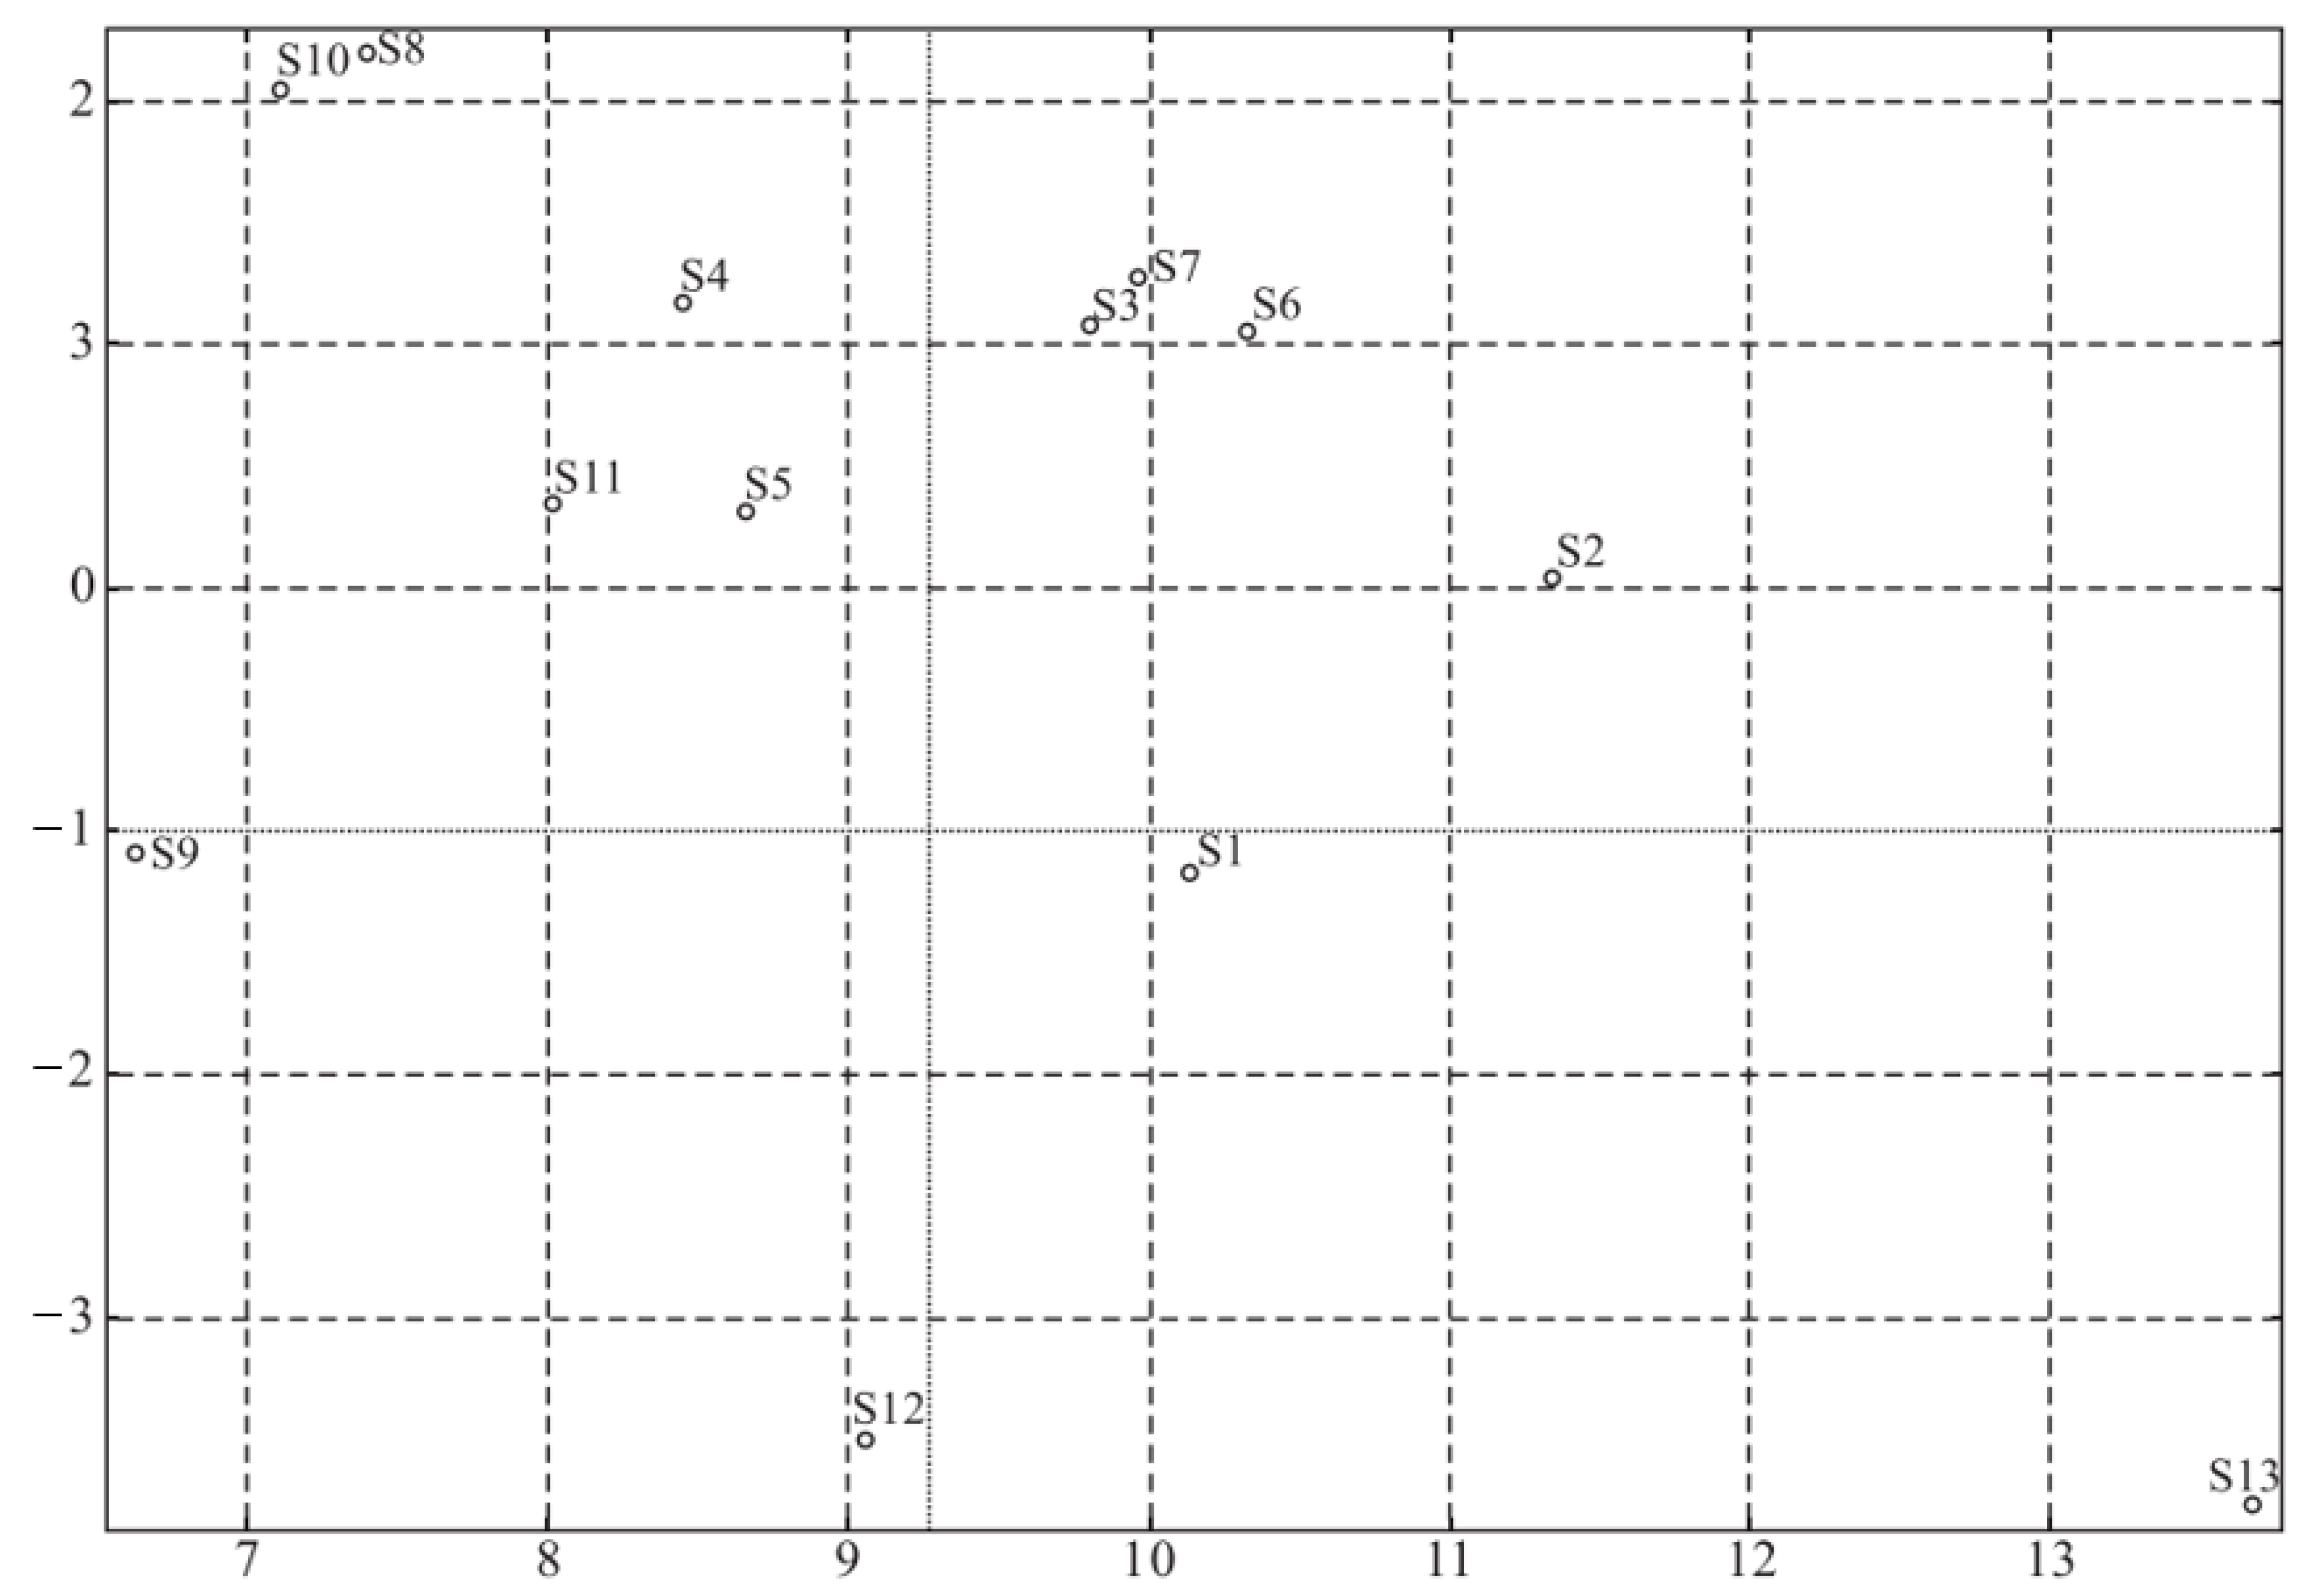
This study draws a causal relationship diagram (
Figure 2), in which the horizontal axis represents centrality, and the vertical axis represents causality.
This study analyzed the key factors that enable the digital economy to reduce urban carbon emissions using the expert evaluation method and DEMATEL-ISM model, deriving key indicators such as influence degree, influenced degree, centrality, and weight. S13 ranks first with the highest centrality (13.67506) and weight (0.1134), indicating its central role in the system. Adopting a circular economy model in urban areas can reduce resource utilization and waste production, consequently mitigating carbon emissions. This finding underscores the pivotal role of the digital economy in promoting resource recycling, diminishing urban waste, and enhancing energy efficiency [
39]. Although S13 has a negative causality degree (−3.76528), identifying it as a result factor indicates that the realization of the circular economy depends on other driving factors, but its importance in reducing carbon emissions is undeniable.
S2 ranks second with a weight of 0.09407 and centrality of 11.34417, highlighting its foundational role in supporting urban carbon reduction efforts. Improving digital infrastructure provides robust technological support for smart city construction, intelligent transportation, energy management, and other areas. Particularly, its positive causality degree of 0.03699 shows that digital infrastructure influences the performance of other factors and plays a core role in driving the efficient operation of the overall system. Therefore, cities should prioritize developing and upgrading digital infrastructure in future low-carbon development to provide more efficient technical support and promote intelligent carbon emission management.
S6 is third, with a weight of 0.08565 and a centrality of 10.3283. E-commerce and logistics optimization contribute significantly to reducing transportation-related carbon emissions in cities. As e-commerce grows, optimizing logistics and delivery becomes a key avenue for reducing carbon emissions. The positive causality degree of S6 (1.05286) indicates that it effectively reduces carbon emissions and minimizes energy consumption and the carbon footprint in transportation processes through optimized logistics workflows. In the current global rapid e-commerce growth, cities can significantly lower emissions from transportation by advancing the optimization and digitalization of logistics systems, thereby reducing overall urban carbon emissions.
In addition to the three primary key factors, the remaining factors contribute significantly to reducing urban carbon emissions and supporting the effective functioning of the entire digital economy ecosystem. For instance, S1 ranks fourth with a weight of 0.08409 and a centrality of 10.14088. The construction of smart cities, through the integrated use of technologies such as the Internet of Things (IoT), big data, and artificial intelligence (AI), enables cities to become more intelligent and efficient in energy use, transportation management, and emissions monitoring, ultimately achieving optimized carbon emission management. Despite its negative causality (−1.1663), S1 remains a key component of low-carbon urban development as a result of factors influenced by other factors.
Closely related to S1 is S7, which ranks fifth with a weight of 0.0826 and a centrality of 9.9605. Remote work and virtual meetings can reduce commuting demand, reducing transportation-related carbon emissions. Especially in the context of the pandemic, this working mode significantly alleviated urban traffic pressure, becoming an important measure for carbon reduction. S3 and S4 rank sixth and ninth, respectively. S3, with a weight of 0.08135, centrality of 9.80999, and positive causality of 1.07769, shows that industrial digital transformation directly promotes carbon reduction. By introducing digital technologies to optimize production processes and energy management, industries can significantly reduce energy consumption and improve resource utilization, thereby reducing carbon emissions. Similarly, S4, by applying smart grid technology, better regulates energy supply and demand, avoiding energy waste and optimizing energy efficiency. Despite its relatively lower weight (0.07011), implementing smart grids is pivotal in decarbonizing the urban energy system.
Additionally, S5 and S11 also contribute in their respective fields. S5 is eighth with a weight of 0.07183. By promoting green travel and intelligent transportation systems, cities can reduce vehicle exhaust emissions, thus reducing carbon emissions at the source. Meanwhile, S11 provides technical support for monitoring and evaluating urban carbon emissions, helping cities develop effective carbon reduction policies. Its weight is 0.06644, with a centrality of 8.01245.
Finally, S8 and S12 rank eleventh and seventh, respectively. S8, with a centrality of 7.40657, has a lower weight (0.06142), but it still positively impacts carbon emissions by improving efficiency and reducing energy consumption through intelligent urban management. S12, through paperless offices and digital payments, helps reduce resource consumption. Although its causality is negative (−3.49705), we cannot overlook its role. Thus, while these factors rank slightly lower than the top, they are all important in specific contexts. Particularly through digital applications and optimizations across various domains, these factors further facilitate reductions in urban carbon emissions.
Through a detailed analysis of each factor above, along with key indicators such as degree of influence, centrality, and weight, it is evident that various critical factors of the digital economy significantly contribute to reducing urban carbon emissions. Notably, factors including the circular economy propelled by the digital economy, the development of digital infrastructure, and the optimization of e-commerce and logistics channels directly and indirectly facilitate the reduction of carbon emissions [
29]. Other key factors, such as smart city construction, remote work, and industrial digital transformation, also positively impact the emission reduction process differently. These results indicate that the synergistic effect of various elements of the digital economy can effectively promote low-carbon urban development [
10].
Next, in order to further clarify the hierarchical relationships and interactions between these factors, this study established an overall impact matrix (
Table 7) and an accessibility matrix (
Table 8) based on steps 6 to 8. A hierarchical structure diagram was also drawn for visual analysis (
Figure 3). This diagram illustrates the hierarchical role of each factor and clarifies the causal dynamic relationship between core and supporting factors. This visualization helps to understand how the optimization of the constituent elements of the digital economy can effectively manage the mechanism of urban carbon emissions.
5. Discussion
The rapid growth of the global digital economy has significantly influenced urban carbon emissions. This study comprehensively examined the key success factors of the digital economy in mitigating urban carbon emissions, employing the expert evaluation method and the Decision-Making Trial and Evaluation Laboratory and Interpretive Structural Modeling (DEMATEL-ISM) approach for quantitative and qualitative analyses across multiple dimensions. Specifically, the study systematically analyzed the complex relationships of 13 relevant factors across three key dimensions: (1) digital infrastructure and technology applications, (2) digital transformation of industry and the economy, and (3) sustainable development and green city construction. This study constructs a comprehensive analytical framework that combines theories of the circular economy and behavioral economics to provide an in-depth interpretation of these factors and their interactions.
The results indicate that S13 (circular economy driven by the digital economy), S2 (digital infrastructure), and S6 (e-commerce and logistics optimization) are crucial in reducing urban carbon emissions. Other factors, such as smart transportation and digital green buildings, also play significant roles in the green transition process. The study identifies key factors such as digital infrastructure, e-commerce, logistics optimization, and the circular economy as critical contributors to carbon reduction. Empirical evidence suggests that cities adopting digital transformation models achieve a measurable decrease in emissions, with some reports showing reductions of up to 30% in transportation-related CO
2 emissions through AI-driven logistics [
5,
20]. The transition to smart urban energy grids has also resulted in a 20–25% improvement in energy efficiency, further reinforcing the role of the digital economy in sustainable urban development [
17,
19]. This approach enriches the theoretical understanding of the relationship between the digital economy and carbon reduction. Moreover, the research investigated the economic and strategic relevance of the digital economy in mitigating urban carbon emissions and explored its extensive effects on environmental, social, and policy aspects. The study provides practical strategic guidance to urban managers, government agencies, and businesses. It promotes sustainable urban development in the green transition, enhances leadership in global carbon reduction efforts, and contributes to achieving carbon neutrality goals.
5.1. Theoretical Implications
This study’s contributions are timely and profound across multiple dimensions. First, this research significantly expands the theoretical framework for understanding how the digital economy drives reductions in urban carbon emissions. While previous studies explored the impact of the digital economy on carbon emissions, few systematically assessed the key success factors of the digital economy in reducing urban carbon emissions [
5,
17]. This research validates [
39] conclusions and highlights the distinct applications and multi-tiered effects of the digital economy on urban carbon reduction, offering a more extensive analysis and examination of practical application scenarios. On this basis, we comprehensively identified and analyzed 13 key factors, and, by constructing an analytical framework integrating multiple theories, we deeply explored how these factors interact and influence carbon emissions. This framework offers a novel perspective for understanding the relationship between the digital economy and urban carbon emissions, thereby addressing a theoretical gap in this field.
Second, this study enhances our understanding of the digital economy’s economic, environmental, and social benefits in mitigating urban carbon emissions. Through empirical analysis of urban carbon reduction, the research elucidates the role of digital technologies in optimizing energy use, improving economic efficiency, alleviating environmental burdens, and promoting social well-being. The study identifies key factors such as digital infrastructure, e-commerce, logistics optimization, and the circular economy as critical contributors to carbon reduction [
32,
39]. This finding provides strong theoretical support for urban managers, policymakers, and businesses to achieve multidimensional carbon reduction goals. Additionally, this research provides a solid theoretical foundation for policy formulation and practical application in urban carbon reduction. It underscores the importance of achieving balance and coordination among technological advancement, economic benefits, and environmental sustainability during the transformation of the digital economy, offering valuable policymaking insights regarding the role of the digital economy in the green transition of cities [
31,
33]. Compared to studies by [
49], this research combines the expert evaluation method and DEMATEL-ISM approach to explore the complex interactive relationships between the digital economy and carbon reduction. This study used a holistic methodology to describe the mechanisms of key factors in different contexts, thereby deepening the understanding of the role of the digital economy in carbon emission reduction [
5].
Lastly, this study expands the theoretical integration perspective in the digital economy and carbon reduction research by integrating the circular economy and behavioral economics theories. The study identifies the key success factors of the digital economy in facilitating carbon reduction and, through quantitative and qualitative analyses, explores the interrelationships among these factors. This approach provides novel theoretical insights and practical pathways for policy formulation and international practices in urban green transitions. The proposed research framework provides a robust theoretical underpinning and a benchmark model for subsequent investigations and applications examining the influence of the digital economy on urban carbon emissions.
5.2. Management Application
To mitigate urban carbon emissions, city administrators, governmental entities, and corporate entities must collaborate effectively and adopt the following integrated strategies to capitalize on the potential of the digital economy.
First, city managers should establish a strategic framework centered on sustainable development, focusing on utilizing digital technologies to reduce urban carbon emissions [
5]. Specific recommendations include prioritizing investment in digital infrastructure through strategic planning and efficient resource allocation, promoting the widespread use of big data and artificial intelligence in urban management, and optimizing energy use and resource distribution [
36]. Using smart buildings and intelligent transportation systems will reduce energy consumption and improve overall urban energy efficiency. At the same time, managers should ensure that digitalization projects meet environmental sustainability standards to prevent potential negative impacts during technology implementation. Driving low-carbon transitions of cities requires technological support and comprehensive consideration of social welfare, ensuring the long-term social benefits of digital transformation [
39].
Second, government agencies are pivotal in regulation and policy guidance during the carbon reduction process facilitated by the digital economy. Governments should establish and enforce policy frameworks that facilitate digital green development, including incentive structures, tax incentives, and financial assistance to encourage businesses to invest in low-carbon technologies and advance and use renewable energy sources [
17]. Moreover, governments should promote global strategies for carbon reduction through international cooperation and agreements and establish strong regional management frameworks to ensure the effective implementation of policies and regulations. By promoting public awareness regarding the interplay between the digital economy and carbon mitigation via campaigns and educational programs, governments should incentivize various sectors to participate in green transition initiatives, thereby realizing a synergistic benefit for environmental conservation and economic advancement.
Finally, businesses are critical in reducing carbon through the digital economy, particularly in advancing industrial digital transformation. Enterprises should integrate green transitioning into their strategic frameworks, utilizing big data analytics, the Internet of Things, and intelligent technologies to refine production methodologies, enhance energy utilization, and diminish the carbon footprint. For example, companies can optimize logistics and transportation systems through digital supply chain management, thus reducing fuel consumption and environmental pollution [
10]. Additionally, businesses should actively invest in renewable energy technologies and smart equipment to advance the greening of production. Employees should train regularly on low-carbon technologies and digital skills to raise environmental awareness and improve technical capabilities, ensuring the company’s competitive advantage during digital transformation [
29]. These integrated strategies enable city administrators, governmental entities, and corporate entities to address the challenges associated with urban carbon emissions, harness the prospects offered by the digital economy, and propel sustainable urban development objectives.
6. Conclusions
In conclusion, this study has provided a comprehensive analysis of the key success factors of the digital economy in mitigating urban carbon emissions. By employing a combination of expert evaluation and DEMATEL-ISM approaches, we have systematically examined the complex relationships among 13 relevant factors across three key dimensions: digital infrastructure and technology applications, digital transformation of industry and the economy, and sustainable development and green city construction. The findings highlight the critical roles of digital infrastructure, e-commerce and logistics optimization, and the circular economy driven by the digital economy in reducing urban carbon emissions. Additionally, the study underscores the importance of smart transportation and digital green buildings in the green transition process.
This study has several limitations in assessing the key factors associated with the role of the digital economy in mitigating urban carbon emissions. First, while this study’s DE-MATEL-ISM combines both qualitative and quantitative analysis, the accuracy of its results still depends on the subjective judgments of experts. This reliance may introduce bias and uncertainty, particularly in selecting experts and evaluating key factors, where personal experience and cognition can influence the weighting of factors and the determination of causal relationships. Future research could enhance the model’s accuracy by incorporating more data-driven methods, such as big data analysis and machine learning techniques, to minimize the impact of subjective judgment.
Secondly, the relationship between the digital economy and carbon emissions may vary across regions due to differences in economic structures, cultural contexts, and policy frameworks. Therefore, future research should broaden the sample to include a wider range of cities with diverse regional characteristics, thereby improving the generalizability and relevance of the findings.
Additionally, while this study identified and analyzed 13 key factors, future research could further expand the theoretical framework to explore additional factors and their interactions. By applying strategic analysis frameworks such as the political, economic, social, technological, environmental, and legal (PESTEL) or goal, reality, options, and way forward (GROW) approaches, scholars could conduct a comprehensive assessment of the digital economy’s multifaceted contribution to carbon mitigation across various dimensions, including political, economic, social, technological, environmental, and legal aspects. These frameworks would help identify potential driving forces and facilitate the modeling of complex interdependencies between the digital economy and urban environmental, economic, and social elements.


