Article

The Impact of Environmental Regulation on the Growth of Small and Micro Enterprises: Insights from China

1
College of Rural Revitalization, Fujian Agriculture and Forestry University, Fuzhou 350002, China
2
College of Digital Economy, Fujian Agriculture and Forestry University, Quanzhou 362406, China
3
College of Economics and Management, Fujian Agriculture and Forestry University, Fuzhou 350002, China
*
Author to whom correspondence should be addressed.
Sustainability 2025, 17(5), 2118; https://doi.org/10.3390/su17052118
Submission received: 4 December 2024 / Revised: 24 February 2025 / Accepted: 25 February 2025 / Published: 28 February 2025

Abstract

:
Small and micro enterprises (SMEs) make important contributions to economic development, innovation, and employment in every country. The increasingly strict environmental regulations have become a global trend, but the empirical literature that evaluates the impacts of environmental regulations on the SMEs’ growth based on their observational data is extremely rare. This study aims to investigate how city-level environmental regulations in China affect the SMEs’ growth, with a focus on identifying lag effects, heterogeneous impacts across regions/enterprise types, and the mediating roles of technological innovation and policy support, using unbalanced panel data from 2007 to 2016. Using a dynamic panel model and entropy-weighted assessment, the results show the following: (1) Stricter environmental regulations significantly impede SMEs’ growth, with this effect persisting for up to two years. Robustness tests confirm the stability of these findings. (2) Despite the overall negative impact, our analysis reveals that environmental regulations can stimulate SMEs’ growth by promoting technological innovation and increasing policy support. (3) Heterogeneity analysis shows that the regulatory effects vary by region, ownership structure, and tax status, with the most adverse impacts observed in private firms, small-scale taxpayers, and businesses outside the Yangtze River Economic Belt. These findings highlight the need for differentiated regulatory approaches to balance environmental objectives with SMEs’ growth. The study is limited by its focus on data from 2007 to 2016, not considering recent policy shifts, and may have limited generalizability to economies with decentralized environmental governance.

1. Introduction

SMEs play a crucial role in economic growth by driving innovation, creating jobs, and developing new productive capacity. They are vital to fostering widespread prosperity. During the implementation of China’s “13th Five-Year Plan”, more than 90% of newly registered tax-related companies were SMEs, totaling approximately 52 million businesses and contributing significantly to the economy. SMEs account for over 80% of jobs, 70% of innovation, 60% of GDP, and 50% of tax revenue. Moreover, larger businesses heavily rely on SMEs for auxiliary services throughout their supply chains. The Chinese government has placed significant emphasis on the growth of SMEs, recognizing their importance, as highlighted by General Secretary Jinping Xi in the report of the 20th National Congress. Therefore, understanding the factors that support or hinder SMEs’ growth is essential for formulating well-informed policy decisions [1,2,3].
Environmental regulation is a key factor influencing the expansion of SMEs. According to the Porter Hypothesis, such regulations can stimulate innovation by generating “compensatory effects” and “first-mover advantages” that reduce costs and enhance competitiveness, thereby fostering growth [4]. In contrast, the Compliance Cost Theory argues that such regulations increase manufacturing costs, reduce research and development (R&D) investments, lower profits, and ultimately undermine competitiveness [5,6]. SMEs are particularly vulnerable, as they already face challenges such as high costs, limited scalability, and financing difficulties. Between 2008 and 2016, the average operating cost ratio for SMEs in the sample exceeded 90%, underscoring the significant cost pressures they face. As a result, many SMEs may encounter financial strain or even insolvency due to environmental policies that exacerbate these constraints [7]. Therefore, it is essential to examine how regional environmental regulations impact SMEs’ growth in order to inform policies aimed at alleviating these challenges and promoting sustainable development [8,9].
Few studies have examined the influence of environmental regulations on SMEs’ growth; most have concentrated on elements including inclusive financing, digital technologies, the business environment, and tax incentives [10,11]. There is a knowledge vacuum about how SMEs are affected by strict environmental regulations, because most studies have been based on the data of industrial enterprises above designated size and publicly traded companies [12]. According to the Porter Hypothesis, earlier research centered on innovation as the path through which environmental regulations affect enterprise growth. Given that most countries have compensation mechanisms for strict regulations, few studies examine how they ease economic impacts [13,14]. Furthermore, research on the strictness of environmental regulations frequently ignores the impact of local industrial structures, which results in inaccurate measurements [15]. For instance, in prefecture level cities where highly polluting industries are concentrated, the government will inevitably mention more words related to environmental protection in their annual work reports, but this does not mean stricter environmental supervision practices.
By including regional industrial upgrading into conventional environmental regulatory measurements and building a dataset covering cities, SMEs, and time at the prefecture level, this study fills these gaps. We investigate the causes and effects of environmental legislation on the growth of SMEs using a dynamic panel data model, augmented by robustness and heterogeneity tests [16,17]. The key academic contributions are as follows: First, this study evaluates the actual impact of regional environmental regulations on SMEs’ growth and explores the potential pathway of “environmental regulation → policy support → SMEs’ growth” [18,19]. It provides useful information for policy formulation by evaluating whether SMEs in areas with more stringent environmental regulations receive greater policy support to lessen external shocks. Second, an imbalanced panel dataset of SMEs from 2007 to 2016 is used in the research, which provides a more thorough assessment than widely used datasets that fall short in including SMEs, such as the “China Industrial Enterprise Database”. As a result, the results are more timely and representative [20]. Third, this paper integrates regional industrial upgrading into environmental regulation measures, which excludes the noise from various industrial configurations, achieving a more accurate and scientifically supported measurement of regulatory rigor.

2. Literature Review

Existing studies on the impact of environmental regulation on firm growth can be roughly divided into three categories. The first category of studies evaluates the influence of environmental regulation on firm growth using a variety of indicators, such as regional environmental protection intensity, pollutant emissions, and the number of environmental regulations [1,21]. Although these studies provide useful empirical insights, they often have methodological limitations, such as not considering differences in regional industrial structure and polluting industry density, which may lead to measurement errors. These shortcomings of ignoring regional economic and environmental diversity may lead to biased results. In addition, these studies often focus on large industrial enterprises, limiting their applicability to small- and medium-sized enterprises (SMEs), as the size and flexibility of SMEs may cause them to respond differently to environmental regulation. This study fills these gaps by incorporating regional industrial structure into the analysis and specifically studying SMEs, providing a more nuanced understanding of how environmental regulation affects small firms [22].
The second category of studies focuses on evaluating the influence of specific environmental policies on firm growth, using data on industrial enterprises and listed companies [23,24]. These studies empirically evaluate the influence of targeted policies such as low-carbon pilot programs on firms. However, the datasets used in these studies are often limited to specific industries, weakening the generalizability of their findings. In addition, these studies mainly focus on large industrial enterprises or listed companies with abundant resources, which are more able to adapt to environmental policies. This study overcomes these limitations by using a broad dataset of SMEs (2007 to 2016) and provides more relevant and timely insights into the influence of environmental regulation on SMEs’ growth [25,26].
The third category of studies uses environmental regulation as a control variable or a moderating variable. For example, some studies have explored the moderating effect of environmental regulation on corporate green innovation, but they often ignore the endogeneity problem, which may affect the accuracy of their conclusions [27,28]. Ignoring endogeneity may lead to biased estimation results because environmental regulation is likely to be affected by economic performance and corporate characteristics. This study addresses this issue by adopting the System Generalized Method of Moments (System GMM) model, which can deal with potential endogeneity problems and provides more reliable estimates of the relationship between environmental regulation and SMEs’ growth [29].
Regarding the factors affecting SMEs’ growth, existing studies have mainly focused on inclusive finance, digital technology, tax incentives, and business environment [30,31]. While these studies provide important insights for policy design, relatively few empirical studies have examined the influence of environmental regulation on SMEs’ growth. Since SMEs typically lack the resources of large firms, they may be more vulnerable to the increased costs of environmental regulation. This study fills this gap by analyzing in detail the influence of environmental regulation on SMEs’ growth, particularly by examining how regulation affects firm behavior through mechanisms such as technological innovation and policy support [32].
In addition, regional environmental regulation is a key factor affecting the operating costs of SMEs, and its impact on SMEs’ growth has therefore become a focus of global scholars. For example, studies using data from SME- and GEM-listed companies and small sample survey data have empirically tested a significant U-shaped relationship between environmental regulation and green innovation [33,34]. However, the data that these studies rely on may not fully represent the broader group of SMEs, and the limited sample size weakens the generalizability of their conclusions. In addition, some studies have explored firm size heterogeneity and assessed the influence of environmental regulation on SMEs’ growth, but their conclusions are based on large firms and may not be applicable to SMEs. This study improves on the shortcomings of previous studies by using a larger and more representative dataset and focusing on SMEs, which enables a more accurate understanding of the differences in SMEs’ responses to environmental regulation [35].
The mechanism of how regional environmental regulation affects enterprise growth is also a focus of academic research. Existing studies have explored the path of “environmental regulation → technological innovation, product innovation and production innovation → enterprise growth” based on the “Porter hypothesis (Stringent environmental regulations can drive innovation in firms, thereby enhancing their competitiveness.)” [36,37]. Although these studies highlight the potential of environmental regulation to promote innovation, they often fail to consider the different abilities of enterprises, especially SMEs, to use innovation when responding to regulations. In practice, many regions and countries have implemented compensatory policies to reduce the burden of strict environmental regulations [38]. It is crucial to verify whether government subsidies or preferential policies can become a key mechanism to mitigate the negative effect of environmental regulations on SMEs. This study further deepens research in this area by examining the path of “environmental regulation → policy support → SMEs’ growth” [39]. Although some studies have explored this topic, they still face challenges in data universality and representativeness. This study overcomes these limitations by using a broader dataset and focusing on policy mechanisms that support SMEs’ growth [19,20,40,41,42].

3. Mechanism Analysis and Research Hypothesis

To systematically explore the effect mechanism of environmental regulation on the growth of SMEs, this chapter will start from two aspects: theoretical analysis and hypothesis derivation. In the subsequent sections, we first discuss the direct influence of environmental regulation on enterprise growth, and then further explore how potential mediating mechanisms and external factors play a role in this production. Through these analyses, this study proposes a series of hypotheses to lay the foundation for the empirical research.

3.1. Theoretical Analysis and Research Hypothesis

Grounded in neoclassical economics, this theory posits that environmental regulations impose direct costs (e.g., pollution abatement investments) and indirect costs (e.g., diverted R&D funds), reducing firms’ profitability and competitiveness—particularly for SMEs with limited resources [43]. This section conducts a theoretical analysis of the relationship between environmental regulation and enterprise growth and explores the mechanism of regulation through indirect paths such as technological innovation and policy support.

3.1.1. Direct Impact of Environmental Regulation on SMEs’ Growth

Prior studies predominantly apply these theories to large firms [44], leaving SMEs’ responses underexplored. Two critical gaps emerge: Scale Sensitivity: SMEs’ thin profit margins amplify compliance costs, but their agility may facilitate faster innovation adoption. Policy Reliance: Unlike large firms, SMEs disproportionately depend on government support to absorb regulatory shocks [45], suggesting that policy buffers may play a larger mediating role. Based on the theoretical framework, we formulate the following hypotheses:
H1a: 
Environmental regulation has a significant negative influence on SMEs’ growth.
H1b: 
Environmental regulation has a significant positive influence on SMEs’ growth.
H2: 
Environmental regulation mitigates the negative influence on SMEs’ growth by increasing investment in technological innovation.
H3: 
Environmental regulation mitigates the negative influence on SMEs’ growth through increased policy support.
Under the neoclassical environmental economics framework, environmental pollution is recognized as a significant negative externality, leading to resource misallocation and social welfare losses. To address this market failure, governments implement environmental regulations to internalize the external costs of firms’ activities [46]. According to the Compliance Cost Hypothesis, stringent environmental regulations increase firms’ compliance costs, thereby inhibiting SMEs’ growth. First, such regulations elevate production costs for SMEs, requiring ongoing investments in pollution control equipment and clean production facilities. This undermines their cost advantages, reduces total assets, and disrupts stable operations and growth. Second, environmental regulations create a “crowding-out effect”, diverting funds from other productive investments, which diminishes resource allocation and hampers SMEs’ growth. Limited cash flow forces SMEs to prioritize pollution control over other critical areas, weakening productivity and innovation, reducing revenue, and limiting market share. Third, SMEs, with generally lower environmental awareness and investment, often become the focus of regulatory scrutiny. In pursuit of environmental targets, local governments may impose stricter enforcement measures, such as fines, production suspensions, or even closures. Additionally, SMEs’ relatively lower contributions to GDP and tax revenues, along with weaker safety standards, further exacerbate their disadvantaged position in regulatory implementation, harming their market image and reputation. This results in both short-term operational challenges and long-term suppression of sustainable growth, framing the relationship between environmental regulations and SMEs’ growth as a “zero-sum game”. Thus, hypothesis H1a is proposed.
In contrast to the zero-sum view, Porter (1990) [47,48,49] proposed the “Innovation Compensation Effect” and “First-Mover Advantage Theory”, suggesting a potential “win-win” outcome where environmental regulation fosters economic growth. The Porter Hypothesis posits that while environmental regulations may raise short-term production costs, they also drive firms to innovate in technology, production, and management, alleviating cost pressures and promoting growth. First, stringent regulations stimulate innovation, helping SMEs offset the costs imposed by compliance. Over time, innovation enhances product differentiation, improves production, increases resource efficiency, and reduces long-term environmental compliance costs, thereby boosting competitiveness and fostering growth. Second, environmental regulations can provide a first-mover advantage to SMEs that quickly adapt to green market demands. With their inherent flexibility, SMEs can rapidly implement efficient environmental technologies and management systems, improving their corporate image and driving business expansion, revenue, and asset growth [50]. Third, regulations encourage product innovation, enabling SMEs to develop environmentally friendly products that cater to growing consumer preferences for green solutions, thereby enhancing brand value and expanding market share. Additionally, regulatory shifts may trigger industry consolidation, allowing SMEs to leverage mergers and acquisitions to scale up and accelerate growth. Therefore, hypothesis H1b is proposed.

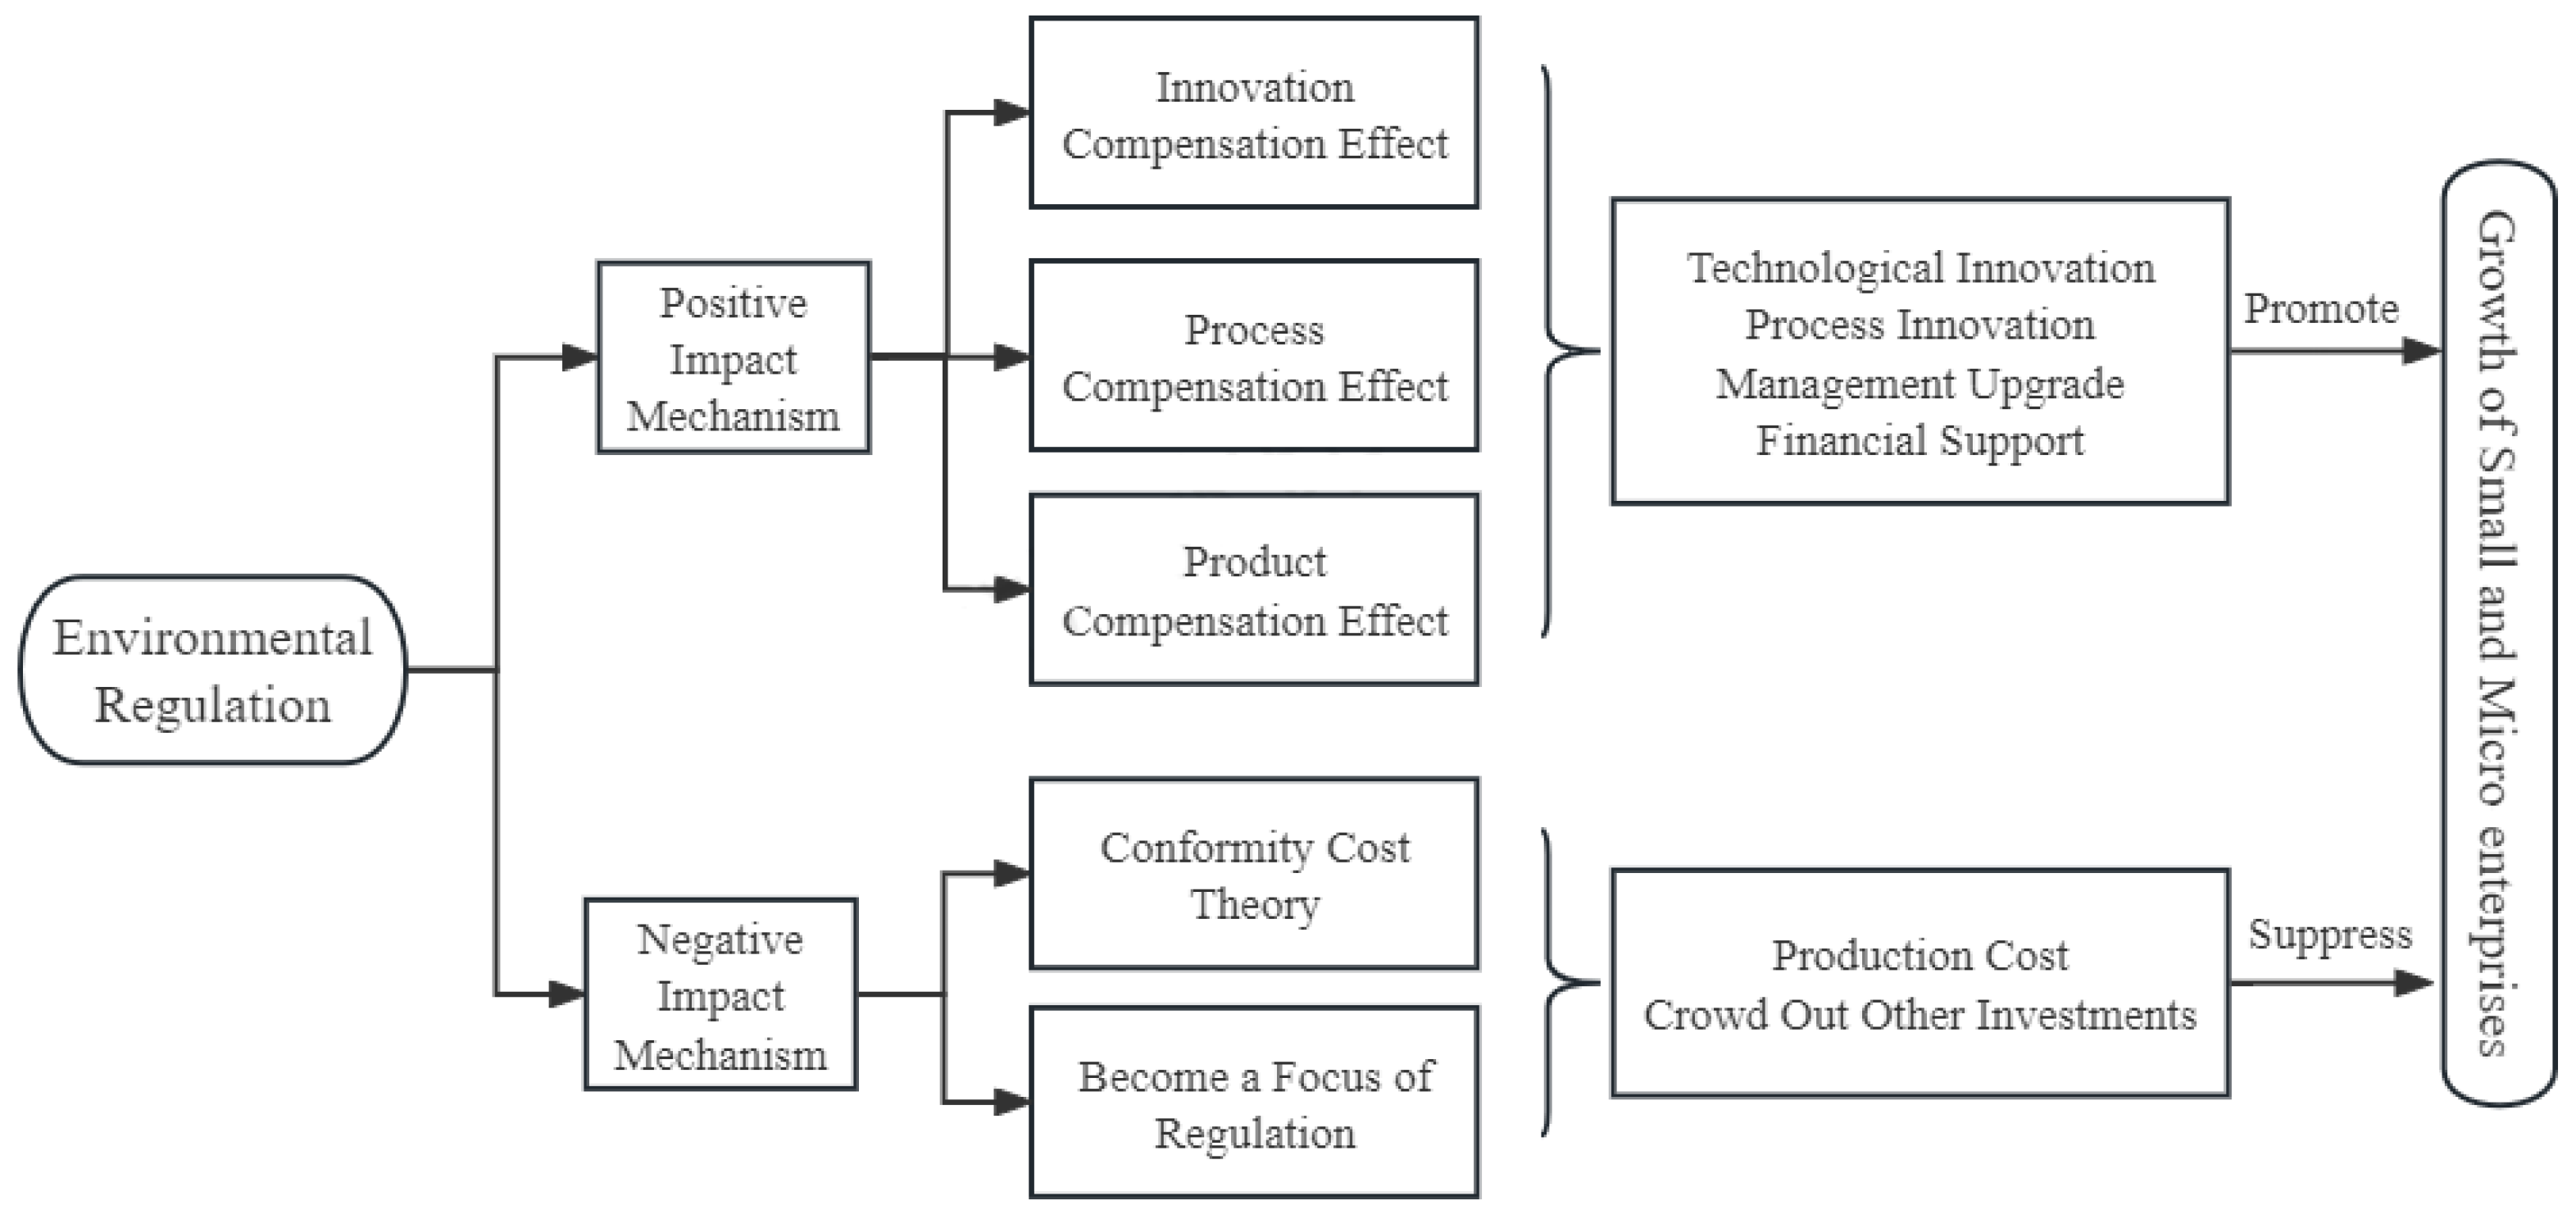
3.1.2. Mechanism Analysis of the Influence of Environmental Regulation

Environmental regulation indirectly promotes SMEs’ growth by driving increased investment in technological innovation. According to the Schumpeterian growth model, technological innovation is a key driver of firm growth, and investment in innovation serves as the internal engine for sustainable development. Stringent environmental regulations compel SMEs to increase their investment in innovation, thereby enhancing technological output and fostering growth. The specific mechanisms are as follows: First, under the pressure of strict regulations, SMEs reallocate production capital, diverting it towards technological innovation to meet compliance requirements. This shift in investment drives the adoption of environmental technologies, improving production efficiency and ultimately promoting growth. Second, stringent regulations accelerate the dissemination of green technology information, encouraging SMEs to innovate in environmentally friendly technologies. Facing survival pressures, SMEs continuously invest in green innovation, improve resource utilization, and enhance their competitiveness, which in turn supports growth. Third, strict environmental regulations increase consumer and investor support for environmentally responsible firms, providing market incentives for SMEs to innovate. Early breakthroughs in green technology allow SMEs to capture market share, build brand advantages, increase profitability, and drive sustainable growth. Therefore, hypothesis H2 is proposed.
Environmental regulation also indirectly supports SMEs’ growth by increasing access to policy support (Figure 1). According to resource-based theory, a firm’s competitive advantage is rooted in its unique resources and capabilities. Compensatory policies—such as tax incentives, fiscal subsidies, and loan support—accompanying environmental regulations provide SMEs with greater access to external resources, fueling growth. The specific mechanisms are as follows: First, the government may offer tax relief to firms that excel in green technology innovation and production improvements, reducing their tax burdens and promoting growth. Second, fiscal subsidies under stringent environmental regulations provide direct capital injections into innovative firms, unlocking the potential for green technological progress and providing sustained momentum for growth. Third, favorable policy signals from government departments incentivize firms to invest in environmental protection, improve resource allocation efficiency, and achieve rapid growth. Therefore, hypothesis H3 is proposed.

3.2. Research Methodology

This section details the research design and methodology employed to assess the impact of environmental regulation on the growth of SMEs. The study adopts a dynamic modeling approach, utilizing the System Generalized Method of Moments (System GMM) to account for the persistent effects of environmental regulations, mitigate potential endogeneity concerns, and address the limitations of traditional panel models. In addition, a mediation model is introduced to investigate the indirect pathways through which factors such as technological innovation and policy support mediate the relationship between environmental regulation and SMEs’ growth. This section also provides an overview of the model construction and the testing procedures applied in the analysis.

3.2.1. Model Construction

According to the theory of organizational inertia, firms’ production activities exhibit dynamic continuity. Similarly, SMEs demonstrate a continuous response to the regulatory compliance costs imposed by environmental regulations. However, static panel models fail to capture this dynamic nature and overlook the lagged effects of environmental regulations on SMEs’ growth, which can lead to omitted variable bias and produce biased or inconsistent estimates. Additionally, given the heterogeneity of firms and the potential endogeneity issues, relying solely on fixed or random effects models may also result in biased estimates. The Difference Generalized Method of Moments (GMM) approach, while addressing some concerns, cannot estimate the coefficients of time-invariant variables, and the persistence of the dependent variables can result in weak instrument problems.
To overcome these limitations, this study adopts the System Generalized Method of Moments (System GMM) to evaluate the influence of environmental regulations on SMEs’ growth. The model is specified as follows:
Y i t = σ + α 1 Y i ( t 2 ) + ϕ 1 E r i t + β C T R i t + μ t + υ i + ε i t
In the model, Y i t represents SMEs’ growth; Y i ( t 2 ) are the lagged terms of SMEs’ growth, reflecting the persistence of SMEs’ growth. E r i t denotes the intensity of environmental regulation, with its coefficient directly indicating the effect of environmental regulation on SMEs’ growth. If the coefficient of E r i t in model (1) is significantly negative, it suggests that environmental regulation has a substantial negative effect on SMEs’ growth. To control for other factors affecting SMEs’ growth, a set of control variables ( C T R i t ) is included in model (1), such as net cash flow, operating costs, management expenses, selling expenses, financial costs, advertising expenditures, tax burden, and market size. Additionally, fixed time effects ( μ t ) and provincial effects ( υ i ) are incorporated, while ε i t represents the error term.
To validate the System GMM estimation method, two key tests are conducted. First, the serial correlation of the differenced residuals is assessed, where the p-value of the AR(1) statistic should be less than 0.05, and the p-value of the AR(2) statistic should be greater than 0.05. Second, the Sargan test is used to check for over-identification or weak instrument problems. The p-value of the Sargan statistic must exceed 0.05 to accept the null hypothesis, indicating that the selected instruments are valid. Additionally, q-lagged variables are employed as instruments, and a collapsed instrument matrix is used instead of the unfolded GMM instrument matrix. This approach mitigates the over-identification issue that can arise from the exponential growth in instrument conditions over time, ensuring the effectiveness of the Sargan test.

3.2.2. Indirect Impact Mechanism Testing Model

After identifying the total effect of environmental regulation on SMEs’ growth, a mediation model is introduced to further explore the mechanisms through which environmental regulation effects SMEs’ growth. The following Equations (2)–(5) are constructed for testing. In Equation (1), technical innovation ( J i t ) and policy support ( P i t ) are not included as mediating variables, and the coefficient reflects the total effect of environmental regulation on SMEs’ growth. In Equations (2) and (3), the coefficients ϕ 2 , ϕ 3 represent the influence of environmental regulation on technological innovation and policy support, respectively. In combination with Equations (4) and (5), λ × ϕ 2 , and δ × ϕ 3 represent the indirect effects of environmental regulation on SMEs’ growth through these mediating variables:
J i t = σ + α 1 Y i ( t 2 ) + ϕ 2 E r i t + β C T R i t + μ t + υ i + ε i t
P i t = σ + α 1 Y i ( t 2 ) + ϕ 3 E r i t + β C T R i t + μ t + υ i + ε i t
Y i t = σ + α 1 Y i ( t 2 ) + ϕ 4 E r i t + β C T R i t + λ J i t + μ t + υ i + ε i t
Y i t = σ + α 1 Y i ( t 2 ) + ϕ 5 E r i t + β C T R i t + δ P i t + μ t + υ i + ε i t
Taking policy support as an example, there are three main methods for testing the mediation effect. First, the three-step method is employed, fitting Equations (1), (3), and (4), and sequentially testing the significance of ϕ 1 , ϕ 3 , and δ . If they are significant, it indicates that policy support has a mediation effect. Second, if either ϕ 3 or δ is insignificant while the others are significant, the Sobel test is used to examine the significance of the product of the coefficients δ × ϕ 3 (Null Hypothesis: δ × ϕ 3 = 0). The test statistic is calculated as Z = ϕ 3 × δ δ 2 × S ϕ 3 + ϕ 3 2 × S δ , where δ 2 × S ϕ 3 + ϕ 3 2 × S δ is the standard error of the coefficient product δ × ϕ 3 , then S ϕ 3 and S δ are the standard errors of the coefficients ϕ 3 , and δ , respectively. Third, if the effects of ϕ 1 are not significant, the Bootstrap test is used. This method repeatedly samples from the research sample a set number of times, treating the derived parameters as the final estimation results. The appropriate method for further testing will be selected based on the actual situation from these three approaches.

4. Variable Selection and Data Sources

To ensure the rigor of the empirical analysis, the selection of variables and the data collection process are essential. This section discusses the variable selection criteria and their theoretical basis, and then explains the source of the data and how it is processed.

4.1. Variable Selection

First, the dependent variable in this study is SMEs’ growth. The existing literature typically uses three types of measurement variables: (1) absolute indicators, such as operating revenue, number of employees, and total assets; (2) growth indicators, such as changes in operating revenue and the number of employees; and (3) growth rate indicators, such as sales growth rate, operating revenue growth rate, and total asset growth rate. This study selects main business income, average annual number of employees, and total assets to construct a system of growth indicators, reflecting dynamic changes in profitability, sales capacity, and firm size. These variables are further validated, and the entropy weight method is applied to objectively assign weights to the sub-indicators, resulting in a comprehensive growth score for SMEs’ growth (Y). This objective weighting approach enhances the scientific rigor and reliability of the measurement. Additionally, the logarithmic value of the number of employees is used as a proxy for SMEs’ growth, ensuring robustness in the analysis. The specific steps are as follows:
Step 1: Constructing the matrix of initial data:
X = x 11 x 12 x 1 n x 21 x 22 x 2 n x m 1 x m 2 x m n
Step 2: Normalizing the data without dimensionality:
r i j = x i j min x i j max x i j min x i j
Step 3: Calculating the entropy of the j-th indicator:
e j = 1 ln n i = 1 n θ i j × ln θ i j , i = 1 , 2 , , n ,   θ i j = r i j i = 1 n r i j θ i j × ln θ i j is   equal   to   0   when   θ i j   is   equal   to   0 .
Step 4: Calculating the weights of the j-th indicator:
w j = 1 e j j = 1 n 1 e j , j = 1 , 2 , , n
Step 5: Calculating the comprehensive score of SMEs’ growth:
S c o r e i = j = 1 m w i × r i j , j = 1 , 2 , , n
Second, the independent variable is environmental regulation. The existing literature typically uses five types of measurement variables: pollutant emissions and reductions, investments or costs related to pollution control, the formulation and enforcement of environmental regulations, the intensity or commitment of local governments’ environmental protection plans, and public supervision methods. However, these approaches often overlook regional differences in resource endowments and pollution industry concentration, which can lead to measurement errors and comparability issues. To address this, the present study measures the ratio of environment-related sentences in government work reports to the total number of sentences. By incorporating regional industrial structure into the measurement of environmental regulation, this study aims to reduce these potential errors. The specific formula is as follows:
E r i t = R i t × E S i t S i t
E r i t denotes environmental regulation intensity, where a higher value indicates stronger regional environmental regulation. R i t = T i t / A i t refers to the level of industrial structure advancement; T i t and A i t are the value-added of the tertiary and secondary industries, respectively. E S i t and S i t represent the number of sentences related to environmental protection and the total number of sentences in the government work report, respectively. The ratio E S i t / S i t is used to measure environmental regulation intensity without considering regional industrial structure. The advantages of this method are (1) R i t as a moderating variable; a smaller value indicates a lower degree of industrial structure advancement, suggesting more severe local industrial pollution. This results in more frequent mentions of environmental protection terms in government reports, adjusting for the influence of regional industrial structure on the frequency of environmental terms. (2) Local governments in China play a pivotal role in environmental governance, and the frequency of environmental terms in government reports reflects the priority given to environmental protection, providing essential guidance for policy design and implementation. (3) Environmental regulation policies formulated and enforced by lower-level governments and relevant departments are guided by these government work reports, which helps mitigate reverse causality issues in model regressions.
Third, the mediating variables: technological innovation investment and policy support. To assess the influence of environmental regulation on SMEs’ growth through technological innovation and policy support, two proxy variables are employed. (1) In the existing literature, technological innovation is often measured by the number of patent applications or R&D expenditures since R&D expenditures directly reflect a firm’s commitment to and support for innovation by using R&D expenditures as a proxy for a firm’s level of technological innovation. (2) Policy support is commonly measured by government subsidies and tax refunds. Drawing on the research of Kang Weijian, this study uses the logarithmic value of the sum of subsidy income and tax refunds received as a proxy for policy support, offering an objective and comprehensive measure of local government support for firms.
Fourth, the control variables: The financial characteristics of firms—such as cash flow, operating costs, management expenses, and the debt-to-asset ratio—reflect the influence of asset quality, cash generation capacity, cost control ability, operational efficiency, and financial leverage on firms. Marketing-related variables, including advertising expenses, export capacity, sales expenses, market size, and industrial structure, are used to analyze the influence of marketing strategies, market pricing power, market share, and sales management. Additionally, financial expenses and tax burden serve as indicators of the rationality of a firm’s financial structure, financing efficiency, and the effects of institutional costs, such as taxes, on firm growth (Table 1).

4.2. Data Sources

The primary data on SMEs are sourced from the “National Tax Survey Database”, jointly collected by the Ministry of Finance and the State Taxation Administration of China. The latest update, extending to 2016, covers a wide range of enterprises, including large-, medium-, small-, and micro-sized firms. Based on the “Standards for the Classification of Small and Medium Enterprises” (MIIT Document (2011) No. 300) [51], firms are classified accordingly. For instance, enterprises in agriculture, forestry, animal husbandry, and fishery with annual revenue below CNY 500,000 are categorized as small- and micro-sized enterprises. The database provides over 400 financial indicators, including total assets, employee numbers, and tax contributions, offering a rich dataset for constructing unbalanced panel data and conducting research on firm growth. The decision to end the research period in 2016 was primarily driven by two factors: first, the latest publicly available data from the “National Tax Survey Database” extends only to 2016, as data for 2017 and beyond have not yet been fully released due to adjustments in statistical methods. Second, 2016 marked the start of China’s “13th Five-Year Plan”, and it represented a relatively stable period for environmental regulations before significant shifts occurred in 2017 with the launch of the “Pollution Prevention and Control Action Plan” and the regularization of central government environmental inspections. Ending the period in 2016 ensures that the study captures a more stable and comparable set of environmental regulations, avoiding the potential confounding effects of more recent regulatory changes.
To enhance data quality, the following adjustments were made: (1) Missing data for some firms during intermediate years were supplemented using interpolation methods. (2) Samples that violated accounting principles or contained logical inconsistencies were excluded, such as instances where fixed assets exceeded total assets, total profits exceeded operating revenue, operating revenue or main business income were negative, R&D expenses exceeded management expenses, year-end total assets were negative, or average employee numbers and wage expenditures were negative. (3) For missing data on variables such as export amounts, R&D expenses, management expenses, financial expenses, sales expenses, subsidy income, tax refunds received, business taxes and additional charges, advertising expenses, and net cash flow, missing values were assumed to be zero.
To quantify environmental regulation intensity, government work reports from 31 provinces (regions and municipalities) and 372 prefecture-level cities in mainland China from 2007 to 2016 were manually collected. The reports were produced using word segmentation and sentence statistics. Python 3.10 was employed to extract sentences containing environment-related terms (e.g., environmental protection, pollution, energy consumption, emission reduction, sewage, ecology, green, low-carbon, air, COD, SO2, CO2, PM10, and PM2.5). To reflect industrial structure upgrading, the ratio of the value-added of the tertiary industry to the secondary industry from the “China City Statistical Yearbook” was used as a proxy, embedding regional industrial structure into the measurement of environmental regulation to capture its indirect effects.
Using the first six digits of the taxpayer identification number from the “National Tax Survey Database”, administrative division codes of the prefecture-level cities where the firms are located were extracted. SME financial data and prefecture-level environmental regulation data were precisely matched based on these administrative codes, with unmatched firm samples being removed. This production yielded an unbalanced panel dataset for SMEs spanning 2007–2016, comprising 1,480,854 observations from 31 provinces (regions and municipalities) and 372 prefecture-level cities across mainland China, making the dataset highly representative.
To mitigate potential estimation bias from extreme values, continuous variables in the model were winsorized at the 1st and 99th percentiles. Additionally, the 2012 United Nations Conference on Sustainable Development, held in Rio de Janeiro, marked a global consensus on environmental protection, representing a significant leap in sustainability efforts. This sustained development over the past decade provides a valuable opportunity for in-depth analysis, enabling a more comprehensive understanding of the influence of environmental regulation on SMEs’ growth. Therefore, this study examines the effects of environmental regulation on SMEs’ growth during the 2007–2016 period, ensuring that the findings are both representative and reliable.

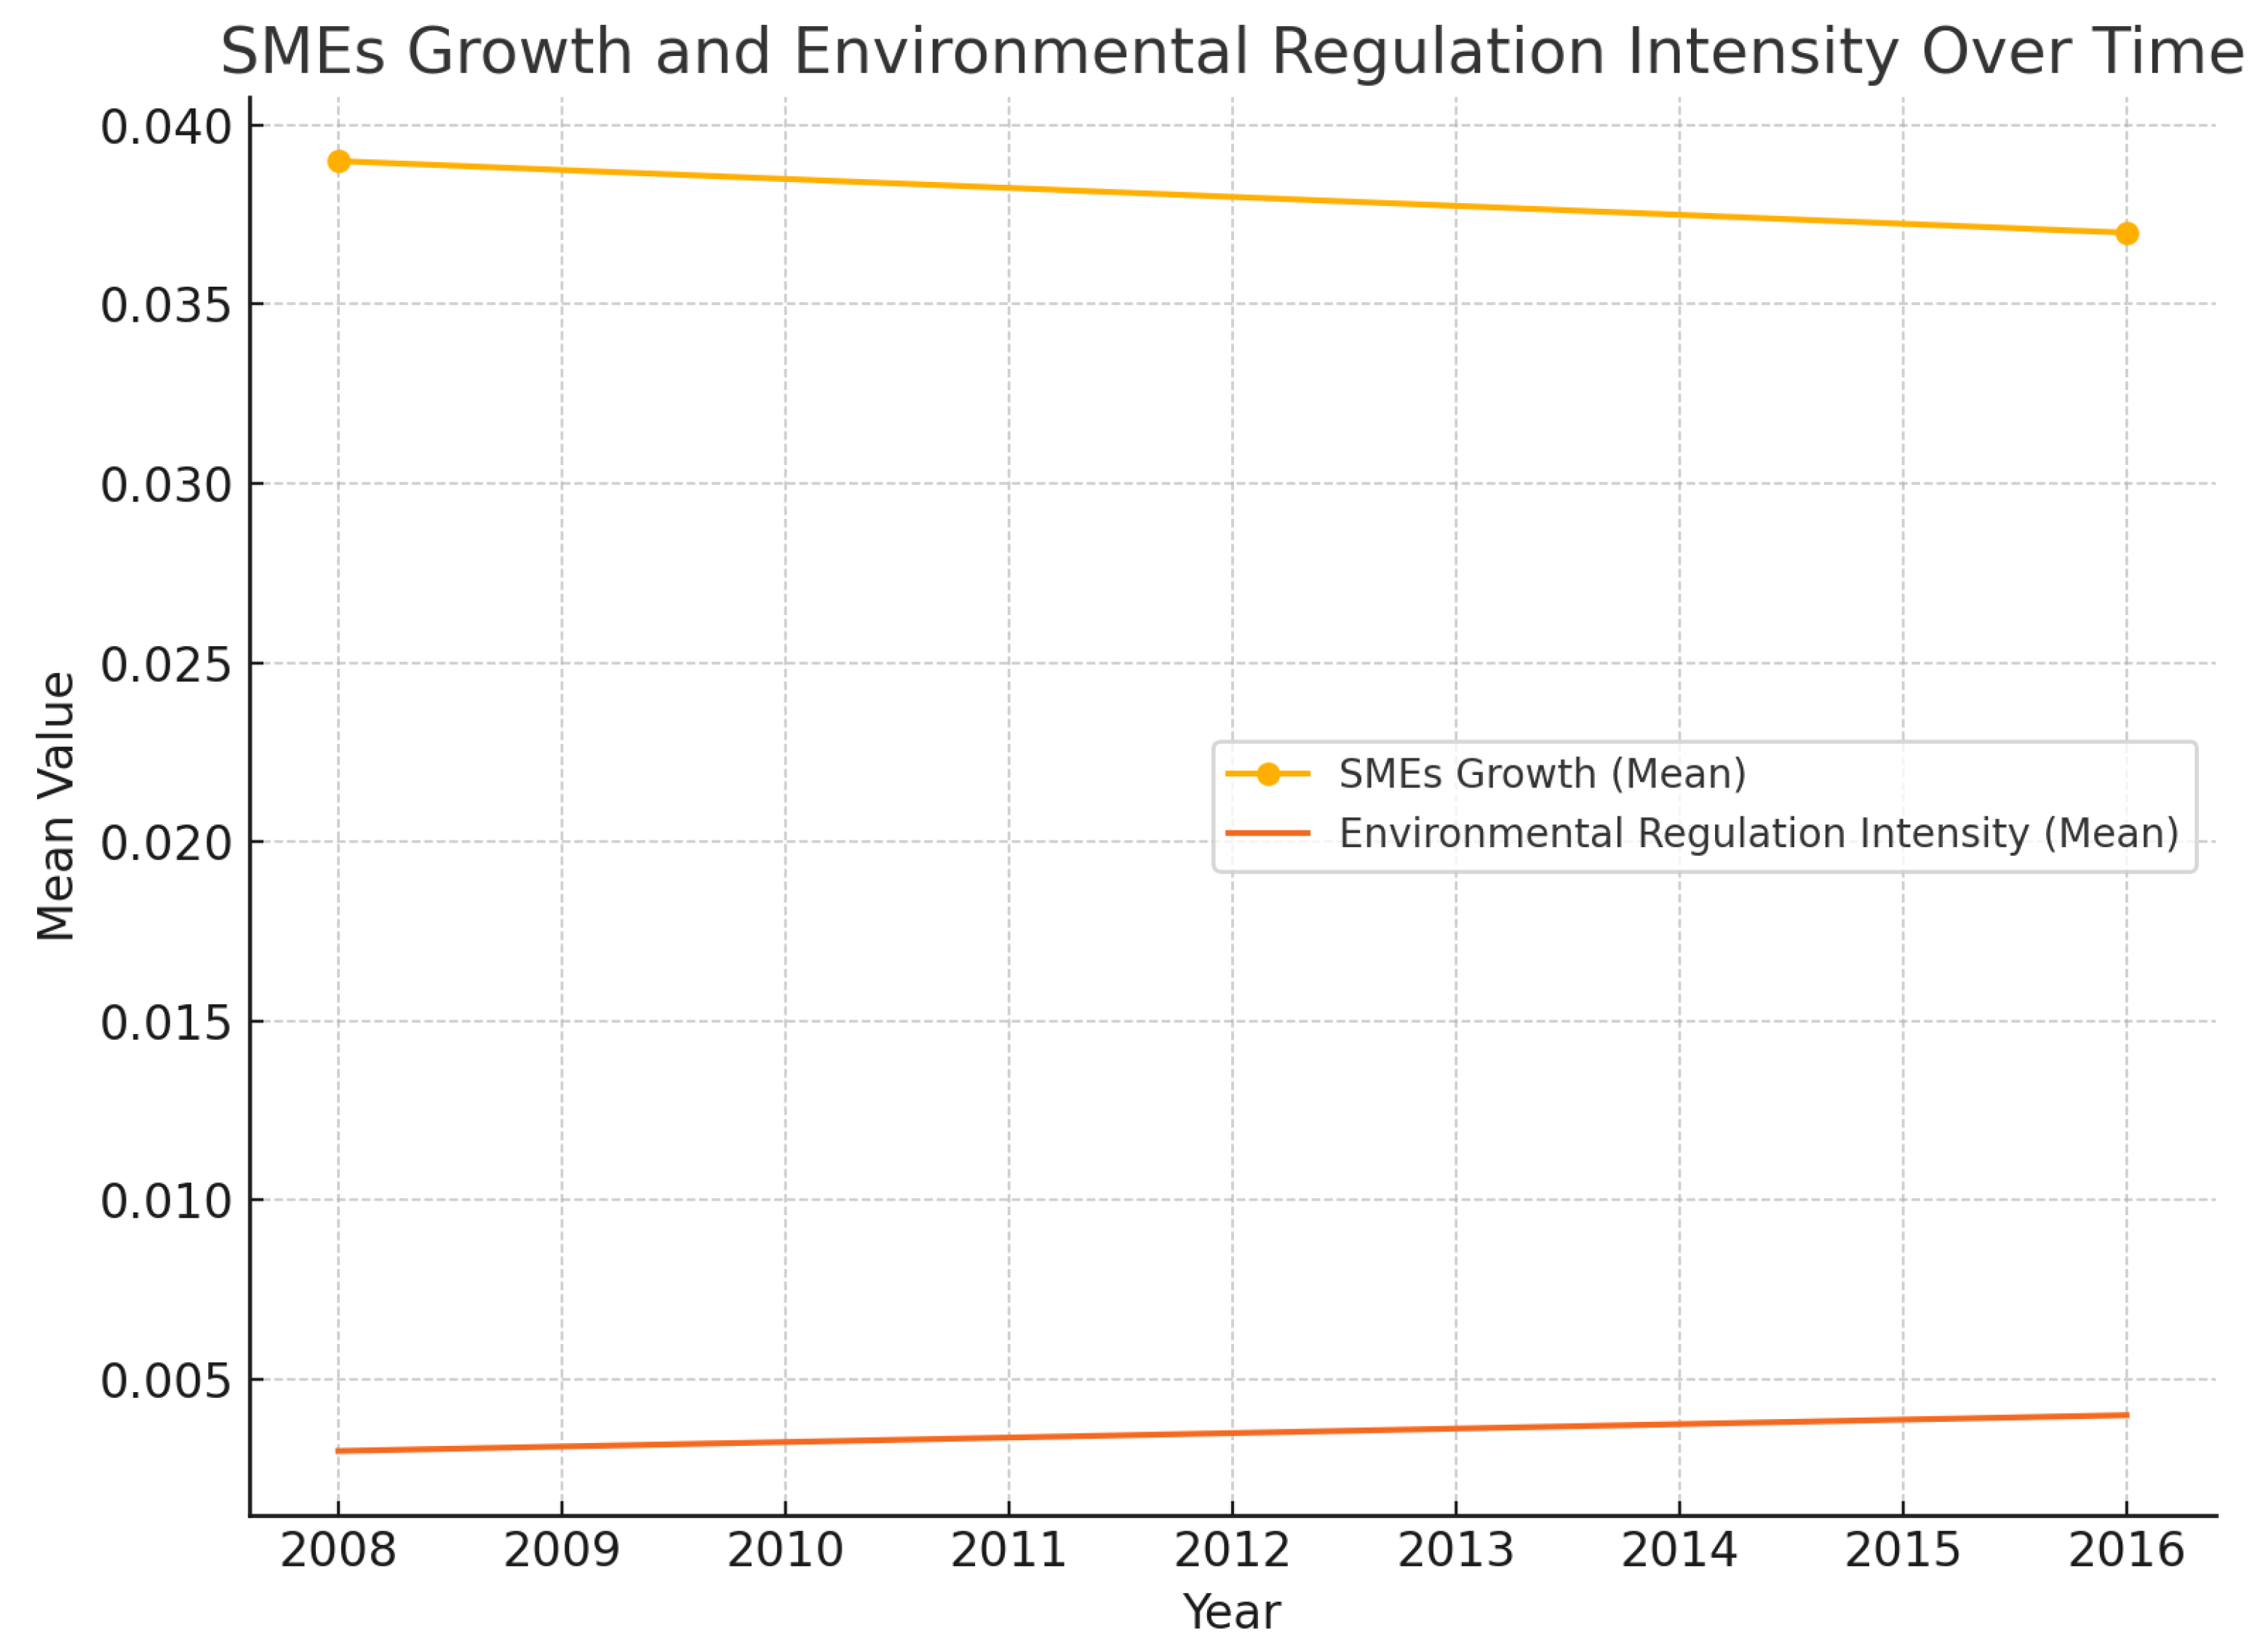
4.3. Descriptive Analysis

The descriptive statistics of the variables are presented in Table 2. A negative correlation is observed between environmental regulation and SMEs’ growth, indicating that stricter environmental regulations tend to inhibit SMEs’ growth. Specifically, the average value of environmental regulation increased from 0.003 in 2008 to 0.004 in 2016, reflecting a gradual intensification of regulatory measures. Meanwhile, the average value of SMEs’ growth declined slightly from 0.039 in 2008 to 0.037 in 2016, suggesting a modest reduction in growth, potentially influenced by external factors such as environmental regulation.
As shown in Figure 2, the relationship between SMEs’ growth and environmental regulation intensity is visually represented. This figure illustrates the changes in the average values of both variables from 2008 to 2016, providing a clearer view of the gradual increase in regulatory measures and the slight decline in SMEs’ growth. The trend shown in Figure 2 supports the earlier statistical findings, suggesting that as regulatory measures intensify, SMEs’ growth appears to slow down.
In terms of control variables, several financial indicators—such as cash flow, operating costs, management expenses, financial expenses, tax burden, and export capacity—worsened, reflecting difficult operating conditions and reduced growth potential for SMEs. Additionally, decreases in sales expenses and advertising expenditures suggest that firms may have adjusted their market strategies in response to heightened competition. However, the expansion of market size and the optimization of industrial structure appear to have helped mitigate further declines in SMEs’ growth.

5. Results, Analysis, and Discussion

An empirical investigation of how environmental regulations affect the expansion of small- and medium-sized businesses (SMEs) is carried out in this part, and the findings are thoroughly discussed. The lag effect and its theoretical underpinnings are further investigated, and several mechanisms of environmental control are found via the use of a benchmark regression model and heterogeneity analysis.

5.1. Identification of the Influence of Environmental Regulation

This section examines the direct negative effect of environmental regulation on company development in order to better understand the precise influence of environmental regulation on the growth of SMEs.

5.1.1. Inhibitory Effect of Environmental Regulation on SMEs’ Growth

The baseline regression results in Table 3 indicate that the coefficient for lagged SMEs’ growth over the past two periods is 0.081, significant at the 99% confidence level, suggesting a strong self-sustaining characteristic in SMEs’ growth. This implies that business activities in the previous two years have a significant positive impact on current and future growth, confirming the dynamic and continuous nature of SMEs’ growth, consistent with the firm life cycle theory (behavior and decisions change over time as individuals or businesses progress through different stages of development) and dynamic capability theory (firms maintain competitiveness by continuously adapting and innovating their resources and capabilities to respond to external environmental changes).
The coefficient for environmental regulation is −0.339, significant at the 95% confidence level, suggesting a substantial negative impact on SMEs’ growth. This finding aligns with theoretical expectations and supports hypothesis H1a, while rejecting H1b. However, the discussion of these results warrants further consideration of alternative explanations and counterarguments.
One potential counterargument is that environmental regulations might spur innovation and long-term growth by forcing SMEs to adapt and develop more sustainable practices [52]. This view aligns with the Porter Hypothesis, which posits that strict environmental regulations can drive firms to innovate, thus enhancing their competitive advantage. While this is indeed a valid perspective, our findings suggest that for SMEs, particularly those with limited resources, the short-term compliance costs may overwhelm their ability to innovate in the early stages. This temporary setback could hinder their growth prospects, especially when faced with substantial initial expenditures on compliance (e.g., clean production facilities, pollution control equipment) before the benefits of innovation are realized.
The lagged effect of environmental regulation, which is significant at −0.142 over the past two periods (at the 99% confidence level), also reinforces the notion of a delayed negative impact on growth. However, when the lag is extended to four periods, the effect becomes statistically insignificant, which suggests that the detrimental impacts of environmental regulations are felt most acutely in the two-year window after implementation. This two-year delay can be attributed to the necessary time for businesses to adjust their internal operations, modernize technologies, and adapt to the regulatory framework.
This raises an important question: Are these delays merely transient adjustments that, once SMEs have fully adapted, will ultimately pave the way for enhanced growth? While it is possible that the long-term impact of environmental regulations could lead to greater innovation and efficiency, our data show that SMEs, due to their limited financial, technical, and managerial resources, face significant challenges in adapting quickly. These firms may resort to short-term strategies such as reducing non-essential spending or postponing investments in technology, which undermines their growth potential in the early phases of policy enforcement.
Moreover, the variation in the impact of environmental regulations across different regions further complicates the narrative. Geographical differences in policy implementation—with some regions initially offering leniency and others more stringent enforcement—may cause disparities in how regulations affect SMEs. In some cases, the delay in policy enforcement may mitigate the negative effects in the short term, while in others, a gradual tightening of regulatory measures may intensify the negative impact more rapidly. This heterogeneity warrants further exploration, as it suggests that not all SMEs face the same challenges when it comes to environmental compliance.
Furthermore, while the Porter Hypothesis advocates that stricter environmental regulations can catalyze innovation, this effect is often more pronounced in larger firms that possess greater financial and technical resources [53]. These firms can better absorb the compliance costs, investing in research and development to innovate, thus leveraging environmental regulations as a driver of growth. On the contrary, SMEs with more limited resources are less equipped to turn regulatory compliance into an innovation opportunity in the short term. As a result, the innovation benefit, if any, may not materialize in the immediate period after regulatory changes are enforced.
In conclusion, while the potential for environmental regulations to foster innovation in the long run cannot be dismissed, the short-term negative effects on SMEs—especially those with limited resources—are evident in this study. Policymakers must consider these differences when crafting environmental regulations, ensuring that policies do not disproportionately hinder SMEs’ growth while still promoting ecological sustainability.
The analysis also reveals that other factors, such as export capacity, market expansion, and a moderate tax burden, positively influence SMEs’ growth. Conversely, increases in financial expenses, operating costs, and unfavorable industrial structure are negatively correlated with growth. These insights suggest that policymakers should focus on enhancing market access and optimizing industrial structure to foster SMEs’ growth. The high R2 value in the regression model indicates a strong fit, and diagnostic tests (AR(1), AR(2), and Sargan) confirm that the model is robust and free from significant endogeneity or over-identification issues.

5.1.2. Robustness Tests of Baseline Results

First, substituting the independent variable. To address potential measurement concerns related to incorporating industrial structure into the measurement of environmental regulation, the independent variable was replaced for a robustness check. The re-estimated results of Equation (1) are presented in Column (1) of Table 4. The coefficient for environmental regulation is −0.446, significant at the 99% confidence level, indicating that even without adjustments to the measurement, environmental regulation continues to suppress SMEs’ growth. This finding confirms that the conclusions are robust across different measurement methods, demonstrating the reliability of the environmental regulation metric and the primary results.
Second, substituting the dependent variable. To mitigate potential measurement errors from different methods of calculating firm growth, the dependent variable was replaced for a robustness check. The number of employees, which reflects a firm’s organizational expansion, capital control, and market efficiency during continuous operations, was used as an alternative growth indicator. To eliminate systematic errors from large data disparities, the logarithmic form was applied. The re-estimated results of Equation (1) are shown in Column (2) of Table 4. The coefficient for environmental regulation is −36.890, significant at the 95% confidence level, confirming that the conclusions hold across different growth metrics, further validating the reliability of the growth calculation method and the robustness of the primary results.
Third, excluding outliers. To ensure the generalizability of the findings, an empirical analysis was conducted after excluding the four directly governed municipalities (Beijing, Tianjin, Shanghai, and Chongqing), which may receive more favorable policy support. The re-estimated results of Equation (1) are presented in Column (3) of Table 4. The coefficient for environmental regulation is −0.336, significant at the 95% confidence level, confirming the inhibitory effect of environmental regulation on SMEs’ growth. This result aligns with the baseline regression, further supporting the robustness and generalizability of the main findings.
Fourth, substituting the model. To further verify model robustness, a high-dimensional fixed-effects regression model and a double fixed-effects model were applied, keeping year and province effects fixed. This approach controls for potential confounding factors influencing SMEs’ growth and enhances the interpretability of the results. The re-estimated results of Equation (1) are shown in Columns (4) and (5) of Table 4. The estimated coefficients for environmental regulation are −0.283 and −0.139, both significant at the 99% confidence level. These results confirm the inhibitory effect of environmental regulation on SMEs’ growth, consistent with the baseline regression, and further demonstrate the robustness of the primary findings and the reliability of the model.

5.1.3. Promoting Innovation and Support Through Regulation

To identify the transmission mechanisms through which environmental regulation affects SMEs’ growth, this paper examines the influence of environmental regulation on SMEs’ growth via technological innovation investment and policy support, following Equations (2)–(4). As shown in Column (1) of Table 3, the total effect of environmental regulation on SMEs’ growth is −0.335, significant at the 99% confidence level, meeting the conditions for applying the three-step method and the Sobel test.
First, regarding technological innovation, the results of Equation (2) show that the impact coefficient of environmental regulation on technological innovation investment does not pass the significance test at the 90% confidence level. However, the Sobel test is applied to further investigate. The Sobel test results show a Z-statistic of 19.4, significant at the 99% confidence level, confirming that the interaction coefficient of environmental regulation and technological innovation investment is significant. This demonstrates that environmental regulation has an indirect positive effect on SMEs’ growth by promoting technological innovation investment, thereby validating hypothesis H2. This finding is consistent with Li, N.’s [54] conclusion that investment in innovation acts as a signal, with expanding such an investment, enhancing SMEs’ future growth prospects. By encouraging technological innovation, environmental regulation boosts management’s confidence in future operations and improves product competitiveness and value-added, thereby mitigating the inhibitory effects of environmental regulation on SMEs’ growth.
Second, regarding policy support, the results of Equation (3) show that the effect coefficient of environmental regulation on policy support does not pass the significance test at the 90% confidence level. Nonetheless, the Sobel test is applied again. The results show a Z-statistic of 10.92, significant at the 99% confidence level, confirming that the interaction coefficient between environmental regulation and policy support is significant (Table 5). This finding is consistent with Du, Q.’s (2025) conclusion that environmental regulation has an indirect positive effect on SMEs’ growth by increasing policy support [55], thus validating hypothesis H3. This is consistent with the production supply theory and economic growth theory.

5.2. Heterogeneity Test

To explore whether the effect of environmental regulation on SMEs’ growth varies across different types of SMEs, a subsample analysis was conducted based on five dimensions, geographic location, economic environment, ownership structure, export status, and tax scale, following the structure of Equation (1). The results are presented in Table 6.
First, regarding geographic location, environmental regulation significantly promotes SMEs’ growth in the western region. Given China’s vast territory and varying environmental regulations across regions, the influence of environmental regulation on SMEs’ growth may differ. China is divided into three regions: eastern, central, and western. Subsample regressions show that environmental regulation has a significant positive effect on SMEs’ growth in the western region, with a coefficient of 0.264, significant at the 95% confidence level. However, the effect is not significant in the eastern and central regions. The western region, rich in renewable resources, benefits from environmental regulation that encourages green innovation in SMEs, improving resource utilization efficiency and driving growth. In contrast, SMEs in the eastern and central regions operate in mature industrial structures, with stronger environmental awareness and greater market competition. For them, environmental regulation is perceived more as a compliance cost than an innovation opportunity, limiting its positive impact on growth.
Second, in terms of economic environment, environmental regulation significantly suppresses SMEs’ growth outside the Yangtze River Economic Belt. The Yangtze River Economic Belt is a crucial economic and ecological zone in China, with stringent environmental protection measures. Subsample analysis reveals that environmental regulation has a significant negative impact on SMEs’ growth outside the Yangtze River Economic Belt, with a coefficient of −0.740, significant at the 95% confidence level, while the effect within the Yangtze River Economic Belt is not significant. SMEs outside this economic zone receive less policy support and have weaker capacities for environmental technology R&D, making it difficult for them to cope with the challenges posed by environmental regulation. Conversely, SMEs within the Yangtze River Economic Belt benefit from stronger economic foundations, greater policy support, and innovation capabilities, allowing them to mitigate the influence of environmental regulation on their growth.
Third, regarding ownership structure, environmental regulation significantly inhibits the growth of private enterprises. State-owned enterprises (SOEs) and private enterprises differ in terms of social responsibilities, with SOEs typically bearing more responsibility for environmental protection. Subsample analysis shows that environmental regulation has a significant inhibitory effect on private enterprises, with a coefficient of −0.332, significant at the 90% confidence level. In contrast, the effect on SOEs is not significant. Private enterprises often face challenges in resource acquisition, policy support, and long-term strategic planning, making the increased costs from environmental regulation more detrimental to their growth. In comparison, SOEs, with access to better resources and policy support, are better positioned to handle environmental regulation without a significant impact on growth.
The differences in responses to environmental regulation in different regions or enterprise types can be attributed to differences in regional resource endowments, policy support, and enterprise conditions. First, in the western region, abundant renewable resources enable environmental regulation to promote green innovation, such as by enhancing the environmental performance of their products, and small- and medium-sized enterprises can set higher prices for their products, known as environmental premiums. Consumers are increasingly valuing the sustainability of products, so they may be willing to pay extra for environmentally friendly products, thereby improving resource utilization efficiency and promoting the growth of small- and medium-sized enterprises (SMEs). In the eastern and central regions, the industrial structure is relatively mature, the market competition is fierce, and enterprises face greater environmental compliance pressure. Therefore, environmental regulation in these regions is more like a compliance cost, which limits the growth momentum of enterprises. Second, in regions outside the Yangtze River Economic Belt, due to the lack of policy support and the lack of environmental technology research and development capabilities of enterprises, it is more difficult for enterprises to cope with the challenges brought by environmental regulation, resulting in a significant inhibitory effect of regulation on enterprise growth. In contrast, enterprises in the Yangtze River Economic Belt benefit from a stronger economic foundation and policy support, and have stronger innovation capabilities, which can better cope with environmental regulation, thereby reducing the negative impact on enterprise growth.
As for the differences between private enterprises and state-owned enterprises, private enterprises are relatively disadvantaged in terms of resource acquisition, policy support, and long-term strategic planning, so the additional costs brought by environmental regulation have a more significant inhibitory effect on their growth. State-owned enterprises, on the other hand, can use their resources and policy advantages to better cope with environmental regulation, and the impact on their growth is not significant. The difference between export-oriented and non-export-oriented enterprises is that export enterprises need to comply with stricter international and domestic environmental standards, which increases operational complexity and costs, limiting the positive influence of environmental regulation on their growth. Non-export enterprises are mainly oriented to the domestic market and can quickly adjust their production strategies to adapt to domestic environmental requirements, so the positive effect of environmental regulation in these enterprises is more obvious.
Finally, small tax enterprises face greater financial pressure, enjoy fewer tax incentives, and cannot afford the high compliance costs brought about by environmental regulation, so their competitiveness is weakened and their growth is restricted. In contrast, large tax enterprises have more financial resources and policy support, and can better cope with the influence of environmental regulation on their growth.
Considering export capacity, environmental regulation significantly promotes the growth of non-exporting SMEs. Export status was measured by export sales revenue, with firms having export sales classified as exporters and those without as non-exporters. Subsample analysis shows that environmental regulation has a significant positive effect on non-exporting SMEs, with a coefficient of 0.352, significant at the 95% confidence level. However, this effect is not observed for exporting SMEs. Non-exporting SMEs, focused on the domestic market, can more easily adapt to domestic environmental requirements, while exporting SMEs must meet both domestic and international environmental standards, which increases operational complexity and costs, limiting the benefits of stringent environmental regulations.
In terms of tax scale, environmental regulation significantly suppresses the growth of small tax-paying SMEs. Tax scale is measured using business taxes and surcharges, with firms contributing more than the annual average classified as large tax-paying SMEs, and those contributing less as small tax-paying SMEs. Subsample analysis shows that environmental regulation significantly inhibits the growth of small tax-paying SMEs, with a coefficient of −0.744, significant at the 99% confidence level. In contrast, the effect on large tax-paying SMEs is insignificant, with a coefficient of 0.616. Small tax-paying SMEs face greater financial pressures and fewer tax incentives, making it difficult for them to bear the high compliance costs associated with environmental regulation, which weakens their competitiveness under stringent environmental policies.

5.3. Theoretical Connections

The study’s findings demonstrate that reactions to environmental regulations vary significantly across locations and business kinds, which the current theoretical framework explains. First, in reaction to environmental regulations, non-export-oriented businesses and western areas exhibit a greater growth response, which is in line with the Porter Hypothesis’ innovation compensating effect. According to the Porter Hypothesis, stringent environmental laws may reduce regulatory costs and provide competitive benefits by promoting technical advancement and better business management. With its abundance of resources and rather poor technical base, the western area, small- and medium-sized businesses have been encouraged to implement green technology innovation and management optimization by environmental restrictions, enhancing the effectiveness of resource use and encouraging business expansion. Likewise, businesses that are not focused on exporting are primarily focused on the home market. In the absence of global competition, they are more inclined to innovate to increase their market competitiveness and adjust to local environmental regulations. However, for the center and eastern provinces, as well as small taxpayers and private businesses, the expansion of businesses is significantly hampered by environmental regulations. The Compliance Cost Theory posits that environmental regulations increase compliance costs for businesses, with SMEs facing greater financial strain, which is supported by these findings. According to the argument, environmental requirements raise businesses’ manufacturing costs, extract money for R&D and other profitable ventures, and so impede businesses’ capacity for innovation and long-term expansion. Particularly in the central and eastern areas, where environmental consciousness is high and market competitiveness is intense, businesses see environmental regulations as an extra expense and are under more pressure to comply. Small taxpayers and private businesses are disadvantaged when it comes to obtaining resources and policy assistance. Therefore, it is more challenging to handle the extra expenses brought on by environmental regulations, leading to a decline in their ability to compete on price, which impedes expansion.
Moreover, the two-year lag effect suggests that businesses require time to adapt to environmental regulations, which is consistent with the theory of dynamic capabilities. This theory posits that businesses need time to reorganize their assets and competencies to respond to external changes. The innovation and technological advancement cycle is particularly long for small- and medium-sized enterprises (SMEs). Therefore, during the initial stages of implementing environmental regulations, businesses are more likely to rely on temporary coping mechanisms until regulatory costs accumulate and significantly hinder their growth potential.
In conclusion, this research combines the Porter Hypothesis with the Compliance Cost Theory to explain the diversity of reactions to environmental regulations in various areas and firm types. According to the study’s results, environmental regulations may spur innovation in some contexts, but they may also restrict the development potential of businesses with limited resources and in areas where competition is fierce. Consequently, while devising environmental policy, the government needs to acknowledge the diversity of various locations and kinds of enterprises, implementing tailored environmental regulations to simultaneously attain the objectives of environmental preservation and economic development.

6. Research Conclusions and Policy Implications

This section encapsulates the main results of the research and examines its policy ramifications. This section will delineate the main findings of the research. This will be followed by an examination of the ramifications of these findings for policymakers, particularly for policy formulation and execution in the realms of environmental regulation and small- and medium-sized enterprise growth.

6.1. Research Conclusions

Using prefecture-level environmental regulation data and micro-level data on SMEs, this study employs the System GMM model to empirically examine the effects, heterogeneity, and mechanisms of environmental regulation on SMEs’ growth. The results indicate that environmental regulation negatively effects SMEs’ growth, with a two-year lag. Robustness checks, including substituting core explanatory and dependent variables, testing alternative regression models, and excluding outliers, all confirm the reliability of the baseline findings.
Further analysis demonstrates that environmental regulation mitigates its negative effects on SMEs’ growth through increased technological innovation investment and policy support. The heterogeneity analysis shows that stringent environmental regulation significantly suppresses the growth of non-Yangtze River Economic Belt enterprises, small tax-paying enterprises, and private enterprises, while it significantly promotes the growth of SMEs in the western region and non-exporting enterprises. However, no significant effect was found on enterprises in the Yangtze River Economic Belt, large tax-paying enterprises, state-owned enterprises, eastern region enterprises, or exporting enterprises.
These findings suggest that policymakers should carefully consider strategies to stimulate innovation and develop flexible policies that help SMEs better adapt to environmental regulations and reduce their negative effect.
The study’s conclusions are predicated on China’s distinctive policy framework and regional economic structure. Therefore, the generalizability of these findings necessitates cautious assessment in relation to the broader national context. Future research could explore cross-jurisdictional comparisons to assess how different economic systems, regulatory models, and the intensity of environmental regulation influence the growth of SMEs. Additionally, considering post-2016 policy shifts such as carbon neutrality targets, future studies should incorporate updated data to assess the evolving impact of these policies. Moreover, factors such as entrepreneurial risk appetite and informal institutional networks may mediate responses to environmental regulations but were not captured in this study. These unmeasured variables could offer a more nuanced understanding of the regulatory effects on SMEs.

6.2. Policy Implications

First, develop differentiated environmental regulation policies to support SMEs’ growth. The central government should account for the specific characteristics of SMEs in its “top-level design” and avoid a one-size-fits-all approach. Local environmental regulations should be tailored based on factors such as firm size, geographic location, and economic conditions to mitigate the inhibitory effects of environmental regulation on SMEs’ growth. A tiered management system should be implemented, categorizing SMEs by their environmental performance and emissions levels, and applying differentiated supervision accordingly. Additionally, a dynamic adjustment mechanism for environmental regulation should be established to modify the intensity of regulation and support policies based on changes in SMEs’ growth and market demand, ensuring policy effectiveness while avoiding over-regulation or insufficient regulation, thereby fostering a favorable environment for SME development.
Second, enhance supporting policies for environmental regulation to ensure precise and sustained implementation. The incentive effects of these supporting policies are crucial for the sustainable growth of SMEs. A dynamic adjustment mechanism should be in place to modify regulatory intensity and support measures based on SMEs’ operating conditions and environmental performance, ensuring that policies are neither too stringent nor too lenient. Moreover, policy tools such as environmental taxes, emissions trading, and green credit should be used flexibly to create a comprehensive policy mix. These tools can guide SMEs towards technological innovation, helping to achieve environmental objectives while minimizing the direct impact on their operations.
Third, build efficient technology service platforms and strengthen regional cooperation. Given the heterogeneous effects across regions like the western region, eastern region, and the Yangtze River Economic Belt, the government should promote regional collaboration by developing efficient technology service platforms to facilitate the sharing of environmental resources and technologies. For example, joint efforts in environmental technology R&D and the establishment of cross-regional environmental innovation centers can provide technical support to SMEs in the eastern and central regions, as well as those outside the Yangtze River Economic Belt. Through regional cooperation, resource allocation can be optimized, overall environmental standards improved, and SMEs’ growth promoted. Moreover, due to the specificity of China’s economy, the impact of environmental regulations on SMEs varies across regions and market mechanisms. In the eastern regions, where the economy is more developed and enterprises have stronger innovation capabilities, environmental regulations have played a positive role in promoting green technology innovation. However, in the central and western regions, where resources and technology are more limited, environmental regulations may increase the burden on enterprises and restrict their growth. Therefore, it is recommended to formulate differentiated environmental policies that provide tailored support measures for different regions, for example, reducing certain environmental requirements and offering technological and financial support in the central and western regions while promoting stricter environmental standards in the eastern regions to encourage innovation. At the same time, the government should encourage green innovation by reducing compliance costs through policies such as tax incentives and green funds, enhancing enterprises’ green production capabilities, and fostering sustainable development.
This study primarily relies on data from 2007 to 2016 which capture long-term mechanisms but do not account for post-2016 policy shifts, such as carbon neutrality targets. Therefore, future updates are necessary to examine the impact of these new policies. Additionally, factors such as entrepreneurial risk appetite and informal institutional networks (e.g., guanxi) may mediate responses to environmental regulations but remain unmeasured in this study. The findings may also have limited external validity, as they may not be fully applicable to economies with decentralized environmental governance, such as EU member states. Future research could address these limitations by incorporating multi-country datasets and digital trace data, such as ESG disclosure texts, to provide a more comprehensive understanding of the regulatory effects across diverse contexts.

Author Contributions

Data curation, Y.Z. and X.Y.; Formal analysis, Y.Z.; Funding acquisition, W.L.; Investigation, Y.Z. and X.Y.; Methodology, W.L.; Project administration, W.L.; Resources, Y.Z.; Software, Y.Z. and X.Y.; Supervision, X.Y. and W.L.; Visualization, Y.Z.; Writing—original draft, Y.Z.; Writing—review and editing, Y.Z. and W.L. All authors have read and agreed to the published version of the manuscript.

Funding

This research was funded by Major Projects of Fujian Social Science Research Baser [FJ2023JDZ028]. And the APC was funded by Special Fund Project of the Fujian Provincial Department of Finance [Fujian Finance Allocation Instruction in 2021 No. 848].

Institutional Review Board Statement

Not applicable.

Informed Consent Statement

Informed consent was obtained from all subjects involved in the study.

Data Availability Statement

The data presented in this study are available on request from the corresponding author.

Conflicts of Interest

The authors declare no conflict of interest.

References

  1. Peng, X. Strategic interaction of environmental regulation and green productivity growth in China: Green innovation or pollution refuge? Sci. Total Environ. 2020, 732, 139200. [Google Scholar] [CrossRef] [PubMed]
  2. Peng, J.; Xie, R.; Ma, C.; Fu, Y. Market-based environmental regulation and total factor productivity: Evidence from Chinese enterprises. Econ. Model. 2020, 95, 394–407. [Google Scholar] [CrossRef]
  3. Shen, N.; Liao, H.; Deng, R.; Wang, Q. Different types of environmental regulations and the heterogeneous influence on the environmental total factor productivity: Empirical analysis of China’s industry. J. Clean. Prod. 2019, 211, 171–184. [Google Scholar] [CrossRef]
  4. Porter, M.E. America’s green strategy. Sci. Am. 1991, 264, 168. [Google Scholar] [CrossRef]
  5. Kou, D.; Liu, X.; Xu, Y. Compliance cost theory: Environmental regulation and enterprise innovation. Environ. Econ. Policy Stud. 2024, 1, 1. [Google Scholar]
  6. Zhou, L.; Tang, L. Environmental regulation and the growth of the total-factor carbon productivity of China’s industries. J. Environ. Manag. 2021, 296, 113078. [Google Scholar] [CrossRef]
  7. Qiu, S.; Wang, Z.; Geng, S. How do environmental regulation and foreign investment behavior affect green productivity growth in the industrial sector? J. Environ. Manag. 2021, 287, 112282. [Google Scholar] [CrossRef]
  8. Gao, G.; Wang, K.; Zhang, C.; Wei, Y.M. Synergistic effects of environmental regulations on carbon productivity growth in China’s major industrial sectors. Nat. Hazards 2018, 95, 55–72. [Google Scholar] [CrossRef]
  9. Shen, N.; Wang, Q. Environmental regulation and environmental productivity: The case of China. Renew. Sustain. Energy Rev. 2016, 62, 758–766. [Google Scholar] [CrossRef]
  10. D’Apolito, E.; Galletta, S.; Iannuzzi, A.P.; Labini, S.S. Sustainability and bank credit access: New evidence from Italian SMEs. J. Res. Int. Bus. Finance 2024, 69, 102242. [Google Scholar] [CrossRef]
  11. Hongyun, T.; Sohu, J.M.; Khan, A.U.; Junejo, I.; Shaikh, S.N.; Akhtar, S.; Bilal, M. Navigating the digital landscape: Examining the interdependencies of digital transformation and big data in driving SMEs’ innovation performance. J. Kybernetes. 2025, 54, 1797–1825. [Google Scholar]
  12. Wu, P.; Li, Y.; Ye, K. Environmental Regulation, Technological Innovation and Green Total Factor Productivity of Industrial Enterprises: An Analysis Based on Chinese Interprovincial Panel Data. Sci. Sci. Manag. S. & T. 2024, 7, 5. [Google Scholar] [CrossRef]
  13. Tian, H.; Zhang, Y. Innovation mechanisms under stringent environmental policies. Environ. Policy Res. J. 2016, 18, 6. [Google Scholar] [CrossRef]
  14. Chi, C.; Li, X. Technological innovation as a moderating factor in environmental regulation. J. Econ. Policy 2020. [Google Scholar]
  15. Wang, K.; Zhao, J. Environmental regulation stringency and firm performance: The role of regional industrial structures. J. Environ. Econ. 2020. [Google Scholar]
  16. Ma, Y.; Lin, T.; Xiao, Q. The relationship between environmental regulation, green-technology innovation and green total-factor productivity: Evidence from 279 cities in China. Int. J. Environ. Res. Public Health 2022, 19, 16290. [Google Scholar] [CrossRef]
  17. Li, J.; Du, Y. Spatial effect of environmental regulation on green innovation efficiency: Evidence from prefectural-level cities in China. J. Clean. Prod. 2021, 286, 125032. [Google Scholar] [CrossRef]
  18. Zhang, C.; Liu, H.; Bressers, H.; Buchanan, K. Productivity growth and environmental regulations—Accounting for undesirable outputs: Analysis of China’s thirty provincial regions using the Malmquist–Luenberger index. Ecol. Econ. 2011, 70, 2369–2379. [Google Scholar] [CrossRef]
  19. Wang, M.; He, Y.; Zhou, J. Evaluating the effect of Chinese environmental regulation on corporate sustainability performance: The mediating role of green technology innovation. Int. J. Environ. Res. Public Health 2022, 19, 6882. [Google Scholar] [CrossRef]
  20. Yuan, B.; Xiang, Q. Environmental regulation, industrial innovation and green development of Chinese manufacturing: Based on an extended CDM model. J. Clean. Prod. 2018, 176, 895–908. [Google Scholar] [CrossRef]
  21. Ghosal, V.; Ye, Y. Environmental regulation and firm productivity: A review of recent literature. J. Environ. Econ. Manag. 2019, 98, 102259. [Google Scholar] [CrossRef]
  22. Li, W.; Tang, B. Environmental regulation, industrial structure upgrading, and green economic efficiency in China. Ecol. Indic. 2022, 136, 108671. [Google Scholar] [CrossRef]
  23. Han, C.; Zhao, X. Low-carbon pilot policies and industrial enterprises’ growth: Evidence from China. J. Environ. Manag. 2021, 290, 112592. [Google Scholar] [CrossRef]
  24. Zhang, H.; Huang, J. Environmental regulation, innovation, and firm performance: Evidence from listed companies in China. J. Clean. Prod. 2022, 339, 130662. [Google Scholar] [CrossRef]
  25. Yu, L.; He, L. Environmental regulation and the productivity of Chinese firms: New evidence from firm-level data. J. Environ. Econ. Manag. 2024, 106, 102694. [Google Scholar] [CrossRef]
  26. Chen, Z.; Wang, Y.; Li, Y. Assessing environmental regulation effects: Empirical analysis using system dynamics and firm-level data. J. Clean. Prod. 2018, 195, 50–61. [Google Scholar] [CrossRef]
  27. Yang, N.; Qin, W. The moderating role of environmental regulation on green innovation and firm growth. Technol. Forecast. Soc. Chang. 2024, 180, 121697. [Google Scholar] [CrossRef]
  28. Shen, N.; Liao, H. Different types of environmental regulations and their heterogeneous effects on environmental total factor productivity. J. Clean. Prod. 2019, 236, 117987. [Google Scholar] [CrossRef]
  29. Arellano, M.; Bond, S. Some tests of specification for panel data: Monte Carlo evidence and an application to employment equations. Rev. Econ. Stud. 1991, 58, 277–297. [Google Scholar] [CrossRef]
  30. Luo, Y.; Xu, X. Inclusive finance, SME growth, and digital technology. Econ. Res. J. 2024. [Google Scholar]
  31. Li, M.; Wang, L. Digital transformation and SME growth in the global market. J. Glob. Bus. Res. 2023. [Google Scholar]
  32. Zhu, H.; Duan, K.; Xu, L. Environmental regulation, innovation, and firm performance: Evidence from Chinese SMEs. J. Innov. Knowl. 2022, 7, 187–199. [Google Scholar] [CrossRef]
  33. Xu, X.; Yang, J. The U-shaped relationship between environmental regulation and green innovation in SMEs: Empirical analysis using firm-level data. J. Clean. Prod. 2024, 238, 117920. [Google Scholar] [CrossRef]
  34. Zhao, J.; Liu, X. Environmental regulation and the green innovation performance of Chinese firms: Evidence from SMEs. Environ. Sci. Policy 2022, 136, 265–274. [Google Scholar] [CrossRef]
  35. Li, X.; Tang, L. Heterogeneity in firm size and the impact of environmental regulation on SME growth: Evidence from China. J. Econ. Policy 2022, 46, 341–357. [Google Scholar]
  36. Porter, M.E.; Van der Linde, C. Toward a new conception of the environment-competitiveness relationship. J. Econ. Perspect. 1995, 9, 97–118. [Google Scholar] [CrossRef]
  37. Shan, C.; Huang, H. Environmental regulation and firm innovation: Examining the Porter Hypothesis in China’s industries. Ind. Econ. J. 2024, 74, 812–827. [Google Scholar]
  38. Gao, L.; Chen, S. Compensatory policies for environmental regulation: A pathway to SME growth. Econ. Dev. Q. 2024, 34, 137–155. [Google Scholar]
  39. Ma, Y.; Zhou, X. Government subsidies and environmental regulation: Impacts on SME growth and innovation. J. Small Bus. Manag. 2022, 60, 125–142. [Google Scholar]
  40. Chen, H.; Wang, Y. Policy support and green innovation in Chinese SMEs: An empirical analysis. Int. J. Environ. Res. Public Health 2021, 18, 2081. [Google Scholar] [CrossRef]
  41. Zhu, Q.; Geng, Y.; Sarkis, J. Motivating green public procurement in China: An individual level perspective. J. Environ. Manag. 2013, 126, 85–95. [Google Scholar] [CrossRef] [PubMed]
  42. Shen, N.; Wang, Q.; Yang, X. Environmental regulation and its effects on the industrial transformation of China: Empirical evidence from regions. J. Clean. Prod. 2016, 119, 257–267. [Google Scholar] [CrossRef]
  43. Jaffe, A.B.; Peterson, S.R.; Portney, P.R.; Stavins, R.N. Environmental regulation and the competitiveness of U.S. manufacturing. J. Econ. Lit. 1995, 33, 132–163. [Google Scholar]
  44. Rubashkina, Y.; Galeotti, M.; Verdolini, E. Environmental regulation and competitiveness: Empirical evidence on the Porter Hypothesis from European manufacturing sectors. Energy Policy 2015, 83, 288–300. [Google Scholar] [CrossRef]
  45. Gao, D.; Mo, X.; Duan, K. Can Green Credit Policy Promote Firms’ Green Innovation? Evidence from China. Sustainability 2022, 14, 3911. [Google Scholar] [CrossRef]
  46. Zou, M. The Impact of Tax Burden on the Total Factor Productivity of SMEs. Master’s Thesis, Guangdong University of Finance Economics, Guangzhou, China, 2023. [Google Scholar]
  47. Jiang, S. The Impact of Environmental Regulation on the Technological Complexity of Firm Exports under the KCAPC Policy. Master’s Thesis, Jiangxi University of Finance and Economics, Nanchang, China, 2023. [Google Scholar]
  48. Wang, C. How to Use Information Technology to Promote the Upgrade of Comprehensive Budget Management in Enterprises. Contemp. Account. 2021, 7, 171–172. [Google Scholar]
  49. Yu, D.; Yan, Y. Environmental Regulation, Technological Innovation, and Green Total Factor Productivity in Manufacturing Enterprises. Urban Environ. Res. 2022, 2, 58–79. [Google Scholar]
  50. Liu, L.; Song, Z. A New Method for Measuring Corporate Operating Performance—Economic Value Added (REVA) and Revised Economic Value Added (REVA) Indicators. Account. Res. 1999, 1, 31–37. [Google Scholar]
  51. Ye, B.; Deng, X.; Yi, J. Digital dynamic capability, value co-creation, and digital transformation of small and medium-sized enterprises: The moderating effect of digital technology maturity. Qinghai Soc. Sci. 2022, 6, 012. [Google Scholar]
  52. Kong, Z.; Du, J.; Kong, Y.; Cui, X. Financial development, environmental regulation, and corporate green technology innovation: Evidence from Chinese listed companies. Financ. Res. Lett. 2024, 62, 105122. [Google Scholar] [CrossRef]
  53. Chen, Q.; Li, M. Environmental regulatory system reform and corporate ESG ratings: Evidence from China. Econ. Model. 2024, 135, 135106710. [Google Scholar] [CrossRef]
  54. Li, N.; Zhang, H.; Zhang, X.; Xie, X. Does Market-Based Environmental Regulatory Policy Improve Corporate Environmental Performance? Evidence from Carbon Emission Trading in China. Sustainability 2025, 17, 623. [Google Scholar] [CrossRef]
  55. Du, Q.; Li, Z.; Du, M.; Yang, T. Corrigendum to ”Government venture capital and innovation performance in alternative energy production: The moderating role of environmental regulation and capital market activity”. Energy Econ. 2025, 129, 107196. [Google Scholar] [CrossRef]
Figure 1. The theoretical analytical framework of environmental regulation affecting the growth of SMEs.
Sustainability 17 02118 g001
Figure 2. Statistical data on SMEs’ growth and environmental regulation intensity over time.
Sustainability 17 02118 g002
Table 2. Descriptive statistics of key variables.
Year20082016
VariableMeanStd DevMinMaxMeanStd DevMinMax
Y0.0390.0110.0170.0640.0370.0130.0110.062
Er0.0030.0010.0000.0080.0040.0020.0010.010
N3.2714.172−56.82381.2221.3823.000−46.50754.885
C102.3422706.7280.00017.198136.29857510.0001,500,000
G327.96388,7890.000911,598413.89070,4570.00022,100,000
X52.99079160.0001,335,35012.2128940.000256,000
F52.94551550.00039,400,00054.86111,3241,560,000290,000
A0.5561.4700.0003,335,3000.3331.2300.00011.553
W1.4603.3350.000891,6001.4253.3620.00016.457
S1.16466.9360.00014.5358.225858.3300.000223,000
Z72.2852406−140420,134133.7858235−17361,630,000
M7.2680.9102.6149.5858.1070.8673.6249.829
I0.3760.0770.0860.7770.4610.0830.2070.764
J0.3621.4160.00013.2250.4521.7980.00011.503
P1.4442.6490.00015.0410.8972.2360.00013.817
Table 1. Variable names and explanations.
Variable TypeVariable NameSymbolVariable Explanation
Dependent VariableFirm GrowthYCalculated using the method described in Section 4.1
Independent VariableEnvironmental RegulationErCalculated using the method described in Section 4.1
Control VariableNet Cash FlowNLogarithmic value of (Net Cash Flow + 1)
Operating CostCOperating Costs ÷ Operating Revenue × 100%
Management ExpensesGManagement Expenses ÷ Operating Revenue × 100%
Sales ExpensesXSales Expenses ÷ Operating Revenue × 100%
Financial ExpensesFFinancial Expenses ÷ Operating Revenue × 100%
Advertising ExpensesALogarithmic value of (Advertising Expenses + 1)
Export CapacityWLogarithmic value of (Export Amount + 1)
Tax BurdenSLogarithmic value of (Business Taxes and Additional Charges + 1)
Debt-to-Asset RatioZInitial Debt ÷ Initial Assets × 100%
Market SizeMLogarithmic value of the GDP of prefecture-level cities
Industrial StructureIValue-Added of Tertiary Industry ÷ Regional GDP × 100%
Mechanism VariableTechnological InnovationJLogarithmic value of (R&D Expenditures + 1)
Policy SupportPLogarithmic value of (Subsidy Income + Tax Refunds Received + 1)
Table 3. Baseline regression results.
VariableYYY
L2.Y0.081 *** (6.93)0.067 *** (3.67)−0.021 (−0.28)
Er−0.339 ** (−2.20)//
L2.E/−0.142 *** (−3.17)/
L4.Er//−0.671 (−1.56)
N0.000 (0.58)0.001 (1.47)0.001 (0.60)
C0.005 *** (12.68)0.004 *** (7.16)−0.001 (−0.56)
G0.000 (0.76)0.000 (0.84)0.000 * (1.70)
X−0.000 ** (−2.42)−0.000 *** (−4.10)0.000 (0.07)
F−0.000 (−1.09)−0.000 (−1.18)−0.000 (−1.39)
A−0.000 (−0.41)−0.000 (−0.49)−0.000 (−0.31)
W−0.000 *** (−2.76)−0.000 ** (−2.64)−0.000 (−0.49)
S0.001 (0.46)0.002 (0.71)0.005 (1.17)
Z0.000 *** (3.05)0.000 *** (3.94)−0.000 (−0.01)
M0.012 ** (2.29)0.025 *** (7.83)0.011 (0.45)
I−0.074 *** (−5.90)−0.054 *** (−3.68)0.112 (1.56)
Year Fixed EffectsYesYesYes
Province Fixed EffectsYesYesYes
_cons10.898 (0.41)10.122 (0.49)−0.306 (−0.11)
AR(1)0.0010.0000.057
AR(2)0.0770.3970.489
Sargan0.0760.0610.068
Note: *, **, and *** represent significance at the 90%, 95%, and 99% confidence levels, respectively. The values in parentheses are t-values.
Table 4. Robustness test results.
VariableSubstituting Independent VariableSubstituting Dependent VariableExcluding OutliersReghdfeXtreg
L2.Y0.088 *** (5.79)0.077 *** (5.09)0.081 *** (6.87)//
Er−0.446 *** (−6.48)−36.890 ** (−1.78)−0.336 ** (−2.05)−0.283 *** (−30.07)−0.139 *** (−21.83)
Control VariablesYesYesYesYesYes
Year Fixed EffectsYesYesYesYesYes
Province Fixed EffectsYesYesYesYesYes
_cons6.055160010.89759.8820.064
AR(1)0.0160.0030.002//
AR(2)0.1730.0770.089//
Sargan0.0000.2030.096//
Note: ** and *** represent significance at the 95%, and 99% confidence levels. The values in parentheses are t-values.
Table 5. Mechanism test results.
Technological Innovation (Equation (2))Policy Support (Equation (3))
Sobel Test
Er × J0.0230 *** (0.001)/
Er × P/0.0164 *** (0.0015)
Z-Statistic19.4 *** (0.0230)10.92 *** (0.0164)
Note: Due to space constraints, Control variables, individual controls, and fixed effects are included in all model fittings but are not displayed here due to space constraints. Supporting data are available upon request. *** represents 99% confidence level. The values in parentheses are t-values.
Table 6. Heterogeneity test results.
Classification VariableSample ClassificationControl VariablesYear Fixed EffectsProvince Fixed EffectsImpact Coefficient
Geographic LocationEastern SMEsYesYesYes0.014
Central SMEsYesYesYes0.063
Western SMEsYesYesYes0.264 **
Economic EnvironmentYangtze River Economic BeltYesYesYes−0.159
Non-Yangtze River Economic BeltYesYesYes−0.740 **
Ownership StructureState-Owned EnterprisesYesYesYes0.032
Private EnterprisesYesYesYes−0.332 *
Exporting FirmsExporting SMEsYesYesYes−0.093
Non-Exporting SMEsYesYesYes0.352 **
Tax-Paying FirmsLarge Tax-Paying SMEsYesYesYes0.616
Small Tax-Paying SMEsYesYesYes−0.744 ***
Note: *, **, and *** represent significance at the 90%, 95%, and 99% confidence levels, respectively.
Disclaimer/Publisher’s Note: The statements, opinions and data contained in all publications are solely those of the individual author(s) and contributor(s) and not of MDPI and/or the editor(s). MDPI and/or the editor(s) disclaim responsibility for any injury to people or property resulting from any ideas, methods, instructions or products referred to in the content.

