Article

Social Sustainability and Subjective Well-Being: A Study on Italian Inner Areas

Department of Political Sciences, University of Naples Federico II, 80138 Napoli, Italy
*
Author to whom correspondence should be addressed.
Sustainability 2025, 17(5), 2078; https://doi.org/10.3390/su17052078
Submission received: 21 December 2024 / Revised: 6 February 2025 / Accepted: 23 February 2025 / Published: 27 February 2025
(This article belongs to the Section Health, Well-Being and Sustainability)

Abstract

:
Social sustainability relies on the promotion of social processes and structures that ensure the basic needs of individuals and communities are met while also encouraging constructive interactions among them. This paper offers an overview of the characteristics of Italy’s peripheral rural areas and presents findings from a targeted survey conducted across three southern Italian regions. Evaluations collected from a sample of residents were analyzed using the class of CUB models, which are suitable for preference and opinion data. Subjective perceptions of well-being and quality of life, community participation, and the quality of social relationships were examined. Residents’ opinions on the available services in the areas, including economic facilities, digitalization, and transportation, were also considered. Our research indicates that perceptions of well-being in the peripheral areas of Italy are remarkably influenced by individuals’ assessments of their income adequacy. Our findings establish a strong connection between a positive self-assessment of well-being and the belief that income can sufficiently meet needs. Exploring the perceptual dimensions of well-being can offer valuable insights for stakeholders and decision-makers in developing policy efforts and community-led social innovations, which are critical for fighting sentiments of marginalization in rural areas caused by economic perceptions.

1. Introduction

Social sustainability is the third pillar of the triadic model of sustainable development. The conceptualization of social sustainability is less defined than that of the other two contexts: ecological and economic. However, it is now widely recognized that the quality of relationships within communities and the promotion of social processes and structures are essential elements in shaping future development [1]. In particular, social cohesion and inclusion, as well as equality and social engagement, play fundamental roles in building fair and sustainable communities [2,3].
Sustainable communities are “places where people want to live and work, now and in the future. They meet the diverse needs of existing and future residents, are sensitive to their environment, and contribute to a high quality of life. They are safe and inclusive, well planned, built, and run, and offer equality of opportunity and good services for all” [1]. Within this framework, Dempsey et al. [4] specified a list of physical and non-physical factors determining just, equal, and sustainable social environments. The former include items related to basic needs, community facilities, and services. The latter are linked to collective aspects of everyday life, such as quality of life and well-being, a sense of community and belonging, and functioning networks among residents. Non-tangible elements are not directly measurable. They are often characterized by means of proxy observable variables describing certain life concerns or domains (such as income, employment, and housing) and sociodemographic characteristics (age, race, gender, status, etc.) [5].
This material approach overlooks the subjective dimension of non-tangible factors. These can only be captured by taking into account the cognitive and affective components connected with them, which represent the rational and emotional sides. In particular, in small communities, the emotional component is usually very strong because people are often committed to preserving places, customs, and local traditions. People may oppose and protest against the introduction of innovation and changes because they are perceived as potential disruptors of established and preferred ways of living [3]. As a result, we feel it is critical to understand “what people need” (development) and “what people want” (maintenance) before implementing any new policies [3,6]. This aspect is even more relevant when the discussion concerns sustainability in peripheral areas that often consist of marginal territories characterized by rural vocations and demographic and economic decline. In particular, some scholars [7] have found that in rural and peripheral territories, the main determinants of well-being rely on subjective perceptions concerning not only economic conditions but also environmental quality, security, educational opportunities, and a sense of community.
This paper examines the results of an empirical study carried out in three areas of southern Italy that are included in the Italian National Strategy for Inner Areas (SNAI—Strategia Nazionale per le Aree Interne). This program proposes an innovative approach to promote national development and territorial cohesion, aiming to address marginalization and population decline in inner areas of Italy [8]. Drawing on this survey, a set of thematic macro-dimensions were identified as being likely to impact the perceived quality of everyday life in the aforementioned areas. The research took into account respondents’ opinions on a variety of topics related to self-reported well-being, as well as other subjective judgments of interpersonal, family, and community relationships. Furthermore, it considered respondents’ ratings of a set of services available in their community. The image that emerged depicts the unique challenges encountered in these regions.
Extensive research (see, among others, [6,9,10]) has suggested that indicators based on objective measures may fail to capture key qualitative factors, such as individual well-being, social cohesion, personal fulfilment, and economic and social inequalities. Such elements are vital for understanding people’s overall conditions, but since they are inherently subjective, they can only be accurately assessed through self-reporting or self-evaluation. Consequently, individuals’ assessments, judgments, and perceptions are valuable tools for learning more about the multifaceted aspects of human well-being. They offer important indications of the nuanced, cross-cultural, and context-dependent aspects of life satisfaction, particularly when objective data are limited or challenging to obtain. Moreover, insights from subjective indicators can be more tailored to the experiences and priorities of the people being studied compared to standardized universal measures, and for this reason, they can be employed to complement other objective information [6].
In particular, this study investigates how disparities in opportunities and efforts [9,11] affect subjective well-being and aspects of social sustainability. The inequality of opportunity refers to inequalities produced by external causes beyond a person’s control, whereas the inequality of efforts refers to differences resulting from individual efforts [9,12]. Here, gender and perceived income adequacy are considered as possible factors of inequality.
After examining the main characteristics of Italy’s inner areas, Section 2 outlines the Italian National Strategy for Inner Areas, which has been renewed for the seven-year period of 2021–2027. The three peripheral areas of interest are described in detail, and the survey that was conducted is illustrated. The results of the exploratory principal component analysis are also presented. Then, the CUB modeling framework, which is appropriate for the analysis of ordinal data, is discussed and used to describe the interviewees’ response patterns. Section 3 summarizes the findings related to respondents’ subjective well-being and a variety of other factors, taking into account the effects of gender and perceived income adequacy. Some graphical tools, which represent the estimated models in the parameter space, are used to aid interpretation. Note that CUB models can synthesize perceptions and assessments for multiple items, conveying information on respondents’ preferences and highlighting the heterogeneity associated with them. The resulting graphical representations can provide decision-makers and stakeholders with a better understanding of respondents’ opinions on relevant topics. Section 4 contains some concluding notes, including a discussion of policy implications that can be inferred from the survey results.

2. Materials and Methods

2.1. Strategy for Inner Areas

Italy is characterized by a polycentric territorial structure, which features dense networks of urban areas, rural regions, and smaller centers. This framework fosters an interdependent environment where larger cities, offering better quality services to their inhabitants, act as key attractors for the population. Inner areas are defined as districts that are significantly distant from major service centers, such as healthcare, education, and transportation facilities. However, these areas often have a rich array of essential environmental resources, including water, agricultural, and forest systems, as well as valuable cultural resources, such as archaeological sites, historical settlements, small museums, and craft centers [13,14,15].
The complexity of Italy’s inner regions is evident not just in their economic challenges but also in the social and cultural dimensions that are unique to these areas [16,17]. In recent decades, the accelerated process of urbanization, coupled with the migration of resources and opportunities to metropolitan centers, has led to growing neglect of rural areas. This trend has contributed to a gradual erosion of their cultural and community identities.
For many years, intervention strategies centered on addressing Italy’s notable North–South divide. However, these approaches have since evolved with the introduction of the place-based European Union (EU) cohesion policy [13]. With the implementation of the Italian National Strategy for Inner Areas (SNAI), these regions, often characterized by rich historical heritage, deep-rooted traditions, and biodiversity, are now recognized as valuable assets that require protection and promotion.
The strategy establishes specific lines of intervention for the European structural funds of the 2014–2020 and 2021–2027 programming cycles. It serves as a model for sustainable rural development and institutional innovation [18]. The details are outlined in the Partnership Agreement and are part of an initiative to enhance sustainable regional competitiveness [13]. The process is grounded in a multidimensional model that draws on Italy’s local development experiences. In the short term, the program aims to achieve two main objectives: first, to increase both the quantity and quality of citizenship services and second, to promote development projects that safeguard the natural and cultural heritage of inner areas while enhancing local production chains. Over the medium term, the strategy has 5 goals: increasing the well-being of local populations, increasing local labor demand and employment, increasing the use of territorial capital, lowering the social costs of de-anthropization, and bolstering local development factors. These mid-term goals aim to address demographic declines in territories that are the farthest from major service hubs [19]. The long-term goal is to reverse the current demographic trends in the country’s inner regions. In this context, the SNAI is playing a crucial role not merely by addressing economic development issues but also by actively promoting social cohesion and the revitalization of local identities. These aspects are considered essential for the regeneration of these areas.

2.2. Specificities of the Inner Areas

Demographic decline is more pronounced in rural areas than urban centers. According to the SNAI framework for 2021–2027, Italy’s inner areas consist of over 4000 municipalities, accounting for approximately 48.5% of the total. These regions are fragile and are experiencing heightened demographic issues, such as aging populations and territory abandonment, compared to the rest of the country. By 2024 [20], 13.3 million individuals were living in inner areas (about a quarter of the resident population in Italy). Specifically, 8 million people resided in so-called intermediate municipalities (13.6% of the total number of residents in Italy), and 4.6 million (7.8%) resided in peripheral municipalities, whereas ultra-peripheral municipalities, which are the most disadvantaged in terms of accessibility to services, were home to 700,000 individuals (1.2%). Since 2014, Italy has experienced a generalized decline in its resident population, which has been far more noticeable in inner area municipalities. From 2014 to 2024, the population in these inner areas decreased by 5.0%, which was significantly more than the 1.4% decline observed in urban territories.
This study focuses on 40 municipalities in continental southern Italy, specifically in three areas: Mainarde Molisane, which comprises 13 municipalities in the province of Isernia, Molise; Sele-Tanagro, which includes 19 municipalities in the province of Salerno, Campania; the Montagna Materana area, which contains 8 municipalities in the province of Matera, Basilicata.
The municipalities are largely located in middle–high hills and tend to include extremely high areas near the borders between the three districts (Figure 1). The average altitude of the three areas exceeds 500 m above sea level, with Montagna Materana demonstrating the highest altitude (see Table 1). In terms of geographical extent, the Sele-Tanagro and Montagna Materana areas are similar to each other, while Mainarde Molisane covers a much smaller area (about half of each of the other two districts).
The three districts exhibit typical features, yet they are quite heterogeneous in terms of population density, aging index, and natality. The Sele-Tanagro territory has a significantly larger population compared to the other two areas. This phenomenon can be largely attributed to the influence of the metropolitan city of Salerno, which serves as a major attraction for the surrounding territories.
The territorial disparity is reflected in the average population density. The Montagna Materana area presents a notably low density, with approximately 15 inhabitants per km2. The other two areas show higher population densities: Mainarde Molisane has around 37 inhabitants per km2, while the Sele-Tanagro area exceeds 71 inhabitants per km2. This reveals a significant difference between the various territorial contexts [20]. With regard to the distribution of the population over the provinces, it is interesting to observe that Mainarde Molisane accounts for about 42% of Isernia territory while comprising only 12% of the population. The Sele-Tanagro and Montagna Materana areas represent smaller portions of their respective provinces, comprising resident shares that range from 5% to 6% of the total populations of Salerno and Matera, respectively.
The birth rate and aging indices provide a complex yet clear picture of the demographic situations in the areas under consideration. The aging indices are significantly higher in both the Montagna Materana and Mainarde Molisane regions, while the Sele-Tanagro area shows a lower value. The birth rate data present a complementary perspective: the Montagna Materana and Mainarde Molisane areas have generally lower birth rates, indicating demographic stagnation. This trend is reflected in a negative natural balance, which is particularly notable in the Mainarde Molisane area, where four municipalities reported a birth rate of zero.

2.3. Survey

A survey was carried out throughout March and April 2024 to collect the opinions and judgments of residents in the study areas regarding their economic conditions, overall well-being, interpersonal relationships, sense of community belonging, and the quality of the available services. The target population comprised adults (18 years and older) living in the three areas under investigation (a total of 65,368 individuals, according to 2022 Census data). A random sample was selected by stratifying the population according to geographical area, gender, and age groups (18–24 years; 25–65 years; >65 years). Sample units were proportionally allocated to strata proportionally to stratum size. Units from each stratum were selected randomly. Interviews were conducted by a polling company with a Computer Assisted Telephone Interviewing (CATI) system, allowing a maximum of six tentative contact attempts for each potential interviewee. In the end, the interview response rate was 6.52%, in accordance with the difficulties in recruiting for telephone surveys that have been reported in recent years [21].
The administered questionnaire provided sociodemographic information about the interviewees and their families (including age, gender, marital status, and employment status) and gathered the respondents’ opinions about various aspects of living in a peripheral and isolated area (see Appendix A). Subjective perceptions were expressed using a 10-point Likert scale, where each successive category indicated a better response than the previous one [22].
After the preliminary data-cleaning step, the analyzed sample consisted of 1929 individuals, representing 2.95% of the target population. This is a fairly high sampling fraction, which, together with the sampling design, ensured the sample’s reliability. In Table 2, some of the sociodemographic characteristics of the sample are illustrated. The sample composition aligned with those of the populations within the territories of interest, as can be verified by the 2022 Italian census [23].
In total, six distinct thematic macro-dimensions, including a number of observable variables, were identified:
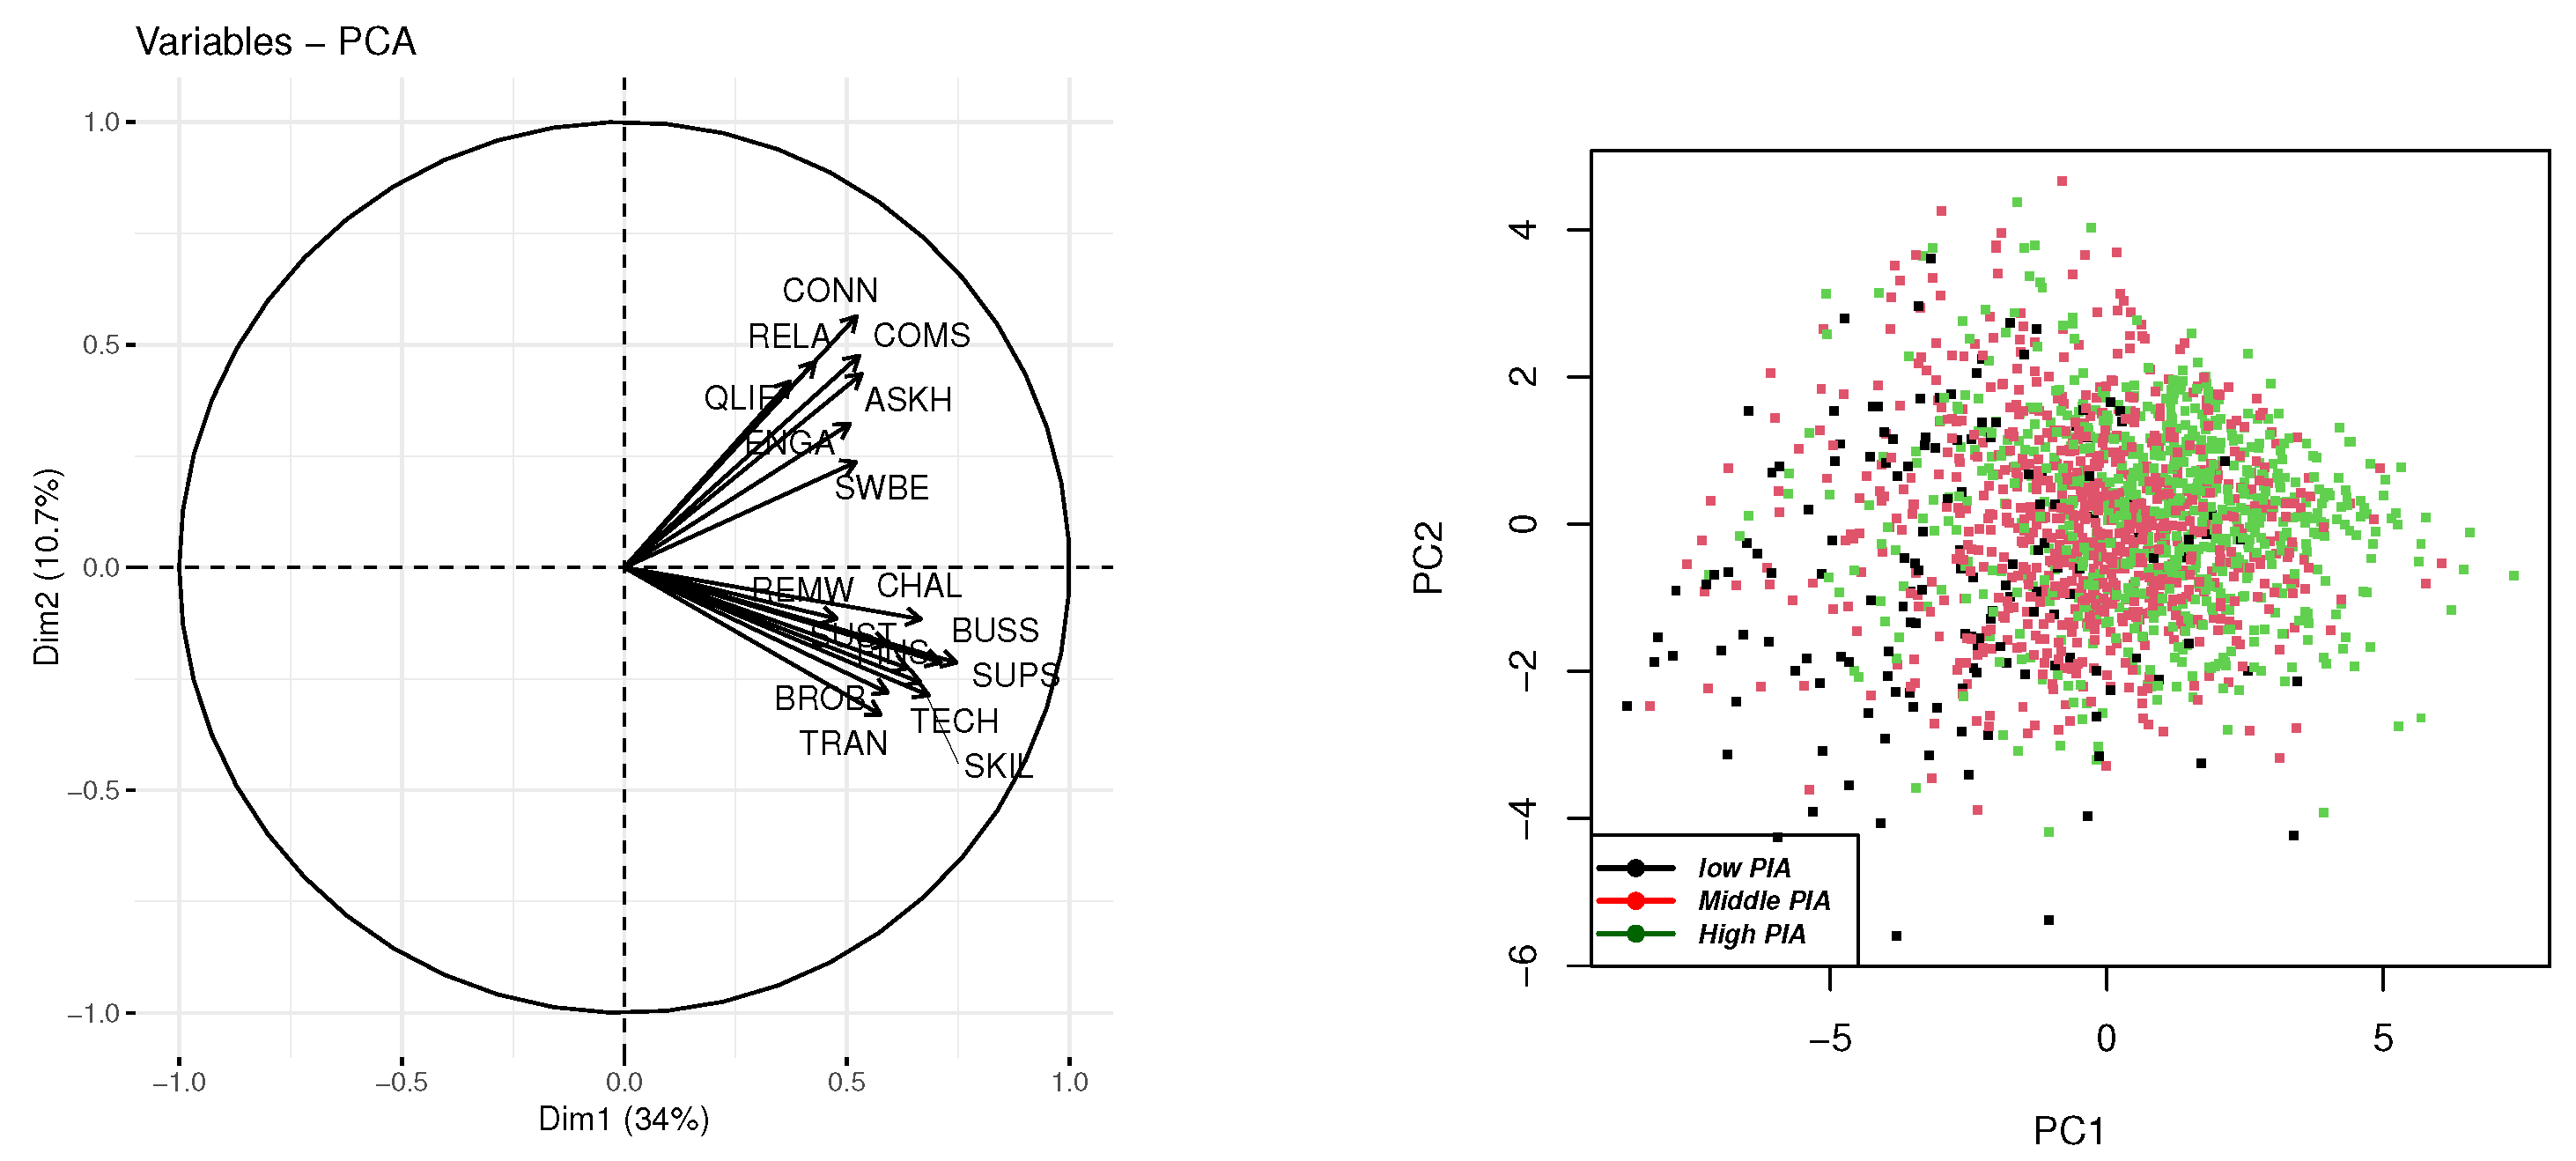
  • Overall Well-Being: Subjective well-being (SWBE);
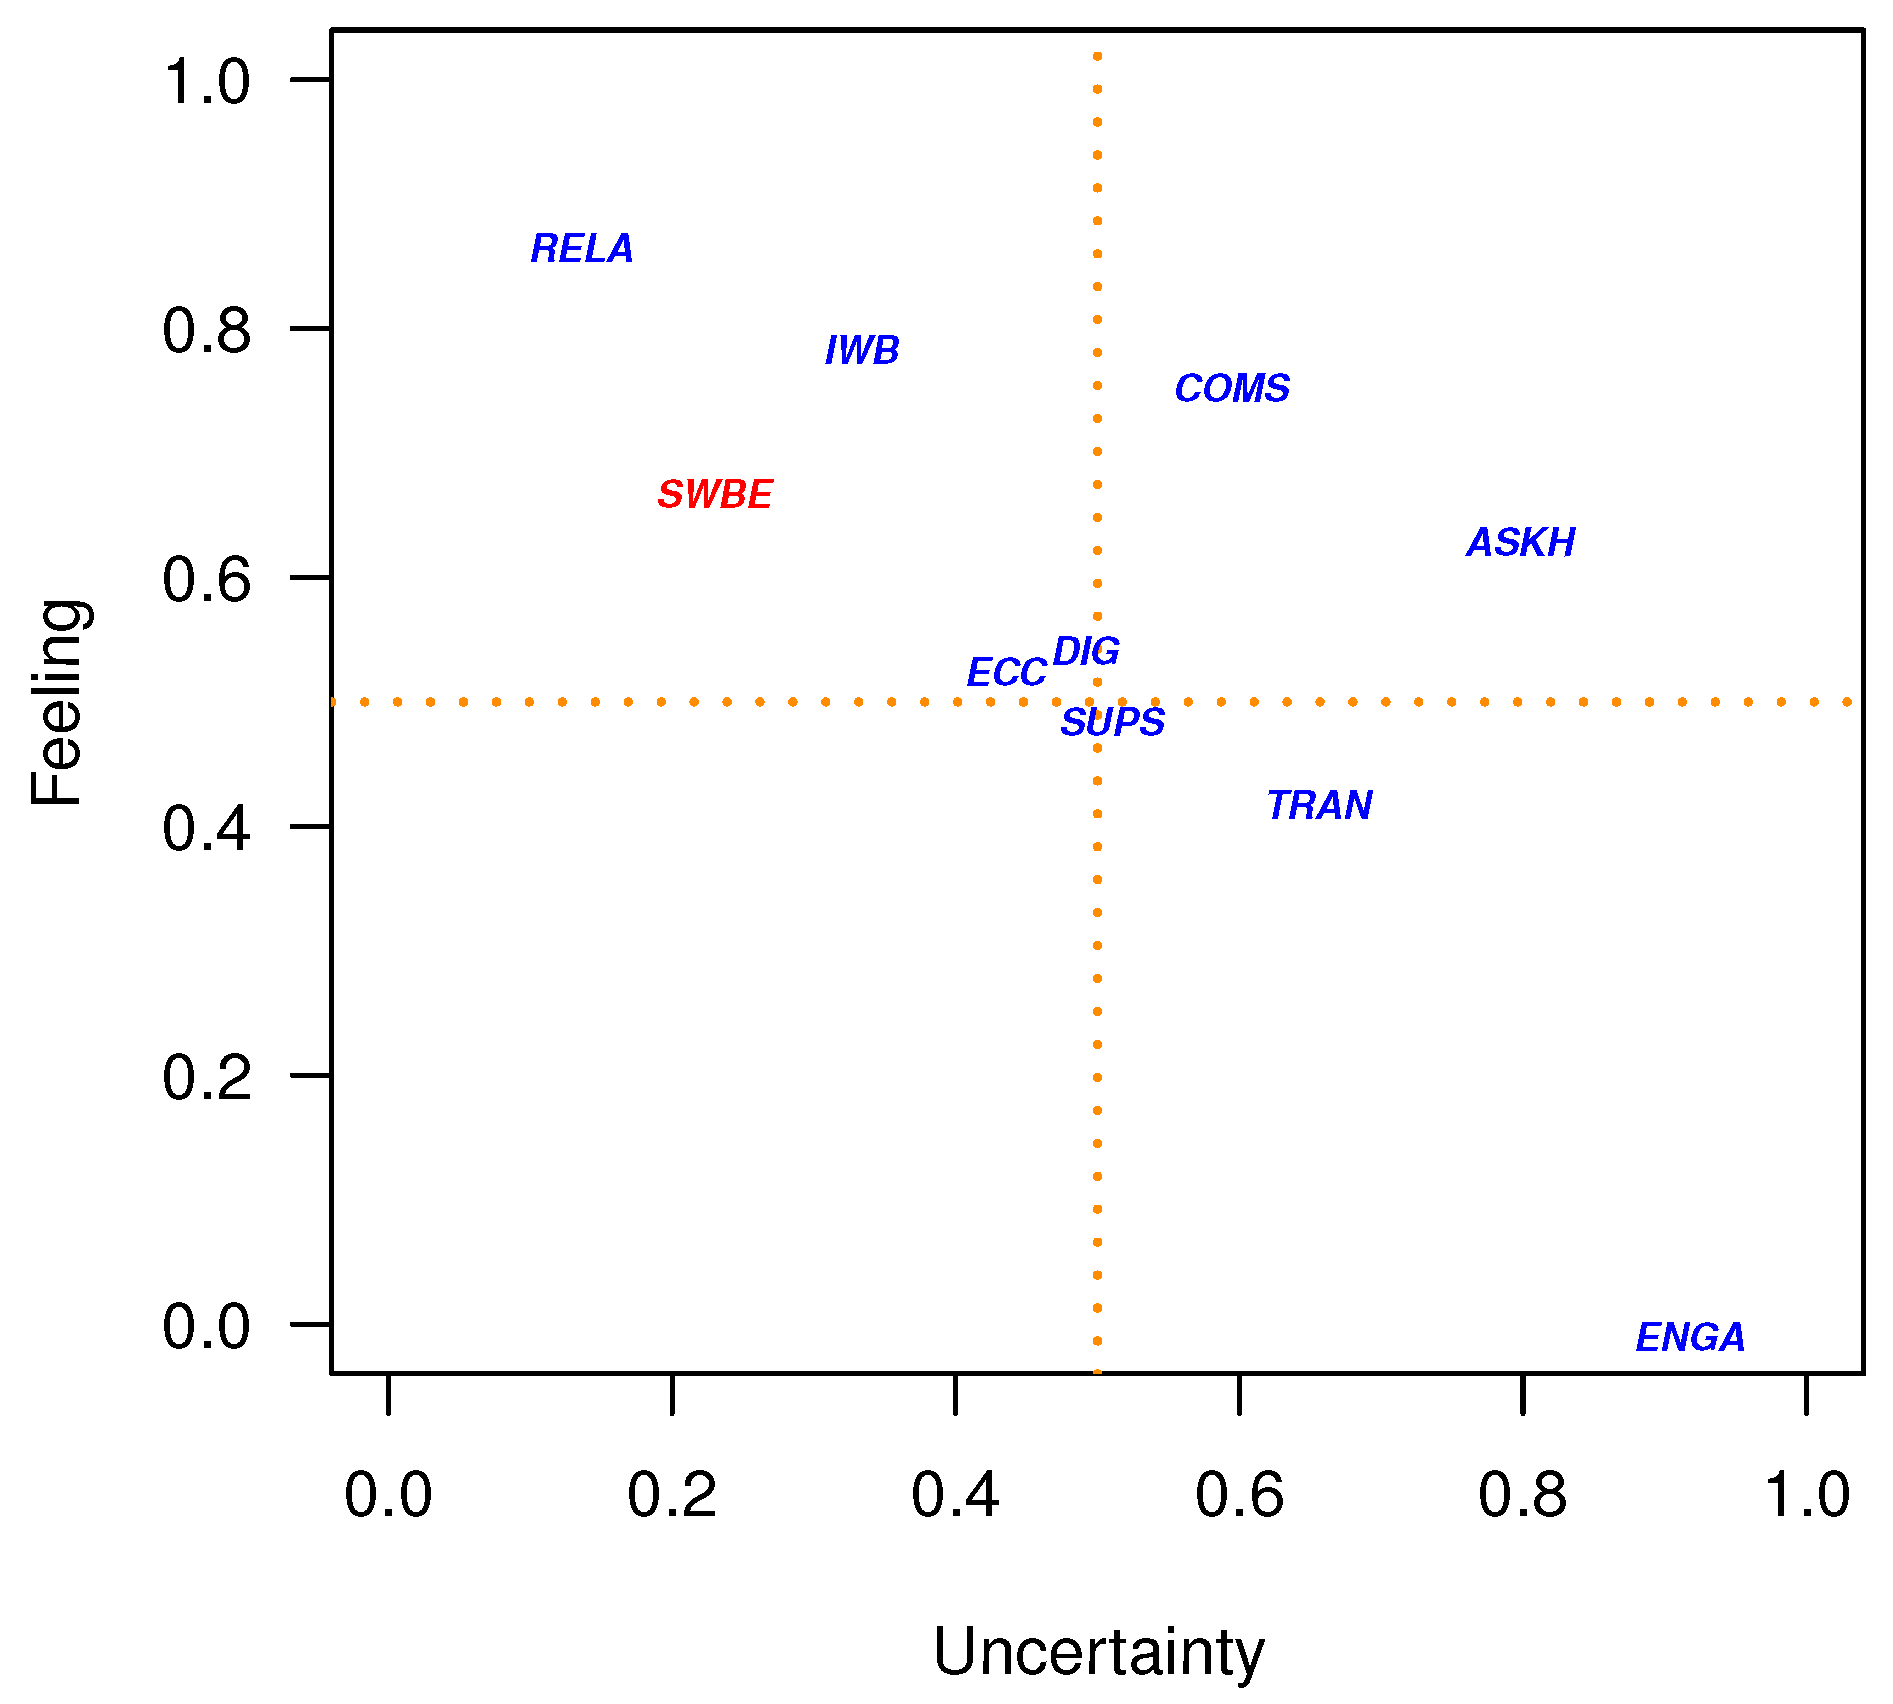
  • Individual Well-Being (IWB): Connection to the community (CONN) and quality of life (QLIF);
  • Social Relationships: Family and social relationships (RELA), community support (COMS), community organization engagement (ENGA), seeking help/support from the community (ASKH), and public support services (SUPS);
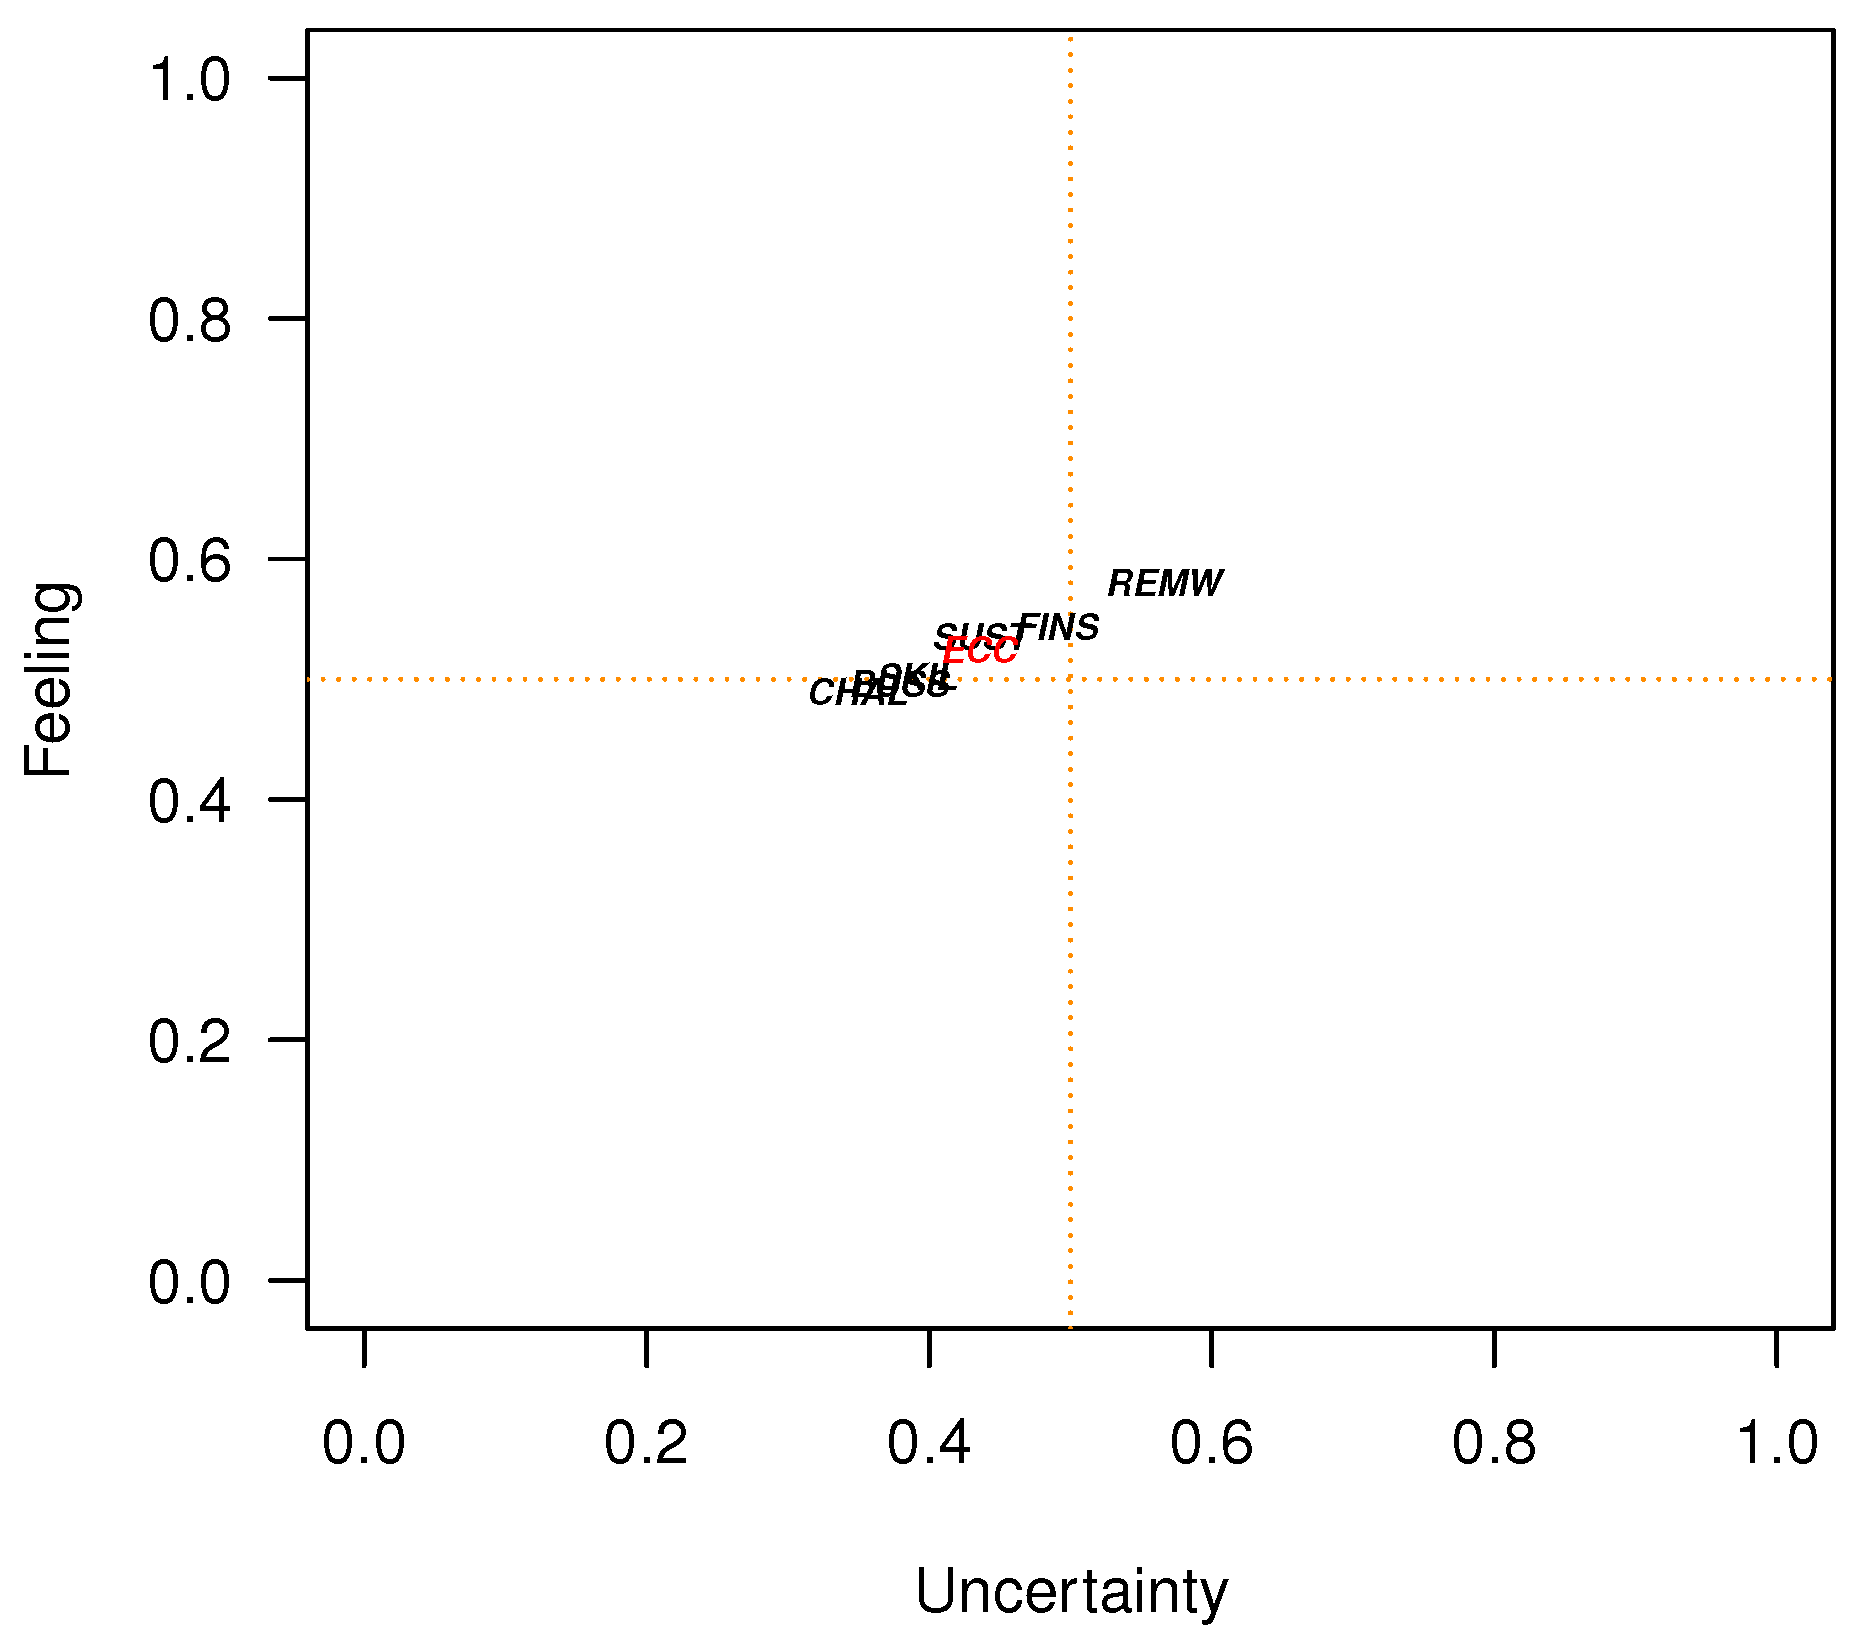
  • Economic Opportunities and Facilities (ECC): Remote work (REMW), innovation readiness (CHAL), quality of financial services (FINS), business support services (BUSS), the skilled labor force (SKIL), and sustainable local production (SUST);
  • Digitalization (DIG): Digital research adequacy (TECH) and digital services (BROB);
  • Transportation (TRAN).
Due to the specific living conditions in the inner areas of Italy, this study did not examine health and security macro-dimensions. The Italian healthcare system has suffered multiple financial cuts and is undergoing reorganization at the territorial level, resulting in many areas being left uncovered. Consequently, a general negative sentiment toward healthcare services can be observed. This is more evident in more isolated communities unless they are located very close to high-quality healthcare facilities. However, in those cases, the main issue is transportation. Regarding security, there are generally no prominent criminal issues in Italian inner areas, so we considered this aspect to be irrelevant to the purposes of the study.
With respect to the economic condition of respondents, since obtaining a reliable measure of income is usually problematic in telephone surveys, the interviewees were requested to provide a subjective assessment of their income adequacy (PIA). This measure reflects the adequacy of family income in relation to needs [24,25]. Although this type of assessment may suffer from some bias, individual choices and preferences are based, among other things, on such subjective information [26]. Various studies have examined the relationship between perceived income adequacy and satisfaction with consumption levels and quality of life [24], satisfaction with family financial situation [25], preferences for redistribution [26], and health inequality [27].
An explorative study of the responses was undertaken via principal component analysis in order to learn more about (i) the correlations between ordinal variables (generated by interviewees’ answers to each question on the questionnaire) and (ii) the similarity among individuals (characterized by the set of answers each respondent provided). The analysis was performed by applying both the metric technique and the Gifi method for ordinal data (with a monotone step function as transformation) [28,29]. The loss function for the two solutions was extremely similar. Despite the more flexible transformation function, the ordinal version improved slightly over the metric one. The two-dimensional representation of the non-linear solution explained 46.7% of the original variability, compared to 44.6% for the metric technique. Given this evidence, only the results from the metric analysis are reported.
The loadings plot shows two groups of highly correlated variables that contribute to determining the first and second principal components (Figure 2, left panel). In particular, one group (at the top of the plot) includes the variables that describe economic opportunities and facilities, digitalization, and transport, while the other group includes variables related to social relationships and overall and individual well-being. This demonstrates how ‘material needs’ and ‘social needs’ represent distinct (and rather independent) aspects of sustainable societies.
The score plot helps to detect individuals who provided similar responses (Figure 2, right panel). Specifically, those that tend to give positive judgments to all items are located in the right part of the plot. Additionally, they are divided into the upper and lower parts of the plot based on their opinions regarding the quality of their living conditions and social connections (those with favorable outlooks are found in the upper half of the plot). The various colors indicate how adequate they believe their income to be. Perceived income adequacy (PIA) has been classified into three levels: low when respondents choose the lower categories (1, 2, and 3), medium for intermediate categories (4, 5, 6, and 7), and high for the remaining categories (8, 9, and 10). The score plot clearly shows that respondents’ attitudes depend on PIA and that people who feel that their income is not sufficient for their needs tend to be unsatisfied and express negative judgments. This result is in line with other studies [24] and will be used to identify respondents’ clusters in Section 3.

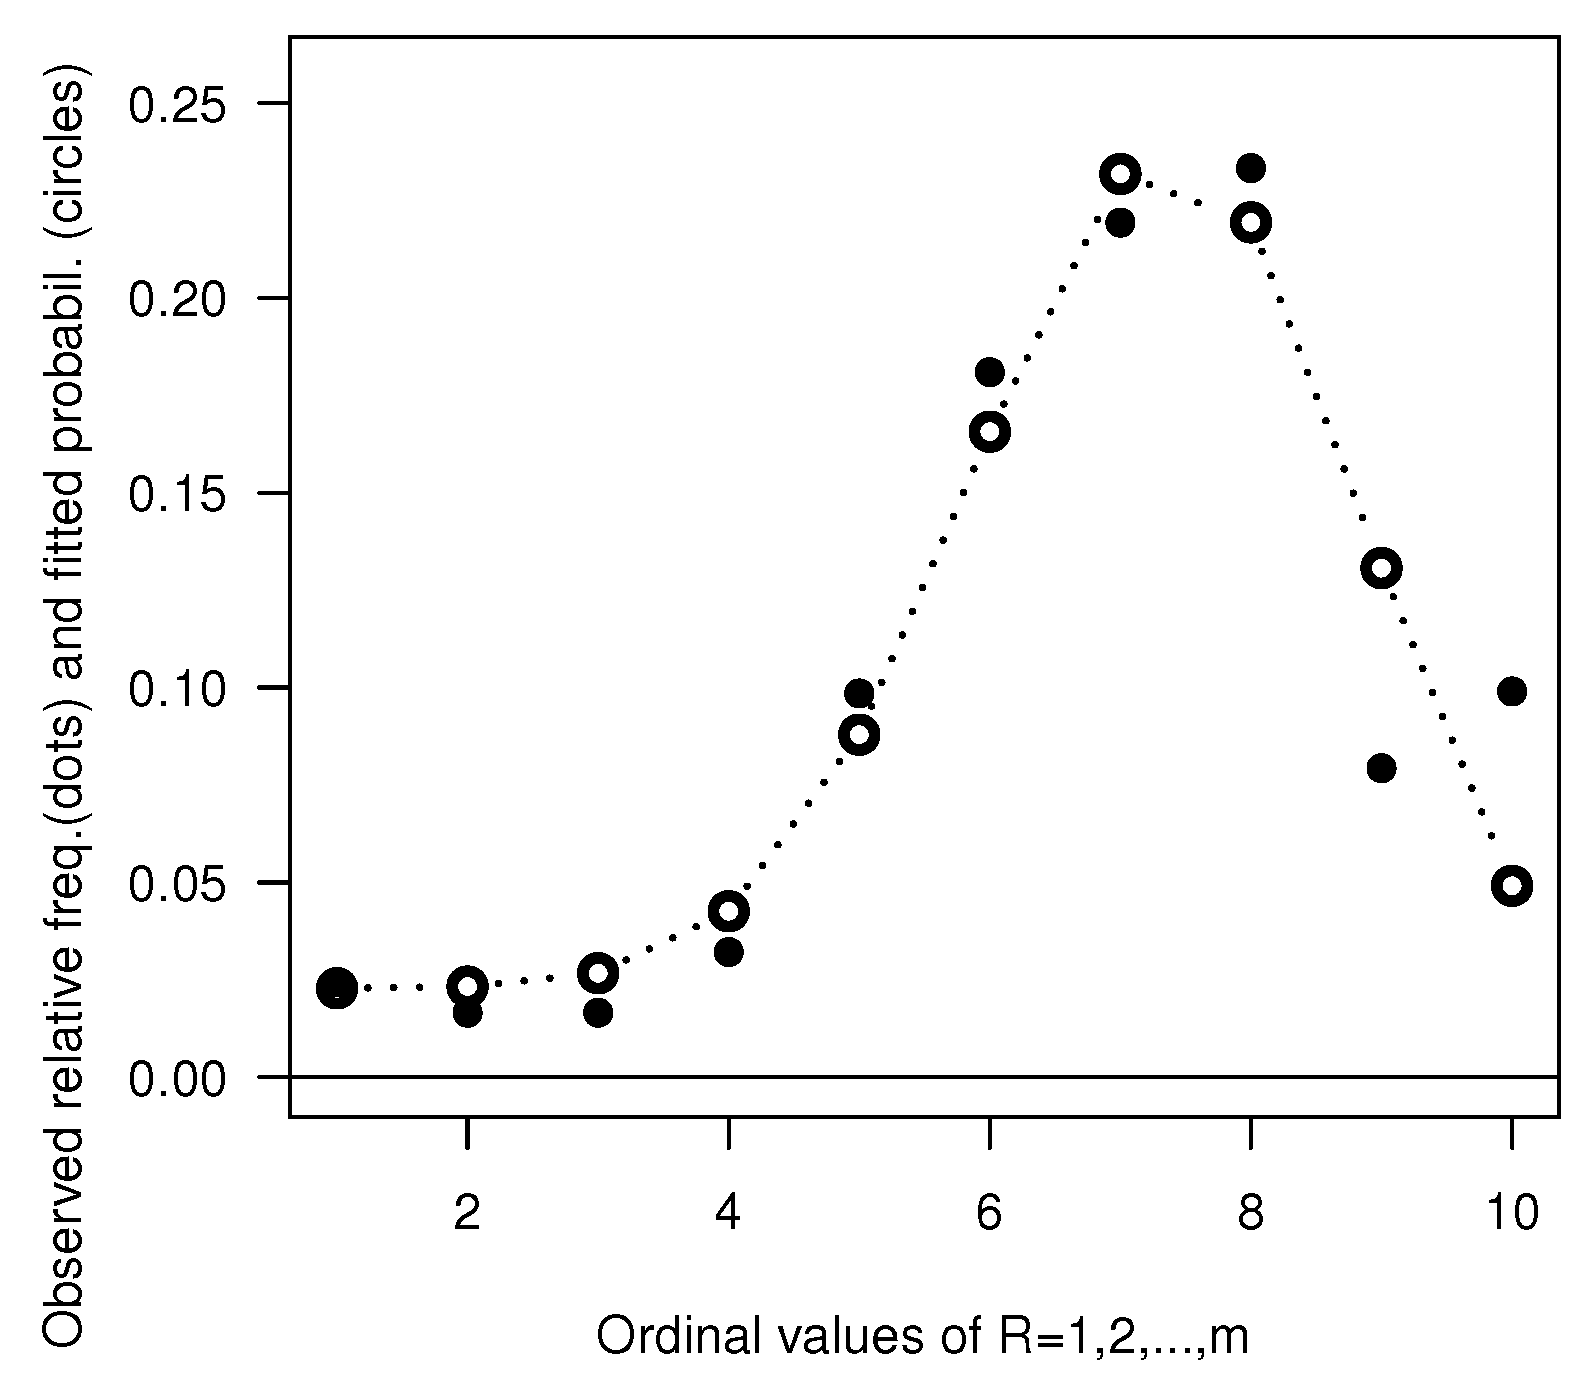
2.4. Methodology for Modeling Ordinal Data

In this study, CUB models were used to analyze ordinal response variables. This method is based on the paradigm for ordinal data modeling introduced by Piccolo [30,31] and further developed by [32,33]. In particular, ordinal data are directly represented by means of a mixture distribution, unlike the classical approach that describes the distribution function of ordinal responses through an appropriate link with explanatory variables [34]. CUB models simulate a simplified mechanism of respondent judgment formation processes. This combines two unobserved components: feeling and uncertainty. The former is parameterized with a shifted binomial random variable, while the latter is associated with a discrete uniform random variable. The choice of a shifted binomial distribution for the feeling component is supported by heuristic and statistical motivations ([35,36,37]), whereas the discrete uniform distribution is a common option for modeling statistical uncertainty. In particular, Andrich’s seminal work [38] introduced a binomial model for the study of Likert scale-based attitude questionnaires. Later, this type of distribution was further motivated by Allik [35], who provided a psychological interpretation of the latent process behind the selection of answers in the context of Likert-type personality measures. From a statistical standpoint, the binomial random variable effectively counts the number of acceptable response choices, thereby reflecting respondents’ feelings toward the item. The variable is shifted to start from 1 (rather than 0) to align with widely used ordinal scales. The distribution is well-suited for Likert-type data as it accommodates variability across categories while preserving the order and helps to interpret data in terms of preferences or tendencies. Additionally, it ensures computational and theoretical robustness. This makes it a reliable choice for examining ordinal outcomes, as discussed by [32].
Furthermore, the CUB parameters ( 1 ξ ) and ( 1 π ) characterize respondents’ attitudes toward the item under assessment. The feeling parameter ( 1 ξ ) indicates the degree of agreement/satisfaction expressed by respondents and is related to the skewness of the CUB distribution. The uncertainty parameter ( 1 π ) indicates the inherent heterogeneity within responses. Note that a CUB model encompasses the extreme instances of a totally random response and a thoroughly meditated choice (with no uncertainty).
One advantage of this class of models is that feeling and uncertainty can be linked to subjects’ covariates via a logistic link. For this reason, they have been successfully applied to opinion, preference, and assessment data in numerous survey domains, such as marketing and food studies, healthcare assessments, and psychological, social, and political studies (see, for instance, references in [32,33,39].
Formally, given a collection of items { R k , k = 1 , . . . , K } , each characterized by m > 3 ordinal categories, we define a CUB model as follows:
P r ( R k = r | π k , ξ k ) = π k m 1 r 1 ξ k m r ( 1 ξ k ) r 1 + ( 1 π k ) 1 m , r = 1 , , m ,
with k = 1 , . . . , K , π k ( 0 , 1 ] , and ξ k ( 0 , 1 ) .
Then, the distribution of R k is uniquely identified by coordinates ( π k , ξ k ) in the unit square. This enables an easy and immediate representation of a set of ordinal variables. A graph of CUB parameters in the parameter space helps to detect CUB distributions that have similar shapes (that form clusters) or atypical behaviors. Moreover, it is possible to specify a representative model that summarizes the behavior of elements within a cluster when this includes ordinal responses about items in a common domain. Such a model is defined as a weighted CUB model R ˜ cub  ( π ˜ , ξ ˜ ) , where
π ˜ = k = 1 K w k π ^ k , ξ ˜ = k = 1 K w k ξ ^ k .
Capecchi et al. [39] denoted (2) as a composite indicator CUB model (CI-CUB) and proposed to use it as a 2D composite indicator for perceived discrimination. In the following section, the CI-CUB model is evaluated using equal weight.
Finally, CUB models are rather flexible tools because their parameters can be related to subjects’ covariates by means of a logistic link. In this case, the probability of selecting the r-th category for the i-th subject is as follows:
P r ( R i = r | y i , w i ) = π i m 1 r 1 ξ i m r ( 1 ξ i ) r 1 + ( 1 π i ) 1 m ,
for r = 1 , 2 , , m and i = 1 , 2 , , n , and
π i = 1 1 + e y i β ξ i = 1 1 + e w i γ l o g i t ( 1 π i ) = y i β = β 0 β 1 y i 1 β p y i p ; l o g i t ( 1 ξ i ) = w i γ = γ 0 γ 1 w i 1 γ q w i q ; ,
where y i and w i are the row vectors containing the covariate values of the i-th subject. Graphical representations of the parameter estimates for each subject profile show how subjects’ covariates impact responses.

3. Results

3.1. Well-Being Perception

In the Italian polycentric territorial system, the SNAI [13] marks a crucial step in public policy implementation, in which inner areas are finally considered assets worthy of targeted interventions. Hence, particularly in peripheral areas, it is important to consider individual perceptions of well-being and quality of life in order to design policies aimed at the local development of such territories or at least to mitigate the conditions of marginalization that they are experiencing.
The results of the modeling implementation concerning subjective well-being (SWBE) are presented in some detail in this section. This provides us with the opportunity to show several tools connected to the methodological framework of the present study. The basic CUB model in (1) was fitted to observed responses in order to obtain a reference for further improvements. The estimation results, computed in R using the CUB package available from the CRAN archive, are illustrated in Table 3. The coefficients are all significant (the corresponding Wald tests show a p-value < 0.001).
The estimated uncertainty ( 1 π ^ ) = 0.229 and feeling ( 1 ξ ^ ) = 0.687 depict a left-skewed probability distribution, revealing that the respondents generally expressed very positive evaluations of their levels of happiness or life satisfaction ( P r ( R 7 ) = 0.636 ). The graph (Figure 3) of fitted probabilities and observed relative frequencies shows good agreement. The BIC (Bayesian information criterion [40]) is 7788.747. The model’s specification can be improved, including subjects’ covariates, in order to lower this reference value. In particular, gender (GEND) and perceived income adequacy (PIA) can help depict possible differences in the response patterns.
Perceived well-being takes into account a person’s life experiences, goals, successes, setbacks, emotions, and interpersonal relationships, as well as moral and cultural surroundings. In the literature, numerous contributions have found a weak relationship between absolute income level and happiness, suggesting that perceived income adequacy could be a better explanatory factor (see, among others, [26,41,42]). Of course, people with higher absolute income levels do not always report income adequacy, but individuals with comparable absolute income levels can report different levels of income adequacy. Perceived income adequacy includes psychological factors that underlie spending and risk decisions, in addition to fulfilling financial responsibilities that are required to maintain or improve living standards. For these reasons, it can provide a good proxy to describe the inequality of efforts because it encompasses what individuals perceive as the final results of their personal choices (such as work, education, and preferences) [43].
Including the specified covariates, the BIC value of the fitted model (5) reduces to 7133.11 . The parameter estimates show that women’s uncertainty is larger than men’s, suggesting that women’s responses are more heterogeneous. Additionally, PIA has a negative impact on uncertainty, indicating that heterogeneity declines as perceived income adequacy increases. Furthermore, the feeling parameter depends on gender (GEND) very weakly, indicating that women express lower levels of subjective well-being compared to men, while perceived income adequacy (PIA) seems to exert a strong and positive impact.
l o g i t ( 1 π i ) = y i β = 3.5178 ( 0.6353 ) + 0.7876 ( 0.3772 ) G E N D i 1.0326 ( 0.1233 ) P I A i l o g i t ( 1 ξ i ) = w i γ = 0.9576 ( 0.0979 ) 0.0569 ( 0.0387 ) G E N D i + 0.2424 ( 0.0128 ) P I A i ,
where GEND is a dichotomous variable, assuming a value of 0 when the category of reference is ’men’ and a value of 1 otherwise, and PIA is categorized in three levels (low, medium, and high).
Moreover, Figure 4 provides graphs of ( 1 π ^ ) and ( 1 ξ ^ ) against the levels of income adequacy (PIA) for women and men. These plots clearly illustrate the impact of both covariates on the degree of concordance among responses (uncertainty) and feelings (reflecting the levels of reported well-being). Overall, there are 20 different groups (10 levels of perceived income adequacy for each category of men and women). For each level of income adequacy (x-axis), two groups are identified: women (red points) and men (blue points). First of all, male and female respondents show varying degrees of concordance in their responses concerning well-being. This variation clearly decreases as income satisfaction increases. The groups that show the least divergence are those at the extremes of the evaluation scale. When either women or men strongly believe that their income adequately meets their expectations and needs, reflected in high scores, they tend to provide very similar answers regarding their well-being. The same attitude emerges when both women and men perceive their income as insufficient.
Regarding feeling, women and men have the same behaviors, and only perceived income adequacy affects their evaluations of well-being. In particular, when respondents state that their income is not adequate to meet their needs (PIA 3 ), they tend to express negative evaluations of their well-being. Conversely, when reported PIA 8 , the probability of positive responses increases remarkably and the probability distribution of ratings is negatively skewed. In intermediate situations, where PIA 7 , a gradual transition of respondents from negative to positive evaluations produces a smooth shift in the asymmetry of the distribution. This result is consistent with the findings of Ackerman and Paolucci [24], who implemented an approach based on ANOVA and showed that increasing levels of income adequacy, both objectively and subjectively, make it much easier to achieve higher levels of satisfaction in various quality of life domains.

3.2. Models for Macro-Dimensions

In this section, we present the results for all items in the survey. The results will be described by visualizing the estimated model parameters in the parameter space. This allows for the detection of comparable and anomalous responses to different items. For this aim, the coordinate plane is split into four quadrants, defined by the intersecting lines passing through ( 1 π ) = 0.5 and ( 1 ξ ) = 0.5. The former line indicates a completely random choice between the components of the mixture distribution (feeling and uncertainty). The latter line, passing at ( 1 ξ ) = 0.5, corresponds to symmetric distributions, suggesting no preference for either extreme. The upper-left quadrant includes CUB distributions where respondents are satisfied with the proposed item and state this with a low level of uncertainty (happy and largely in accord). The upper-right quadrant contains CUB distributions where respondents are again satisfied with the object of assessment but show a significant degree of heterogeneity in their opinions (happy, even if not everyone agreed). The lower-left quadrant refers to distributions where most respondents express a low level of satisfaction with the item and demonstrate a low uncertainty (unhappy and largely in accordance). Finally, the lower-right quadrant includes respondents who not only agree less with the item but also exhibit a high level of uncertainty (unhappy, even if not everyone agrees). In this case, respondents are less satisfied with the conditions that they experience, but their evaluations are also very heterogeneous.
Furthermore, in order to summarize the responses in an aggregated and more straightforward form when the CUB models are very similar, we have implemented a synthetic CUB model using uniform weights (see Equation (2)). For instance, some of the items concerning the macro-dimension of economic opportunities and facilities (ECC) receive very similar evaluations, and the resulting CUB models are very similar to each other (see Figure 5). This set of variables includes, among others, evaluations of financial services (FINS) in the area of residence, possible advantages resulting from sustainable production (SUST), and the impact of remote work (REMW) on community development. For this reason, the distributions concerning this group of items are replaced by the related average CUB model (denoted in red in Figure 5). The same technique has been applied to summarize the ordinal variables describing individual well-being (IWB) and digitalization (DIG).
In the end, the final collection of models included the average CUB models for individual well-being (IWB), economic opportunities and facilities (ECC), and digitalization (DIG), as well as CUB models for family and social relationships (RELA), community support (COMS), community organization engagement (ENGA), seeking help/support from the community (ASKH), public support services (SUPS), perceived overall well-being (SWBE), and transport (TRASP).
Figure 6 shows the estimated parameters when the models do not include any covariates. Respondents appear to be satisfied with their way of life, both individually and overall (IWB and SWBE, respectively), as well as the quality of their family and social relationships (RELA). All these variables are located in the upper left quadrant. These positive opinions are quite shared, and response heterogeneity seemed modest. Moreover, COMS (community support) and ASKH (seeking community help/support) are located in the upper right quadrant. These variables describe the sense of solidarity and the connections within local communities that allow people to overcome adversity. Again, respondents’ perceptions are largely positive: they acknowledge the importance of social ties, but they are not entirely in accordance, and their responses are quite heterogeneous. Finally, participation in local associations (ENGA) can be found in the lower right corner of the plot. As previously stated, this indicates that the probability distribution of the corresponding ratings is significantly right-skewed. Therefore, community participation is generally low and the heterogeneity of responses is rather high.
These factors describe the latent dimension of social interactions, which appear to be more related to the personal nature of relationships than collective participation. However, further analysis will demonstrate that the use of CUB models without subjects’ covariates only provides a broad picture of how social interactions are perceived (see Figure 6). As will be discussed later, when the inequality of conditions is taken into consideration, the respondents belong to well-defined clusters with distinct behaviors.
Keeping with the visualization of the results, we observe that the lower right quadrant is occupied by transportation (TRAN). Overall, people have a negative opinion of the infrastructure and transportation in their neighborhoods. The communities under consideration reside primarily in rural regions that are situated on the periphery of the Apennines. Italy’s road and rail networks are well-established along its coasts, but they are less developed inland. As a result, these communities typically experience isolation, which this makes transport an absolute necessity.
Economic opportunities and facilities (ECC), digitalization (DIG), and public support services (SUPS) are located close to the center of the graph. These are the variables describing the respondents’ opinions about various aspects of the economic system (including remote working, sustainable production, business preparedness, and technological innovation), the role of digitalization (e.g., broadband connectivity, digital services, and digital innovation), and facilities provided by public institutions. Their positions indicate that the probability distribution estimated for each of these items is quite symmetric. Hence, responses do not show a clear predominance of positive opinions against negative ones. Nonetheless, people pay attention to these factors, which are usually instruments of territorial development policies, although it appears that they are not entirely aware of their significance or effects.
The introduction of gender (GEND) as a subject covariate allows for checking whether the inequality of opportunity has any effect on the respondents’ perceptions (see the model formulation in Equation (4)). Figure 7 shows that for all items under assessment, feeling and uncertainty estimates do not change substantially. Gender is a statistically significant covariate, but the two groups, men and women, show very similar attitudes toward the various items. Changes in the shapes of probability distributions are very small for most items. The variations in location relative to the vertical axis are rather modest. This implies that feelings are very similar. Only transport (TRAN) shows a remarkable vertical variation, indicating that the two groups have different levels of satisfaction. Men appear particularly dissatisfied with the quality of transport, whereas women, while equally disposed to provide negative assessments, assume a less critical position. This is probably justified by different involvement in working life and the different ages of survival of older people. In terms of movement along the x-axis, which represents the level of homogeneity among the responses, most items show an increase in the estimated uncertainty parameter when women are considered in comparison to men. This implies that heterogeneity among women is higher than that among men. Again, a few exceptions are observed: ASKH, SUPS, ECC, and TRAN. The most noticeable variation concerns transport (TRAN), for which the uncertainty estimate of women is smaller than that of men. This circumstance suggests that the women are less critical of the transport system and more likely to be in accord.
In our opinion, these findings may be useful in the development of policies for rural regions. Implementing measures for women’s empowerment may not yield major effects since this feature does not hold a prominent place in the construction of ideal environments that people want.
In order to address the inequality of efforts, perceived income adequacy (PIA) has been incorporated into the model. As previously indicated, the variable has been re-coded so that just three groups are identified (low, moderate, and high). Figure 8 displays how the behaviors of these three groups vary noticeably.
Those who claim to have more than enough income to meet their needs are likely to give positive feedback on all items and agree more than the other two groups of respondents. For this reason, the estimated feeling and uncertainty parameters occupy points in the upper quadrants. With higher probability than other groups, they also select less critical judgments for transport (TRAN). On the contrary, those who think that their income is insufficient have very different perceptions about the environments in which they live. Apart from RELA (family and social relationships) and IWB (individual well-being), which focus on human and social connections, all other factors are concentrated in the lower-right quadrant of the graph, where there is the highest level of discontent and heterogeneity.
Finally, the third group, whose income appears to be sufficient for their needs, is located between the two other clusters on the graph. This group tends to provide less positive assessments on all items than those who have a better impression of their economic standing. This is especially true for some factors characterizing social environments (i.e., participation in local associations, ENGA, community support, COMS, and seeking help/support, ASKH) and subjective well-being (SWBE).
Development and support policies in these areas should aim to shift all factors in the upper right and bottom quadrants of the graph into the upper right quadrant. Thus, the technique presented here could provide a tool for gaining preliminary perspectives of critical aspects on which to act in order to construct sustainable environments that align with residents’ needs and aspirations. It could also be used as a control tool in order to assess whether residents appreciate implemented policies [10].

4. Conclusions

Our study focused on the inner areas of Italy, which are frequently marginalized in terms of access to essential and advanced services, resulting in significant economic disadvantages. These regions have experienced a severe demographic decline, which has been even more remarkable in recent years. The Italian National Strategy for Inner Areas was designed to tackle this ongoing marginalization and depopulation by implementing policies at the municipality level in order to increase the quality of life of local populations, improve the use of territorial capital, and increase the capacities of social, economic, and environmental systems.
After outlining the general characteristics of Italy’s peripheral rural areas, this paper presented the results of a tailored survey conducted in three southern Italian areas, which have historically been characterized by structural isolation. The administered questionnaire aimed to assess the perceptual aspects of several dimensions of social and economic sustainability [44]. The evaluations collected from our sample of residents were analyzed using statistical models that are suitable for opinion data. Specifically, we examined respondents’ perceptions of their quality of life, community participation, and quality of social relationships. The survey also assessed residents’ opinions on the services available in their areas, including economic facilities, digitalization, and local transportation.
Our research indicates that the perception of subjective well-being in the surveyed peripheral areas of Italy is significantly influenced by individuals’ views on their income adequacy. In line with the literature, our research highlights a clear relationship between a positive self-assessment of overall well-being and a strong determination to express such an assessment [43]. As a matter of fact, people who state that they can easily make ends meet tend to express high levels of subjective well-being, regardless of gender. The tendency to express positive evaluations or perceptions among those who positively assess their economic status seems to persist across all other considered items. The opposite occurs when individuals perceive their economic conditions as largely inadequate. In the latter case, high heterogeneity emerges, which is explainable as intrinsic indecision.
The assessments gathered through the survey imply that offering innovative services, increasing digitalization, and providing effective transportation services are essential tools for reconnecting rural territories to more densely populated areas, particularly in the context of evident marginalization. Implementing public policies aimed at territorial development could, therefore, be crucial for enhancing quality of life and reducing inequalities. Local governments and decision-makers could use this information to design and implement development policies and interventions [6].
The literature [9,45] highlights that the quality of connections, both spatial and digital, and collaboration among different community actors can generate positive feedback loops. Specifically, enhancing basic services and providing advanced options can facilitate access to external resources that bolster peripheral areas, especially when integrated with local intervention strategies. Public policy initiatives and community-driven social innovation could alleviate feelings of marginalization in these rural regions, where access to quality services often hinges on individuals’ perceptions of their economic status. Moreover, the relational and participatory elements arising from social interactions and collaboration could serve as valuable assets that can be effectively harnessed.

Author Contributions

Conceptualization, S.C., M.C. and D.P.; methodology, S.C., M.C. and D.P.; software, S.C., M.C. and D.P.; investigation, S.C., M.C. and D.P.; data curation, S.C., M.C. and D.P.; writing—original draft preparation, S.C., M.C. and D.P.; writing—review and editing, S.C., M.C. and D.P. All authors have read and agreed to the published version of the manuscript.

Funding

The research work by M. Corduas was funded in part by the Italian Ministry of University and Research (MUR) (Project 20224CRB9E, CUP E53C24002270006).

Institutional Review Board Statement

Ethical review and approval were waived for this study because data are properly anonymised and informed consent was obtained at the time of original data collection.

Informed Consent Statement

Informed consent was obtained from all subjects involved in the study.

Data Availability Statement

The survey data presented in this article are not readily available because the dataset was part of a research study conducted within the ROIM 2024 project, coordinated by G. Quaranta (University of Basilicata) and financed by the Italian Ministry of University and Research (MUR) (CUP B53C23006720001).

Acknowledgments

We would like to thank G. Quaranta and the research team of the ROIM 2024 project for allowing us to use the data, and A. Sasso for providing the maps of the analyzed districts (Figure 1).

Conflicts of Interest

The authors declare no conflicts of interest.

Appendix A. Macro-Dimensions

1. Overall Well-Being
  • How strong is the level of your overall subjective well-being (SWBE)?
2. Individual Well-Being (IWB)
  • How deeply do you feel a connection to the community where you reside (CONN)?
  • How important do you consider residing in a small community to be for quality of life (QLIF)?
3. Social Relationships
  • How positively would you describe your relationships with members of your family and social circle (RELA)?
  • To what extent did your home community support you throughout the COVID-19 pandemic (COMS)?
  • How engaged do you consider yourself to be in the community organizations operating in your area (ENGA)?
  • Do you easily ask for help/support from members of the community where you live if you are in need (ASKH)?
  • How adequate are the support services provided by public institutions in your area of residence (SUPS)?
4. Economic Opportunities and Facilities (ECC)
  • How likely do you think the spread of remote work will support the development of the community in which you live (REMW)?
  • In your opinion, to what extent is the local business and institutional framework prepared to meet the challenges of digital and technological innovation (CHAL)?
  • How adequate do you think the financial services (e.g., access to credit) are in your area (FINS)?
  • How adequate do you think the business support services (e.g., business incubators) are in your area (BUSS)?
  • How adequate is the availability of skilled labor forces in your area (SKIL)?
  • How likely is it that there will be benefits in your area from sustainable/local production that appeals to sensitive consumers (SUST)?
5. Digitalization (DIG)
  • How adequate do you think advanced digital services (e.g., tech parks and research centers) are in your area (TECH)?
  • How adequate do you think digital services (such as broadband) are in your area (BROB)?
6. Transportation
  • How adequate do you think the transportation facilities and infrastructure (e.g., roads, railways, and airports) are in your area (TRAN)?

References

  1. Eizenberg, E.; Jabareen, Y. Social sustainability: A new conceptual framework. Sustainability 2017, 9, 68. [Google Scholar] [CrossRef]
  2. Colantonio, A. Social sustainability: A review and critique of traditional versus emerging themes and assessment methods. In SUE-Mot Conference 2009: Conference Proceedings; Horner, M., Price, A., Bebbington, J., Emmanuel, R., Eds.; Loughborough University: Loughborough, UK, 2009; pp. 865–885. [Google Scholar]
  3. Vallance, S.; Perkins, H.C.; Dixon, J.E. What is social sustainability? A clarification of concepts. Geoforum 2011, 42, 342–348. [Google Scholar] [CrossRef]
  4. Dempsey, N.; Bramley, G.; Power, S.; Brown, C. The social dimension of sustainable development: Defining urban social sustainability. Sustain. Develop. 2011, 19, 289–300. [Google Scholar] [CrossRef]
  5. Andrews, F.M.; Robinson, J.P. Measures of subjective well-being. In Measures of Personality and Social Psychological Attitudes; Robinson, J.P., Shaver, P.R., Wrightsman, L.S., Eds.; Academic Press: San Diego, CA, USA, 1991; pp. 61–114. [Google Scholar]
  6. Veenhoven, R. Why Social Policy Needs Subjective Indicators. Soc. Ind. Res. 2003, 58, 33–46. [Google Scholar] [CrossRef]
  7. Casini, L.; Boncinelli, F.; Gerini, F.; Romano, C.; Scozzafava, G.; Contini, C. Evaluating rural viability and well-being: Evidence from marginal areas in Tuscany. J. Rural Stud. 2020, 75, 104–115. [Google Scholar] [CrossRef]
  8. Zolin, M.B.; Ferretti, P.; Grandi, M. Sustainability in Peripheral and Ultra-Peripheral Rural Areas through a Multi-Attribute Analysis: The Case of the Italian Insular Region. Sustainability 2020, 12, 9380. [Google Scholar] [CrossRef]
  9. Becchetti, L.; Colcerasa, F.; Peragine, R.; Pisani, F. Inequality of opportunity and life satisfaction. Oxf. Econ. Pap. 2024, 76, 1204–1225. [Google Scholar] [CrossRef]
  10. Stiglitz, J.E.; Sen, A.; Fitoussi, J. Report of the Commission on the Measurement of Economic Performance et Social Progress. Available online: https://ec.europa.eu/eurostat/documents/8131721/8131772/Stiglitz-Sen-Fitoussi-Commission-report.pdf (accessed on 20 September 2024).
  11. He, Q.; Tong, H.; Liu, J.B. How does inequality affect the residents’ subjective well-being: Inequality of opportunity and inequality of effort. Front. Psychol. 2022, 13, 843854. [Google Scholar] [CrossRef]
  12. Brunori, P. The perception of inequality of opportunity in Europe. Rev. Income Wealth 2017, 63, 464–491. [Google Scholar] [CrossRef]
  13. Barca, F.; Casavola, P.; Lucatelli, S. A Strategy for Inner Areas in Italy: Definition, Objectives, Tools and Governance. Mater. UVAL 2014, 31, 10. Available online: http://politichecoesione.governo.it/media/2299/issue-31_documents_2014_inner-areas_eng.pdf (accessed on 2 November 2024).
  14. Romano, B.; Zullo, F.; Fiorini, L.; Montaldi, C. Micromunicipality (MM) and Inner Areas in Italy: A Challenge for National Land Policy. Sustainability 2022, 14, 15169. [Google Scholar] [CrossRef]
  15. Rossitti, M.; Dell’Ovo, M.; Oppio, A.; Torrieri, F. The Italian national strategy for inner areas (SNAI): A critical analysis of the indicator grid. Sustainability 2021, 13, 6927. [Google Scholar] [CrossRef]
  16. Copus, A.; Mantino, F. Inner Peripheries: An oxymoron or a real challenge for territorial cohesion? Ital. J. Plan. Pract. 2017, 7, 24–49. [Google Scholar]
  17. Urso, G.; Modica, M.; Faggian, A. Resilience and Sectoral Composition Change of Italian Inner Areas in Response to the Great Recession. Sustainability 2019, 11, 2679. [Google Scholar] [CrossRef]
  18. Basile, G.; Cavallo, A. Rural Identity, Authenticity, and Sustainability in Italian Inner Areas. Sustainability 2020, 12, 1272. [Google Scholar] [CrossRef]
  19. Cotella, G.; Brovarone, E. The Italian National Strategy for Inner Areas: A Place-Based Approach to Regional Development. In Dilemmas of Regional and Local Development; Routledge: London, UK, 2020. [Google Scholar] [CrossRef]
  20. ISTAT. La Demografia Delle Aree Interne: Dinamiche Recenti e Prospettive Future. Available online: https://www.istat.it/wp-content/uploads/2024/07/STATISTICA-FOCUS-DEMOGRAFIA-DELLE-AREE-INTERNE_26_07.pdf (accessed on 22 November 2024).
  21. Kasper, M.H. The Effects of Incentives, Interview Length, and Interviewer Characteristics on Response Rates in a CATI-Study. Int. J. Public Opin. Res. 2007, 19, 112–121. [Google Scholar]
  22. Kankaraš, M.; Capecchi, S. Neither agree nor disagree: Use and misuse of the neutral response category in Likert-type scales. METRON 2024. [Google Scholar] [CrossRef]
  23. Censimenti Permanenti: Datawarehouse. Available online: http://dati-censimentipermanenti.istat.it/?lang=en&SubSessionId=dc9323bd-c425-4f23-9902-074ffcd8059e (accessed on 5 November 2024).
  24. Ackerman, N.; Paolucci, B. Objective and subjective income adequacy: Their relationship to perceived life quality measures. Soc. Indic. Res. 1983, 12, 25–48. [Google Scholar] [CrossRef]
  25. Grable, J.E.; Cupples, S.; Fernatt, F.; Anderson, N. Evaluating the link between perceived income adequacy and financial satisfaction: A resource deficit hypothesis approach. Soc. Indic. Res. 2013, 114, 1109–1124. [Google Scholar] [CrossRef]
  26. Cruces, G.; Perez-Truglia, R.; Tetaz, M. Biased perceptions of income distribution and preferences for redistribution: Evidence from a survey experiment. J. Public Econ. 2013, 98, 100–112. [Google Scholar] [CrossRef]
  27. Meisters, R.; Putrik, P.; Westra, D.; Bosma, H.; Ruwaard, D.; Jansen, M. Two sides of the same coin? Absolute income and perceived income inadequacy as social determinants of health. Int. J. Equity Health 2023, 22, 128. [Google Scholar] [CrossRef] [PubMed]
  28. Gifi, A. Nonlinear Multivariate Analysis; Wiley: Chichester, UK, 1990. [Google Scholar]
  29. Mair, P.; De Leeuw, J. A general framework for multivariate analysis with optimal scaling: The R package aspect. J. Stat. Soft. 2010, 32, 1–23. [Google Scholar] [CrossRef]
  30. D’Elia, A.; Piccolo, D. A mixture model for preference data analysis. Comp. Stat. Data Anal. 2005, 49, 917–934. [Google Scholar] [CrossRef]
  31. Piccolo, D. On the moments of a mixture of Uniform and Shifted Binomial random variables. Quad. Stat. 2003, 5, 85–104. [Google Scholar]
  32. Piccolo, D.; Simone, R. The class of CUB models: Statistical foundations, inferential issues and empirical evidence, (with discussion and rejoinder). Stat. Meth. Appl. 2019, 28, 389–435. [Google Scholar] [CrossRef]
  33. Simone, R.; Corduas, M.; Piccolo, D. Dynamic modelling of price expectations and judgments. METRON 2023, 81, 323–342. [Google Scholar] [CrossRef]
  34. Agresti, A. Categorical Data Analysis; John Wiley & Sons: New York, NY, USA, 2012. [Google Scholar]
  35. Allik, J. The Binomial distribution in psychological measurement. Psych. Meth. 2014, 19, 150–162. [Google Scholar]
  36. Grilli, L.; Rampichini, C.; Varriale, R. Binomial mixture modelling of university credits. Commun. Stat. Theory Methods 2015, 44, 4866–4879. [Google Scholar] [CrossRef]
  37. Zhou, Y.; Lange, C. Empirical and statistical reasoning support the use of a shifted Binomial distribution for the feeling component. J. Appl. Stat. 2009, 36, 465–478. [Google Scholar]
  38. Andrich, D. Likert scaling and the analysis of Likert-type questionnaires. Psychometrika 1978, 43, 553–570. [Google Scholar]
  39. Capecchi, S.; Simone, R. A proposal for a model-based composite indicator: Experience on perceived discrimination in Europe. Soc. Indic. Res. 2019, 141, 95–110. [Google Scholar] [CrossRef]
  40. Schwarz, G. Estimating the dimension of a model. Ann. Stat. 1978, 6, 461–464. [Google Scholar] [CrossRef]
  41. Easterlin, R.A.; McVey, L.A.; Switek, M.; Sawangfa, O.; Zweig, J.S. The happiness-income paradox revisited. Proc. Natl. Acad. Sci. USA 2010, 107, 22463–22468. [Google Scholar] [CrossRef]
  42. Mikucka, M.; Sarracino, F.; Dubrow, J.K. When does economic growth improve life satisfaction? Multilevel analysis of the roles of social trust and income inequality in 46 countries, 1981–2012. World Dev. 2017, 93, 447–459. [Google Scholar] [CrossRef]
  43. Vezzoli, M.; Valtorta, R.R.; Mari, S.; Durante, F.; Volpato, C. Effects of objective and subjective indicators of economic inequality on subjective well-being: Underlying mechanisms. J. Appl. Soc. Psych. 2023, 53, 85–100. [Google Scholar] [CrossRef]
  44. Brenner, B.; Hartl, B. The perceived relationship between digitalization and ecological, economic, and social sustainability. J. Clean. Prod. 2021, 315, 128128. [Google Scholar] [CrossRef]
  45. Bock, B. Rural marginalisation and the role of social innovation; a turn towards endogenous development and rural reconnection. Sociol. Rural. 2016, 56, 552–573. [Google Scholar] [CrossRef]
Figure 1. Average altitude of the municipalities in the three studied inner areas.
Sustainability 17 02078 g001
Figure 2. Principal component analysis results: loadings plot (left panel) and score plot of individuals (right panel).
Sustainability 17 02078 g002
Figure 3. Subjective well-being: observed and fitted CUB distributions.
Sustainability 17 02078 g003
Figure 4. SWBE estimated model parameters by gender (GEND) and perceived income adequacy (PIA): uncertainty (left panel) and feeling (right panel).
Sustainability 17 02078 g004
Figure 5. CUB models for individual items and the average model of items concerning economic opportunities and facilities (red).
Sustainability 17 02078 g005
Figure 6. Feeling and uncertainty of CUB models for all items.
Sustainability 17 02078 g006
Figure 7. Feeling and uncertainty of CUB models by gender (red = women; blue = men).
Sustainability 17 02078 g007
Figure 8. Feeling and uncertainty of CUB models by income adequacy (green = high PIA; blue = moderate PIA; red = low PIA).
Sustainability 17 02078 g008
Table 1. Characteristics of the three studied inner areas.
AreaLand Area (km2)Mean Altitude (m)Population DensityAging Index *Birth Rate *
Mainarde321.78644.3737.11314.895.11
Sele-Tanagro781.83502.5271.29161.816.68
Montagna Materana644.66698.5614.69383.944.88
* The aging index is defined as the number of people aged 65 and over per 100 youths under age 15. The birth rate is defined as the number of annual live births over the estimated population size midyear multiplied by 1000.
Table 2. Main sociodemographic characteristics of the sample.
VariableCategory/ClassPercentage
Gender
Male51.0
Female49.0
Marital Status
Single33.1
Married54.3
Divorced/Widowed12.6
Age
18–246.6
25–6571.0
65 + 22.4
Employment Status
Employed41.5
Unemployed or Not in labor force58.5
Table 3. SWBE estimation results from the CUB model without covariates (standard errors in parentheses).
Variable π ^ ξ ^ max log-lik BIC
SWBE0.7710.313−3886.8097788.747
(0.018)(0.005)
Disclaimer/Publisher’s Note: The statements, opinions and data contained in all publications are solely those of the individual author(s) and contributor(s) and not of MDPI and/or the editor(s). MDPI and/or the editor(s) disclaim responsibility for any injury to people or property resulting from any ideas, methods, instructions or products referred to in the content.

