Article

Increasing Selin Co Lake Area in the Tibet Plateau with Its Moisture Cycle

1
Guangdong Basic Research Center of Excellence for Ecological Security and Green Development, School of Ecology, Environment and Resources, Guangdong University of Technology, Guangzhou 510006, China
2
Advanced Interdisciplinary Institute of Environment and Ecology, Beijing Normal University, Zhuhai 519087, China
3
State Key Laboratory of Earth Surface Processes and Resource Ecology, Beijing Normal University, Beijing 100875, China
4
State Key Laboratory of Simulation and Regulation of Water Cycle in River Basin, China Institute of Water Resources and Hydropower Research, Beijing 100038, China
5
Research Center on Flood & Drought Disaster Reduction of the Ministry of Water Resources, Beijing 100038, China
6
Department of Biological and Agricultural Engineering, Texas A&M University, College Station, TX 77843, USA
7
Zachry Department of Civil & Environmental Engineering, Texas A&M University, College Station, TX 77843, USA
8
National Water and Energy Center, UAE University, Al Ain P.O. Box 15551, United Arab Emirates
9
National Key Laboratory of Remote Sensing Information and Imagery Analyzing Technology, Beijing Research Institute of Uranium Geology, Beijing 100029, China
10
National Meteorological Information Center, China Meteorological Administration, Beijing 100081, China
*
Author to whom correspondence should be addressed.
Sustainability 2025, 17(5), 2024; https://doi.org/10.3390/su17052024
Submission received: 9 January 2025 / Revised: 20 February 2025 / Accepted: 23 February 2025 / Published: 26 February 2025

Abstract

:
Lake areas across the Tibet Plateau have been taken as the major indicator of water resources changes. However, drivers behind spatiotemporal variations of lake areas over the Tibet Plateau have remained obscure. Selin Co Lake is the largest lake in the Qinghai–Tibet Plateau. Here, we delineate the Selin Co Lake area changes during the period of 1988–2023 based on Landsat remote sensing data. We also delved into causes behind the Selin Co Lake area changes from perspectives of glacier changes and tracing water vapor sources. We identified the persistently increasing lake area of Selin Co Lake. The Selin Co Lake area reached 2462.59 km2 in 2023. We delineated the basin of Selin Co Lake and found a generally decreasing tendency of the main glaciers within the Selin Co basin. Specifically, the loss in the Geladandong Glacier area is 17.39 km2 in total and the loss in the Jiagang Glacier area is 76.42 km2. We found that the melting glaciers and precipitation within the Selin Co basin are the prime drivers behind the increasing the Selin Co Lake area. In the Selin Co basin, approximately 89.12% of the evaporation source of precipitation is propagated external to the Selin Co basin by the westerlies and the Indian monsoon. The internal hydrological circulation rate is 10.88%, while 30.61% of the moisture transportation is sourced from the ocean, and 69.39% is from the continental land. The moisture transportation from the ocean evaporation shows a significant increasing trend, which may contribute to the continued expansion of the Selin Co Lake area.

1. Introduction

Under global warming, the Qinghai–Tibet Plateau is particularly vulnerable to the impact of climate change [1], making it a sensitive area for global climate change and water cycle changes [2]. The water vapor budget and water supply of the Qinghai–Tibet Plateau have changed in recent decades, with increased glacier meltwater and severe degradation of permafrost [3,4], which has intensified the hydrological cycle and conversion efficiency in the region. The Qinghai–Tibet Plateau is home to many lakes and glaciers, with an average elevation of over 4000 m. As an important barrier and cornerstone to ensure the ecological environment and water security in China and Asia [5,6], the Qinghai–Tibet Plateau is facing unprecedented challenges to water sustainability due to the increasingly disruptive effects of climate change [7,8].
Lakes are important natural mediators that connect the various spheres (atmosphere, biosphere, pedosphere, and terrestrial water cycle) through their involvement in the water and energy balance [9]. Indicators related to lakes are often used to reflect climate change on the Tibetan Plateau [9]. In the visible light spectrum, lakes exhibit distinct spectral differences from other land cover types, making satellite remote sensing images valuable for monitoring lake area changes. The Tibetan Plateau hosts 1236 lakes (>1 km2), accounting for 51.4% of China’s lake area [10,11,12]. Lakes within the Tibetan Plateau have expanded significantly since 2000 [13], with the lake expansion rate in the 2000s being three times larger than that in the 1990s [14,15]. From 2017 to 2018, due to unusually high precipitation, the lake areas experienced an unprecedented expansion, and lake water levels rose by 1.4 to 2.8 m [16]. Of all the lakes, the expansion of Qolorco Lake was the most significant, and it has become the largest lake on the Qinghai–Tibet Plateau [11,17,18,19].
The Selin Co basin is located in the western part of the Tibet Autonomous Region, where its climate is controlled by the interaction between the Indian monsoon system and westerly circulation [20]. The region has many lakes and river systems and belongs to the alpine wetland ecosystem. The lakes and glaciers in this area maintain the supply of regional water resources and ecological balance and play a key role in climate regulation. In recent years, due to the rapid expansion of the Selin Co area, a series of adverse consequences have arisen. For example, the grassland pasture has been flooded, causing the nearby herders to evacuate. As the lake surface area expands, it may connect with the north-facing Bangzhe Co, Najiang Co, and the east-facing Ban’ge Co, thereby affecting the normal operation of transportation routes.
The melting of glaciers and increased water vapor from precipitation are believed to be the main factors contributing to the expansion of lakes in the Tibetan Plateau. Approximately 70% of the available water on the Tibetan Plateau is stored in glaciers [21,22,23]. The glacier mass on the Qinghai–Tibet Plateau decreased at a rate of −21.1 ± 4.8 Gt/year during the period from 2000 to 2019 [24]. Because of warming, glacier melting has supplemented surface runoff, and the Selin Co basin, which is a typical closed inland basin, has seen an increase in surface runoff, leading to an increase in lake water volume and area.
Water vapor transport is an important link in the water cycle process on the Qinghai–Tibet Plateau and is also the main source of precipitation. Zhang et al. [25] determined the four main sources of water vapor for the Qinghai–Tibet Plateau (Asia, Indian Ocean, North Africa, and North Atlantic) by tracing water vapor. Water vapor from the Indian Ocean, North Atlantic, and Eurasia mainly enters the Qinghai–Tibet Plateau through two water vapor channels in the westerly and Indian monsoon directions [26,27,28,29]. The driving factors for the expansion of main lakes in the Selin Co basin still remain controversial, and there is still a gap in the study of water vapor source in the basin, so it is of great scientific significance to reveal the driving mechanisms of the temporal and spatial evolution of lakes in the Selin Co basin from both the perspectives of glacier area change and water vapor source.
In this study, we attempted to analyze the spatiotemporal patterns of water resources and water vapor sources in the Selin Co basin under climate change using remote sensing data and reanalysis data. Therefore, the scientific issues to be addressed included: (1) What are the spatiotemporal variations of the Selin Co area? (2) What are the spatiotemporal variations of glaciers in the Selin Co basin? (3) How does moisture transport affect Selin Co basin precipitation? This study is of great practical significance and scientific value in understanding the sustainable development of water resources in river basins and solving and adapting to the water resources problems that the Qinghai–Tibet Plateau will face, ensuring the sustainable development of water resources in the Qinghai–Tibet Plateau and improving human well-being.

2. Materials and Methods
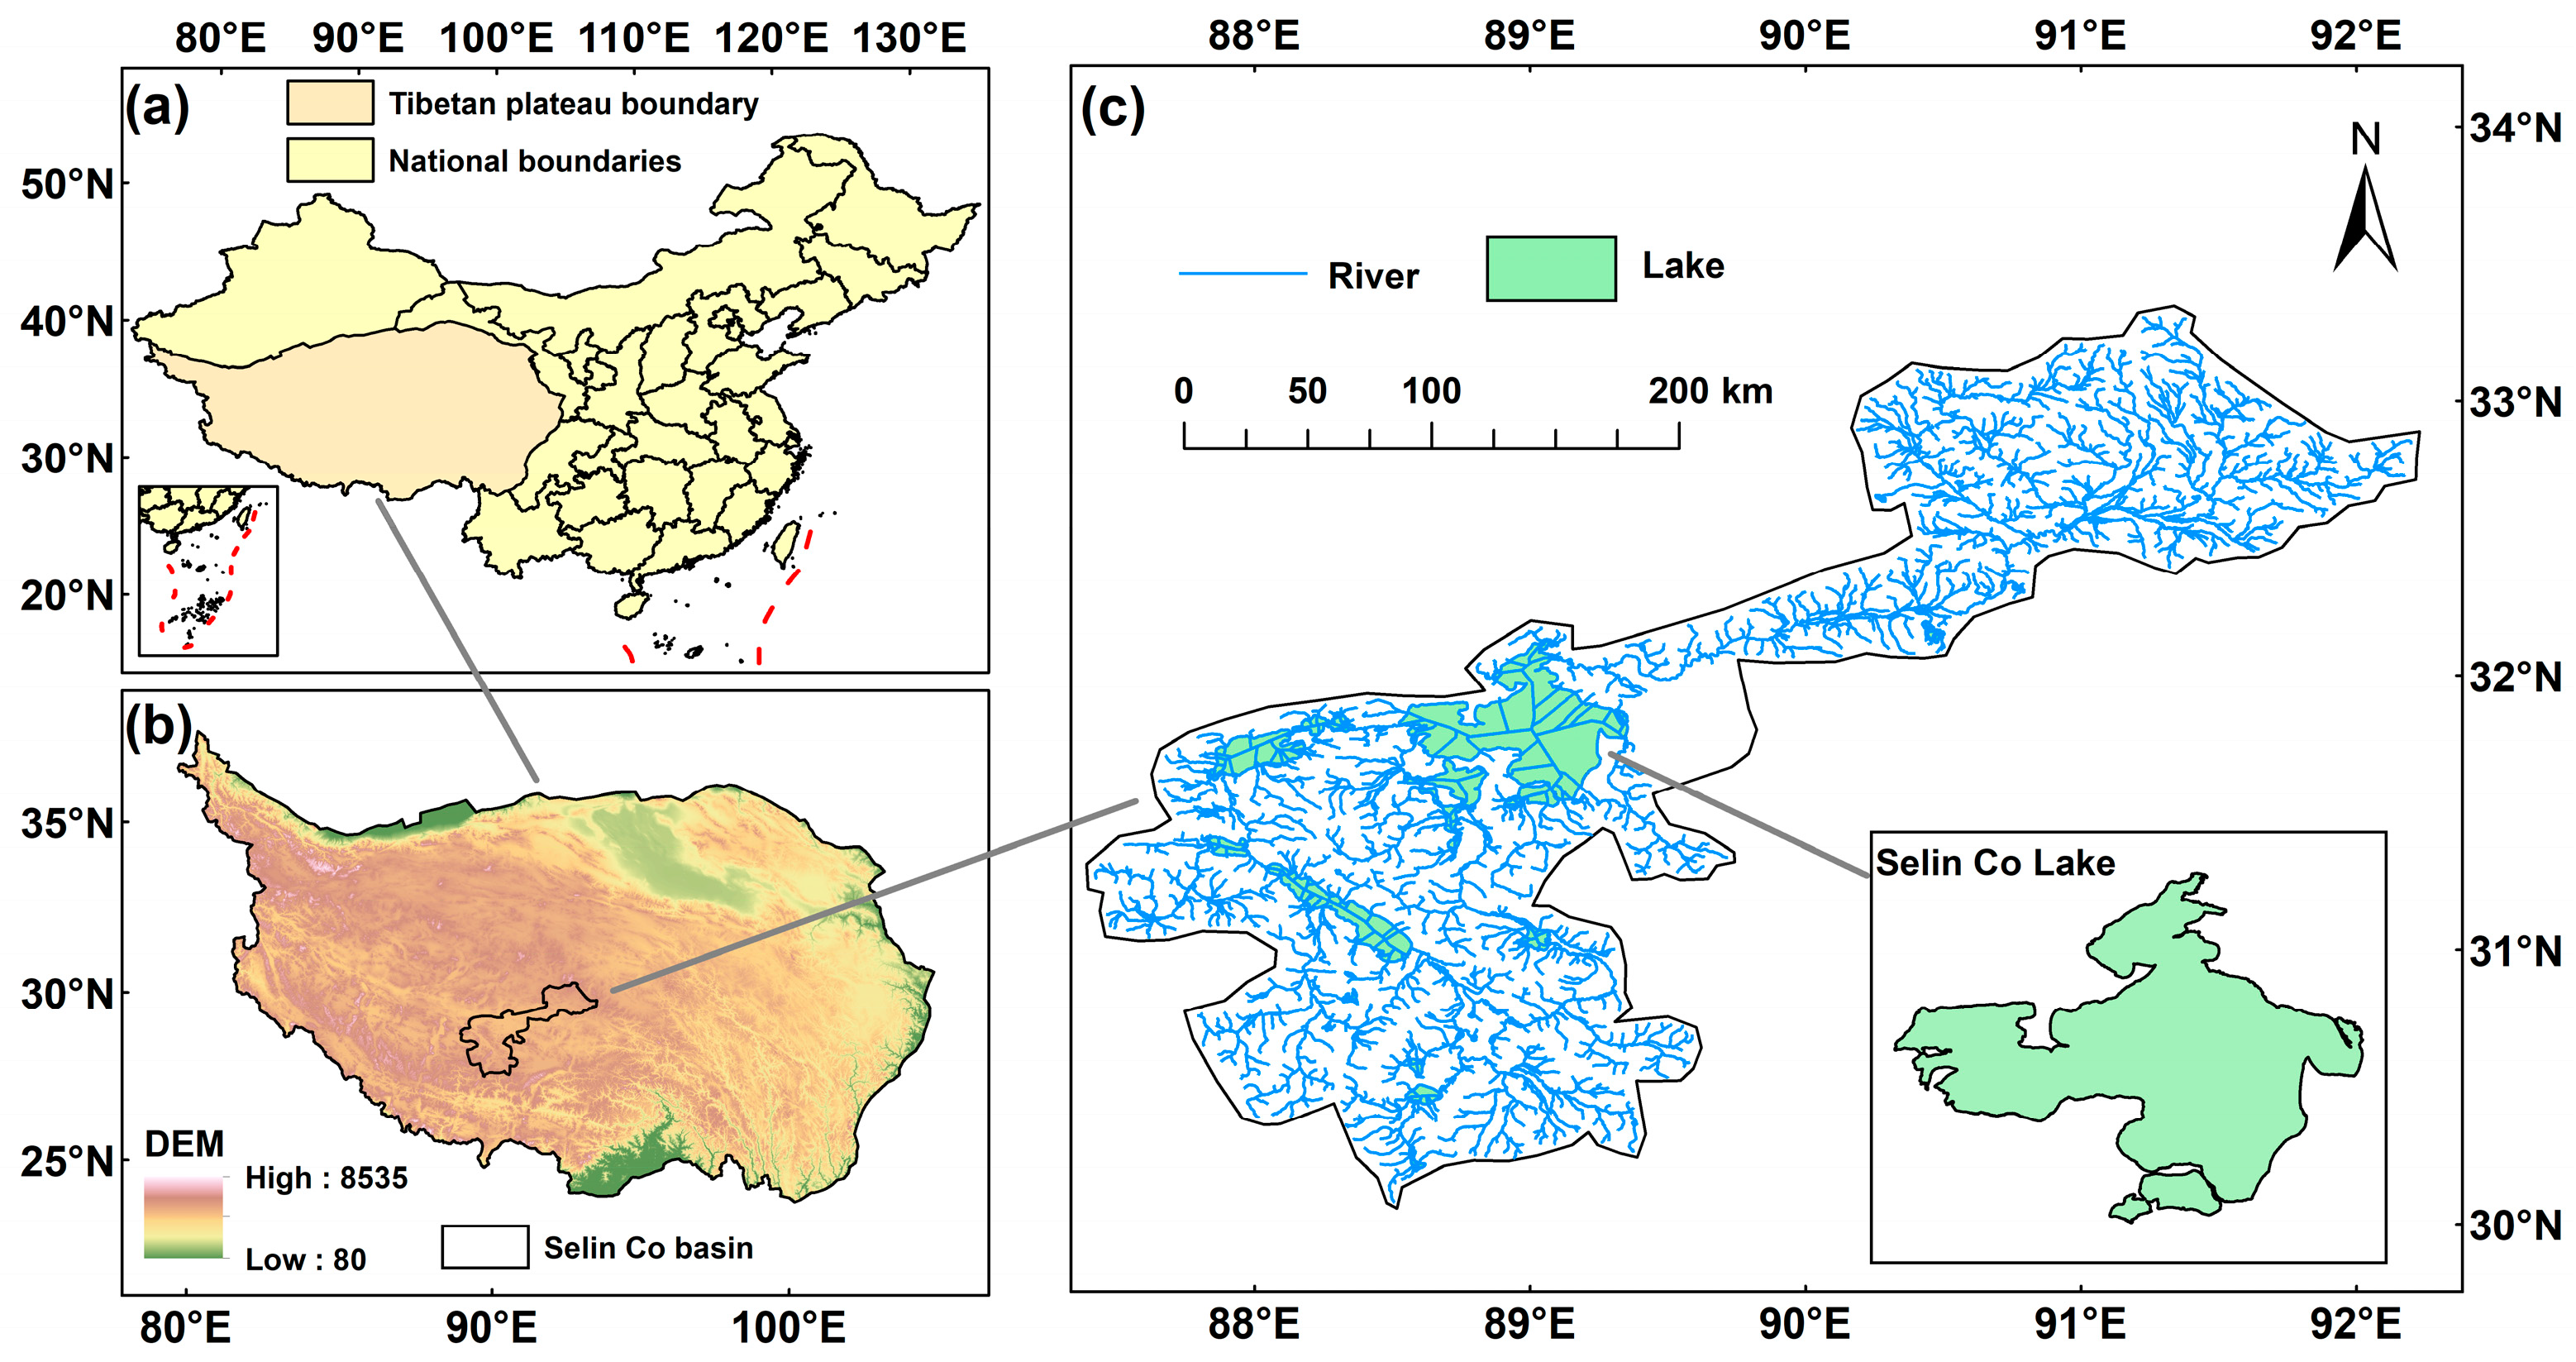
2.1. Study Area

The Selin Co basin (30°7′–33°17′ N, 87°27′–92°12′ E) has a sub-frigid and semi-arid climate, with an average annual precipitation of about 385 mm [30] (Figure 1), and precipitation is mainly concentrated from June to August [31]. The average annual temperature in the basin is below 0 °C [32], and it is cold in winter and spring with strong winds [33]. The Selin Co Lake surface is 4530 m above sea level. There are many rivers and lakes in the basin (all lakes are more than 4000 m above sea level) that are interconnected to form an inland lake group, ranking first among the inland water systems in Tibet [34]. It is located in the northern part of the Qinghai–Tibet Plateau, with mountain ridges exceeding 5000 m in height. Where mountain ridges often exceed 5000 m in height, perpetual snow and glaciers serve as significant water sources for many lakes [35]. The main environmental problem faced in recent years is the expansion of the lake [36]. Its lake area has exceeded Nam Co and has become the largest saltwater lake in Tibet.

2.2. Data

2.2.1. Landsat

We used Landsat 5 TM, Landsat 7 ETM, and Landsat 8 OLI to extract lake and glacier areas, with the data sourced from the Google Earth Engine database. The lake area was studied from 1988 to 2023, and the glacier area was studied from 1986 to 2023, with a spatial resolution of 30 m. Specific information from the Landsat data is shown in Table 1.

2.2.2. Climate Data

We selected four driving factors: average annual precipitation (Pre), average annual temperature (Tm), average annual ice/snow area (SIA), and average annual snow depth (Snd). (1) Temperature and precipitation: we used the CN05.1 gridded observation dataset (http://data.cma.cn/, 6 January 2025) [37], which includes observation data from more than 2400 stations in China, including daily average temperature, precipitation, and other variables, with a spatial resolution of 0.25° × 0.25° and a time range of 1990–2020; (2) Ice/snow area: data were taken from the dataset “China 30 m annual land cover from 1990 to 2019” (Version 1.0.2) [38], with a spatial resolution of 30 m and a time range of 1990–2020; (3) Snow depth: the dataset used is the “China Snow Depth Long Time Series Dataset (1979–2023) [39,40,41,42], with a spatial resolution of 0.25° × 0.25°.

2.2.3. ERA5 Dataset

The ERA5 reanalysis dataset is the latest version [43] of the fifth-generation atmospheric reanalysis product of the European Centre for Medium-Range Weather Forecasts (ECMWF) and has good accuracy and widespread recognition globally. In order to run the WAM-2layers model, hourly specific humidity, wind speed, surface pressure, dew point temperature, total column water vapor, precipitation, and evaporation were obtained, with a spatial resolution of 0.25° × 0.25° during the period of 1990–2021. Among them, specific humidity and wind field included 17 layers of atmospheric data (100, 200, 300, 400, 500, 600, 700, 750, 800, 825, 850, 875, 900, 925, 950, 975, and 1000 hPa). The website for obtaining the ERA5 reanalysis dataset is: https://www.ecmwf.int/en/forecasts/datasets/reanalysis-datasets/era5, 6 January 2025.

2.3. Methods

2.3.1. Lake Information Extraction

The water body index threshold method was used for extraction. The principle of the water body index method is to improve the accuracy of ground object identification and better extract ground object information by expanding the spectral differences between different types of ground objects. This study used the normalized difference water index (NDWI) and combined the NDWI value of the lake surface boundary in the resulting image with manual visual interpretation to extract the water body boundary year by year [44].
N D W I = G R E E N N I R G R E E N + N I R
where GREEN is the green band and NIR is the near-infrared band.
The lake area data were mainly concentrated from July to September (the lake is in the wet season and the image data are cloudless or less cloudy). In some years, due to the lack of images from July to September, images from adjacent months were selected.

2.3.2. Glacier Information Extraction

The normalized difference snow index is widely used in glacier extraction [45] and has been proven to be an accurate, fast, and robust method for detecting clean glacier ice [46]. The NDSI of each image set was calculated, based on the GEE platform. The calculation formula for NDSI was:
N D S I = G R E E N S W I R G R E E N + S W I R
where GREEN is the reflectivity of the green band, the corresponding band in Landsat5 and Landsat7 is SR_B2, and the corresponding band in Landsat8 is SR_B3; SWIR is the reflectivity of the shortwave infrared band, the corresponding band in Landsat5 and Landsat7 is SR_B5, and the corresponding band in Landsat8 is SR_B6.
According to existing studies, it has been found that the NDSI of glaciers in Landsat images is generally higher than 0.4; therefore, 0.4 was used as an effective threshold for glacier extraction [47]. Data for missing years were interpolated using the average of results for the preceding and following years.

2.3.3. Water Accounting Model-2layers Model

To trace moisture transport in the Selin Co basin, this study employed the Water Accounting Model-2layers (WAM-2layers) model for source tracing of water vapor. The WAM-2layers model is a widely used tool for tracking atmospheric moisture flows and quantifying the contribution of evaporation to precipitation in specific regions. It is particularly useful for studying the water cycle, moisture recycling, formation mechanisms of drought, and the impacts of climate change on regional precipitation patterns [48,49,50,51]. Several studies have validated the applicability of WAM-2layers over the Tibetan Plateau [52,53,54]. The WAM-2layers model is an Eulerian-based method that divides the vertical air column into two layers (top and bottom), maintains full mixing of water vapor within each layer, and transfers water vapor between layers through vertical airflow. It then tracks evaporation and precipitation of water vapor within the air column based on atmospheric water balance formulae [49,50,55].
S k t = ( S k u k ) x + ( S k v k ) y + E k P k + ε k ± F v
In this model, S k represents the atmospheric water vapor storage at layer k (top or bottom), E represents evaporation, P represents precipitation, u and v represent the zonal and meridional wind speeds, and ε k represents the residual. F v represents the vertical water vapor transport.
We selected the Selin Co basin as the sink area to monitor water vapor on a monthly basis. In the context of the WAM-2layers model, it is assumed that precipitation in the sink area is equivalent to the cumulative evaporation traced through precipitation events [50]. The retrospective analysis was employed to examine both annual and seasonal variations. The operating manual is available at: https://wam2layers.readthedocs.io/en/latest/index.html, 6 January 2025. To accurately reflect the shear height of the wind field in the model’s upper and lower layers, 17 layers of specific humidity and wind field data (including 100, 200, 300, 400, 500, 600, 700, 750, 800, 825, 850, 875, 900, 925, 950, 975, and 1000 hPa) were selected from the driving data. All input parameters for running the WAM-2layers model were derived from the ERA5 reanalysis data, including specific humidity, wind speed, surface pressure, dewpoint temperature, total column water vapor, precipitation, and evaporation. All variables were downloaded at an hourly resolution and then interpolated to a 10-minute time step. The grid-based 0.25° × 0.25° ERA5 reanalysis data set spanned the period from 1991 to 2020.

3. Results

3.1. Changes in Characteristics of Lake Area in Selin Co

Figure 2 shows the spatiotemporal changes of Selin Co from 1988 to 2023. From the perspective of inter-annual changes, from 1988 to 2023, Selin Co experienced significant expansion, and its lake area maintained a growth trend (Figure 2c). As can be seen from Table 2, the multi-year average lake area of Selin Co is 2095.32 km2. The minimum value of the lake area occurred in 1989, which was 1673.03 km2, and the maximum value occurred in 2023, which was as high as 2462.59 km2. The maximum value was almost 1.5 times the minimum value, and the difference between the two reached 789.56 km2. Compared with 1988, the lake area of Selin Co increased by 760.16 km2 in 2023, a growth rate of 44.65%, and the average annual growth rate reached 271.58 km2/10 years (Figure 2c). The changes in its area showed a large volatility (CV = 14.38%). During 1988–2000, the average area of the lake was 1735.53 km2, with small fluctuations (Range = 167.08 km2, CV = 2.49%). From 2001 to 2010, the lake area increased rapidly, with the average area reaching 2170.02 km2, and the fluctuation also increased significantly (Range = 409.14 km2, CV = 7.06%). In the third stage, that is, from 2011 to 2023, the lake area continued to grow steadily, with an average area of 2397.64 km2, but the fluctuations decreased (Range = 104.94 km2, CV = 1.51%). Changes in the lake area are a sensitive indicator of climate change response and deeply reflect the interaction and adaptation dynamics of lake ecosystems under the influence of climate factors. Zhang et al. detected a significant shift in climate conditions in the Qinghai–Tibet Plateau during 1997/1998 [56], with a significant increase in precipitation and rapid melting of alpine glaciers [57], which led to the continued expansion of most lakes on the plateau since the late 1990s [14]. At the same time, Li et al. found that the dramatic changes in lakes from 1970 to 2010 (especially after 2000) were consistent with the pattern of permafrost degradation caused by rising temperatures [58].
In order to reflect the changes in the lake area more clearly, the spatial dynamic distribution changes were carried out using the data with obvious changes in the lake area from 1988 to 2023 (Figure 2a,b). From the perspective of spatial changes, the expansion of Selin Co was mainly concentrated north and south of the lake. Especially in the comparison between 2005 and 1990, the expansion of the lake shoreline in the north was particularly significant. During this period, Selin Co and Yagen Co began to be connected and finally merged completely in 2005. This change made the area of Selin Co increase significantly. In summary, Selin Co has experienced significant expansion in the past few decades, and its changes are mainly reflected in the continuous increase in the lake area and the outward expansion of the lake shoreline.

3.2. Climatic Driving Factors of Lake Area Changes in Selin Co

The changes in meteorological characteristics of the Serin Co basin were analyzed using anomaly index (AI) and moving averages (MA) (Figure 3). From 1990 to 2020, precipitation in the Serin Co basin generally showed an increasing trend. The multi-year average precipitation was around 398 mm. The AI from 1992 to 1997 was lower than the multi-year average. During this period, precipitation had a relatively obvious decreasing trend (Figure 3a). The temperature in the basin continued to rise, and this warming trend became more significant after 2000 (Figure 3b). In the past 30 years, SIA in the Selin Co basin has shown an obvious shrinking trend, which is consistent with the overall melting and disappearance of glaciers in the Tibetan Plateau. Under the background of global warming, glaciers are melting and retreating at an accelerated rate [59]. The Tibetan Plateau is warming at twice the global average rate, and the duration and cumulative intensity of heat waves on the glacier surface increased between 2001 and 2020 [60], and is experiencing a widespread and severe retreat [61]. After 2011, SIA has been below the multi-year average value and shows a continuous decreasing trend (Figure 3c). Similar to the SIA, the Snd in the basin also showed a downward trend, but between 1994 and 2000, the Snd increased and was much higher than the multi-year average compared with other years (Figure 3d).

3.3. Changes in Characteristics of Selin Co Glacier Area

In the four decades from 1986 to 2023, the area of the Geladandong Glacier decreased by 17.39 square kilometers, with an average annual decrease of approximately 0.64 km2, showing an obvious state of retreat (Figure 4a and Figure 5a). The minimum value of the glacier area occurred in 2019, which was 98.76 km2, while the maximum value was in 1989, reaching 130.24 km2. This significant fluctuation demonstrated the glacier’s sensitivity to climate change. Further analysis of the glacier area in three different time periods (1986–2000, 2001–2010, and 2011–2023) showed that although the area fluctuations were slightly different, the average glacier area showed a downward trend, once again confirming the cause of glacier retreat trend (Table 3).
Similarly, Jiagang Glacier also experienced a significant retreat between 1988 and 2023 (Figure 4a and Figure 5a). During this period, the glacier area decreased by 76.42 km2, with an average reduction rate of 1.46 km2 per year, highlighting the serious challenges faced by glaciers in this region. Similar to Geladandong Glacier, the area of Jiagang Glacier also fluctuated greatly. The smallest area appeared in 2022, which was only 33.78 km2 while the largest area reached 117.64 km2 in 1993. Analyzing the data from the three time periods, the average area of Jiagang Glacier also showed a downward trend, although the magnitude of fluctuation in different time periods was different.
In summary, both Geladandong Glacier and Jiagang Glacier experienced significant retreats in the past few decades. Compared with Geladandong, the glacier area of Jiagang is not only smaller but also more scattered and fragmented in shape. Due to its small size, the glacier is more sensitive to climate change, so its retreat is more significant [62]. This retreat trend will have a profound impact on the local ecological environment and climate system.

3.4. Water Vapor Transport in the Selin Co Basin

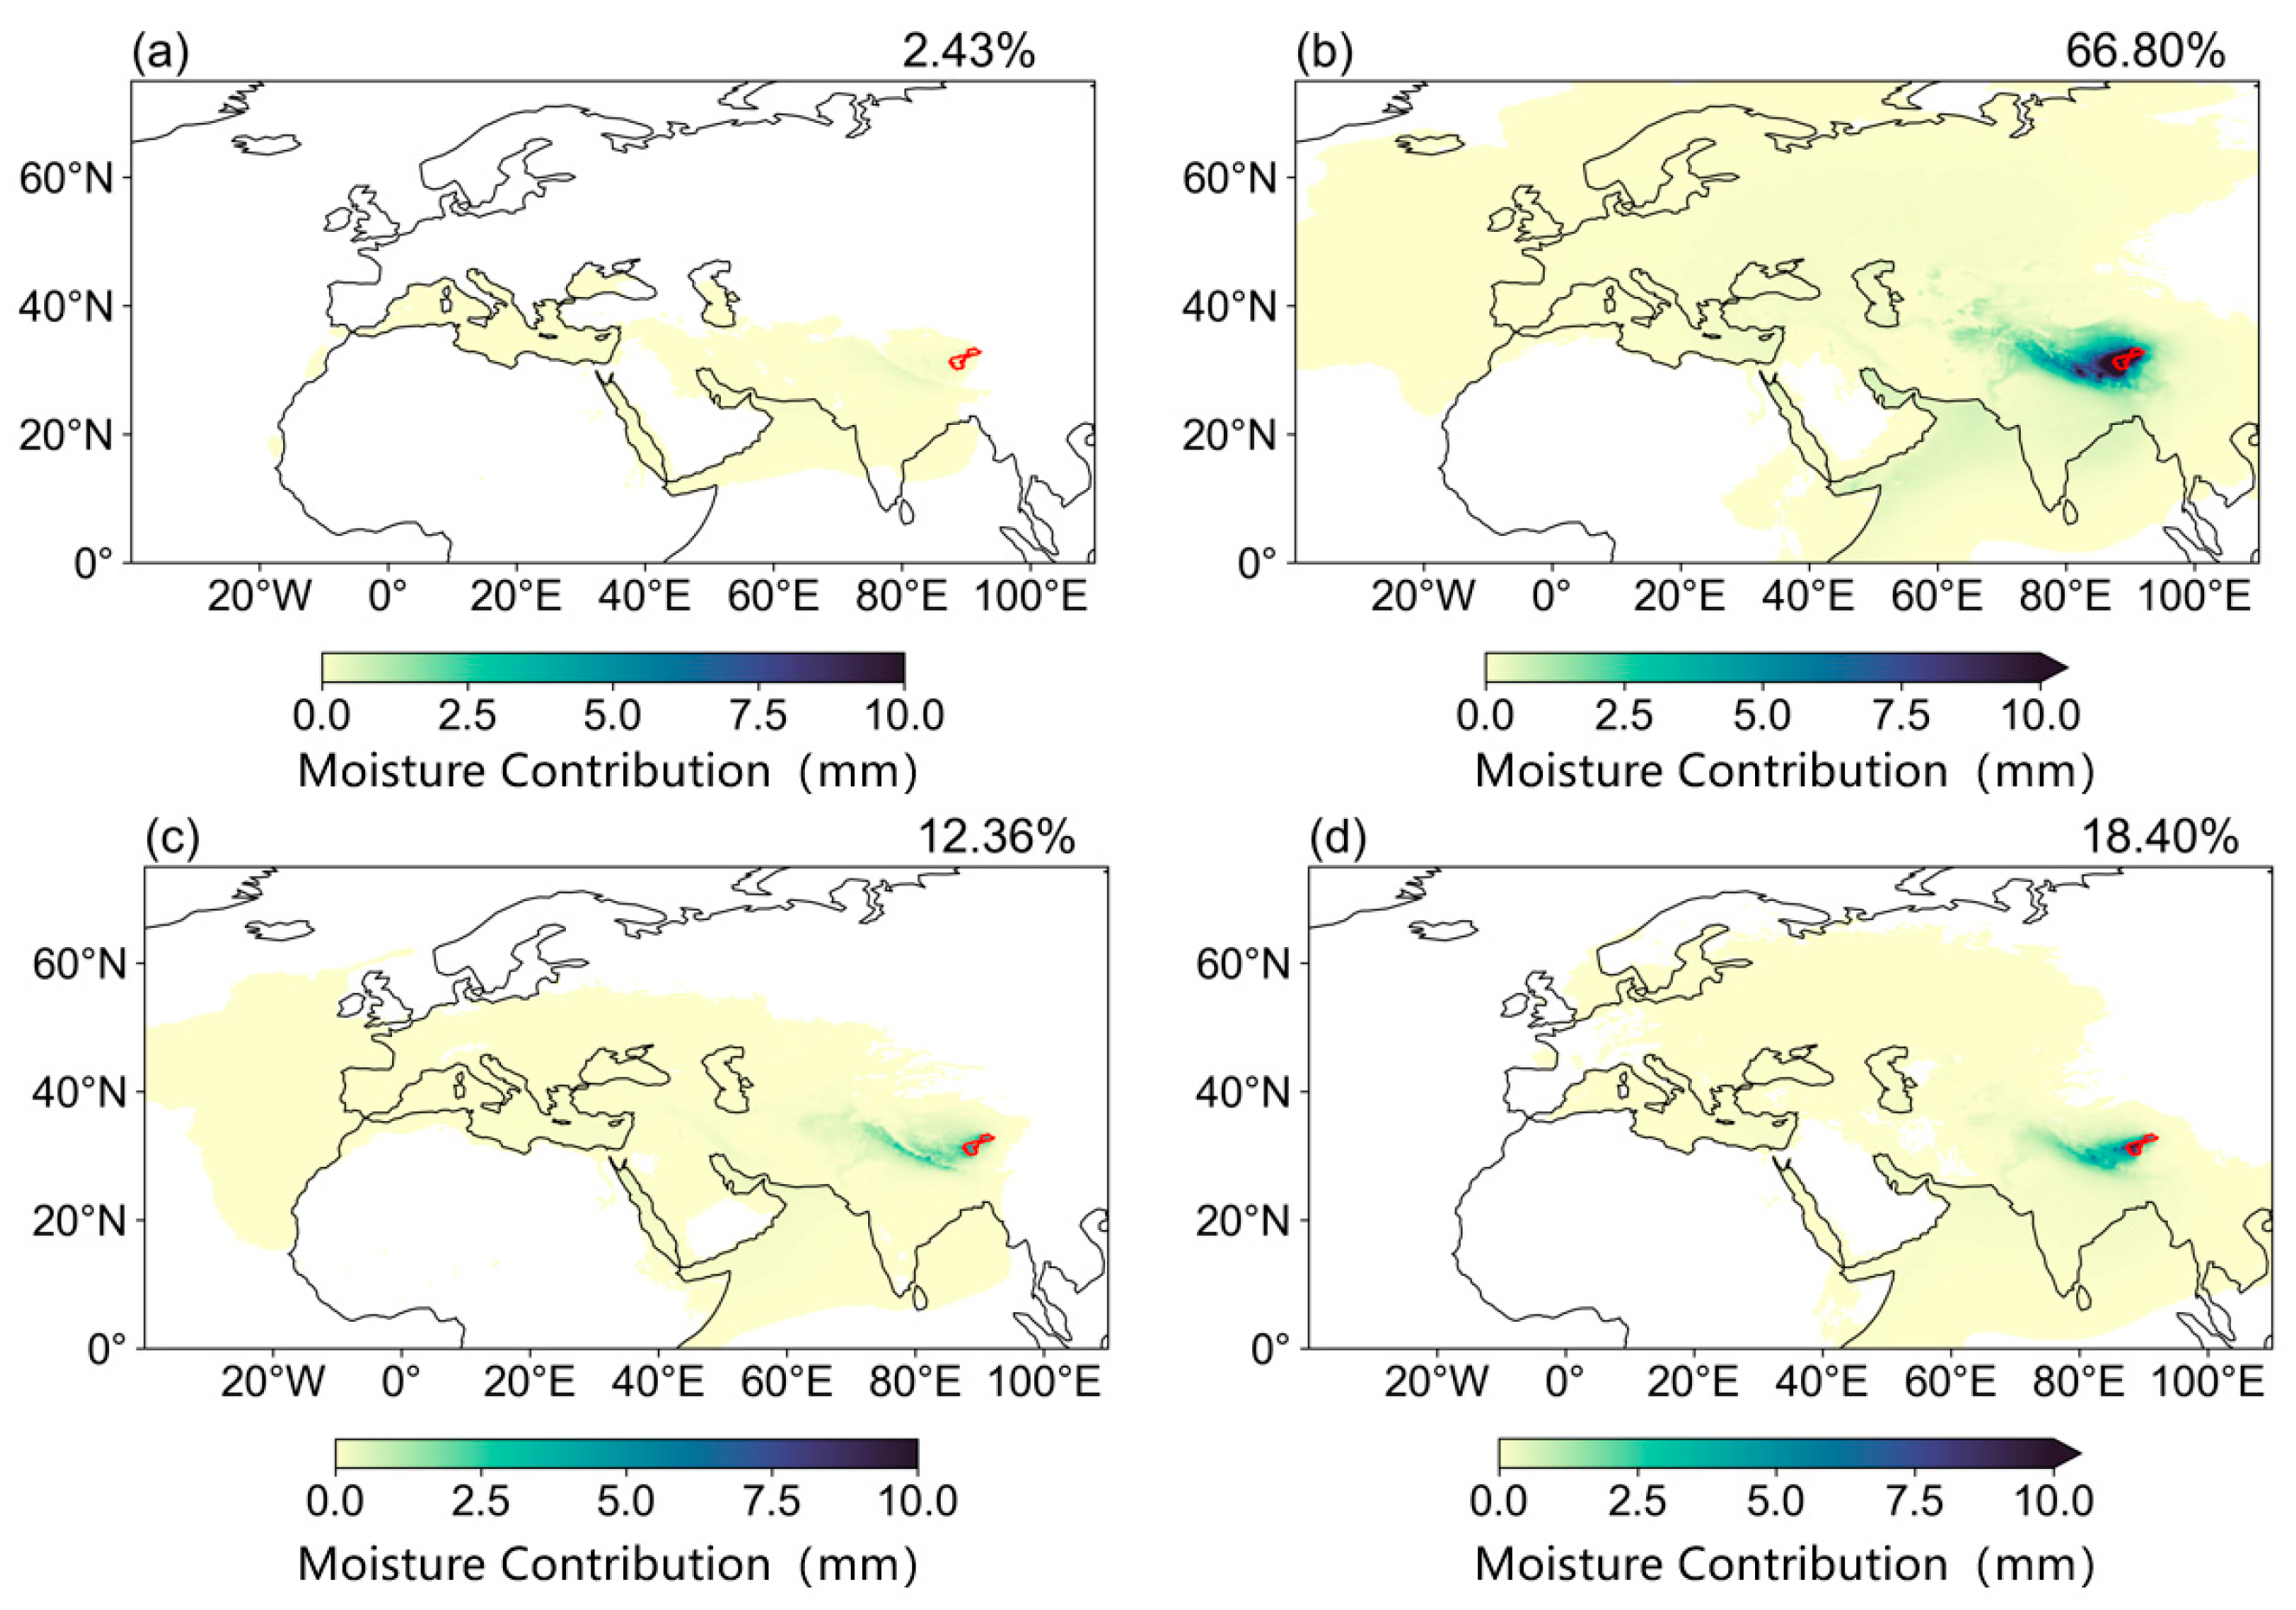
3.4.1. Water Vapor Source in Selin Co Basin

The Qinghai–Tibet Plateau, known as the “Asian Water Tower”, is the source of 10 major Asian river systems that flow into 10 countries [63]. As an important part of the Qinghai–Tibet Plateau, studying and quantifying the source and contribution of precipitation water vapor in the Selin Co basin can provide an in-depth understanding of the basic characteristics of the basin-scale atmospheric water cycle, taking into account the westerly winds and monsoons. This analysis aims to understand the mechanisms behind the spatiotemporal changes in water resources in this huge lake basin under ongoing climate change. It is not only related to the ecological security of the basin itself but also an important basis for a deeper understanding of the functional stability of the “Asian Water Tower” of the Qinghai–Tibet Plateau and its response to global climate change. To achieve this, we employed the WAM-2layers model for tracing water vapor transport within the Selin Co basin from 1991 to 2020, utilizing data from the ERA5 reanalysis dataset to backward trace average climatological as well as annual, monthly, and seasonal water vapor transport to this region from 1991 to 2020.
On an annual scale, Figure 6 shows the spatial distribution of precipitation water vapor sources in the Selin Co basin over the past 30 years (1991–2020). The precipitation water vapor in the Selin Co basin is mainly influenced by the westerlies and the Indian monsoon, originating mainly from the North Atlantic and the Indian Ocean. The water vapor transport route influenced by the westerlies is the North Atlantic–Europe–Central Asia–Tibetan Plateau–Selin Co basin. The water vapor transport route influenced by the Indian monsoon is the Indian Ocean–South Asia–Tibetan Plateau–Selin Co basin. Due to precipitation fallout and diffusion to surrounding areas during the transport process, on the whole, the closer to the basin itself, the greater the water vapor contribution. The Mediterranean Sea, Red Sea, Persian Gulf, and the Caspian Sea located in the western Tibetan Plateau also provide abundant water vapor to the Selin Co basin. Although the Selin Co basin is surrounded by high mountain ranges, water vapor will still follow the westerly circulation to cross the Pamir Plateau and the Karakoram Mountains, and even from the northwest to bypass the Tianshan Mountains and enter the basin interior. Similarly, it will follow the monsoon circulation to cross and bypass the Himalayas and enter the basin interior. The water vapor contribution rate refers to the proportion of water vapor from a certain region to the total water vapor in the Selin Co basin. The proportion of precipitation water vapor that comes from within the Selin Co basin is called the water vapor internal recirculation rate. After calculating, it was found that about 93.15% of the water vapor came from outside the watershed, with a water vapor internal recirculation rate of 6.85%. Additionally, 25.06% of the water vapor came from the ocean, while 74.94% came from land.

3.4.2. Seasonal Characteristics of Water Vapor Sources

The amount of water transported in different regions varies in different seasons. From the perspective of the season, the water transportation volume in summer was greater than that in autumn, which was greater than that in spring, which was greater than that in winter. The water vapor volume transported in winter accounted for 2.43% of the total water vapor volume of precipitation, the water vapor volume transported in spring accounted for 12.36% of the total water vapor volume of precipitation, the water vapor volume transported in summer accounted for 68.8% of the total water vapor volume of precipitation, and the water vapor volume transported in autumn accounted for 18.4% of the total water vapor volume of precipitation.
Figure 7 shows the spatial distribution of water vapor sources for winter, spring, summer, and autumn in the Selin Co basin on a long-term average basis. In winter, the main source of precipitation water vapor in the Selin Co basin was the Mediterranean Sea and South Asia. In spring, the influence of the westerly wind and Indian monsoon began to increase, and the water vapor from the North Atlantic and the Indian Ocean gradually increased. In summer, this change intensified further, and the Selin Co basin entered the rainy season, with the largest water vapor transportation volume. In autumn, the water vapor transportation volume in the Selin Co basin gradually decreased.
Unlike other seasons, in winter, more water vapor was transported from the ocean to Xinjiang than from land to Xinjiang, accounting for 62.57% and 37.43% of the total water vapor volume, respectively. To investigate the contribution of water vapor from different sources to precipitation in the Selin Co basin in different seasons, both in the catchment and outside, as well as from the ocean and land, Table 4 and Figure 8 show the water vapor contribution rates from different source areas in the Selin Co basin in different seasons. In summer, due to increased temperature and faster evaporation within the catchment, the rate of water vapor recirculation within the catchment increased significantly (7.4%). In winter, the contribution rate of precipitation water vapor from outside the catchment was the highest, reaching 97.51%. From the perspective of the ocean and land, the contribution rate of ocean water vapor in winter was 46.51%, and in summer it increased to 76.18%, an increase of nearly 30%, indicating that ocean-provided precipitation water vapor dominated in summer.

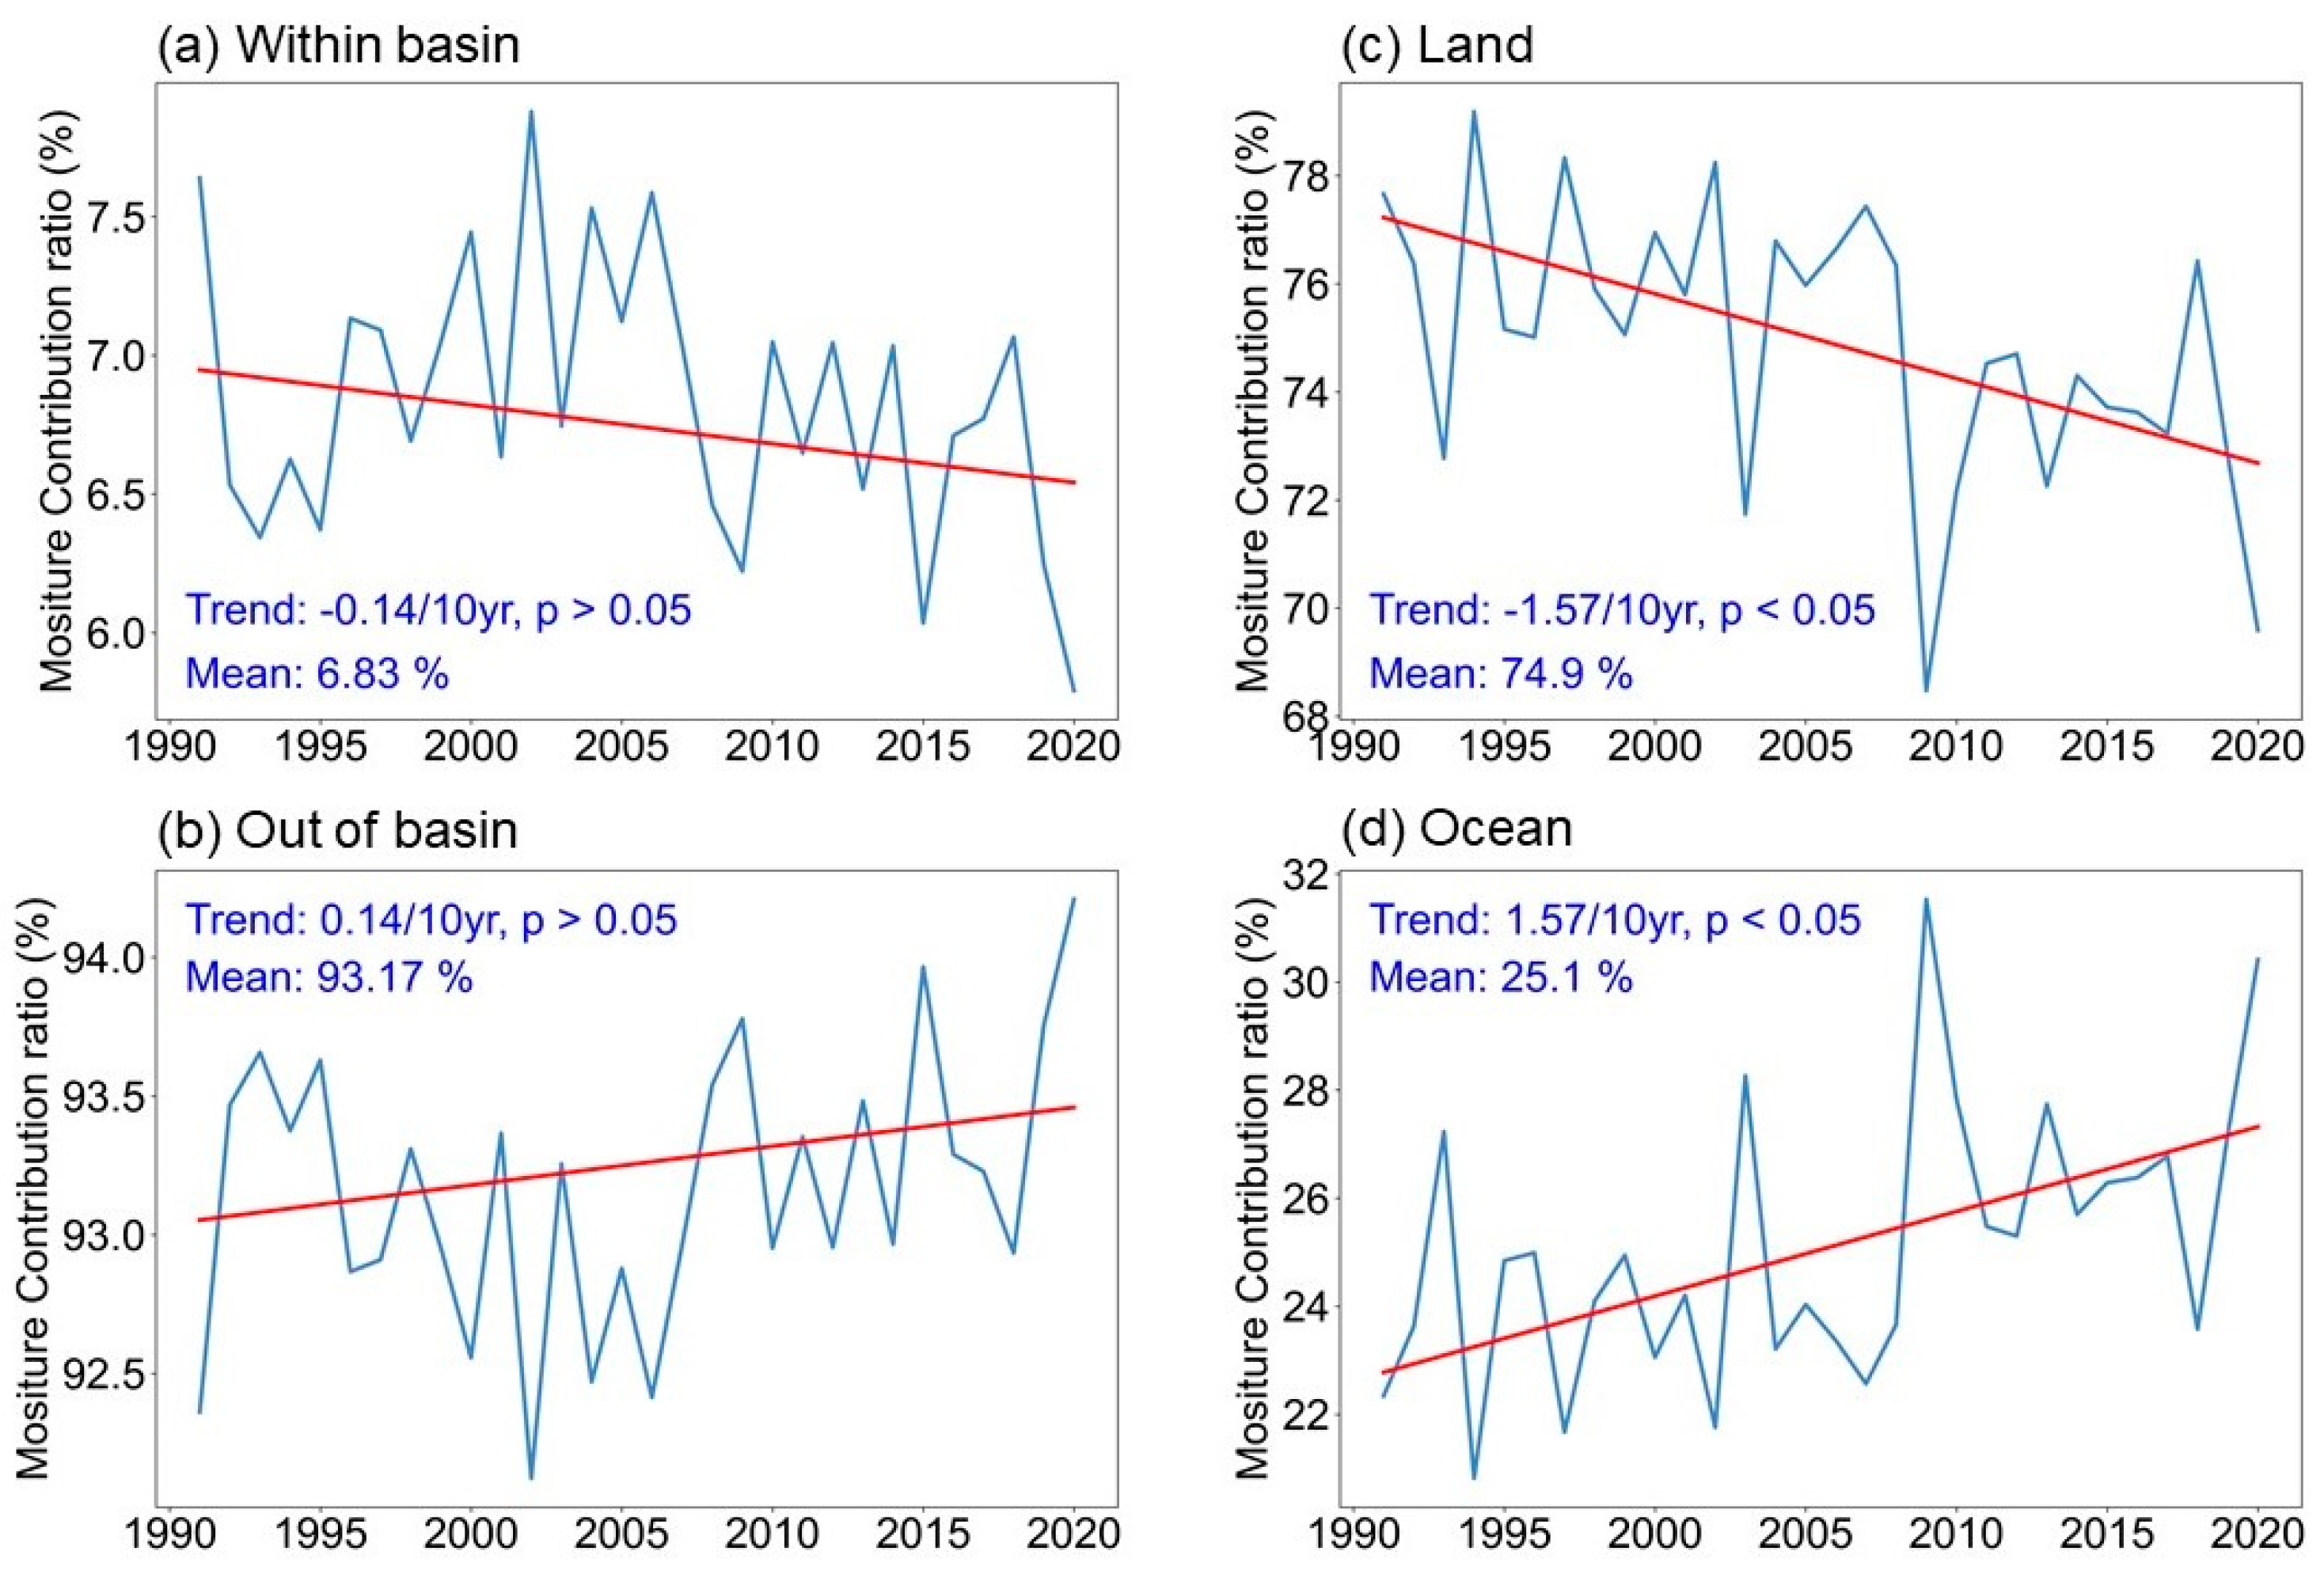
3.4.3. Time Series Changes in Water Vapor Contribution Rates from Different Source Regions

Under the influence of global warming, the temperature in the Qinghai–Tibet Plateau has been rising year by year, precipitation has been increasing year by year, and the Selin Co basin is also greatly affected. This study also calculated the annual changes in the water vapor contribution rates of the watershed and land and ocean, in order to reflect the response of different source areas’ water vapor contribution rates to global climate change. Figure 9 shows the annual changes in the water vapor contribution rates of different source areas from 1990 to 2020. From the figure, it can be seen that the proportion of precipitation water vapor from the Selin Co basin (precipitation internal circulation rate) was decreasing year to year (not significant), while the proportion of water vapor contribution from the watershed’s external source areas was increasing year to year (not significant). From the perspective of the ocean and land, the water vapor contribution from the ocean to the Selin Co basin showed a significant increasing trend (−0.0157/year), while the water vapor contribution from the land showed a significant decreasing trend. This means that the precipitation water vapor in the Selin Co basin watershed will be more dependent on the water vapor provided by the ocean, which is worth further exploring the changes in precipitation water vapor and sea temperature under the condition of global warming.

4. Discussion

4.1. Reasons for Lake Expansion

Climate change has resulted in significant changes in hydrological processes on the Qinghai–Tibet Plateau. The change in the lake surface area in the Tibetan Plateau has been closely related to the increase in temperature, precipitation, glacier mass loss, permafrost melting, and groundwater hydrological changes in recent years [64,65,66]. Especially, the expansion of the lake will lead to additional greenhouse gas emissions, which will further exacerbate local climate change, possibly increasing water vapor content, further melting of glaciers, and more precipitation, forming a positive feedback loop that amplifies the impact of climate change and leads to further expansion of the lake area [65]. This study found that in the past 40 years, the area of Selin Co has shown an obvious expansion trend. The expansion of lakes is usually related to the interaction of multiple factors. On the one hand, it may be the result of the interaction between climate change and the natural environment, such as precipitation and temperature; on the other hand, it may also be affected by human activities, such as water conservancy project construction, land use changes, etc. [67].
Since the 1950s, the climate of the Tibetan Plateau has become increasingly warmer and humid, and temperatures have continued to rise. It is expected that the lake area in the Tibetan Plateau will further expand by the end of this century [68,69]. Existing studies have shown through correlation analysis that rising temperatures have a very significant effect on the increase in the area of Selin Co, which is reflected in the impact of rising temperatures on the cryosphere [70]. The potential feedback loop generated by temperature rise through the albedo effect plays an important role in the melting of glaciers in the Qinghai–Tibet Plateau and its surrounding areas. As temperatures rise, glaciers begin to retreat, and the albedo of the glacier surface decreases, leading to enhanced absorption of shortwave radiation on the glacier surface, which in turn accelerates glacier melting [71]. Under the high emission scenario, the darkening of the albedo on the Tibetan Plateau surface will increase the local temperature by 0.24 K by the end of this century, further exacerbating regional glacier melting [72].
Precipitation is one of the important supply sources for lakes, affecting the water level and water balance of lakes. Seasonal changes in precipitation have a more obvious impact on lake areas in arid and semi-arid areas. Lake levels were more sensitive to decreases than increases in precipitation [73]. There are two views on the impact of precipitation on the area of Selin Co Lake. The first view is that by analyzing the temporal trend of the area and climate elements of Selin Co Lake, it is found that the area change of Selin Co is more consistent with the increase in the annual average temperature than the annual average precipitation [10]. Based on correlation analysis, Yuzhi et al. concluded that the correlation between lake area and precipitation is not significant and speculated that precipitation is not the dominant factor in the expansion of the lake area of Selin Co Lake [74]. The second view is that as a closed inland lake, the main means of water output of Selin Co is evaporation. Therefore, Lei et al. believe that the increase in precipitation and runoff and the decrease in lake evaporation are the main reasons for the growth of the lake [75]. Zhou et al. revealed that the three factors of lake inflows, precipitation over the water area, and lake evaporation jointly explained about 90% of the change in lake water storage from 2003 to 2012 [19]. Whether precipitation is the dominant factor in the expansion of the Selin Co Lake area is still controversial, but it is undeniable that the increase in precipitation can provide more replenishment water sources, maintain the relative stability of the lake water volume, and thus promote the increase of the lake area.
In colder regions, melting permafrost may cause more water to be released into lakes. Permafrost degradation is closely related to climate warming and is also the main driver of changes in the lake area [76]. Existing studies have shown that the Tibetan Plateau is generally facing the problem of permafrost collapse [77]. The permafrost in the Selin Co basin has warmed and degraded faster than the central QTP (active layer thickness increased at a rate of 7.44 cm/year from 2006 to 2019) [10]. Wang et al. quantified that the contribution of ground ice meltwater released from permafrost thawing to the increase in lake volume from 2018 to 2020 was about 12% (2018–2020) [36]. In addition, glaciers have retreated significantly in the Qinghai–Tibet Plateau and surrounding areas since the 1960s, leading to rising lake levels in areas with high glacier coverage, such as the Nam Co Lake and Selin Co Lake areas [78]. In 2010–2020, 99.43% of glacier contribution supplied Selin Co [79]. Increased meltwater input from glaciers and permafrost, as well as increased precipitation, have a key impact on the water level of Selin Co Lake [80].
The area of low-altitude lakes is closely related to human activities (large agricultural water consumption and large urban water consumption) [81]. The Selin Co basin is located in a high-altitude area, and the expansion of its lake surface area is less affected by human activities. Studies have shown that during the period 1990–2014, the cultivated land area, industrial output value, and total population in Tibet were all increasing, and the demand for water resources was increasing, but during the same period, the lakes showed a significant expansion trend, indicating that the negative impact of human activities on the lake area in the region was far less than the positive impact of climate factors [82]. At the same time, due to the continuous expansion of the Selin Co basin, pastures were flooded and herders near the lake had to evacuate [83]. Therefore, human activities have little impact on the area of Selin Co Lake.
In addition to the above factors, groundwater may also have an impact on lake expansion. Groundwater is an important component of the hydrological cycle, and its changes may affect the distribution of water resources in the entire region. Lei et al. found that during the ice and snow cover period, the lake water level in the western Tibetan Plateau increased significantly, and the lake water surplus was mainly attributed to the large amount of groundwater inflow [84]. Song et al. verified that groundwater plays an important role in regulating lake water storage and other flood pulse systems [85]. At the same time, groundwater can contribute to the river network flowing into the lake through base flow separation [86]. There is a mutual replenishment relationship between groundwater and surface water (such as lakes), which can also affect the regional water resources distribution and indirectly promote the expansion of lakes. However, this role is usually more complex and difficult to quantify directly, and further research is needed in the future.

4.2. Reasons for Glacier Retreat

In the past 40 years, the area of the Selin Co Glacier has shown an obvious shrinking trend, which is consistent with the overall melting and disappearance of glaciers in the Tibetan Plateau [87]. Glaciers fluctuate due to climate change, and climate warming will cause glaciers to shrink [88]. Studies have revealed that climate warming is the main factor causing glacier melt in the Tibetan Plateau [10]. As temperatures rise, glaciers melt faster, which may be one of the main reasons for the overall decrease in the area of the Selin Co Glacier. Climate warming leads to increased melting of glaciers and also affects precipitation patterns and evaporation, which in turn affects the formation and melting processes of glaciers.
Changes in precipitation may affect the water supply and the melting rate of glaciers to a certain extent. In coastal areas, where precipitation is high and temperature changes are small during the melting season, glacier response patterns are controlled by precipitation change patterns. In contrast, in continental climates, glacier response patterns are most influenced by melt season temperature patterns [89]. Therefore, precipitation may not be the main reason for the retreat of the Selin Co Glacier.

5. Conclusions

This study analyzed the Selin Co area and changes in glaciers around the basin based on Landsat (TM/ETM/OLI-TIRS) satellite remote sensing data from 1986 to 2023 and traced the sources of precipitation moisture in the Selin Co basin. The following conclusions were obtained:
(1)
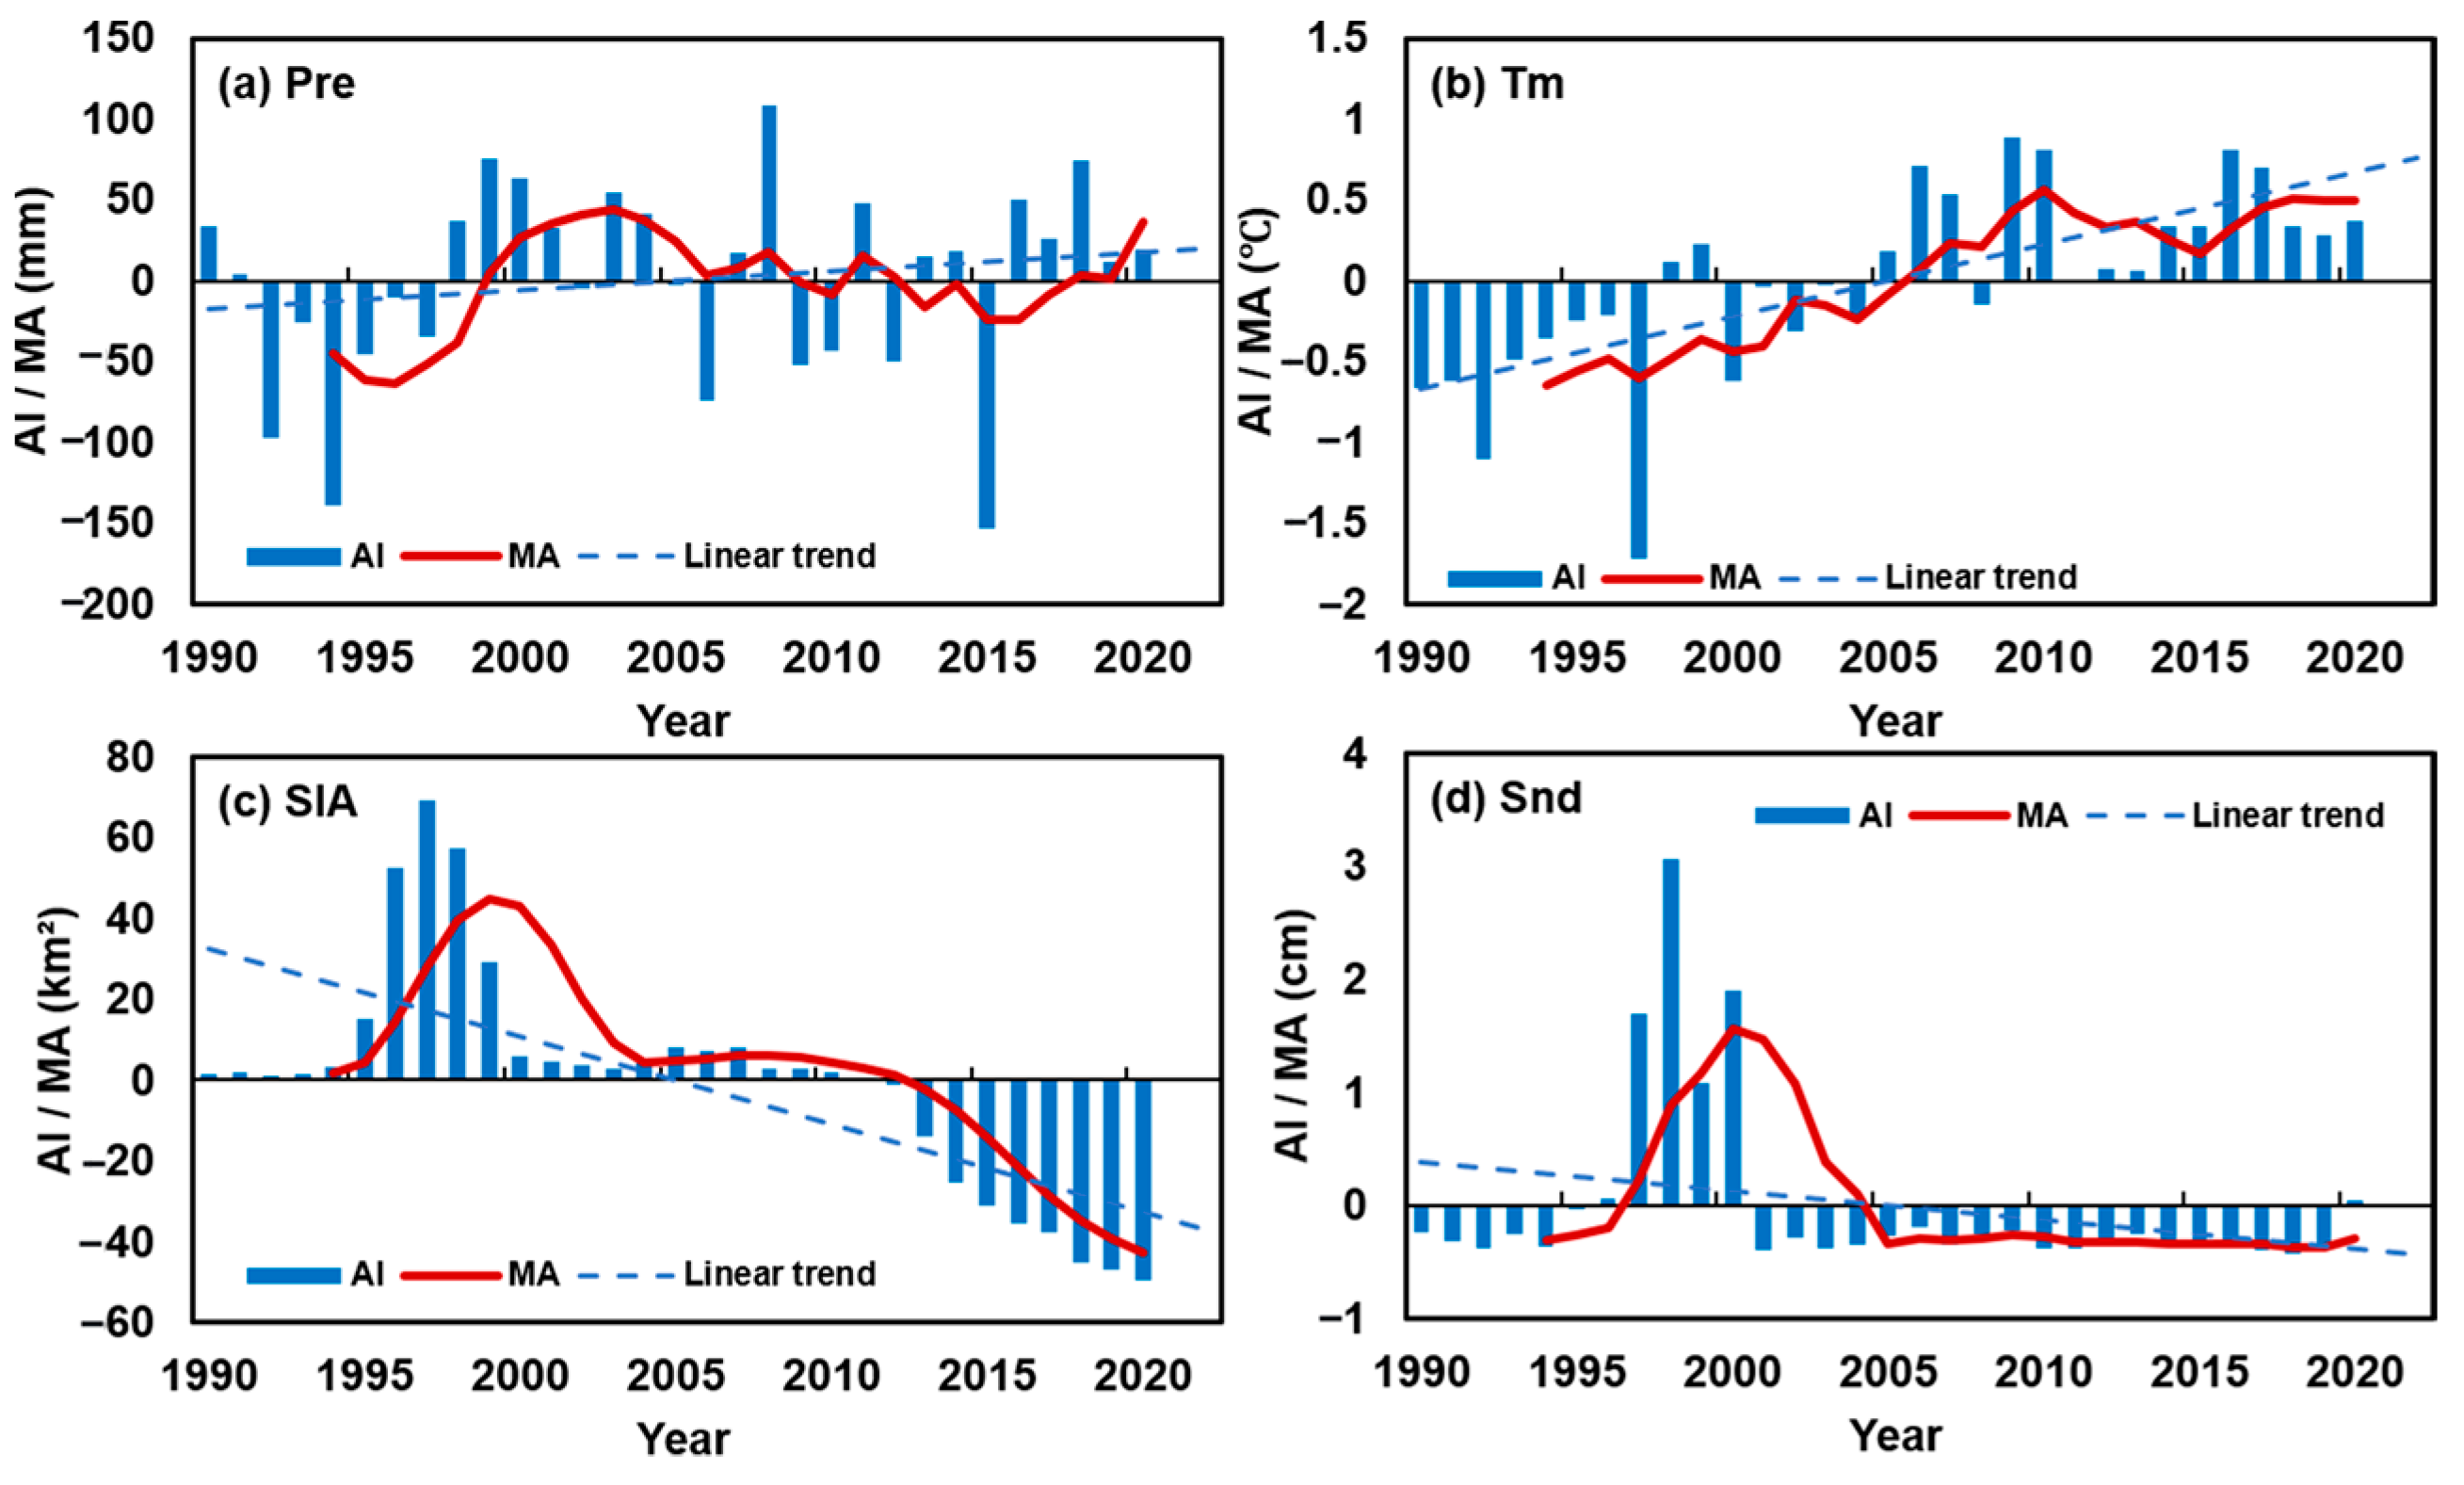
In the 36 years from 1988 to 2023, the area of Selin Co has generally continued to increase. The lake area was 1702.43 km2 in 1988, and it reached 2462.59 km2 in 2023, with a total area increase of 760.16 km2. The lake surface grew particularly rapidly from 2001 to 2010, mainly in the northern and southern parts of the lake. The increasing trend in the Selin Co area is affected by a variety of climatic factors, among which changes in temperature, glacier area, and precipitation are the main driving factors.
(2)
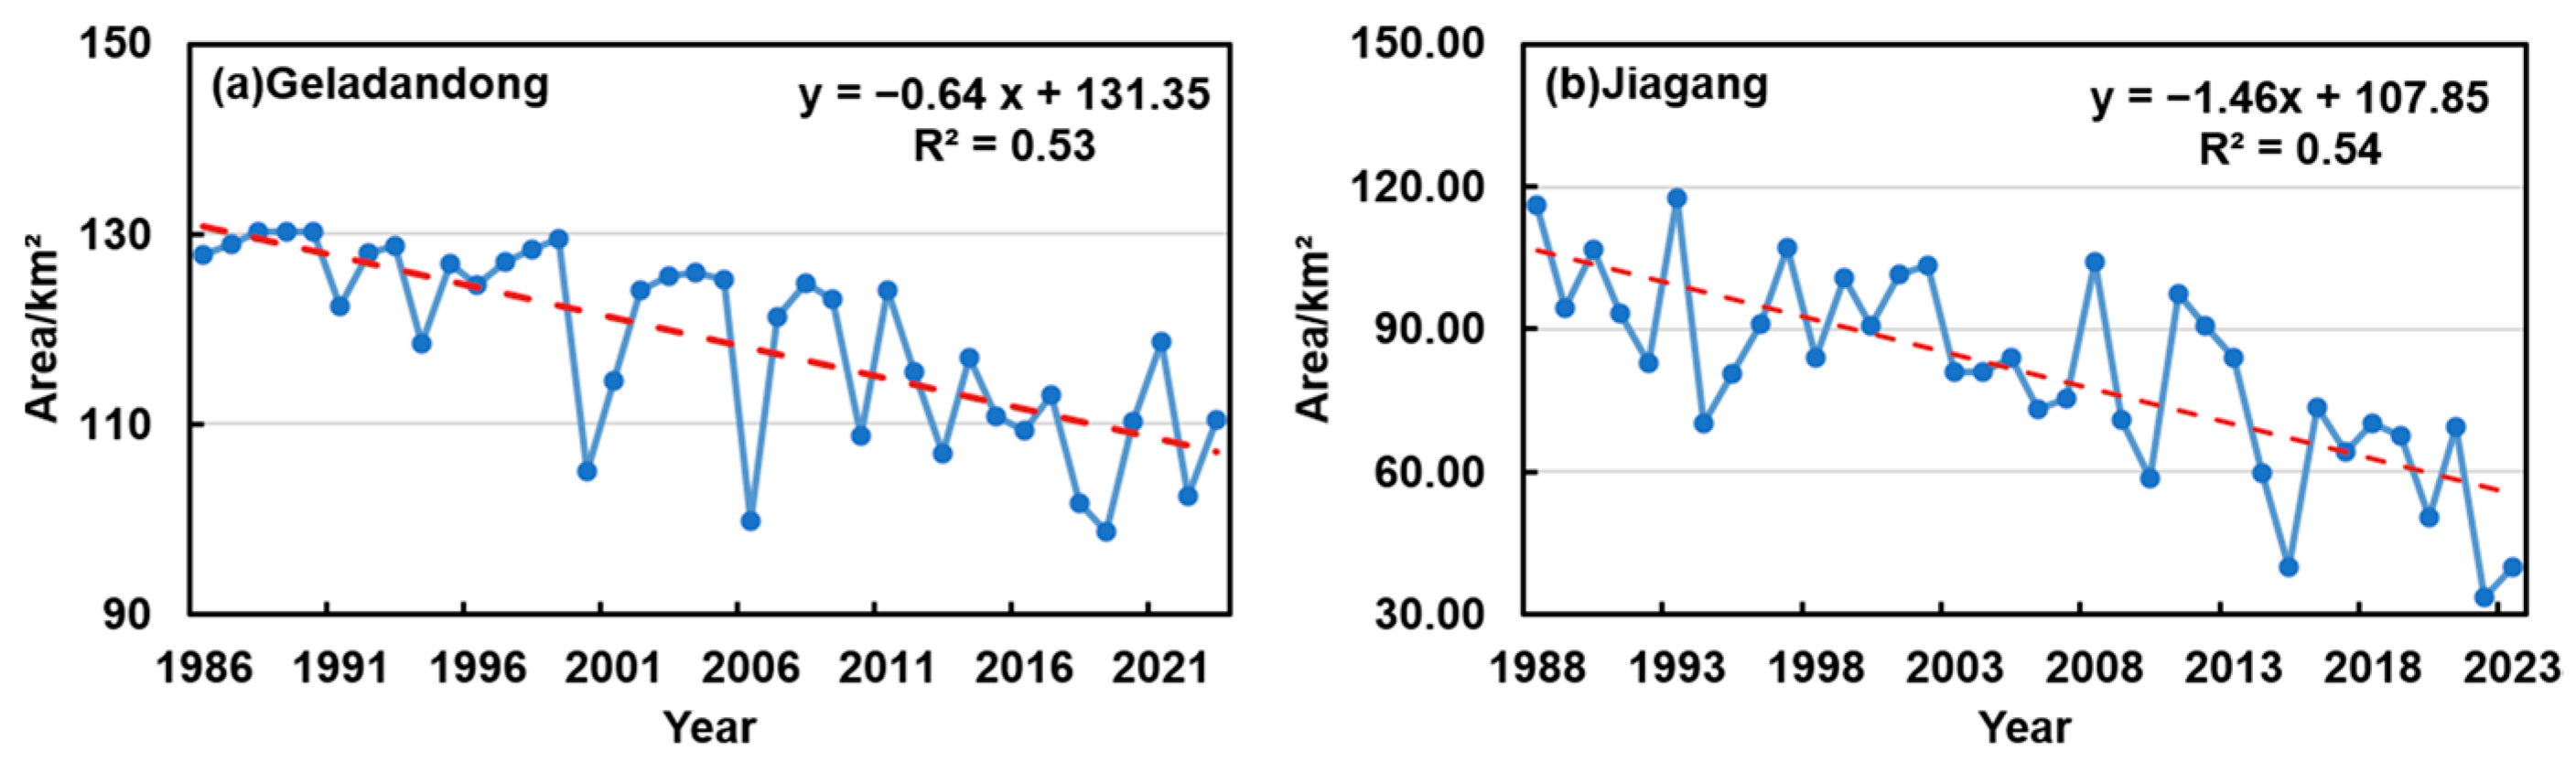
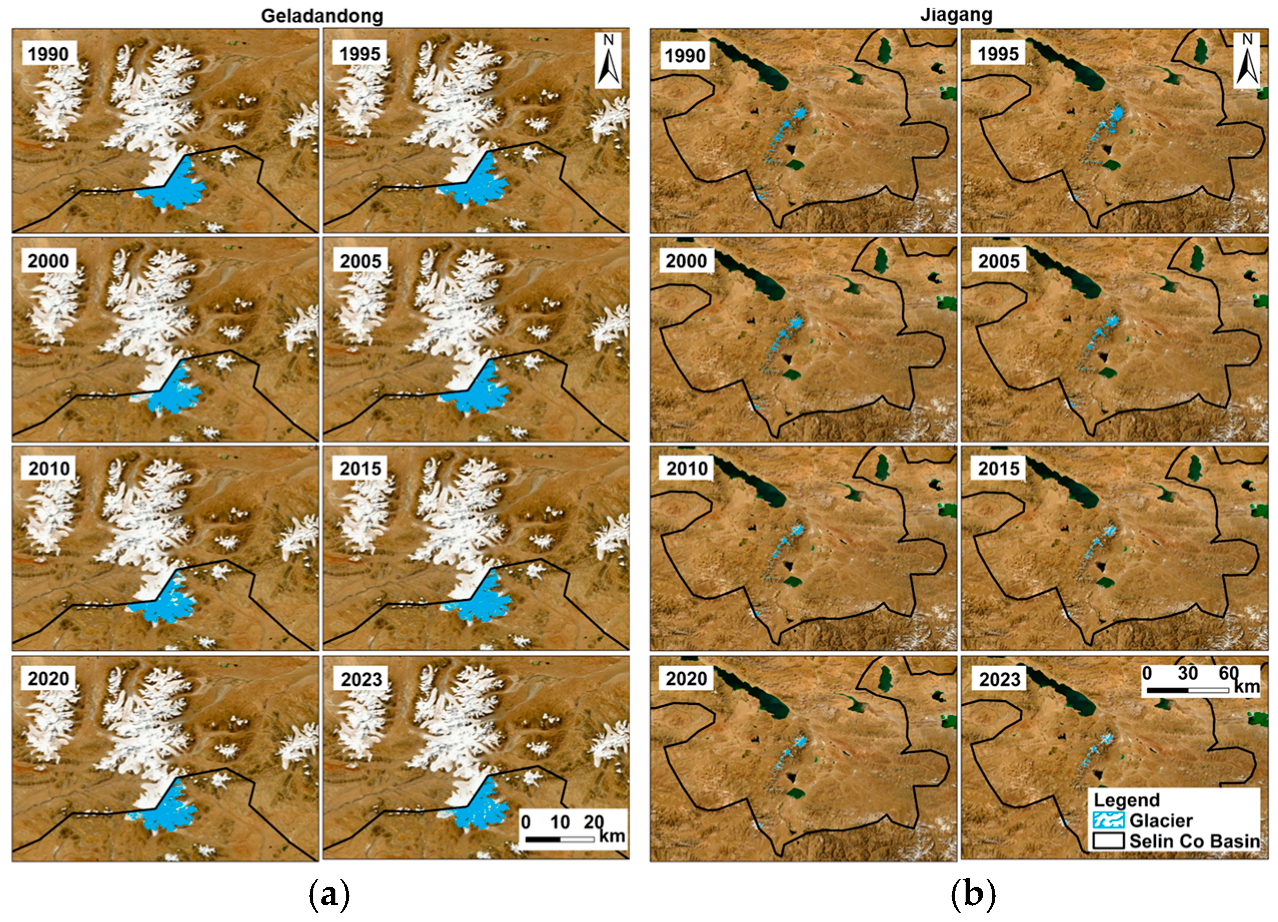
From 1986 to 2023, the area of glaciers around the Selin Co basin generally showed a decreasing trend. The area of the Geladandong Glacier in the watershed was 127.85 km2 in 1986. By 2023, the glacier area had dropped to 110.46 km2. The glacier area decreased by 17.39 km2, but the change was relatively stable. The area of the Jiagang Glacier in the basin was 116.23 km2 in 1988. By 2023, the glacier had dropped to 39.81 km2. The glacier area had decreased by 76.42 km2 in total, but the changes were relatively volatile. The main reason for the decrease in glacier area in the Selin Co basin may be the increase in temperature caused by climate change, and topographic factors may also have a certain impact on it.
(3)
Precipitation in the Selin Co basin showed an increasing trend. The precipitation and moisture in the Selin Co basin are mainly influenced by the westerlies and the Indian monsoon, which originate from the North Atlantic and the Indian Ocean. The closer to the basin itself, the more the water vapor contribution. The watershed outside contributes about 89.12% of the water vapor, with an internal water cycle rate of 10.88%. 30.61% of the water vapor comes from the ocean, while 69.39% comes from land. The water vapor contribution rate in the Selin Co basin during the summer is the largest throughout the year, and the ocean provides the largest proportion of precipitation water vapor. There is a significant trend of increasing water vapor contribution from the ocean in the Selin Co basin, making it more dependent on water vapor provided by the ocean. Rising oceanic water vapor contributions exacerbate climate change impacts, increasing the likelihood of crossing critical thresholds and triggering irreversible climatic shifts.

Author Contributions

Conceptualization, Q.Z., G.W. and A.F.; methodology, G.W. and A.F.; validation, W.S.; writing—original draft preparation, G.W. and A.F.; writing—review and editing, G.W., A.F., L.X., Q.Z., W.S., V.P.S., W.W., K.Z. and S.S.; visualization, G.W. and A.F.; supervision, Q.Z.; funding acquisition, W.S. and Q.Z. All authors have read and agreed to the published version of the manuscript.

Funding

This research was financially supported by The Risk of Selin Co Overflow and Mitigation Measures Program, grant number GZFCG2024-18673, Special Project on Basic Scientific Research Funds of China Institute of Water Resources and Hydropower Research (Open bidding for selecting the best candidates) (JZ110145B0092024) and the China National Key R&D Program, grant number 2019YFA0606900.

Institutional Review Board Statement

Not applicable.

Informed Consent Statement

Not applicable.

Data Availability Statement

The data presented in this study are available on request from the corresponding author.

Acknowledgments

The authors thank the editor and the anonymous reviewers for their thoughtful reviews and constructive comments.

Conflicts of Interest

The authors declare no conflicts of interest.

References

  1. Immerzeel, W.W.; Lutz, A.F.; Andrade, M.; Bahl, A.; Biemans, H.; Bolch, T.; Hyde, S.; Brumby, S.; Davies, B.J.; Elmore, A.C.; et al. Importance and vulnerability of the world’s water towers. Nature 2020, 577, 364–369. [Google Scholar] [CrossRef]
  2. Wang, G.; Zhang, Q.; Yu, H.; Shen, Z.; Sun, P. Double increase in precipitation extremes across China in a 1.5 °C/2.0 °C warmer climate. Sci. Total Environ. 2020, 746, 140807. [Google Scholar] [CrossRef]
  3. Zhao, L.; Zou, D.; Hu, G.; Du, E.; Pang, Q.; Xiao, Y.; Li, R.; Sheng, Y.; Wu, X.; Sun, Z.; et al. Changing climate and the permafrost environment on the Qinghai–Tibet (Xizang) plateau. Permafr. Periglac. Process. 2020, 31, 396–405. [Google Scholar] [CrossRef]
  4. Wu, Q.; Zhang, T.; Liu, Y. Permafrost temperatures and thickness on the Qinghai-Tibet Plateau. Glob. Planet. Chang. 2010, 72, 32–38. [Google Scholar] [CrossRef]
  5. Wang, Y.; Ye, A.; Peng, D.; Miao, C.; Di, Z.; Gong, W. Spatiotemporal variations in water conservation function of the Tibetan Plateau under climate change based on InVEST model. J. Hydrol. Reg. Stud. 2022, 41, 101064. [Google Scholar] [CrossRef]
  6. Zhang, T.; Deng, G.; Liu, X.; He, Y.; Shen, Q.; Chen, Q. Heatwave magnitude quantization and impact factors analysis over the Tibetan Plateau. Npj Clim. Atmos. Sci. 2025, 8, 2. [Google Scholar] [CrossRef]
  7. Immerzeel, W.W.; van Beek, L.P.H.; Bierkens, M.F.P. Climate Change Will Affect the Asian Water Towers. Science 2010, 328, 1382–1385. [Google Scholar] [CrossRef] [PubMed]
  8. Yao, T.; Bolch, T.; Chen, D.; Gao, J.; Immerzeel, W.; Piao, S.; Su, F.; Thompson, L.; Wada, Y.; Wang, L.; et al. The imbalance of the Asian water tower. Nat. Rev. Earth Environ. 2022, 3, 618–632. [Google Scholar] [CrossRef]
  9. Li, X.; Wang, Y.; Zhao, Y.; Zhai, J.; Liu, Y.; Han, S.; Liu, K. Research on the Impact of Climate Change and Human Activities on the NDVI of Arid Areas—A Case Study of the Shiyang River Basin. Land 2024, 13, 533. [Google Scholar] [CrossRef]
  10. Liu, W.; Liu, H.; Xie, C.; Zhao, J.; Liu, G.; Wang, W.; Zhang, Q.; Zhao, Q. Dynamic changes in lakes and potential drivers within the Selin Co basin, Tibetan Plateau. Environ. Earth Sci. 2022, 81, 84. [Google Scholar] [CrossRef]
  11. Ma, R.; Yang, G.; Duan, H.; Jiang, J.; Wang, S.; Feng, X.; Li, A.; Kong, F.; Xue, B.; Wu, J.; et al. China’s lakes at present: Number, area and spatial distribution. Sci. China Earth Sci. 2011, 54, 283–289. [Google Scholar] [CrossRef]
  12. Zhang, G.; Yao, T.; Xie, H.; Zhang, K.; Zhu, F. Lakes’ state and abundance across the Tibetan Plateau. Chin. Sci. Bull. 2014, 59, 3010–3021. [Google Scholar] [CrossRef]
  13. Liu, W.; Xie, C.; Zhao, L.; Li, R.; Liu, G.; Wang, W.; Liu, H.; Wu, T.; Yang, G.; Zhang, Y. Rapid expansion of lakes in the endorheic basin on the Qinghai-Tibet Plateau since 2000 and its potential drivers. Catena 2021, 197, 104942. [Google Scholar] [CrossRef]
  14. Lei, Y.; Yang, K.; Wang, B.; Sheng, Y.; Bird, B.W.; Zhang, G.; Tian, L. Response of inland lake dynamics over the Tibetan Plateau to climate change. Clim. Chang. 2014, 125, 281–290. [Google Scholar] [CrossRef]
  15. Song, C.; Huang, B.; Ke, L. Modeling and analysis of lake water storage changes on the Tibetan Plateau using multi-mission satellite data. Remote Sens. Environ. 2013, 135, 25–35. [Google Scholar] [CrossRef]
  16. Lei, Y.; Yao, T.; Sheng, Y.; Yang, K.; Yang, W.; Li, S.; Zhou, J.; Jiang, Y.; Yu, Y. Unprecedented lake expansion in 2017–2018 on the Tibetan Plateau: Processes and environmental impacts. J. Hydrol. 2023, 619, 129333. [Google Scholar] [CrossRef]
  17. Zhang, G.; Yao, T.; Chen, W.; Zheng, G.; Shum, C.K.; Yang, K.; Piao, S.; Sheng, Y.; Yi, S.; Li, J.; et al. Regional differences of lake evolution across China during 1960s–2015 and its natural and anthropogenic causes. Remote Sens. Environ. 2019, 221, 386–404. [Google Scholar] [CrossRef]
  18. Liu, J.; Jiang, L.; Zhang, X.; Druce, D.; Kittel, C.M.; Tøttrup, C.; Bauer-Gottwein, P. Impacts of water resources management on land water storage in the North China Plain: Insights from multi-mission earth observations. J. Hydrol. 2021, 603, 126933. [Google Scholar] [CrossRef]
  19. Zhou, J.; Wang, L.; Zhang, Y.; Guo, Y.; Li, X.; Liu, W. Exploring the water storage changes in the largest lake (Selin Co) over the Tibetan Plateau during 2003–2012 from a basin-wide hydrological modeling. Water Resour. Res. 2015, 51, 8060–8086. [Google Scholar] [CrossRef]
  20. Zhu, L.; Wang, J.; Ju, J.; Ma, N.; Zhang, Y.; Liu, C.; Han, B.; Liu, L.; Wang, M.; Ma, Q. Climatic and lake environmental changes in the Serling Co region of Tibet over a variety of timescales. Sci. Bull. 2019, 64, 422–424. [Google Scholar] [CrossRef]
  21. Chen, Y.; Li, W.; Deng, H.; Fang, G.; Li, Z. Changes in Central Asia’s Water Tower: Past, Present and Future. Sci. Rep. 2016, 6, 35458. [Google Scholar] [CrossRef]
  22. Liu, X.; Xu, Z.; Yang, H.; Vaghefi, S.A. Responses of the Glacier Mass Balance to Climate Change in the Tibetan Plateau During 1975–2013. J. Geophys. Res. Atmos. 2021, 126, e2019JD032132. [Google Scholar] [CrossRef]
  23. Qi, W.; Feng, L.; Kuang, X.; Zheng, C.; Liu, J.; Chen, D.; Tian, Y.; Yao, Y. Divergent and Changing Importance of Glaciers and Snow as Natural Water Reservoirs in the Eastern and Southern Tibetan Plateau. J. Geophys. Res. Atmos. 2022, 127, e2021JD035888. [Google Scholar] [CrossRef]
  24. Hugonnet, R.; McNabb, R.; Berthier, E.; Menounos, B.; Nuth, C.; Girod, L.; Farinotti, D.; Huss, M.; Dussaillant, I.; Brun, F.; et al. Accelerated global glacier mass loss in the early twenty-first century. Nature 2021, 592, 726–731. [Google Scholar] [CrossRef] [PubMed]
  25. Zhang, Q.; Shen, Z.; Pokhrel, Y.; Farinotti, D.; Singh, V.P.; Xu, C.-Y.; Wu, W.; Wang, G. Oceanic climate changes threaten the sustainability of Asia’s water tower. Nature 2023, 615, 87–93. [Google Scholar] [CrossRef] [PubMed]
  26. Ye, D. Some Characteristics of the Summer Circulation Over the Qinghai-Xizang (Tibet) Plateau and Its Neighborhood. Bull. Am. Meteorol. Soc. 1981, 62, 14–19. [Google Scholar] [CrossRef]
  27. Xu, X.; Dong, L.; Zhao, Y.; Wang, Y. Effect of the Asian Water Tower over the Qinghai-Tibet Plateau and the characteristics of atmospheric water circulation. Chin. Sci. Bull. 2019, 64, 2830–2841. [Google Scholar]
  28. Xu, K.; Zhong, L.; Ma, Y.; Zou, M.; Huang, Z. A study on the water vapor transport trend and water vapor source of the Tibetan Plateau. Theor. Appl. Climatol. 2020, 140, 1031–1042. [Google Scholar] [CrossRef]
  29. Chen, B.; Xu, X.-D.; Yang, S.; Zhang, W. On the origin and destination of atmospheric moisture and air mass over the Tibetan Plateau. Theor. Appl. Climatol. 2012, 110, 423–435. [Google Scholar] [CrossRef]
  30. Tong, K.; Su, F.; Xu, B. Quantifying the contribution of glacier meltwater in the expansion of the largest lake in Tibet. J. Geophys. Res. Atmos. 2016, 121, 11,158–11,173. [Google Scholar] [CrossRef]
  31. Ma, C.; Xie, Y.; Duan, H.; Wang, X.; Bie, Q.; Guo, Z.; He, L.; Qin, W. Spatial quantification method of grassland utilization intensity on the Qinghai-Tibetan Plateau: A case study on the Selinco basin. J. Environ. Manag. 2022, 302, 114073. [Google Scholar] [CrossRef]
  32. Ma, C.; Xie, Y.; Duan, S.-B.; Qin, W.; Guo, Z.; Xi, G.; Zhang, X.; Bie, Q.; Duan, H.; He, L. Characterization of spatio-temporal patterns of grassland utilization intensity in the Selinco watershed of the Qinghai-Tibetan Plateau from 2001 to 2019 based on multisource remote sensing and artificial intelligence algorithms. GIScience Remote Sens. 2022, 59, 2217–2246. [Google Scholar] [CrossRef]
  33. Xi, G.; Ma, C.; Ji, F.; Huang, H.; Xie, Y. Characteristics of Changes in Livestock Numbers and Densities in the Selinco Region of the Qinghai–Tibetan Plateau from 1990 to 2020. Land 2024, 13, 1186. [Google Scholar] [CrossRef]
  34. Chen, F.; Chen, H.; Yang, Y. Annual and seasonal changes in means and extreme events of precipitation and their connection to elevation over Yunnan Province, China. Quat. Int. 2015, 374, 46–61. [Google Scholar] [CrossRef]
  35. De, J.Y.; Ni, M.J.; Qiang, B.O.; Zeng, L.; Luo, S. Lake Area Variation of Selin Tso in 1975~2016 and Its Influential Factors. Plateau Mt. Meteorol. Res. 2018, 38, 35–41, 96. [Google Scholar]
  36. Wang, L.; Zhao, L.; Zhou, H.; Liu, S.; Du, E.; Zou, D.; Liu, G.; Xiao, Y.; Hu, G.; Wang, C. Contribution of ground ice melting to the expansion of Selin Co (lake) on the Tibetan Plateau. Cryosphere 2022, 16, 2745–2767. [Google Scholar] [CrossRef]
  37. Wu, J.; Gao, X.-J. A gridded daily observation dataset over China region and comparison with the other datasets. Chin. J. Geophys. 2013, 56, 1102–1111. [Google Scholar]
  38. Yang, J.; Huang, X. 30 m annual land cover and its dynamics in China from 1990 to 2019. Earth Syst. Sci. Data Discuss. 2021, 13, 3907–3925. [Google Scholar] [CrossRef]
  39. Che, T.; Dai, L.; Li, X. Long-term series of daily snow depth dataset in China (1979-2023). In National Tibetan Plateau; Cryosphere Datasets; National Tibetan Plateau Data Center: Beijing, China, 2015. [Google Scholar]
  40. Che, T.; Li, X.; Jin, R.; Armstrong, R.; Zhang, T. Snow depth derived from passive microwave remote-sensing data in China. Ann. Glaciol. 2008, 49, 145–154. [Google Scholar] [CrossRef]
  41. Dai, L.; Che, T.; Ding, Y. Inter-calibrating SMMR, SSM/I and SSMI/S data to improve the consistency of snow-depth products in China. Remote Sens. 2015, 7, 7212–7230. [Google Scholar] [CrossRef]
  42. Dai, L.; Che, T.; Ding, Y.; Hao, X. Evaluation of snow cover and snow depth on the Qinghai–Tibetan Plateau derived from passive microwave remote sensing. Cryosphere 2017, 11, 1933–1948. [Google Scholar] [CrossRef]
  43. Hersbach, H.; Bell, B.; Berrisford, P.; Hirahara, S.; Horányi, A.; Muñoz-Sabater, J.; Nicolas, J.; Peubey, C.; Radu, R.; Schepers, D.; et al. The ERA5 global reanalysis. Q. J. R. Meteorol. Soc. 2020, 146, 1999–2049. [Google Scholar] [CrossRef]
  44. McFeeters, S.K. The use of the Normalized Difference Water Index (NDWI) in the delineation of open water features. Int. J. Remote Sens. 1996, 17, 1425–1432. [Google Scholar] [CrossRef]
  45. Huang, L.; Li, Z.; Zhou, J.M.; Zhang, P. An automatic method for clean glacier and nonseasonal snow area change estimation in High Mountain Asia from 1990 to 2018. Remote Sens. Environ. 2021, 258, 112376. [Google Scholar] [CrossRef]
  46. Raup, B.; Kääb, A.; Kargel, J.S.; Bishop, M.P.; Hamilton, G.; Lee, E.; Paul, F.; Rau, F.; Soltesz, D.; Khalsa, S.J. Remote sensing and GIS technology in the Global Land Ice Measurements from Space (GLIMS) project. Comput. Geosci. 2007, 33, 104–125. [Google Scholar] [CrossRef]
  47. Burns, P.; Nolin, A. Using atmospherically-corrected Landsat imagery to measure glacier area change in the Cordillera Blanca, Peru from 1987 to 2010. Remote Sens. Environ. 2014, 140, 165–178. [Google Scholar] [CrossRef]
  48. Zhang, C. Moisture sources for precipitation in Southwest China in summer and the changes during the extreme droughts of 2006 and 2011. J. Hydrol. 2020, 591, 125333. [Google Scholar] [CrossRef]
  49. van der Ent, R.J.; Savenije, H.H.G.; Schaefli, B.; Steele-Dunne, S.C. Origin and fate of atmospheric moisture over continents. Water Resour. Res. 2010, 46. [Google Scholar] [CrossRef]
  50. Xiao, M.; Cui, Y. Source of Evaporation for the Seasonal Precipitation in the Pearl River Delta, China. Water Resour. Res. 2021, 57, e2020WR028564. [Google Scholar] [CrossRef]
  51. Zhang, X.; Liu, Z.; Liu, Y.; Jiang, L.; Wang, R.; Jiang, H.; Li, J.; Tang, Q.; Yao, Z. Examining moisture contribution for precipitation in response to climate change and anthropogenic factors in Hengduan Mountain Region, China. J. Hydrol. 2023, 620, 129562. [Google Scholar] [CrossRef]
  52. Zhang, C.; Zhang, X.; Tang, Q.; Chen, D.; Huang, J.; Wu, S.; Liu, Y. Quantifying precipitation moisture contributed by different atmospheric circulations across the Tibetan Plateau. J. Hydrol. 2024, 628, 130517. [Google Scholar] [CrossRef]
  53. Zhang, C.; Chen, D.; Tang, Q.; Huang, J. Fate and Changes in Moisture Evaporated From the Tibetan Plateau (2000–2020). Water Resour. Res. 2023, 59, e2022WR034165. [Google Scholar] [CrossRef]
  54. Zhao, Y.; Lu, M.; Zhang, L.; Cheng, T.F. Remote Influence of Southern Tibetan Plateau Heating on North Pacific Atmospheric Rivers. J. Clim. 2025, 38, 101–116. [Google Scholar] [CrossRef]
  55. van der Ent, R.J.; Wang-Erlandsson, L.; Keys, P.W.; Savenije, H.H.G. Contrasting roles of interception and transpiration in the hydrological cycle—Part 2: Moisture recycling. Earth Syst. Dynam. 2014, 5, 471–489. [Google Scholar] [CrossRef]
  56. Zhang, G.; Yao, T.; Piao, S.; Bolch, T.; Xie, H.; Chen, D.; Gao, Y.; O’Reilly, C.M.; Shum, C.; Yang, K. Extensive and drastically different alpine lake changes on Asia’s high plateaus during the past four decades. Geophys. Res. Lett. 2017, 44, 252–260. [Google Scholar] [CrossRef]
  57. Li, M.; Weng, B.; Yan, D.; Bi, W.; Wang, H. Variation trends and attribution analysis of lakes in the Qiangtang Plateau, the Endorheic Basin of the Tibetan Plateau. Sci. Total Environ. 2022, 837, 155595. [Google Scholar] [CrossRef]
  58. Li, Y.; Liao, J.; Guo, H.; Liu, Z.; Shen, G. Patterns and potential drivers of dramatic changes in Tibetan lakes, 1972–2010. PLoS ONE 2014, 9, e111890. [Google Scholar] [CrossRef]
  59. Zhang, G.; Carrivick, J.L.; Emmer, A.; Shugar, D.H.; Veh, G.; Wang, X.; Labedz, C.; Mergili, M.; Mölg, N.; Huss, M. Characteristics and changes of glacial lakes and outburst floods. Nat. Rev. Earth Environ. 2024, 5, 447–462. [Google Scholar] [CrossRef]
  60. Chen, W.; Yao, T.; Zhang, G.; Woolway, R.I.; Yang, W.; Xu, F.; Zhou, T. Glacier surface heatwaves over the Tibetan Plateau. Geophys. Res. Lett. 2023, 50, e2022GL101115. [Google Scholar] [CrossRef]
  61. Zhao, F.; Gong, W.; Bianchini, S.; Yang, Z. Linking glacier retreat with climate change on the Tibetan Plateau through satellite remote sensing. Cryosphere 2024, 18, 5595–5612. [Google Scholar] [CrossRef]
  62. Du, J.; Yang, T.; He, Y. Glaciers and lakes changes and climate response in the Selin Co Basin from 1990 to 2011. J. Arid Land Resour. Environ. 2014, 28, 88–93. [Google Scholar]
  63. Miao, C.; Immerzeel, W.W.; Xu, B.; Yang, K.; Duan, Q.; Li, X. Understanding the Asian water tower requires a redesigned precipitation observation strategy. Proc. Natl. Acad. Sci. USA 2024, 121, e2403557121. [Google Scholar] [CrossRef] [PubMed]
  64. Xu, F.; Zhang, G.; Woolway, R.I.; Yang, K.; Wada, Y.; Wang, J.; Crétaux, J.-F. Widespread societal and ecological impacts from projected Tibetan Plateau lake expansion. Nat. Geosci. 2024, 17, 516–523. [Google Scholar] [CrossRef]
  65. Zhang, G.; Yao, T.; Xie, H.; Yang, K.; Zhu, L.; Shum, C.K.; Bolch, T.; Yi, S.; Allen, S.; Jiang, L.; et al. Response of Tibetan Plateau lakes to climate change: Trends, patterns, and mechanisms. Earth-Sci. Rev. 2020, 208, 103269. [Google Scholar] [CrossRef]
  66. Liao, J.J.; Shen, G.Z.; Li, Y.K. Lake variations in response to climate change in the Tibetan Plateau in the past 40 years. Int. J. Digit. Earth 2013, 6, 534–549. [Google Scholar] [CrossRef]
  67. Yang, J.-M.; Ma, L.-G.; Li, C.-Z.; Liu, Y.; Ding, J.-L.; Yang, S.-T. Temporal-spatial variations and influencing factors of Lakes in inland arid areas from 2000 to 2017: A case study in Xinjiang. Geomat. Nat. Hazards Risk 2019, 10, 519–543. [Google Scholar]
  68. Chen, D.; Xu, B.; Yao, T.; Guo, Z.; Cui, P.; Chen, F.; Zhang, R.; Zhang, X.; Zhang, Y.; Fan, J. Assessment of past, present and future environmental changes on the Tibetan Plateau. Chin. Sci. Bull. 2015, 60, 3025–3035. [Google Scholar]
  69. Zhang, G.; Duan, S. Lakes as sentinels of climate change on the Tibetan Plateau. All Earth 2021, 33, 161–165. [Google Scholar] [CrossRef]
  70. Wang, Y.; Yang, K.; Jia, T.; Luo, Y. Influence of natural factors and land use change on changes in the main lake area in China over the past 30 years. Ecol. Indic. 2023, 155, 111005. [Google Scholar] [CrossRef]
  71. Zhang, Y.; Gao, T.; Kang, S.; Shangguan, D.; Luo, X. Albedo reduction as an important driver for glacier melting in Tibetan Plateau and its surrounding areas. Earth-Sci. Rev. 2021, 220, 103735. [Google Scholar] [CrossRef]
  72. Tang, S.; Vlug, A.; Piao, S.; Li, F.; Wang, T.; Krinner, G.; Li, L.Z.; Wang, X.; Wu, G.; Li, Y. Regional and tele-connected impacts of the Tibetan Plateau surface darkening. Nat. Commun. 2023, 14, 32. [Google Scholar] [CrossRef]
  73. Vassiljev, J. The simulated response of lakes to changes in annual and seasonal precipitation: Implication for Holocene lake-level changes in northern Europe. Clim. Dyn. 1998, 14, 791–801. [Google Scholar] [CrossRef]
  74. Song, Y.; Deji, Y. Variation of Selin Co lake area during 1988-2020 and its response to climate change. Nanjing Xinxi Gongcheng Daxue Xuebao 2023, 15, 24–33. [Google Scholar]
  75. Lei, Y.; Yao, T.; Bird, B.W.; Yang, K.; Zhai, J.; Sheng, Y. Coherent lake growth on the central Tibetan Plateau since the 1970s: Characterization and attribution. J. Hydrol. 2013, 483, 61–67. [Google Scholar] [CrossRef]
  76. Webb, E.E.; Liljedahl, A.K. Diminishing lake area across the northern permafrost zone. Nat. Geosci. 2023, 16, 202–209. [Google Scholar] [CrossRef]
  77. Gao, T.; Zhang, Y.; Kang, S.; Abbott, B.W.; Wang, X.; Zhang, T.; Yi, S.; Gustafsson, Ö. Accelerating permafrost collapse on the eastern Tibetan Plateau. Environ. Res. Lett. 2021, 16, 054023. [Google Scholar] [CrossRef]
  78. Yao, T.; Pu, J.; Lu, A.; Wang, Y.; Yu, W. Recent glacial retreat and its impact on hydrological processes on the Tibetan Plateau, China, and surrounding regions. Arct. Antarct. Alp. Res. 2007, 39, 642–650. [Google Scholar] [CrossRef]
  79. Sun, F.; He, B.; Liu, C.; Zeng, Y. Comparison of Hydrological Patterns between Glacier-Fed and Non-Glacier-Fed Lakes on the Southeastern Tibetan Plateau. Remote Sens. 2021, 13, 4024. [Google Scholar] [CrossRef]
  80. Hou, Y.; Long, H.; Shen, J.; Gao, L. Holocene lake-level fluctuations of Selin Co on the central Tibetan plateau: Regulated by monsoonal precipitation or meltwater? Quat. Sci. Rev. 2021, 261, 106919. [Google Scholar] [CrossRef]
  81. Zhang, Y.; An, C.-B.; Zheng, L.-Y.; Liu, L.-Y.; Zhang, W.-S.; Lu, C.; Zhang, Y.-Z. Assessment of lake area in response to climate change at varying elevations: A case study of Mt. Tianshan, Central Asia. Sci. Total Environ. 2023, 869, 161665. [Google Scholar] [CrossRef]
  82. Liu, J.-L.; Zhou, T.-C.; Yu, H.; Sun, J. Dynamics and Driving Forces of Lake Changes inTibet During the Past 25 Years. J. Yangtze River Sci. Res. Inst. 2018, 35, 145. [Google Scholar]
  83. Yang, R.-H.; Yu, X.-Z.; Li, Y.-L. The dynamic analysis of remote sensing information for monitoring the expansion of the Selincuo Lake in Tibet. Remote Sens. Land Resour. 2003, 2, 64–67. [Google Scholar]
  84. Lei, Y.; Yang, K.; Immerzeel, W.W.; Song, P.; Bird, B.W.; He, J.; Zhao, H.; Li, Z. Critical role of groundwater inflow in sustaining lake water balance on the Western Tibetan Plateau. Geophys. Res. Lett. 2022, 49, e2022GL099268. [Google Scholar] [CrossRef]
  85. Song, Y.; Zhang, Q.; Melack, J.M.; Li, Y. Groundwater dynamics of a lake-floodplain system: Role of groundwater flux in lake water storage subject to seasonal inundation. Sci. Total Environ. 2023, 857, 159414. [Google Scholar] [CrossRef] [PubMed]
  86. Vaheddoost, B.; Aksoy, H. Interaction of groundwater with Lake Urmia in Iran. Hydrol. Process. 2018, 32, 3283–3295. [Google Scholar] [CrossRef]
  87. Zhang, Y.; Kang, S. Melting glaciers threaten ice core science on the Tibetan Plateau. Nat. Geosci. 2023, 16, 656–657. [Google Scholar] [CrossRef]
  88. Rowan, A.V.; Egholm, D.L.; Clark, C.D. Forward modelling of the completeness and preservation of palaeoclimate signals recorded by ice-marginal moraines. Earth Surf. Process. Landf. 2022, 47, 2198–2208. [Google Scholar] [CrossRef]
  89. Huybers, K.; Roe, G.H. Spatial patterns of glaciers in response to spatial patterns in regional climate. J. Clim. 2009, 22, 4606–4620. [Google Scholar] [CrossRef]
Figure 1. Overview of the study area. (a) The location of the Tibetan Plateau in China. (b) The location of the Selin Co Basin in Tibetan Plateau. (c) The distribution of lakes and river systems in the Selin Co Basin.
Sustainability 17 02024 g001
Figure 2. Change characteristics of the lake area in Selin Co from 1988 to 2023. (a) Dynamic changes in the boundary of Selin Co Lake; (b) Spatial change characteristics of Selin Co Lake area; (c) Temporal change characteristics of the Selin Co Lake area.
Sustainability 17 02024 g002
Figure 3. Temporal changes of main climate factors in Selin Co Basin. (a) Annual average precipitation (Pre), (b) annual average temperature (Tm), (c) annual average snow and ice area (SIA), (d) annual average snow depth (Snd).
Sustainability 17 02024 g003
Figure 4. Change characteristics of glacier area in Selin Co from 1986 to 2023. (a) Temporal change characteristics of the Geladandong Glacier area (1986–2023); (b) Temporal change characteristics of the Jiagang Glacier area (1988–2023).
Sustainability 17 02024 g004
Figure 5. Spatial change characteristics of Selin Co Glacier area from 1990 to 2023. (a) Spatial change characteristics of the Geladandong Glacier area; (b) Spatial change characteristics of the Jiagang Glacier area.
Sustainability 17 02024 g005
Figure 6. Spatial distribution of average annual water vapor source for the Selin Co basin (1991–2020). The water vapor contribution is represented by equivalent water depth (mm). Red area is the Selin Co basin, blue line represents latitude/longitude summaries of water vapor contribution, blue shaded areas show 5%–95% confidence interval.
Sustainability 17 02024 g006
Figure 7. Spatial distribution of multi-annual average water vapor sources in the Selin Co basin during different seasons (1991–2020): (a) winter, (b) summer, (c) spring, (d) autumn. Red area is Selin Co basin.
Sustainability 17 02024 g007
Figure 8. Water vapor contribution rate in different seasons and source areas of Selin Co basin.
Sustainability 17 02024 g008
Figure 9. Variations of water vapor contribution rate in different source regions: (a) within basin, (b) out of basin, (c) land, (d) ocean.
Sustainability 17 02024 g009
Table 1. Information of Landsat 5/7/8 images.
SatelliteTime RangeVariableBlue BandGreen BandRed BandNear-Infrared
Band
Shortwave Infrared 1Shortwave Infrared 2
Landsat 51984–2012Band nameSR_B1SR_B2SR_B3SR_B4SR_B5SR_B7
Wavelength
/ μ m
0.45~0.520.52~0.600.63~0.690.76~0.901.55~1.752.08~2.35
Landsat 71999–2021Band nameSR_B1SR_B2SR_B3SR_B4SR_B5SR_B7
Wavelength
/ μ m
0.45–0.520.52–0.600.63–0.690.77–0.901.55–1.752.08–2.35
Landsat 82013–PresentBand nameSR_B2SR_B3SR_B4SR_B5SR_B6SR_B7
Wavelength
/ μ m
0.452–0.5120.533–0.5900.636–0.6730.851–0.8791.566–1.6512.107–2.294
Table 2. Statistical characteristics of lake area in Selin Co during different periods.
TimeMean/km2Range/km2CV/%
1988–20001735.53167.082.49
2001–20102170.02409.147.06
2011–20232397.64104.941.51
1988–20232095.32789.5614.38
Table 3. Statistical characteristics of glacier area in Selin Co during different periods.
GlacierTimeMean/km2Range/km2CV/%
Geladandong1986–2000125.7825.265.24
2001–2010119.3126.187.41
2011–2023110.7325.286.49
1988–2023118.9131.488.21
Jiagang1988–200095.1247.4014.87
2001–201083.3145.5718.36
2011–202369.7763.6930.52
1988–202380.8583.8725.85
Table 4. Water vapor contribution rate in different seasons and source areas of Selin Co basin (%).
Source RegionAnnualSpringSummerAutumnWinter
Within basin6.855.057.406.662.49
Outside basin93.1594.9592.6093.3497.51
Land74.9426.2523.8273.3853.49
Ocean25.0674.7576.1816.6246.51
Disclaimer/Publisher’s Note: The statements, opinions and data contained in all publications are solely those of the individual author(s) and contributor(s) and not of MDPI and/or the editor(s). MDPI and/or the editor(s) disclaim responsibility for any injury to people or property resulting from any ideas, methods, instructions or products referred to in the content.

