Article

Toward Sustainable Urban Development: Exploring the Polycentric Transition of Chinese Cities Through Nighttime Lights

1
College of Geography and Environment, Shandong Normal University, Jinan 250358, China
2
Collaborative Innovation Center of Human–Nature and Green Development in Universities of Shandong, Shandong Normal University, Jinan 250358, China
*
Author to whom correspondence should be addressed.
Sustainability 2025, 17(5), 2013; https://doi.org/10.3390/su17052013
Submission received: 13 January 2025 / Revised: 20 February 2025 / Accepted: 24 February 2025 / Published: 26 February 2025

Abstract

:
Studying urban spatial structure (USS) is crucial for advancing sustainable urban development. This study examined the USS of 292 cities in China from 2007 to 2022 using nighttime lights and the Herfindahl–Hirschman Index. The determinants of USS were analyzed through a fixed-effects spatial Durbin model based on the theoretical framework of influencing factors. The findings revealed a nationwide trend toward a polycentric USS across various city types. Economic growth drove the transformation from a monocentric to a polycentric USS. Additionally, the development of postal infrastructure promoted a shift toward a polycentric USS. Transportation infrastructure, industrial structure, residential consumption level, and government intervention were pivotal in shaping a monocentric USS. Regarding spatial spillover effects, transportation infrastructure, industrial structure, and economic growth fostered a polycentric tendency in neighboring cities, whereas government intervention reinforced a monocentric tendency.

1. Introduction

The urban spatial structure (USS) reflects the complex distribution and dynamic interplay of socio-economic activities within the physical landscape of cities, serving as a hot topic in disciplines such as urban geography, urban and rural planning, urban economics, and urban sociology [1,2,3]. Goal 11 of the United Nations Sustainable Development Goals (SDGs) emphasizes the need to “Make cities and human settlements inclusive, safe, resilient, and sustainable” “https://sdgs.un.org/goals (accessed on 2 February 2025)”. This goal seeks to enhance urban sustainability in response to the complex challenges of urbanization, including inadequate infrastructure, air pollution, traffic congestion, social inequality, and housing shortages. Additionally, it underscores the need for cities to adapt to climate change and natural disasters to improve the quality of life for all residents. USS plays a fundamental role in shaping a city’s functional layout, resource efficiency, and residents’ lifestyles, significantly influencing its sustainable development. A well-planned USS can effectively integrate various functional areas, shorten commuting distances, alleviate traffic congestion, reduce energy consumption, and enhance urban efficiency and sustainability [4]. Moreover, a rational USS can optimize land use patterns, prevent uncontrolled urban sprawl, and protect the natural ecological areas surrounding the city. It also offers essential ecological services and green spaces, promoting environmental balance [5]. Given its profound impact, the USS has become a focal point in urban planning and development, drawing significant attention from governments and all sectors of society. The New Urban Agenda highlights the importance of “enhancing spatial connections between housing and urban structures as well as their adjacent functional areas”. Concurrently, the 14th Five-Year Plan of China advocates for the judicious articulation of the USS to foster harmonious growth across cities and towns of various sizes. Amidst accelerated economic growth, technological advancements, and rapid urbanization, the USS has evolved with new characteristics such as “flow” space, spatial sharing economy, and digitalization, becoming a landscape shaped by increasingly intricate and multifaceted influencing factors. The systematic investigation of these determinants, grounded in a rigorous assessment of USS, has emerged as an important area of research. The research outcomes will be instrumental in providing policy recommendations that ensure sustainable urban development.
The USS typically exhibits two characteristics: monocentric and polycentric. A monocentric structure refers to the concentration of economic activities, population, infrastructure, and services in a central area, with peripheral areas relying on the resources and services provided by the core [6]. In a monocentric USS, the central area attracts capital, talent, and technology from surrounding regions through the “polarization effect” and spreads these resources to peripheral areas via the “diffusion effect”. Over time, the surrounding areas develop under the influence of the central area, creating a dependency and forming a typical hierarchical structure resembling a “pyramid”. In contrast, a polycentric structure is characterized by multiple complementary centers within a city. Each center specializes in different functions, such as economics, culture, and social affairs, fostering the sustainable development of the entire city through cooperation and interaction [7]. In a polycentric USS, no single central area holds absolute dominance; instead, a balanced development trend emerges. Each center facilitates the flow and sharing of resources, capital, and technology through an integrated transportation system, industrial cooperation, and functional division of labor.
Studies of USS have taken either morphological or functional perspectives [8,9]. Investigations from a morphological perspective have considered the aggregation and dispersion of factors, emphasizing the delineation of spatial distributions across these diverse elements [10]. This approach relies on data for parameters such as population [11,12] and nighttime lights (NTL) [13]. These studies have used analytical tools such as the Herfindahl–Hirschman Index (HHI) [14] and the rank-size rule [15]. For example, Liu et al. utilized population data to measure the degree of polycentricity in cities by analyzing the spatial distribution of population centers, thereby accurately depicting the subtle differences in the spatial structure of various cities [16]. Riguelle et al. focused on European cities and quantified the polycentric characteristics of different cities based on employment distribution data [17]. From a functional perspective, research has examined the critical functional interconnections across cities and proposed that the functional linkages are based on the flow of various factors [18,19]. Applying this analytical approach, researchers have examined flow patterns, including commuting [20], social media [21], mobile phone [22], and taxi trajectory data [23]. These studies aimed to assess the provision of additional functions beyond local needs and identify the compactness of urban center configurations, thus, enriching our understanding of USS. Using this approach, Wang et al. considered taxi trajectories data and identified the distinctly multi-directional, balanced polycentric setup of Shanghai, China [24]. Zhang et al. used smart card data from 2013 to 2017 and conducted a multinomial logistic regression to document the evolution of USS in London, UK, toward an increasingly polycentric and compact structure [25]. Burger et al. examined the development trends of the spatial structure of metropolitan areas in England and Wales using journey-to-work data between local authority districts [26]. His research revealed significant differences in the evolution of spatial structures across cities.
Studies of the determinants shaping USS have been conducted in various disciplines, emphasizing distinct facets of urban development. Urban planning, as the progenitor of USS studies, has adopted concepts like garden cities, edge cities, and satellite towns, underscoring the pivotal role of infrastructure in mitigating urban challenges such as traffic congestion and environmental degradation [27]. Song et al. quantified the subway network’s impact on USS optimization [28]. In contrast, urban geography, focusing on land use types, has explored the significant influence of industrial characteristics on the evolution of USS. In the field of new economic geography, which attempts to understand the effects of scale economies, studies have focused on the evolution of USS under the effect of economic activity [29]. Zhang et al. studied the Kunming–Yuxi Urban Agglomeration in China using big data and a geographical detector, revealing the impact of per capita GDP on USS over time [30]. Studies in urban sociology have ventured further, investigating the profound influence of human behavior and societal activities on USS [31].
A thorough review of the existing literature revealed that significant advances have been made in measuring USS and identifying its determinants, substantially enriching the theoretical framework and policy dialog surrounding USS. However, these studies have several limitations. (1) A reliance on traditional statistical and big data has impeded the objective comparison of USS across various cities and has prevented a cohesive analysis of nationwide USS evolution and characteristics. (2) Studies using metrics such as the HHI, Pareto index, and primacy index extend to the level of urban agglomerations or macro-regions, amalgamating data across entire agglomerations or regions, which obscures the finer details at the city or municipal level. Given the pivotal role of municipal areas in orchestrating the “daily life circles” of residents, facilitating the equitable distribution of public resources, and fostering urban–rural integration, a focused examination of municipal-level USS is critical. (3) Existing research has targeted the influence of a single factor on USS, preventing a comprehensive analysis and integration from a systemic perspective.
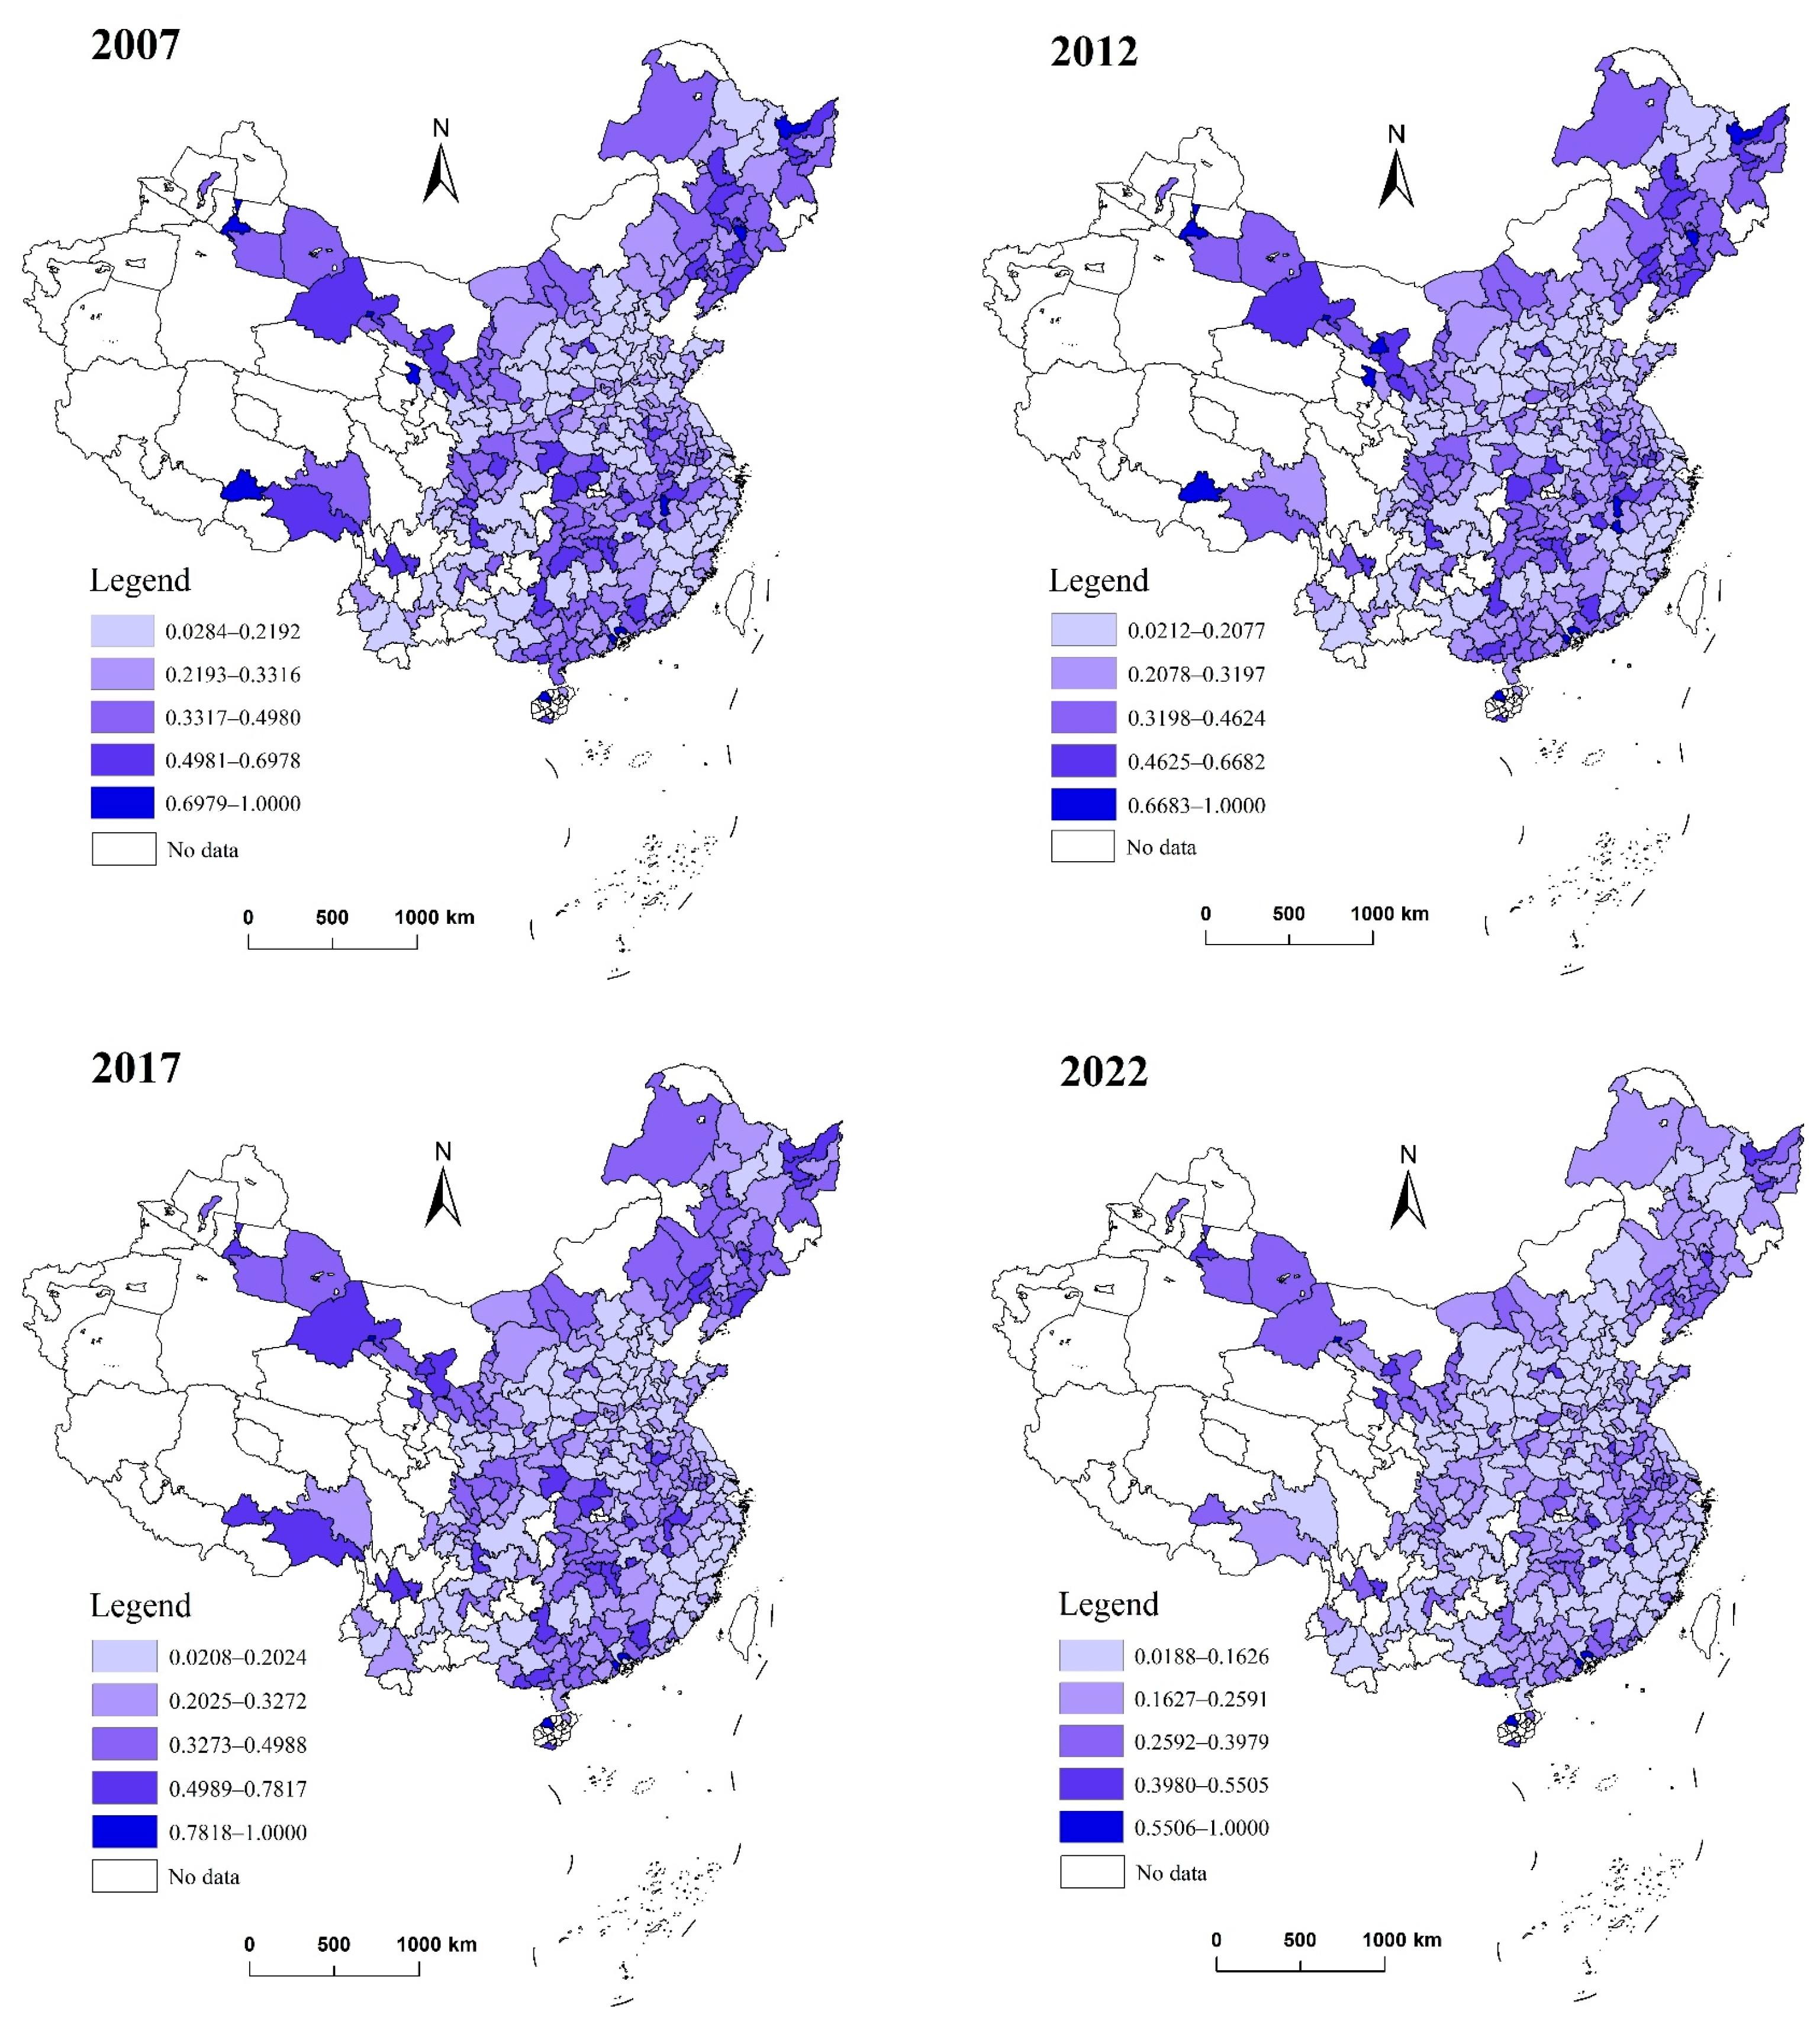
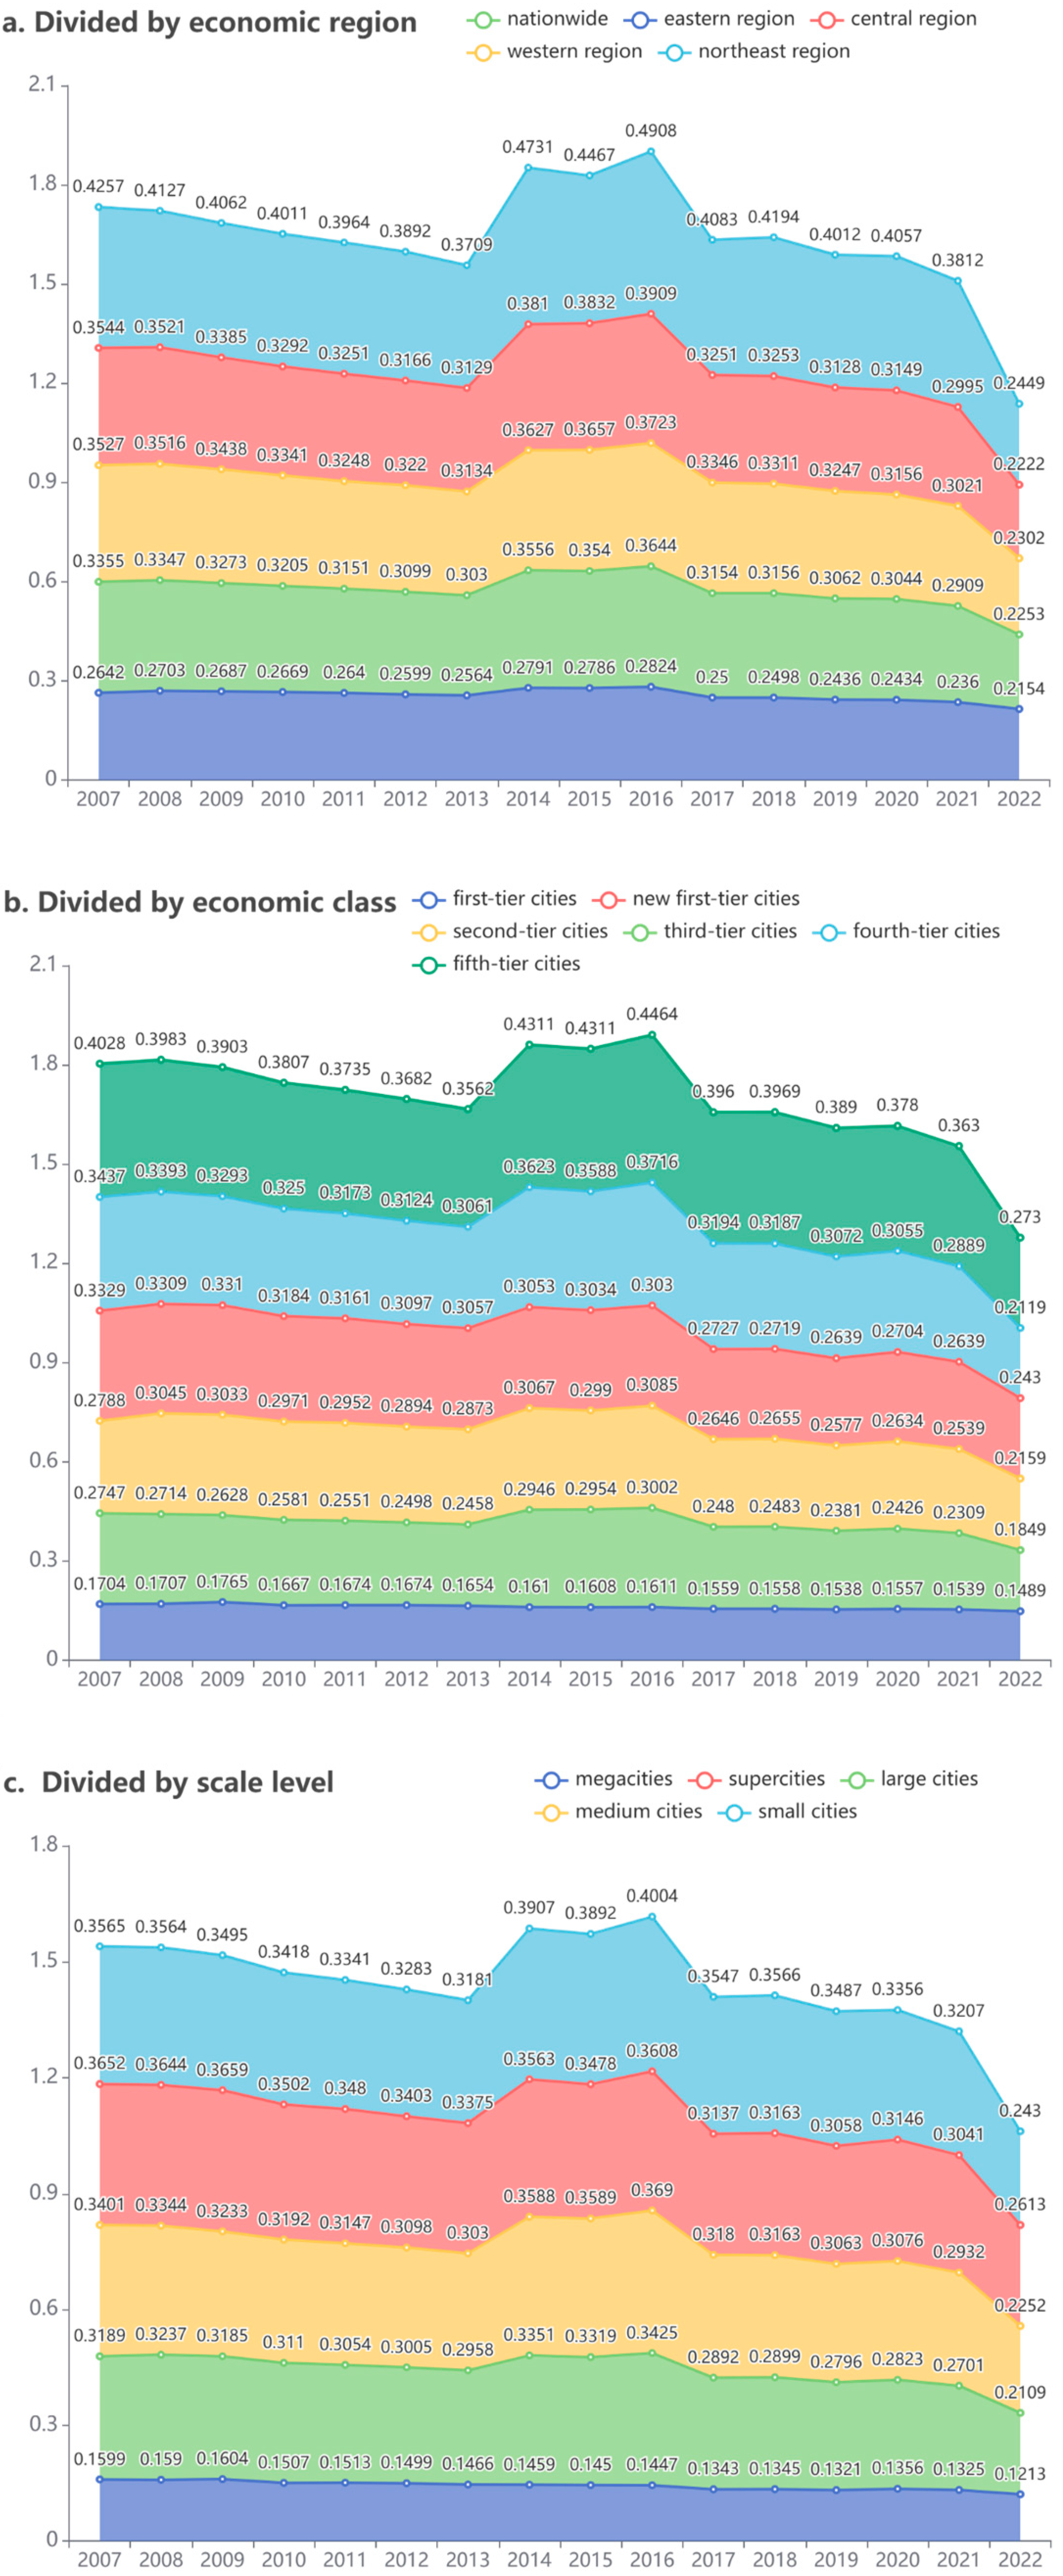
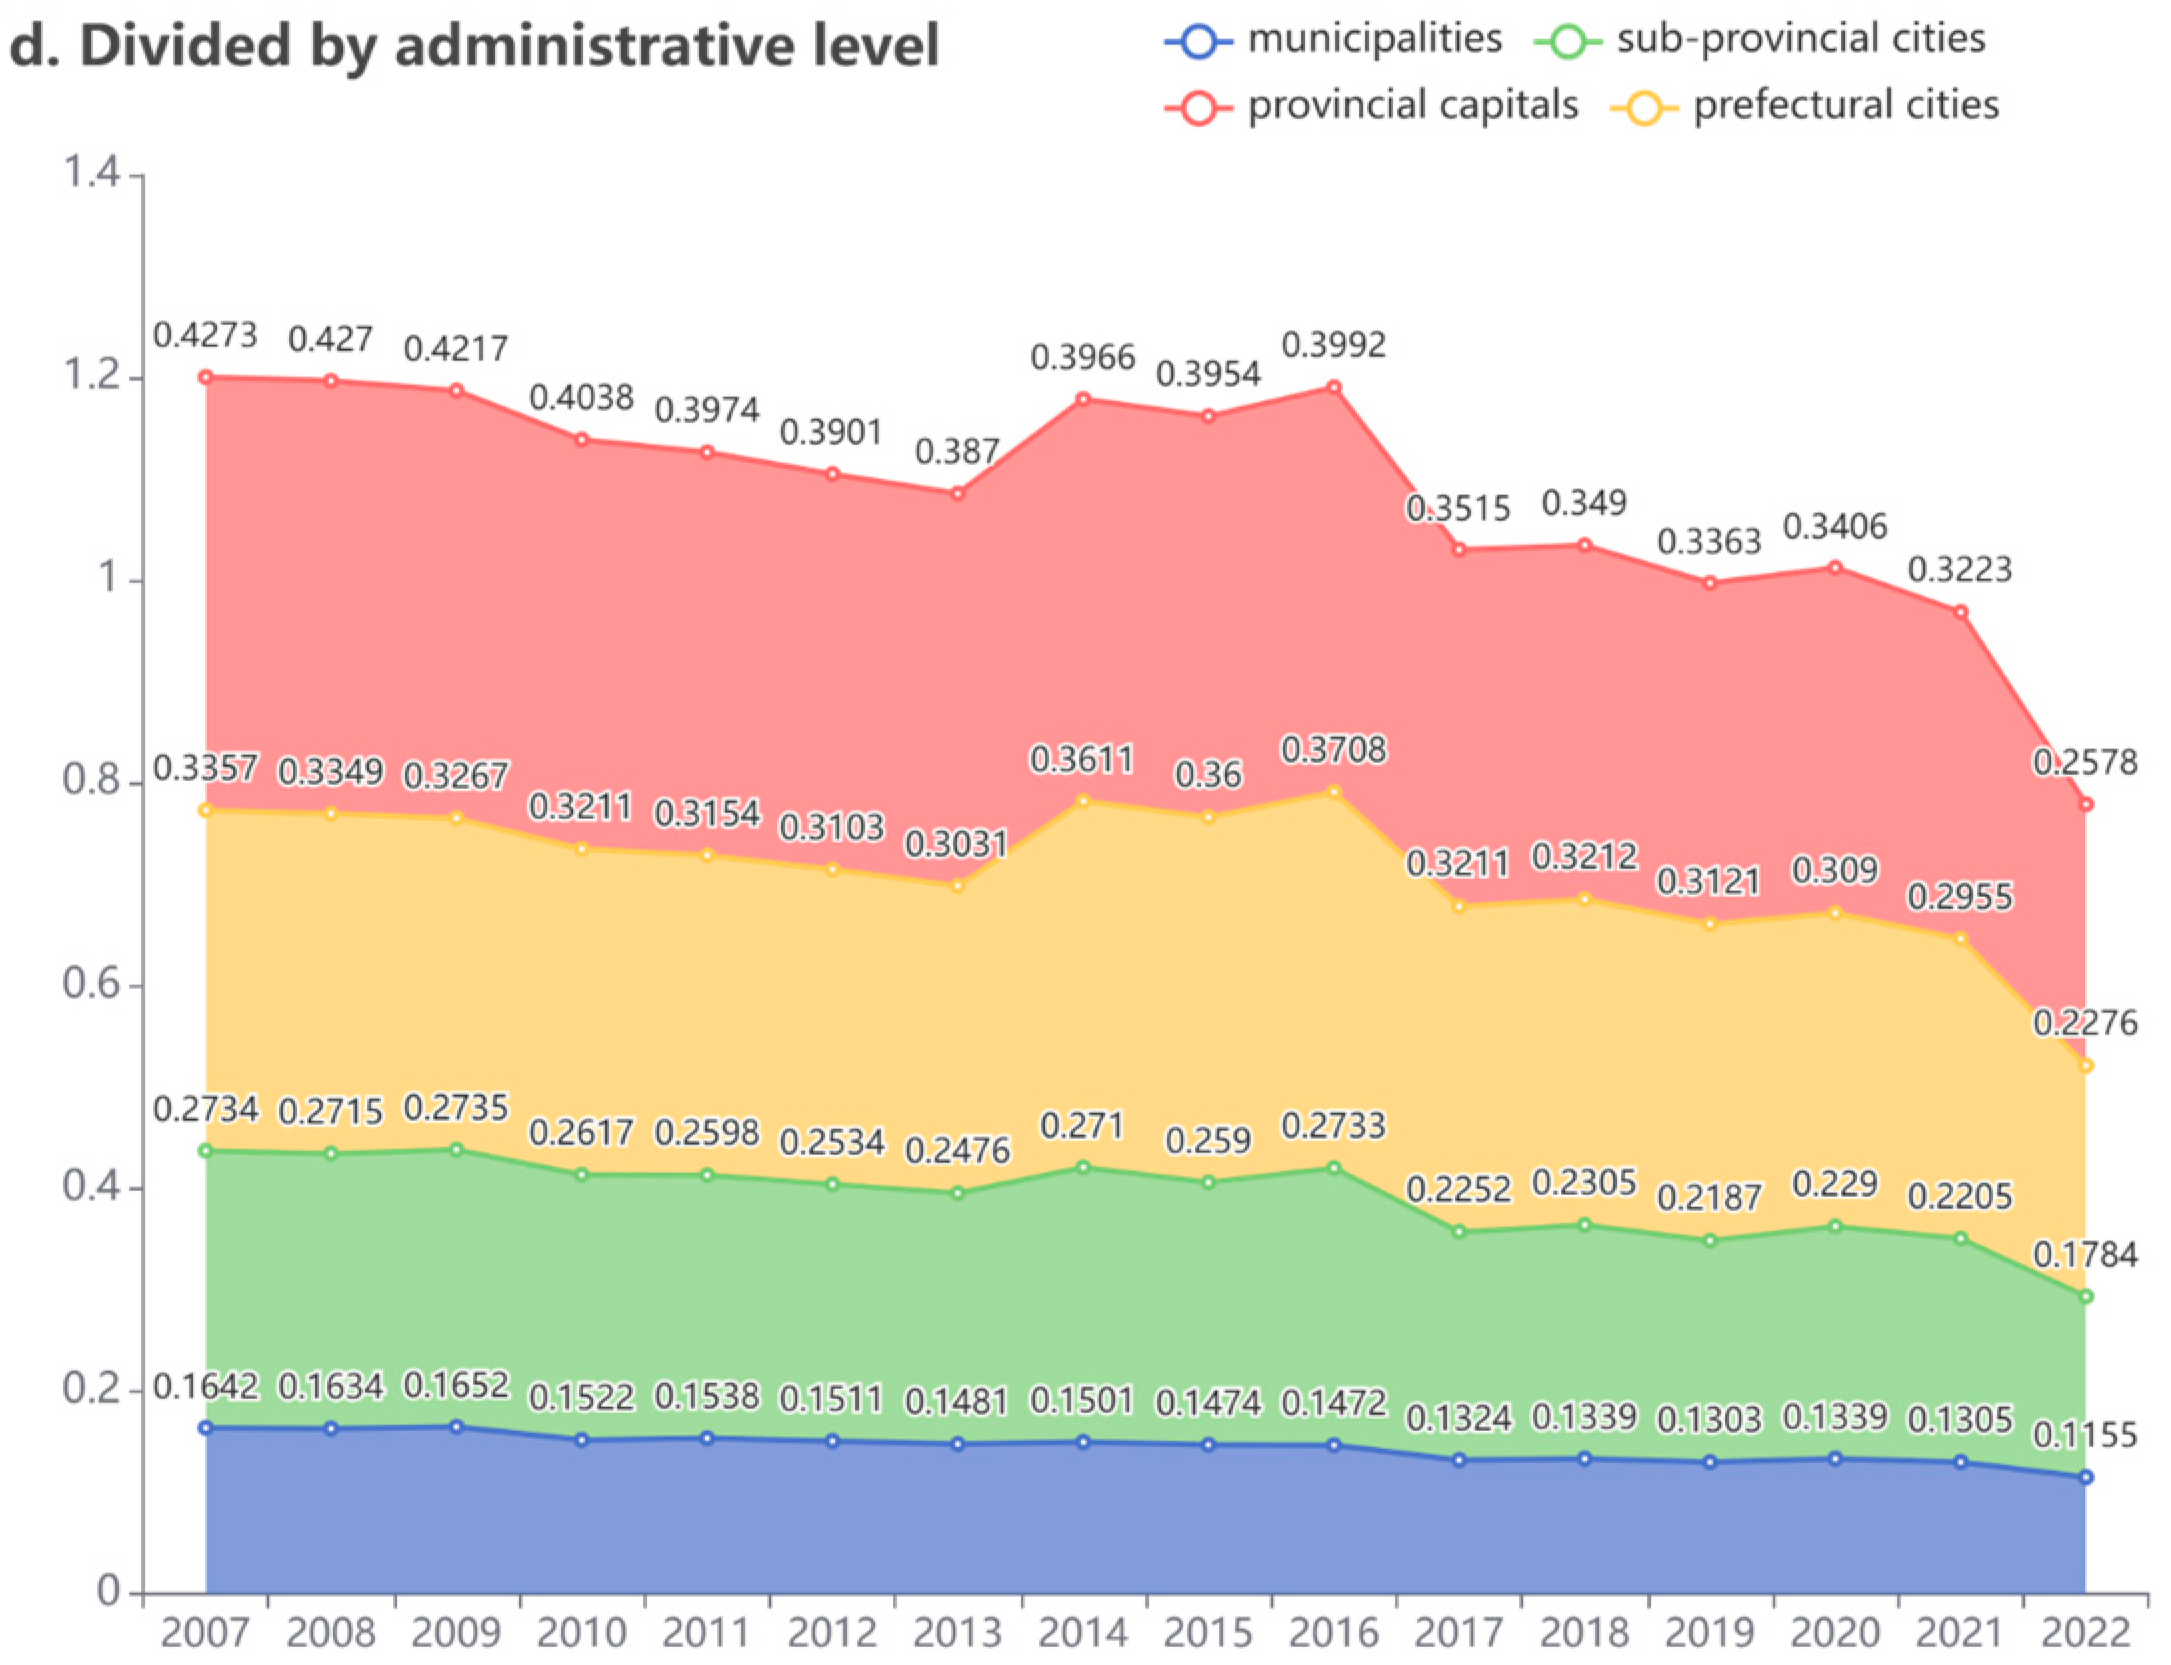
With the rapid development of China’s economy and the acceleration of urbanization, the gap between urban and rural areas has widened, leading to increasingly prominent issues such as uneven resource allocation, social stratification, and worsening environmental pollution. Additionally, spatial imbalances—such as uncontrolled urban expansion, growing separation between employment and residential areas, and prolonged commuting distances—have become more severe. To effectively address these challenges, it is crucial to scientifically measure and analyze USS. Understanding the characteristics and influencing factors of USS holds significant theoretical and practical value for formulating more informed regional development policies and promoting coordinated urban growth. Moreover, it has far-reaching implications for sustainable urban development, resource optimization, social equity, and environmental protection, all of which are essential for ensuring the healthy evolution of modern cities. To this end, our study encompassed 292 prefecture-level and above cities in China from 2007 to 2022, using district and county-level NTL data and the HHI to delineate the USS. We established a theoretical framework and applied the spatial Durbin model (SDM) to explore the intricate interplay between the factors that influence USS.
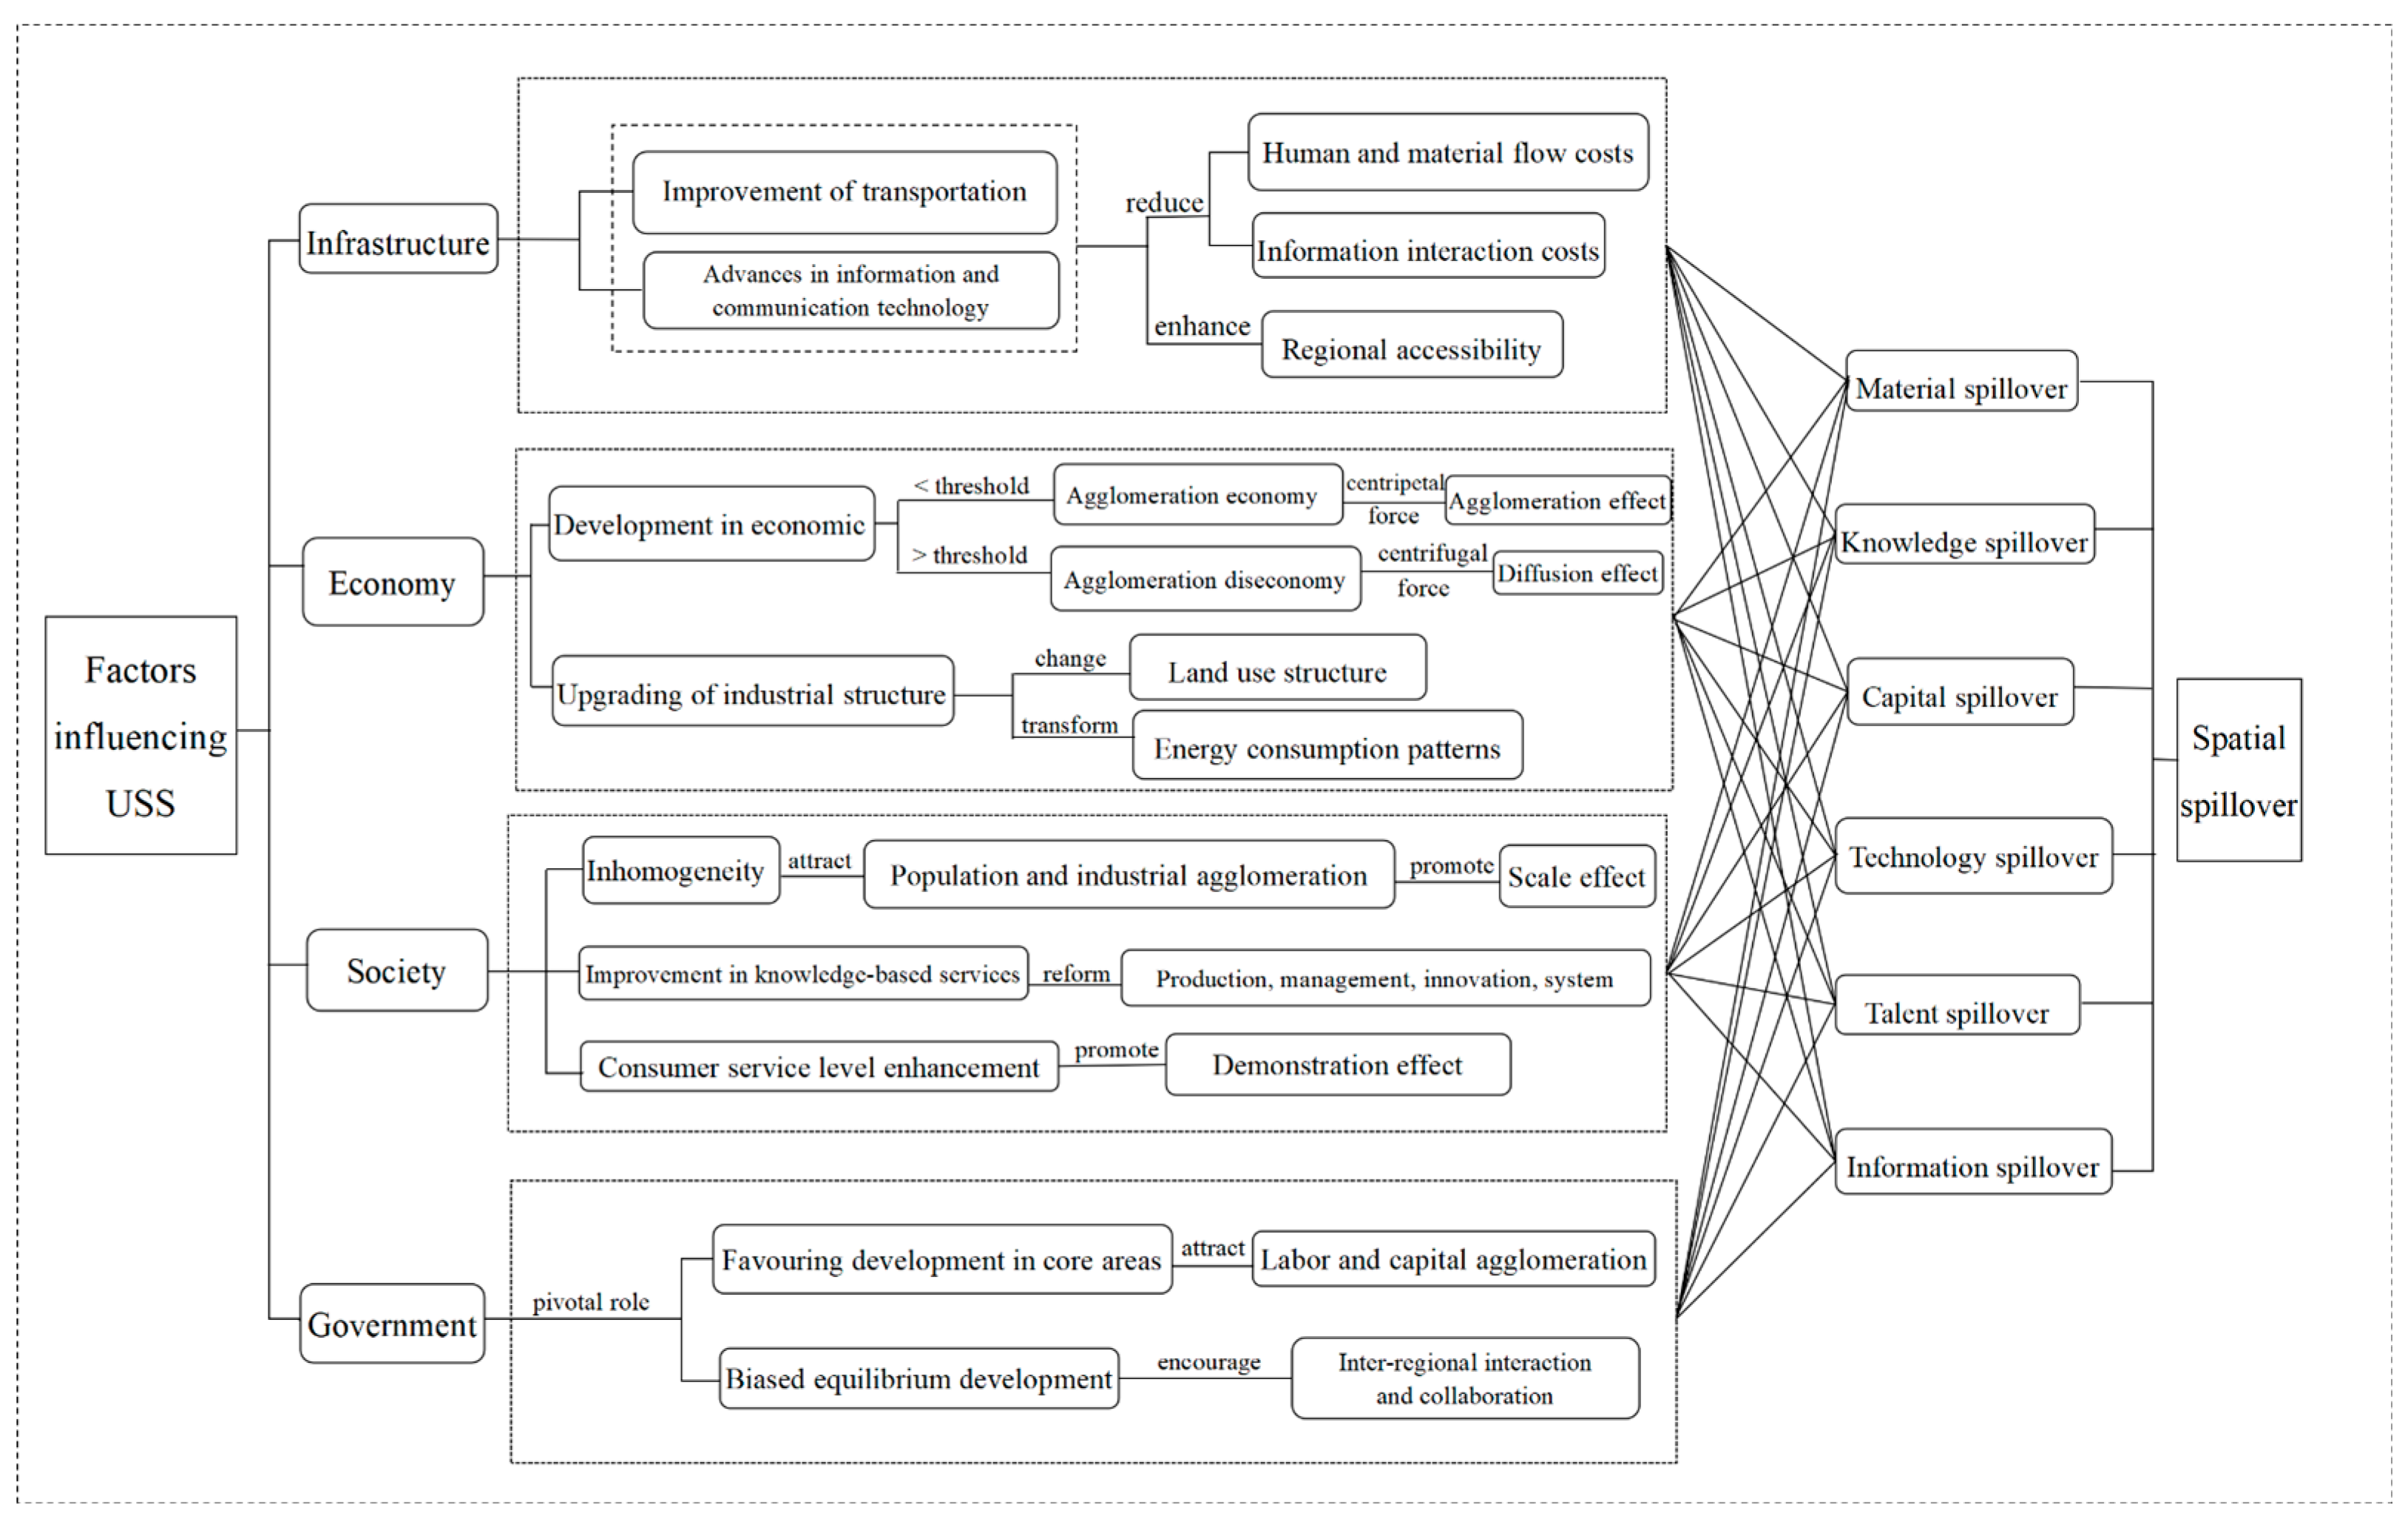
This study makes innovative contributions in three key areas. The first is the innovation in the method of measuring USS. Traditional research methods typically rely on various statistical indicators, which are often constrained by data quality and accessibility. These methods fail to capture the dynamic changes in USS adequately. In contrast, this study employs a combination of NTL data and HHI as a measurement tool for USS. NTL data directly reflects the intensity, distribution, and changes in urban artificial lighting at night, which is strongly correlated with urban economic activities, population distribution, and social vitality. By using NTL to calculate the HHI, the study improves the accuracy of measuring USS, offering a more comprehensive and objective assessment compared to traditional statistical methods. This approach effectively overcomes the one-sidedness and limitations inherent in conventional metrics. The second innovation lies in the research scale. Unlike previous studies, which primarily focus on urban clusters or macro-regions, this study examines 292 cities in China. This scale allows for a deeper understanding of USS and provides insights into the “daily life circles” of residents. By analyzing different types of cities, the study reveals the complexity and variability of USS across diverse contexts. The third innovation concerns the factors that influence USS. Traditional research often focuses on a single factor, yet the formation and evolution of USS is a multidimensional and multilevel process influenced by a range of factors. Through constructing a comprehensive theoretical framework, this study systematically integrates four key dimensions—namely infrastructure, economy, social factors, and government intervention—and explores how these factors shape USS from multiple perspectives. Furthermore, the study employs an SDM to account for spatial spillover effects, revealing that the impact of a particular factor on USS is not confined to the local area but may extend to neighboring regions, generating similar or differing effects.
The subsequent sections are arranged in the following order. Section 2 delineates the data sources and methodologies employed, encompassing NTL data, geographic information, and the datasets used for analyzing factors influencing USS. It also describes the analytical tools used, including the HHI and SDM. Section 3 presents the research findings, illustrating the evolution of USS over the study period and the theoretical analytical framework used to systematically analyze the impact of multiple elements on USS. This information is supplemented by the results of robustness and endogeneity tests. Section 4 discusses how our measurements of USS in different cities are compared. It also discusses the factors influencing USS, highlighting the contributions and innovations of our research and addressing its potential limitations. Section 5 is the concluding section. It synthesizes the study’s findings and translates them into actionable policy insights, with the aim of informing future urban development strategies and facilitating sustainable urban growth.

2. Data Sources and Method

2.1. Data Sources

Nighttime lights: The NTL captured the intensity, distribution, and quantity of artificial lighting on Earth as observed from satellites [32,33]. This is markedly improved over conventional statistical approaches due to its precision and impartiality. In previous studies, these data have been instrumental in delineating urban hierarchies and urban sprawl [34,35,36]. The research predominantly drew from two comprehensive sources: the Operational Linescan System from the Defense Meteorological Satellite Program “https://eogdata.mines.edu/dmsp/downloadV4composites.html (accessed on 7 January 2025)” and the Visible Infrared Imaging Radiometer Suite aboard the United States advanced polar-orbit satellites “https://eogdata.mines.edu/download_dnb_composites.html (accessed on 7 January 2025)”. Despite their broad application, intrinsic disparities in spectral, spatial, and radiometric resolutions, alongside differing update frequencies, necessitate data reconciliation. Following the methodologies established by Wu et al., the refined datasets from the Operational Linescan System from the Defense Meteorological Satellite Program and the Visible Infrared Imaging Radiometer Suite spanning 2007 to 2022 were combined to forge a composite dataset tailored for China [37]. The dataset covered 292 prefecture-level cities, excluding Sansha, Zhaotong, Xigaze, Shannan, Nagqu, Hong Kong, Macau, and Taiwan.
Geographic information data: The National Geomatics Center of China “http://www.ngcc.cn/ (accessed on 8 January 2025)” provided geographic information at a 1:4 million scale. This dataset facilitated the creation of precise vector maps delineating the administrative boundaries of prefecture-level cities.
Data on influencing factors: Data for highway mileage, postal service volume, tertiary industry output value, secondary industry output value, per capita GDP, total retail sales of consumer goods, number of university students, local general public budget expenditures, and gross regional product, were obtained from the China Urban Statistical Yearbook “https://www.stats.gov.cn (accessed on 8 January 2025)”. Urban population data were obtained from the China Urban Construction Statistical Yearbook “https://www.mohurd.gov.cn/gongkai/fdzdgknr/sjfb/tjxx/jstjnj/index.html (accessed on 8 January 2025)”. Due to significant data omissions, an array of cities (including Shuozhou, Tongliao, Shuangyashan, Xiangyang, Zhuhai, Jieyang, Guigang, Haikou, Danzhou, Bazhong, Ziyang, Bijie, Tongren, Puer, Changdu, Linzhi, Jinchang, Baiyin, Dingxi, Xining, Haidong, Yinchuan, Shizuishan, Zhongwei, Hami, Turpan, and Karamay) were omitted from the analysis, narrowing the focus to a comprehensive evaluation of factors influencing USS in 265 cities.
Table 1 presents descriptive statistics for the entire dataset.

2.2. Methods

2.2.1. HHI

The HHI was initially developed in industrial economics as a measure of market concentration, assessing the distribution of firms within a market [38,39]. Over time, with the advancement of urban research, HHI has been increasingly applied to urban geography and urban economics, emerging as an effective tool for quantifying the degree of concentration and decentralization in USS [40]. At its core, the HHI evaluates the overall concentration of an urban system by measuring the relative significance of each sub-region, such as urban centers, county areas, and county-level cities. It is computed as the sum of the squared market share (or activity share) of each sub-region, making it particularly sensitive to changes in larger shares. This characteristic enables HHI to capture the degree of centralization within USS effectively. In this study, we introduce NTL data as a novel metric for calculating HHI, allowing for a more refined analysis of the spatial structure of cities. This innovative approach enhances the ability to assess USS, providing a valuable tool for further in-depth research on urban development and organization. The H H I is calculated as follows:
H H I c t = k = 1 m ( r k t R c t ) 2
where H H I c t is the H H I for city c in year t . The index values span from 0 to 1, where higher values signify a monocentric structure, and lower values indicate a polycentric structure. The variable r k t corresponds to the NTL for the central urban areas, counties, and county-level cities k within prefecture-level city c during year t . The variable m represents the total count of these entities within the city, and R c t is the total NTL for city c in the designated year.

2.2.2. SDM

As a widely used spatial econometric model, the SDM is a powerful tool for analyzing interdependencies among regions in spatial data [41]. Compared to traditional regression models, SDM offers significant advantages in capturing spatial autocorrelation effects, particularly in identifying spatial lag and spillover effects. In the study of USS, SDM’s core strength lies in its ability to account for spatial dependence and spillover effects both within a city and across neighboring areas. Specifically, by incorporating both the independent variable and its spatial lag term into the model, SDM not only quantifies the direct impact of various influencing factors on a region’s USS but also uncovers the indirect (spillover) effects on adjacent regions. The SDM is calculated as follows:
Y i t = β 0 + ρ j = 1 n W i j Y j t + θ X i t + φ j = 1 n W i j X j t + α i + δ t + ε i t
where Y represents the dependent variable, specifically H H I ; X denotes the explanatory variables, which are the influencing factors of USS; i and j denote city i and j ; W i j is the spatial weight matrix; ρ is the spatial regression coefficient of H H I ; θ is the regression coefficient of the explanatory variable; φ is the spatial regression coefficient of X ; β 0 is the constant term; α i is the spatial fixed effect; δ t is the time fixed effect; and ε i t is the spatial autocorrelation error term.

3. Results

3.1. The USS

Figure 1 presents a detailed spatial portrayal of the HHI across cities in China from 2007 to 2022. The figure clearly shows that dark-colored areas decreased while light-colored areas increased, and the overall color lightened. This indicates a continuous decrease in the HHI, which suggests that the USS of China’s cities is trending toward polycentric. Notably, the eastern coastal region was consistently the lightest in color, indicating the most significant polycentricity. This was likely because the eastern coastal region was the first part of China to implement the open-door policy, attracting substantial foreign capital and enterprises. The policy has spurred the growth of coastal cities, leading to the emergence of multiple centers. Similarly, Hebei Province, Shaanxi Province, Chongqing, Beijing, and Tianjin also exhibited relatively high levels of polycentricity. In contrast, regions like Gansu Province, Hubei Province, Jiuquan, Lhasa, and some northeastern cities displayed the highest degree of monocentricity.
Considering the extensive number of cities, it was not feasible to analyze each city individually. Therefore, cities were categorized into different types to investigate the evolutionary trajectory of USS across these different classifications. The segmentation process was based on authoritative sources. According to the National Bureau of Statistics of China, the country can be delineated into four main regions: East, Central, West, and Northeast, providing a geographical framework for analysis “https://www.stats.gov.cn (accessed on 20 January 2025)”. The “2022 City Commercial Attractiveness Ranking” offers a hierarchical categorization of cities into first-tier, new first-tier, second-tier, third-tier, fourth-tier, and fifth-tier cities, reflecting varying levels of economic dynamism and urban development “https://www.yicai.com (accessed on 20 January 2025)”. Urban size classifications were obtained from the Notice of the State Council on Adjusting the Standards for Categorizing City Sizes “https://www.gov.cn (accessed on 20 January 2025)”, which categorizes cities into megacities, supercities, large cities, medium cities, and small cities. Finally, cities were grouped by administrative level into municipalities, sub-provincial cities, provincial capitals, and prefecture-level cities. Figure 2 shows the temporal evolution of USS determined for different types of cities.
Between 2007 and 2022, the HHI, across China and within its eastern, central, western, and northeast regions, exhibited a downward trend (Figure 2a). Nationally, the index decreased from 0.3355 to 0.2253. Specifically, the index for the eastern region decreased from 0.2642 to 0.2154. Taking Beijing as an example, its index dropped from 0.1583 to 0.1196, likely due to the sustainable development of Beijing’s economy and the optimization of its industrial structure. Notably, the formation of multiple specialized centers across different city regions in diversified sectors such as finance, technology, and manufacturing has facilitated the development of a more polycentric USS. In the central region, the index fell from 0.3544 to 0.2222. In Wuhan, for instance, the index dropped from 0.3052 to 0.1654, possibly due to the rapid expansion of Wuhan’s rail transit network, the construction of a shipping center in the middle reaches of the Yangtze River, and the emergence of science and technology parks like Optical Valley. These developments have gradually distributed economic activities and populations across multiple functional areas, promoting polycentric growth. In the western region, the index decreased from 0.3527 to 0.2302. Taking Xi’an as an example, its index dropped from 0.3057 to 0.2079, likely due to Xi’an’s active promotion of new district constructions and the coordinated development of surrounding areas. By leveraging its historical, cultural, and tourism resources, the city has diversified its industrial structure and functional layout. In Northeast China, the index dropped from 0.4257 to 0.2449. For instance, in Shenyang, the index decreased from 0.3210 to 0.1902, likely due to the gradual shift in traditional heavy industries to high-tech industrial parks and modern service industry clusters. This transition has led to the emergence of new economic growth points and functional centers, such as the Hunnan New Area and Tiexi District. This fluctuating decline signifies a pronounced shift toward a polycentric USS across China, with the East leading this trend.
A distinct trend emerged across Chinese cities of various economic levels between 2007 and 2022 (Figure 2b), as depicted by the HHI for first-tier through to fifth-tier cities, all of which displayed a fluctuating downward trajectory. Specifically, the index for first-tier cities decreased from 0.1704 to 0.1489. Taking Shanghai as an example, its index fell from 0.1951 to 0.1755, possibly due to Shanghai’s accelerated development as a “global city”. With the spillover of industries such as manufacturing, finance, and technological innovation, some functions of the traditional central urban area have gradually expanded outward, forming multiple centers. For new first-tier cities, the index dropped from 0.3329 to 0.2430. In the case of Chengdu, its index decreased from 0.1346 to 0.0866, likely due to Chengdu’s rapid economic growth as the core growth pole of Southwest China, attracting a large number of enterprises and talents. As industries continuously upgrade and expand, multiple industrial clusters and functional areas have emerged within the city, including the high-tech zone and Tianfu New District. The index for second-tier cities decreased from 0.2788 to 0.2159. Taking Xiamen as an example, its index dropped from 0.2355 to 0.2056, possibly because Xiamen relies on its marine economy and the construction of free trade zones, which have facilitated the formation of multiple functional areas. The index for third-tier cities decreased from 0.2747 to 0.1849. For example, in Yichang, the index dropped from 0.5160 to 0.2092, likely due to the city’s active promotion of industries such as biomedicine, clean energy, and high-end manufacturing. The establishment of emerging industrial parks has fostered the decentralization of urban functions from the central area to multiple regions. For fourth-tier cities, the index fell from 0.3437 to 0.2119. Taking Zhangjiakou as an example, its index dropped from 0.2147 to 0.0949, possibly due to the city’s recent economic transformation and industrial upgrading, particularly through the preparations and subsequent developments related to the Winter Olympics. These efforts have stimulated the growth of green industries, tourism, and technological innovation, thus expanding the city’s functions to surrounding areas. Finally, the index for fifth-tier cities dropped from 0.4028 to 0.2730. Taking Pu’er as an example, its index decreased from 0.1986 to 0.1228, possibly because the city’s mountainous terrain limits the expansion of the central urban area, compelling it to distribute development across surrounding urban areas and counties. This persistent decline across cities with varying levels of economic development indicated a nationwide evolution toward a polycentric USS.
The HHI for cities across all size categories, i.e., megacities, supercities, large cities, medium cities, and small cities, uniformly trended downward from 2007 to 2022 (Figure 2c). Specifically, the index for megacities decreased from 0.1599 to 0.1213. Taking Tianjin as an example, its index dropped from 0.1429 to 0.1130, likely due to the city’s promotion of coordinated development within the Beijing–Tianjin–Hebei region, which led to the transfer of some administrative, educational, and medical resources to surrounding areas. Additionally, the rapid development of regions such as the Binhai New Area has reduced the dominance of the city center. The index for supercities decreased from 0.3652 to 0.2613. In the case of Harbin, the index fell from 0.2661 to 0.1275, which can be attributed to the city’s efforts to diversify and decentralize its industries through the development of sectors such as tourism, agriculture, and science and technology, thereby reducing the influence of traditional heavy industry. For large cities, the index dropped from 0.3189 to 0.2109. Taking Luoyang as an example, the index decreased from 0.3131 to 0.1792, possibly due to the city’s vigorous development of sub-central urban areas, such as the construction of the Yibin District and high-tech zones. These developments have facilitated the spillover of industries and populations, diminishing the dominance of the central urban area. In medium cities, the index dropped from 0.3401 to 0.2252. For instance, in Jingdezhen, the index fell from 0.7632 to 0.5272, likely due to the city’s strong promotion of its ceramic culture and creative industries while also fostering the diversified development of aviation, tourism, and other sectors, leading to a further dispersion of the urban center. In small cities, the index decreased from 0.3565 to 0.2430. Taking Lincang as an example, its index dropped from 0.1478 to 0.1318, possibly as a result of the city’s active promotion of rural revitalization strategies, with a focus on the development of characteristic agriculture and the tea industry in surrounding counties. This shift has weakened the dominant position of the urban core. This fluctuating decline across varying city sizes underlined a nationwide movement toward a polycentric USS.
A notable decline in the HHI was observed across all administrative categories between 2007 and 2022 (Figure 2d). Specifically, the index for municipalities directly under the central government decreased from 0.1642 to 0.1155. Taking Chongqing as an example, its index fell from 0.1606 to 0.0539, possibly due to the city’s vigorous promotion of high-tech industries, including automotive, electronic information, and others. The development of regions such as Liangjiang New Area and Western Science City has contributed to a more dispersed economic center of gravity. The index for sub-provincial cities declined from 0.2734 to 0.1784. In the case of Shenzhen, the index decreased slightly from 0.1465 to 0.1438, which may be attributed to the city’s long-standing commitment to a polycentric urban planning model, fostering differentiated development across various centers and strengthening support for multiple urban nodes. The index for provincial capital cities dropped from 0.4273 to 0.2578. Taking Hefei as an example, its index decreased from 0.4272 to 0.2041, likely due to the city’s active promotion of innovative industrial clusters, such as the development of integrated circuits, new energy vehicles, and artificial intelligence, resulting in a more balanced industrial layout. The index for prefecture-level cities fell from 0.3357 to 0.2276. For instance, the index declined significantly in Suzhou, possibly because Suzhou, as a key manufacturing and technological innovation center in the Yangtze River Delta, has strengthened industrial linkages with surrounding districts and counties such as Kunshan, Taicang, and Wujiang. This has led to a decline in the relative dominance of the central city and a more pronounced polycentric USS. This pattern revealed a trend where provincial capitals exhibited the highest HHI, followed by prefecture-level cities, sub-provincial cities, and, finally, municipalities, which had the most pronounced shift toward a polycentric USS.
This analysis highlighted a significant transition across China’s cities toward polycentric development from 2007 to 2022, marking a departure from more centralized urban forms. This transition was likely driven by factors including sustained economic growth, reduced transportation and communication costs, advances in information technology, and tighter socio-economic interlinkages between urban areas. These dynamics facilitated the emergence of effective agglomeration effects and a robust public service infrastructure, encouraging socio-economic activities to spread across multiple urban centers.

3.2. Factors Influencing USS in China

3.2.1. The Theoretical Framework of Factors Influencing USS

USS is a dynamic and complex system shaped by multiple factors throughout its formation and development. From a systematic perspective, this study identified four key factors—infrastructure, economy, society, and government—that influence USS by promoting the agglomeration and diffusion of elements such as population, industry, goods, services, information, technology, and finance. In addition to the influences of these factors, the era of information and digitization has fostered greater interconnectivity among cities [42]. This increased connection enhances the spatial spillover effect between cities, further impacting USS. Figure 3 illustrates a framework outlining the factors that influence USS.
Infrastructure is an important indicator of investment in urban hardware facilities because it serves as a prerequisite for economic development and is a key driver of changes in USS. The level of infrastructure construction and its convenience directly affects the quality of life for residents while also reflecting the level of development in regional welfare [43]. Infrastructure influences USS by affecting various micro-socioeconomic behaviors. According to Haggett’s theory of spatial interaction, cities are not isolated entities; they continuously exchange elements and complement each other’s functions through transportation and communication linkages [44]. Every city is inevitably linked to its surrounding cities and hinterland. Improvement of transportation networks and the rapid advances in information and communication technology have reduced the costs of human and material flow, transportation, communication, exchanges, knowledge spillover, and information interaction. This has strengthened the links between various urban centers and between cities, influencing the agglomeration of elements and economic activities while enhancing urban transportation accessibility and the efficiency of element flows. Improvements in infrastructure effectively shorten spatial and temporal distances within and between cities, enhance regional accessibility, and diminish the impact of traditional physical factors such as space and distance on USS.
Economic factors are intrinsic to the development of USS, thus driving urban expansion. Economic growth attracts population and resource agglomeration, creating positive externalities and enhancing industrial efficiency. However, according to Friedmann’s spatial agglomeration-diffusion theory, this concentration of economic activities and production factors also leads to increasing costs [45]. When economic growth reaches a certain threshold, negative effects such as higher transportation and time costs due to traffic congestion, along with rising land prices, rents, and air pollution levels, begin to emerge. These cost increases can lead to uneconomical agglomeration, triggering congestion effects and prompting the relocation of populations and resources. Thus, the impact of economic growth on USS may follow an inverted U-shaped curve. Additionally, the upgrading of industrial structure promotes the redistribution of urban land resources and changes in land use, energy consumption patterns, and internal city functions.
Social factors are key enablers of USS development, with social services forming the core of urban livability. The degree of perfection of social factors represents the city’s attractiveness to other regions, particularly in sectors such as basic education, healthcare, and consumer services [46]. China’s extensive territory features a heterogeneous spatial distribution of social factors across the national space, such as shopping, healthcare, education, and employment. Differences in the availability of these factors encourage people to gather in areas with favorable development conditions, fostering the formation of scale effects in the industry, which in turn impacts USS. The improvement of education, culture, and other knowledge-based services can promote the comprehensive quality of workers, driving innovation and fostering progress in urban production, management, innovation, and systems. This, in turn, promotes the strong growth of production efficiency and economic output [47]. Additionally, the urban consumer service level positively contributes to the formation of the demonstration effect, whereby effective demonstration can constructively modify people’s behaviors. The emergence of new exemplary models thus fosters a virtuous cycle of collective action. This further accelerates the efficiency of consumer goods distribution and consumer information communication, enabling more targeted consumption orientation and generating consumption spillover effects.
The government influences the USS through its preferential policies. These policies impact the USS by determining the distribution of economic and social resources across regions [48,49]. Specifically, when the government favors the development of core areas, it channels labor, capital, and other production factors into the core city through various subsidies. This concentration of resources solidifies the core area’s dominant position, enhances its attractiveness and competitiveness, and leads to a more monocentric USS. In contrast, if the government promotes balanced regional development, it emphasizes equitable growth and resource distribution among regions. This strategy fosters polycentric development by decentralizing financial expenditures and encouraging inter-regional interaction and collaboration. Given the current governmental bias toward the development of core cities, it is anticipated that increased government intervention will further reinforce the monocentric trend.
The USS is affected by spatial spillover effects, such as material, knowledge, capital, technology, talent, and information spillover, from neighboring cities in terms of the first law of geography [50]. In the traditional development model, the limitations of geographic space and distance result in the development of cities relying only on locally provided factors of production, and there is a lack of knowledge exchange and spillover between cities. With the ongoing development in infrastructure, the gradual improvement in economic standards, and the continuous progress of society, the geographical boundaries between cities are becoming increasingly blurred [51]. Neighboring cities and cities across a broader geographic area are overcoming distance limitations and information barriers to facilitate the exchange of resources and information. This has provided these cities with new momentum for industrial renewal and cross-stage development while also improving the balance of their growth momentum.

3.2.2. Selection of Variables

The factors influencing USS were examined from four dimensions: infrastructure, economy, society, and government intervention. In this study, urban highway mileage (x1) and postal service volume (x2) were selected as infrastructure indicators [52,53]. Urban highway mileage reflects the development level of transportation infrastructure, while postal service volume indicates the efficiency of postal infrastructure. Both are crucial components of modern social infrastructure that enhance its overall effectiveness. The index of industrial structure upgrading (x3) and per capita GDP (x4) were chosen as economic factors [54,55]. The index of industrial structure upgrading indicates the extent to which the industrial structure has been upgraded and transformed, while per capita GDP reflects the level of economic growth. The indicators for social factors were the per capita retail sales of consumer goods (x5) and the number of university students (x6) [56,57]. Per capita retail sales of consumer goods characterize the residential consumption level, while the number of university students represents human capital, both of which are fundamental to societal stability and development. Government intervention (x7) was indicated by the ratio of local general public budget expenditures to GDP, as described by Sun et al. [55]. This metric is a critical indicator of the extent of direct government involvement in economic activities and resource allocation. The variance inflation factor (VIF) was employed to assess multicollinearity among these factors (Table 2). With all VIF values below 5, the analysis confirmed the absence of collinearity issues among the variables.

3.2.3. Selection of Spatial Econometric Models

The analysis of factors influencing USS was conducted in several steps, each crucial for selecting the appropriate regression model (results are provided in the Supplementary Materials). Ultimately, a dual-fixed SDM was chosen for the regression analysis.

3.2.4. Regression Results

Table 3 presents the regression results for the factors that influence the USS.
In terms of infrastructure, the estimated coefficient for highway mileage was positive and statistically significant at the 1% level, indicating that the development of transportation infrastructure promotes a monocentric USS. This effect is likely due to highway expansion reducing agglomeration diseconomies and transportation costs, which in turn facilitates the concentration of population and economic activities within central urban areas. Taking Shanghai as an example, its city center, as the economic hub of the metropolis, attracts numerous financial institutions and multinational corporations. Additionally, the well-developed transportation network facilitates rapid access to the city center from surrounding areas, reinforcing its centralization. Similarly, the extensive expansion of the Los Angeles freeway system in the mid-20th century significantly enhanced traffic mobility within and around the city’s core. The construction of expressways enabled more efficient commuting from suburban areas to the downtown area, further accelerating the development of the city center as the focal point of economic and commercial activities. In contrast, the coefficient for postal service volume was significantly negative, suggesting that an improvement in postal infrastructure would foster a shift toward a polycentric USS. This trend may be attributed to the expansive development of express delivery services and significant enhancements in network coverage, which have diluted the previously dominant centralization of central cities. Take Jinhua as an example. As a key commercial and logistics hub in Zhejiang Province, Jinhua has benefitted from the rapid development of express delivery services, e-commerce, and modern logistics infrastructure. A significant volume of goods no longer needs to be traded and distributed through the traditional core of the city; instead, they are directly supplied from production sites or widely distributed warehouses. This shift has facilitated the decentralization of urban economic activities from the traditional core area to multiple functional zones, contributing to the development of a more polycentric USS.
Regarding economic factors, both the index of industrial structure upgrading and per capita GDP had positive coefficients across all models and passed the significance test. This result confirmed that economic growth fosters a monocentric USS. Notably, the index of industrial structure upgrading exerted a more pronounced effect than per capita GDP. An enhancement in the advancement of the city’s industrial structure distinctly favors monocentric urban development, implying that a more advanced industrial structure correlates with a greater tendency toward monocentric structures. Taking Shenzhen as an example, the city’s industrial structure has evolved from traditional manufacturing to a focus on high-end technology, finance, and modern services. Leveraging high-tech industrial clusters and financial centers, Shenzhen has developed a core functional area centered on advanced industries. These regions exhibit significant agglomeration effects in terms of economy, technology, talent, and infrastructure, driving the high concentration of resources. This has facilitated the evolution of the USS towards a more monocentric trend. Similarly, increases in per capita GDP foster a move toward monocentric structures. The likely reason for this is that, within a certain range, as economic growth increases, both population and economic activities tend to converge toward urban centers, which in turn drives the USS toward a monocentric pattern. Taking Guangzhou as an example, as the economic center of South China, the city’s central urban area initially served as the focal point of economic development. The sustained growth in per capita GDP contributed to the rapid rise in the high-end service sector, which gradually transformed the area into the core of the city’s economic activities. This transformation has attracted a significant influx of advanced industries and highly skilled talent.
In terms of social factors, the estimated coefficient for per capita retail sales of consumer goods was positive and significant at the 1% level, indicating that the rising level of residential consumption will promote the development of cities towards a monocentric USS. This trend suggests that increased consumer participation in the market correlates with robust local productivity and employment opportunities, as well as robust local market demand. These factors collectively attract significant population and economic activity to the city center, reinforcing a monocentric USS. Taking Hangzhou as an example, the improvement in consumption levels has effectively stimulated investment and the development of local enterprises. Under the leadership of major technology companies, Hangzhou’s core area has gradually evolved into a hub for business, finance, and technology. This area boasts a wide range of commercial facilities and retail establishments while also attracting an increasing number of high-tech enterprises and service industries. These developments have fostered the growth of employment opportunities, attracting a large influx of people to the area and driving the development of both the central area and a more monocentric USS. Additionally, the impact of the number of university students on the USS was statistically insignificant.
The coefficient for the effect of government intervention on USS was positive and statistically significant at the 5% level, suggesting that government intervention tends to promote a monocentric USS. This indicates that China’s current government preferences and policies generally promote the development of urban cores. This conclusion agrees with Zhou et al., who reported that an increase in the scale of government expenditure hinders the evolution of USS toward polycentricity [58]. Taking Beijing as an example, here the government has promoted the rapid development of urban core areas through a series of policies. For example, the “Zhongguancun National Independent Innovation Demonstration Zone” policy implemented in Beijing actively supports the agglomeration of high-tech and innovative enterprises and promotes Zhongguancun to become an important leading region for scientific and technological innovation. In addition, the Beijing government has implemented the “talent introduction” policy, and the convergence of a large number of high-end talents has promoted the development of the downtown area.
The regression results on the spatial spillover effect indicate that the spillover effects of highway mileage, index of industrial structure upgrading, and per capita GDP on the USS of neighboring cities were statistically significant, with all estimated coefficients being negative. This indicates that improvements in these indicators in a city will push the USS of surrounding cities toward polycentric development. There are several possible causes for this. First, the improvement of a city’s transportation infrastructure can promote the flow of production factors, improve production efficiency, and enhance economic and social ties with neighboring cities, thus pushing the USS of neighboring cities toward polycentric development. Second, as a city optimizes and adjusts its industrial structure, it will transfer obsolete industries to other cities. Due to the first law of geography and distance friction, neighboring cities often become key recipients of this industrial transfer, resulting in a USS that tends toward polycentricity [59]. Finally, economic growth helps to promote interconnection and collaboration with neighboring cities, driving the synergistic development of the surrounding area’s economy, which in turn pushes the USS of surrounding cities toward polycentricity. The spillover effect of government intervention also passed the significance test with a positive estimated coefficient, indicating that an increase in government intervention in the city would push the USS of surrounding cities toward a monocentric pattern. Additionally, the spillover effects of postal service volume, per capita retail sales of consumer goods, and the number of university students were not statistically significant, indicating that these factors did not have a meaningful impact on the USS of the surrounding cities.
Considering Friedmann’s theory of regional spatial structures, the USS initially evolves toward a monocentric structure and subsequently toward a polycentric structure as the economy grows [45]. To explore the potential nonlinear relationship of per capita GDP with USS, a quadratic term of per capita GDP (denoted as lnx42) was incorporated into the model, and the regression results were presented in Table 4.
The coefficient for the linear term of per capita GDP remained positive, and with the linear term’s coefficient unchanged, the quadratic term’s coefficient turned negative. This suggests a nonlinear, inverted U-shaped relationship between per capita GDP and the HHI. When per capita GDP was below the turning point, indicating that the economy was at a relatively low level, economic activities and populations tended to be concentrated toward the city center. Increases in per capita GDP promoted a monocentric USS. Conversely, when per capita GDP exceeded this turning point, populations and economic activities began to disperse from the city center, prompting a shift toward a polycentric USS.

3.2.5. Robustness Test

The choice of spatial weight matrices significantly influences the estimation results of a model. To analyze the factors influencing USS, this study utilized a spatial adjacency weight matrix (W0). Following the methodologies of Cheng et al. and Sun et al., robustness tests were performed using an economic geographical weighting matrix (W1) and a geographic distance weighting matrix (W2) [60,61]. As shown in Table 5, there were no substantial changes in the coefficients of variables or their robustness levels in the regression results, confirming the robustness of the model.

3.2.6. Endogeneity Test

Acknowledging the potential lag effect of economic growth on the USS and possible bidirectional causality, with each influencing the other, this analysis followed the approach of Sun et al. and incorporated the lagged terms of per capita GDP as core variables to further explore their impact on USS [62]. As shown in Models (2) and (3) in Table 6, the per capita GDP lagged by one (L1) and two periods (L2) both demonstrated a significant positive influence on the USS, and the coefficients for the quadratic terms were negative. This pattern indicates that economic growth initially promoted a monocentric USS, which subsequently transitioned toward a polycentric structure, reinforcing the robustness of these findings.

4. Discussion

It was found that the USS in China predominantly exhibited a polycentric trend. This can be attributed to the increase in urban populations, the extension of urban regions, and the continuous improvement of urban transportation networks, which have tightened the economic and social connections between various urban regions. The diverse demands of industries and services have led to socio-economic development across multiple nodes, further advancing the shift toward a polycentric USS. In comparison with existing studies of urban agglomerations, Lan et al., based on NTL, calculated HHI from monocentric and polycentric perspectives and identified a pronounced polycentric trend across Chinese urban agglomerations [52]. Li and Zhang used NTL in combination with urban economic statistics, and the results indicated that national-level urban agglomerations with robust economic foundations and advanced developmental stages had a significantly higher degree of polycentric structures compared to regional urban agglomerations with weaker economic bases [63]. Accordingly, the findings of this study, which focused on cities, were aligned with those of previous studies examining urban agglomerations, confirming a widespread polycentric trend both in urban agglomerations and prefecture-level cities across China. This study enhanced the scope of USS research at the city level by assessing it within prefecture-level cities.
In previous studies, researchers determined the USS of individual cities [64,65]. For instance, Huang et al. used enterprise registration data from 2010 to explore the spatial distribution of employment in Beijing and concluded that the city’s USS is transitioning toward a polycentric structure [66]. Xie et al. used geographic information system data to create maps visualizing spatial development patterns and conducted a quantitative analysis as part of a spatiotemporal impact assessment [67]. They concluded that Shenzhen is also progressing toward a polycentric USS. Yue et al. analyzed Hangzhou’s expansion direction, urban–rural gradient, and growth types, and discussed the evolution of a polycentric USS [68]. Consequently, the results of their study, which encompassed all cities in China, were consistent with findings from individual city-focused research, indicating a universal trend toward polycentric structures in Chinese cities. By analyzing 292 cities in China, the present study systematically explored the evolutionary trends and spatial characteristics of USS at the national scale. The results enabled a comparative analysis of various cities, yielding highly credible research findings.
The factors influencing USS were examined, and it was discovered that improvements in transportation infrastructure and upgrading industrial structures have contributed to a monocentric trend. Additionally, economic growth initially promoted a trend toward monocentric structures, which subsequently shifted toward polycentric structures. In contrast, Sun et al. used panel data models to explore the evolution of USS in urban agglomerations and noted that enhancements in transportation infrastructure, as indicated by per capita road area, favored monocentric development [62]. Sun et al. examined the issue from a functional connections perspective and found that agglomerations with a substantial tertiary sector were more likely to develop monocentric structures. Moreover, the USS in urban agglomerations shifted from monocentric to polycentric structures as economic development progressed [55]. Accordingly, regarding the factors that influence USS, the findings of this study, focusing on cities as the unit of analysis, were aligned with those related to urban agglomerations, highlighting a prevalent polycentric trend across both urban agglomerations and prefecture-level cities in China. Contrary to Lan et al., who concluded that human capital could encourage the polycentric development of USS, the present study found that the number of university students did not have a significant impact on the USS [52]. This variation may stem from the choice of research units. The representation of human capital by the number of university students may be more fitting at a broader geographic scale, such as provincial or urban agglomeration levels. This study surpassed the existing literature by comprehensively examining factors from infrastructure, economy, society, and government to investigate the drivers of USS development in China. It also accounted for the geographical location, development stage, and unique characteristics of different cities, thereby proposing tailored USS development strategies that suite their specific development features and needs. This approach broadened the scope of research on the drivers of USS at the urban scale.
This study significantly enhanced the existing research on China’s USS, providing both academic and practical insights into the current structures of various city types across the nation and informing development strategies that encourage sustainable urban progress. The study highlighted the pivotal role of spatial development patterns in shaping urban dimensions and trajectories, offering a robust quantitative framework for assessing the real USS in China and its dynamic shifts over time. By systematically quantifying the determinants of USS, the research facilitated the maximization of synergies among various drivers, thereby aiding in the refinement of urban layouts and accelerating high-quality urban development and regional synchronization. Despite these advances, there remains a need for further in-depth studies.
First, this paper primarily focuses on analyzing the urban morphological spatial structure. However, studying USS from a functional perspective also holds significant theoretical and practical value. The theoretical foundation of studying urban functional spatial structure is based on the idea that urban regions are interconnected through various “factor flows”, including trade, population, information, and capital flows. The existing methods for measuring functional USS can be categorized into three types. The first type is the social network analysis method, which examines the interactions and connectivity between different functional areas by constructing a network relationship between them, thereby revealing the spatial structure characteristics of urban functional layouts. The second type is the rank-size rule, which identifies the hierarchical and polycentric nature of urban functional distribution based on the scale of urban functional units and their ranking within the spatial network. For instance, Burger et al. used commuter flow data and the rank-size rule to measure the degree of functional polycentricity in the Netherlands [69]. The third category is the standard model comparison method, with the connection-domain model proposed by Vasanen being a notable example [20]. The core idea of this model is to reveal the actual degree of interaction and spatial structure characteristics among urban centers by comparing and quantifying the similarity between the connection domain (i.e., the actual functional connection range) and the potential domain (i.e., the theoretical connection range derived from the theoretical distance or potential model). A high similarity between the two indicates that the city exhibits a trend toward a polycentric USS. The functional perspective provides an understanding of the interactive relationship between urban space and human activities, identifying the functional attributes of different regions, optimizing land use and resource allocation, and improving the scientific and rational nature of urban planning. This, in turn, helps cities become more resilient and sustainable in the face of population growth, industrial changes, and shifts in social demand. Therefore, future studies should further enhance the comparative analysis of morphological and functional perspectives, explore the internal relationships and interaction mechanisms between them, and expand the scope of research and its application value.
Second, this paper clearly focuses on the impact of human factors on USS, primarily discussing how infrastructure, the economy, society, and government intervention collectively shape urban spatial arrangements. Human factors play a vital role in urban planning and development, directly influencing the aggregation, expansion, and interrelations of various urban areas. However, the role of natural factors—such as terrain, climate, and disaster risks—cannot be overlooked. Natural factors may significantly affect the evolution of USS, impacting aspects such as urban habitability, accessibility, and disaster risk management. A deeper exploration of the role of natural geographical conditions is crucial to understanding the formation and development of cities. In particular, it is essential to examine how natural factors like geographical location, terrain, climate, and resources shape the formation and evolution of USS. These natural conditions not only determine the city’s livability and development potential but also influence inter-regional resource distribution and functional layout, ultimately shaping the city’s spatial pattern and functional zoning. Favorable natural conditions can provide initial competitive advantages, attract populations, and promote urban expansion and development. For example, Xiong et al. employed the fluctuation index and distribution proportion index model, combined with geographic information system (GIS) analysis, to explore the impact of topographic factors on the USS evolution during urbanization [70]. Therefore, future research will focus on effectively integrating natural factors into the existing framework, offering a more comprehensive perspective for analyzing USS. By examining the interaction between natural and human factors, the complex driving mechanisms can be more deeply analyzed, providing more accurate theoretical support and a solid decision-making foundation for urban planning and sustainable development.
Third, potential data biases and calibration issues may arise with NTL data. First, NTL data are derived from satellite sensors such as DMSP-OLS and SNPP-VIIRS, which may have calibration problems. These sensors can show varying sensitivity over time or differences between individual sensors, leading to inconsistencies in the data. Second, NTL data are typically collected over different periods and can be influenced by seasonal changes (such as variations in day and night length or weather conditions) or time-specific factors (such as holidays, festive events, or daily lighting schedules), which may impact the accuracy of long-term trend analysis. Finally, the availability of NTL data can be affected by transient light sources and background noise. For example, auroras may interfere with the sensor’s ability to detect nighttime light in mid-to-high latitudes, resulting in missing data. In reference to the study by Wu et al., the dataset used in this paper consists of corrected DMSP-OLS-like data for China from 2007 to 2022, which integrates DMSP-OLS and SNPP-VIIRS data [37]. The data processing method is as follows: First, DMSP-OLS data are calibrated using a secondary model based on the pseudo-invariant pixel method to address inconsistencies between different satellite data. Second, an exponential smoothing model is applied to predict and fill missing values in the monthly SNPP-VIIRS data. Annual SNPP-VIIRS data are then generated through a synthesis method, and noise is removed. Next, the SNPP-VIIRS data, resampled using the kernel density method, is converted to SDMSP-OLS data via a cross-sensor conversion method. Finally, SDMSP-OLS data (2013–2022) is appended to the calibrated DMSP-OLS data (2007–2022) to integrate the improved time series of DMSP-OLS-like data. These data processing techniques have somewhat mitigated the aforementioned issues and effectively reduced potential errors. However, future research should further refine the methods for addressing bias and calibration problems in NTL data to provide a more accurate foundation for scientific analysis.
Finally, considering China’s extensive and varied landscape, which is marked by distinct historical, natural, and cultural contexts, it will be necessary to diversify studies and consider how these different settings affect USS.

5. Conclusions and Policy Implications

5.1. Conclusions

In this study, we calculated the HHI to characterize the USS using NTL data from 292 cities in China from 2007 to 2022. On this basis, we established a theoretical framework to systematically analyze the influence of infrastructure, economy, society, and government intervention on USS. There were three main findings. First, over the period examined, there was a clear trend toward a polycentric USS, which was observable both nationwide and across various city categories. Second, the analysis of influencing factors revealed that the USS tended to initially be monocentric, which then became polycentric with economic growth. The development of postal infrastructure pushed this toward the evolution of polycentric structures. Additionally, transportation infrastructure, industrial structure, residential consumption level, and government intervention played pivotal roles in shaping the monocentric USS. Human capital had no significant effect on the USS. Finally, the regression results of the spatial spillover effect showed that the development of transportation infrastructure, industrial structure, and economic growth resulted in a tendency for neighboring cities to become polycentric, while heightened government intervention tended to promote a monocentric tendency among neighboring cities.

5.2. Policy Implications

Several policy implications were proposed in response to the trend toward a polycentric USS. First, governments should strategically guide the efficient allocation of resources and production factors between primary and secondary urban centers. This approach would leverage the unique resource endowments and locational advantages of different urban areas to foster positive interactions and enhance functional and cooperative links between urban centers to drive efficient overall urban development. Second, there is a pressing need to enhance urban transportation infrastructure. By integrating and unifying transportation networks across various urban centers, a comprehensive internal transportation network could be established that boosts urban accessibility and supports the seamless interconnectivity of production factors. Finally, it is crucial to refine the governance frameworks among multiple urban centers by clearly delineating responsibilities for urban collaboration and co-governance. This will provide the necessary institutional support for developing a polycentric USS.
Regarding the spatial differentiation characteristics and regional disparities in USS, urban development policies should be tailored to specific city contexts. For cities in the eastern regions, large cities, and those classified as third tier and above, including sub-provincial cities, there should be an emphasis on optimizing the spatial functional layouts of various urban centers to achieve synergistic development among them. Conversely, for cities in central and western regions, northeastern regions, and smaller cities (fourth tier and below), where the economic level and urbanization rates are lower, it is impractical to pursue polycentric development paths in the short term. Instead, these areas should focus on maximizing the benefits of agglomeration by encouraging a USS that is compact and intensively monocentric.
Finally, when considering the factors influencing USS, cities suitable for developing polycentric structures should focus on improving economic growth and strengthening the connections between various urban centers. This will enhance the interconnectivity of services such as postal operations and other production factors. For cities better suited to monocentric development, efforts should be directed at guiding corporate investments and fostering population and production factor aggregation in city centers. This strategy would promote the circulation of consumer goods, bolster road infrastructure, and reduce transportation and communication costs between cities. Additionally, actively diversifying the city’s industrial base and promoting the growth of the tertiary sector will further encourage urban agglomeration.

Supplementary Materials

The following supporting information can be downloaded at: www.mdpi.com/article/10.3390/su17052013/s1, File S1: the basis for determining the use of the spatial Durbin model.

Author Contributions

Conceptualization, K.L.; methodology, K.L.; software, Y.W.; validation, Y.W.; formal analysis, Y.W.; investigation, Y.W.; resources, K.L.; data curation, Y.W.; writing—original draft, Y.W.; writing—review and editing, K.L.; visualization, K.L.; supervision, K.L.; project administration, K.L.; funding acquisition, K.L. All authors have read and agreed to the published version of the manuscript.

Funding

This research was funded by the National Natural Science Foundation of China, grant number 72373084; Taishan Scholar Foundation of Shandong Province, grant number tsqn202408139; Shandong Provincial Education Department, China, grant number 2022RW064.

Institutional Review Board Statement

Not applicable.

Informed Consent Statement

Not applicable.

Data Availability Statement

Data will be made available on request.

Conflicts of Interest

The authors declare no conflicts of interest.

Abbreviations

The following abbreviations are used in this manuscript:
USSUrban spatial structure
NTLNighttime lights
HHIHerfindahl–Hirschman Index
SDMSpatial Durbin model
VIFVariance inflation factor

References

  1. Li, Y.C.; Liu, X.J. How did urban polycentricity and dispersion affect economic productivity? A case study of 306 Chinese cities. Landsc. Urban Plan. 2018, 173, 51–59. [Google Scholar] [CrossRef]
  2. Liu, Y.J.; Meng, Q.Y.; Zhang, J.C.; Zhang, L.L.; Allam, M.; Hu, X.L.; Zhan, C.X. Evaluation of urban spatial structure from the perspective of socioeconomic benefits based on 3D urban landscape measurements: A case study of Beijing, China. Remote Sens. 2022, 14, 5511. [Google Scholar] [CrossRef]
  3. Zheng, S.; Huang, Y.K.; Fu, Y.Y. The effect of polycentric urban spatial structure on PM2.5: An empirical study of China. Sustain. Cities Soc. 2023, 98, 104806. [Google Scholar] [CrossRef]
  4. Chen, Z.Q.; Li, Q.Y.; Su, H. Do the urban polycentricity and dispersion affect multisectoral carbon dioxide emissions? A case study of 95 cities in southeast China based on nighttime light data. Int. J. Digit. Earth 2023, 16, 4867–4884. [Google Scholar] [CrossRef]
  5. Han, S.S.; Sun, B.D.; Zhang, T.L. Mono- and polycentric urban spatial structure and PM2.5 concentrations: Regarding the dependence on population density. Habitat Int. 2020, 104, 102257. [Google Scholar] [CrossRef]
  6. Schmidt, S.; Krehl, A.; Fina, S.; Siedentop, S. Does the monocentric model work in a polycentric urban system? An examination of German metropolitan regions. Urban Stud. 2021, 58, 1674–1690. [Google Scholar] [CrossRef]
  7. Zhang, R.R.; Li, M.; Zhang, X.; Guo, Y.Y.; Li, Y.H.; Gao, Q.; Liu, S. Identification of the Spatial Structure of Urban Polycentres Based on the Dual Perspective of Population Distribution and Population Mobility. Land 2024, 13, 1159. [Google Scholar] [CrossRef]
  8. Yue, W.Z.; Wang, T.Y.; Liu, Y.; Zhang, Q.; Ye, X.Y. Mismatch of morphological and functional polycentricity in Chinese cities: An evidence from land development and functional linkage. Land Use Pol. 2019, 88, 104176. [Google Scholar] [CrossRef]
  9. Yu, H.S.; Yang, J.; Li, T.; Jin, Y.; Sun, D.Q. Morphological and functional polycentric structure assessment of megacity: An integrated approach with spatial distribution and interaction. Sustain. Cities Soc. 2022, 80, 103800. [Google Scholar] [CrossRef]
  10. Hong, S.F.; Hui, E.C.; Lin, Y.Y. Relationship between urban spatial structure and carbon emissions: A literature review. Ecol. Indic. 2022, 144, 109456. [Google Scholar] [CrossRef]
  11. Li, Y.C. Towards concentration and decentralization: The evolution of urban spatial structure of Chinese cities, 2001–2016. Comput. Environ. Urban Syst. 2020, 80, 101425. [Google Scholar] [CrossRef]
  12. Ingram, G.K.; Carroll, A. The spatial structure of Latin American cities. J. Urban Econ. 1981, 9, 257–273. [Google Scholar] [CrossRef] [PubMed]
  13. Li, W.; Sun, B.D.; Zhao, J.C.; Zhang, T.L. Economic performance of spatial structure in Chinese prefecture regions: Evidence from night-time satellite imagery. Habitat Int. 2018, 76, 29–39. [Google Scholar] [CrossRef]
  14. Liu, K.; Xue, Y.T.; Chen, Z.F.; Miao, Y.; Shi, J.L. Economic spatial structure of China’s urban agglomerations: Regional differences, distribution dynamics, and convergence. Sustain. Cities Soc. 2022, 87, 104253. [Google Scholar] [CrossRef]
  15. Wang, Y.N.; Niu, Y.J.; Li, M.; Yu, Q.Y.; Chen, W. Spatial structure and carbon emission of urban agglomerations: Spatiotemporal characteristics and driving forces. Sustain. Cities Soc. 2022, 78, 103600. [Google Scholar] [CrossRef]
  16. Liu, X.J.; Wang, M.S. How polycentric is urban China and why? A case study of 318 cities. Landsc. Urban Plan. 2016, 151, 10–20. [Google Scholar] [CrossRef]
  17. Riguelle, F.; Thomas, I.; Verhetsel, A. Measuring urban polycentrism: A European case study and its implications. J. Econ. Geogr. 2007, 7, 193–215. [Google Scholar] [CrossRef]
  18. Sarkar, S.; Wu, H.; Levinson, D.M. Measuring polycentricity via network flows, spatial interaction and percolation. Urban Stud. 2020, 57, 2402–2422. [Google Scholar] [CrossRef]
  19. Green, N. Functional polycentricity: A formal definition in terms of social network analysis. Urban Stud. 2007, 44, 2077–2103. [Google Scholar] [CrossRef]
  20. Vasanen, A. Functional polycentricity: Examining metropolitan spatial structure through the connectivity of urban sub-centres. Urban Stud. 2012, 49, 3627–3644. [Google Scholar] [CrossRef]
  21. Chen, T.T.; Hui, E.C.; Wu, J.M.; Lang, W.; Li, X. Identifying urban spatial structure and urban vibrancy in highly dense cities using georeferenced social media data. Habitat Int. 2019, 89, 102005. [Google Scholar] [CrossRef]
  22. Yan, L.X.; Wang, Y.S.; Wang, D.; Zhang, S.W.; Xiao, Y. A new approach for identifying urban employment centers using mobile phone data: A case study of Shanghai. Int. J. Geogr. Inf. Sci. 2023, 37, 1180–1207. [Google Scholar] [CrossRef]
  23. Wang, S.D.; Liu, Y.B.; Zhi, W.; Wen, X.H.; Zhou, W.H. Discovering urban functional polycentricity: A traffic flow-embedded and topic modeling-based methodology framework. Sustainability 2020, 12, 1897. [Google Scholar] [CrossRef]
  24. Wang, T.Y.; Yue, W.Z.; Ye, X.Y.; Liu, Y.; Lu, D.B. Re-evaluating polycentric urban structure: A functional linkage perspective. Cities 2020, 101, 102672. [Google Scholar] [CrossRef]
  25. Zhang, Y.R.; Marshall, S.; Cao, M.Q.; Manley, E.; Chen, H.F. Discovering the evolution of urban structure using smart card data: The case of London. Cities 2021, 112, 103157. [Google Scholar] [CrossRef]
  26. Burger, M.J.; de Goei, B.; Van der Laan, L.; Huisman, F.J. Heterogeneous development of metropolitan spatial structure: Evidence from commuting patterns in English and Welsh city-regions, 1981–2001. Cities 2011, 28, 160–170. [Google Scholar] [CrossRef]
  27. Le, X.H.; Chen, J.X.; Yang, J.W. Impact of rail transit on urban spatial structure in Shenzhen: Analysis based on land parcel price and FAR gradients. Geogr. Res. 2016, 35, 2091–2104. [Google Scholar]
  28. Song, J.H.; Abuduwayiti, A.; Gou, Z.H. The role of subway network in urban spatial structure optimization-Wuhan city as an example. Tunn. Undergr. Space Technol. 2023, 131, 104842. [Google Scholar] [CrossRef]
  29. Lv, Y.Q.; Lan, Z.M.; Kan, C.C.; Zheng, X.Q. Polycentric urban development and its determinants in China: A geospatial big data perspective. Geogr. Anal. 2021, 53, 520–542. [Google Scholar] [CrossRef]
  30. Zhang, J.; Zhang, R.N.; Zhang, X.; Yuan, X.D. Polycentric Spatial Structure Evolution and Influencing Factors of the Kunming-Yuxi Urban Agglomeration: Based on Multisource Big Data Fusion. Land 2023, 12, 1340. [Google Scholar] [CrossRef]
  31. Zhong, C.; Schläpfer, M.; Müller Arisona, S.; Batty, M.; Ratti, C.; Schmitt, G. Revealing centrality in the spatial structure of cities from human activity patterns. Urban Stud. 2017, 54, 437–455. [Google Scholar] [CrossRef]
  32. Shi, K.F.; Wu, Y.Z.; Liu, S.R.; Chen, Z.Q.; Huang, C.; Cui, Y.Z. Mapping and evaluating global urban entities (2000–2020): A novel perspective to delineate urban entities based on consistent nighttime light data. GISci. Remote Sens. 2023, 60, 2161199. [Google Scholar] [CrossRef]
  33. Li, X.M.; Song, Y.S.; Liu, H.; Hou, X.Y. Extraction of urban built-up areas using nighttime light (NTL) and multi-source data: A case study in Dalian City, China. Land 2023, 12, 495. [Google Scholar] [CrossRef]
  34. Wu, B.; Yu, B.L.; Yao, S.J.; Wu, Q.S.; Chen, Z.Q.; Wu, J.P. A surface network based method for studying urban hierarchies by night time light remote sensing data. Int. J. Geogr. Inf. Sci. 2019, 33, 1377–1398. [Google Scholar] [CrossRef]
  35. Wu, Y.Z.; Li, C.L.; Shi, K.F.; Liu, S.R.; Chang, Z.J. Exploring the effect of urban sprawl on carbon dioxide emissions: An urban sprawl model analysis from remotely sensed nighttime light data. Environ. Impact Assess. Rev. 2022, 93, 106731. [Google Scholar] [CrossRef]
  36. Gao, B.; Huang, Q.X.; He, C.Y.; Sun, Z.X.; Zhang, D. How does sprawl differ across cities in China? A multi-scale investigation using nighttime light and census data. Landsc. Urban Plan. 2016, 148, 89–98. [Google Scholar] [CrossRef]
  37. Wu, Y.Z.; Shi, K.F.; Chen, Z.J.; Liu, S.R.; Chang, Z.J. Developing improved time-series DMSP-OLS-like data (1992–2019) in China by integrating DMSP-OLS and SNPP-VIIRS. IEEE Trans. Geosci. Remote Sens. 2021, 60, 4407714. [Google Scholar] [CrossRef]
  38. Haughton, D.M.; Mukerjee, S. The economic measurement and determinants of diversity. Soc. Indic. Res. 1995, 36, 201–225. [Google Scholar] [CrossRef]
  39. Peleckis, K. Determining the level of market concentration in the construction sector—Case of application of the HHI index. Sustainability 2022, 14, 779. [Google Scholar] [CrossRef]
  40. Zheng, J.F.; Chen, Q.H. Monocentricity or polycentricity: On urban internal spatial structure of Chinese cities. China Econ. Stud. 2019, 2, 93–105. [Google Scholar]
  41. Liu, K.; Wu, Y.; Tao, Y.M.; Wang, C.X. The influence of ecological civilization construction to carbon emission intensity in China’s provinces. China Popul. Resour. Environ. 2019, 29, 50–56. [Google Scholar]
  42. Li, C.M.; Wen, M.Y.; Jiang, S.X.; Wang, H.X. Assessing the effect of urban digital infrastructure on green innovation: Mechanism identification and spatial-temporal characteristics. Hum. Soc. Sci. Commun. 2024, 11, 320. [Google Scholar] [CrossRef]
  43. Duranton, G.; Turner, M.A. Urban growth and transportation. Rev. Econ. Stud. 2012, 79, 1407–1440. [Google Scholar] [CrossRef]
  44. Haggett, P. Locational Analysis in Human Geography; Arnold: London, UK, 1965; pp. 117–130. [Google Scholar]
  45. Friedmann, J. Regional Development Policy: A Case Study of Venezuela; MIT Press: Cambridge, MA, USA, 1966; pp. 5–37. [Google Scholar]
  46. Hu, W.Y.; Wang, R. Which Chinese cities are more inclusive and why? Cities 2019, 86, 51–61. [Google Scholar] [CrossRef]
  47. Marchesani, F.; Masciarelli, F.; Doan, H.Q. Innovation in cities a driving force for knowledge flows: Exploring the relationship between high-tech firms, student mobility, and the role of youth entrepreneurship. Cities 2022, 130, 103852. [Google Scholar] [CrossRef]
  48. Zhang, F.Z.; Chung, C.K.L.; Lu, T.T.; Wu, F.L. The role of the local government in China’s urban sustainability transition: A case study of Wuxi’s solar development. Cities 2021, 117, 103294. [Google Scholar] [CrossRef]
  49. He, X.; Zhang, R.R.; Yuan, X.D.; Cao, Y.W.; Zhou, C.S. The role of planning policy in the evolution of the spatial structure of the Guangzhou metropolitan area in China. Cities 2023, 137, 104284. [Google Scholar] [CrossRef]
  50. Tobler, W.R. A Computer Movie Simulating Urban Growth in the Detroit Region. Econ. Geogr. 1970, 46, 234–240. [Google Scholar] [CrossRef]
  51. Chen, L.; Han, H.Y. Evolution and Applicability of Central Place Theory in the Context of Information and Communications Technology. Urban Plan. Int. 2023, 1–18. [Google Scholar] [CrossRef]
  52. Lan, F.; Da, H.L.; Wen, H.Z.; Wang, Y. Spatial structure evolution of urban agglomerations and its driving factors in mainland China: From the monocentric to the polycentric dimension. Sustainability 2019, 11, 610. [Google Scholar] [CrossRef]
  53. Liu, X.Y.; Wen, Y.H. Analysis on the Measurement and Determinants of China’s Provincial Polycentricity Development. Zhejiang Acad. J. 2020, 100–110. Available online: https://www.ncpssd.cn/Literature/articleinfo?id=7100939440&type=journalArticle&datatype=journalArticle&typename=%E4%B8%AD%E6%96%87%E6%9C%9F%E5%88%8A%E6%96%87%E7%AB%A0&synUpdateType=undefined&nav=0&barcodenum=&pageUrl=https%253A%252F%252Fwww.ncpssd.cn%252 (accessed on 1 February 2025).
  54. Gan, C.H.; Zheng, R.G.; Yu, D.F. An Empirical Study on the Effects of Industrial Structure on Economic Growth and Fluctuations in China. Econ. Res. J. 2011, 46, 4–16+31. [Google Scholar]
  55. Sun, B.D.; Wang, T.; Liu, P.F. The influencing factors of spatial structure evolution of city clusters in China: Based on the functional linkage of railway passenger transport. Hum. Geogr. 2019, 34, 78–84. [Google Scholar]
  56. Sun, J.W.; Zhou, X.L. Spatial Structure and Influencing Factors of the Yangtze River Delta Urban Agglomeration from a Multidimensional Perspective: Based on NPP-VIIRS Nighttime Lighting Data and Gaode’s Population Migration Data. Econ. Geogr. 2023, 43, 78–88. [Google Scholar]
  57. Wang, Z.B.; Jiang, Z.Y.; Zheng, D.; Wang, L.Y. Population Spatial Structure Evolution Pattern and Optimization Path in Beijing-Tianjin-Hebei Urban Agglomeration. Northwest Popul. J. 2016, 37, 31–39. [Google Scholar]
  58. Zhou, H.M.; Liu, X.Z. Evolution Characteristics and Driving Factors of Spatial Structure of Eight Urban Agglomerations in China. Inq. Into Econ. Issues 2023, 73–84. Available online: https://www.ncpssd.cn/Literature/articleinfo?id=JJWTTS2023010006&synUpdateType=&type=journalArticle&typename=%E4%B8%AD%E6%96%87%E6%9C%9F%E5%88%8A%E6%96%87%E7%AB%A0&nav=1&langType=1&from=Qikan_Article_Detail (accessed on 1 February 2025).
  59. Ren, G.X.; Liu, K. Spatiotemporal evolution characteristics and influencing factors of green innovation in the Yellow River Basin. Arid Land Geogr. 2024, 47, 158–169. [Google Scholar]
  60. Cheng, K.M.; Zhang, Y.T. Measurement and decomposition of cities’ innovation spatial spillovers in China. Sci. Res. Manag. 2018, 39, 86–94. [Google Scholar]
  61. Sun, X.L.; Yan, D.S. Measurement and Decomposition of the Spatial Spillover Effect of Economic Growth in the Yangtze River Delta. Econ. Geogr. 2021, 41, 66–73. [Google Scholar]
  62. Sun, B.D.; Hua, J.Y.; Li, W.; Zhang, T.L. Spatial structure change and influencing factors of city clusters in China: From monocentric to polycentric based on population distribution. Prog. Geogr. 2017, 36, 1294–1303. [Google Scholar]
  63. Li, S.T.; Zhang, Y. Research on the Evolution Laws and Spatiotemporal Characteristics of Spatial Structures of Chinese Urban Agglomeration. J. Tech. Econ. Manag. 2023, pp. 120–123. Available online: https://www.ncpssd.cn/Literature/articleinfo?id=JSJJYGLYJ2023007022&synUpdateType=&type=journalArticle&typename=%E4%B8%AD%E6%96%87%E6%9C%9F%E5%88%8A%E6%96%87%E7%AB%A0&nav=1&langType=1&from=Qikan_Article_Detail (accessed on 1 February 2025).
  64. Dong, R.X.; Yan, F.Y. Revealing characteristics of the spatial structure of megacities at multiple scales with jobs-housing big data: A case study of Tianjin, China. Land 2021, 10, 1144. [Google Scholar] [CrossRef]
  65. Liu, Z.Y.; Wang, Y.S.; Zhang, C.X.; Liu, D.Y. Quantitative Analysis of Spatial Heterogeneity and Driving Forces of the Urban Spatial Structure’s Development Level Based on Multi-Source Big Data: A Case Study of Beijing, China. Land 2023, 12, 1178. [Google Scholar] [CrossRef]
  66. Huang, D.Q.; Liu, Z.; Zhao, X.H. Monocentric or polycentric? The urban spatial structure of employment in Beijing. Sustainability 2015, 7, 11632–11656. [Google Scholar] [CrossRef]
  67. Xie, X.P.; Hou, W.; Herold, H. Ex post impact assessment of master plans—The case of Shenzhen in shaping a polycentric urban structure. ISPRS Int. J. Geo-Inf. 2018, 7, 252. [Google Scholar] [CrossRef]
  68. Yue, W.Z.; Liu, Y.; Fan, P.L. Polycentric urban development: The case of Hangzhou. Environ. Plan. A 2010, 42, 563–577. [Google Scholar] [CrossRef]
  69. Burger, M.; Meijers, E. Form follows function? Linking morphological and functional polycentricity. Urban Stud. 2012, 49, 1127–1149. [Google Scholar] [CrossRef]
  70. Xiong, H.G.; Zou, G.H.; Cui, J.Y. Influences of Topographic Factors on Change of Urban Spatial Structure in the Process of Urbanization: A Case Study of Urumqi City. Areal Res. Dev. 2012, 31, 55–59. [Google Scholar]
Figure 1. Spatial expression of HHI in Chinese cities (note: Figure 1 was drawn by the author).
Sustainability 17 02013 g001
Figure 2. Temporal evolution of different types of USS. (a) divided by economic region; (b) divided by economic class; (c) divided by scale class; (d) divided by administrative level.
Sustainability 17 02013 g002aSustainability 17 02013 g002b
Figure 3. The theoretical framework of the factors influencing USS (note: Figure 3 was drawn by the author).
Sustainability 17 02013 g003
Table 1. Descriptive statistics.
VariableSymbolUnitSample NumberMeanSDMinMax
Nighttime lightsNTL-4672107.816138.9980.1301497.046
Highway mileagex1km424013,356.47510,384.949602181,216
Postal service volumex2ten thousand yuan424016,0325663,795136118,093,748
The index of industrial structure upgradingx3-42401.0203750.56096420.1387435.35734
Per capita GDPx4yuan424050,031.7234,031.884054226,877
Per capita retail sales of consumer goodsx5yuan424056,867.2243,228.322037.05374,606
Number of university studentsx6person424099,989.13173,953.96551,409,834
Government interventionx7-42400.1950.1260.0090.917
Table 2. Collinearity test of variables.
VariableVIF1/VIF
x11.590.628066
x23.050.328289
x31.220.820509
x42.670.374153
x52.000.499889
x61.910.522870
x72.200.454294
Table 3. The regression results.
VariableCoef.Std. Err.z
lnx10.095 ***0.0175.44
lnx2−0.023 ***0.004−5.70
lnx30.040 ***0.0094.29
lnx40.027 **0.0142.02
lnx50.024 ***0.0064.27
lnx6−0.0010.008−0.19
lnx70.016 **0.0072.34
Wlnx1−0.142 ***0.028−5.03
Wlnx20.0050.0060.82
Wlnx3−0.033 **0.014−2.31
Wlnx4−0.063 ***0.018−3.59
Wlnx5−0.0020.009−0.21
Wlnx60.0000.0120.00
Wlnx70.027 **0.0112.37
Spatial rho0.402 ***0.01724.01
Variance sigma2_e0.008 ***0.00045.34
N424042404240
Note: **, and *** indicate that the values are significant at 5% and 1% levels, respectively.
Table 4. The regression results include the quadratic term of per capita GDP.
VariableCoef.Std. Err.z
lnx10.075 ***0.0174.31
lnx2−0.017 ***0.004−4.22
lnx30.041 ***0.0094.45
lnx40.824 ***0.0849.78
lnx50.018 ***0.0063.21
lnx6−0.0080.008−1.01
lnx70.028 ***0.0074.02
lnx42−0.039 ***0.004−9.57
Spatial rho0.408 ***0.01724.61
Variance sigma2_e0.008 ***0.00045.33
N424042404240
Note: *** indicate that the values are significant at the 1% level.
Table 5. Robustness test results.
VariableW0W1W2
lnx10.075 ***0.033 *0.039 **
(4.31)(1.93)(2.20)
lnx2−0.017 ***−0.017 ***−0.018 ***
(−4.22)(−4.02)(−4.10)
lnx30.041 ***0.048 ***0.031 ***
(4.45)(5.03)(3.21)
lnx40.824 ***0.978 ***0.841 ***
(9.78)(7.12)(9.88)
lnx50.018 ***0.020 ***0.019 ***
(3.21)(3.44)(3.23)
lnx6−0.008−0.008−0.006
(−1.01)(−1.08)(−0.80)
lnx70.028 ***0.016 **0.034 ***
(4.02)(2.24)(4.64)
lnx42−0.039***−0.047 ***−0.041 ***
(−9.57)(−7.19)(−9.88)
Spatial rho0.408 ***0.358 ***0.885 ***
(24.61)(18.87)(31.73)
Variance sigma2_e0.008 ***0.009 ***0.009 ***
(45.33)(45.51)(45.92)
N424042404240
Note: *, **, and *** indicate that the values are significant at 10%, 5%, and 1% levels, respectively.
Table 6. Endogeneity test results.
Variable(1)(2)(3)
lnx40.824 ***
(9.78)
lnx4L1 0.807 ***
(10.72)
lnx4L2 0.763 ***
(11.23)
lnx10.075 ***0.068 ***0.068 ***
(4.31)(3.88)(3.92)
lnx2−0.017 ***−0.016 ***−0.016 ***
(−4.22)(−3.97)(−3.87)
lnx30.041 ***0.038 ***0.041 ***
(4.45)(4.13)(4.58)
lnx50.018 ***0.018 ***0.016 ***
(3.21)(3.28)(2.84)
lnx6−0.008−0.007−0.009
(−1.01)(−0.97)(−1.13)
lnx70.028 ***0.027 ***0.029 ***
(4.02)(3.92)(4.14)
lnx42−0.039 ***−0.040 ***−0.038 ***
(−9.57)(−10.92)(−11.51)
Spatial rho0.408 ***0.407 ***0.410 ***
(24.61)(24.55)(24.74)
Variance sigma2_e0.008 ***0.008 ***0.008 ***
(45.33)(45.34)(45.33)
N424042404240
Note: *** indicate that the values are significant at the 1% level.
Disclaimer/Publisher’s Note: The statements, opinions and data contained in all publications are solely those of the individual author(s) and contributor(s) and not of MDPI and/or the editor(s). MDPI and/or the editor(s) disclaim responsibility for any injury to people or property resulting from any ideas, methods, instructions or products referred to in the content.

