Article

Drivers’ Perspective on Traffic Safety and Impacts from the Surrounding Landscape: A Case Study of Serbia

by
Ivana Sentić
1,*,
Ivana Živojinović
2,3,4,
Jasmina Đorđević
5 and
Jelena Tomićević-Dubljević
6
1
Department of Viticulture, Horticulture and Landscape Architecture, Faculty of Agriculture, University of Novi Sad, 21000 Novi Sad, Serbia
2
Department of Economics and Social Sciences, Institute of Forest, Environmental and Natural Resource Policy, BOKU University, 1180 Vienna, Austria
3
European Forest Institute, Forest Policy Research Network, 1180 Vienna, Austria
4
Centre for Bioeconomy, BOKU University, 1190 Vienna, Austria
5
Department of Geography, Tourism and Hotel Management, Faculty of Sciences, University of Novi Sad, 21000 Novi Sad, Serbia
6
Department of Landscape Architecture and Horticulture, Faculty of Forestry, University of Belgrade, 11000 Belgrade, Serbia
*
Author to whom correspondence should be addressed.
Sustainability 2025, 17(5), 1936; https://doi.org/10.3390/su17051936
Submission received: 26 November 2024 / Revised: 2 February 2025 / Accepted: 7 February 2025 / Published: 25 February 2025

Abstract

:
Due to the high volume of traffic on European highways and the increased percentage of traffic accidents and fatalities, traffic safety is imperative in the planning and design of highways. While highway safety design construction standards have been extensively researched, insufficient attention has been given to the influence of the surrounding landscape on traffic safety and to drivers’ awareness about the danger of the same. Thus, the aim of the research was to assess drivers’ perceptions of various factors impacting highway traffic safety (climatic impacts from the surrounding landscape, landscape vegetation that follows the roadway, and animals) beyond specific engineering features (roadway surface, traffic signs, highway junction points). A survey of 138 drivers was conducted to assess driver awareness of traffic safety on the research section of a highway in Serbia. This highway is part of the Serbian highway that is a key connection within the European road network, forming an integral part of several major routes. The survey revealed that drivers, regardless of gender or experience, primarily associate traffic safety with well-built roads and good visibility during driving. While the impacts of climatic elements from the surrounding landscape were acknowledged, drivers do not strongly attribute any danger to traffic safety from these factors due to their lack of visibility. This is reflected in the notable number of traffic accidents, impacted by these factors, on the studied highway (e.g., 12% of the total number of accidents during 2022). Vegetation and animals did not play a significant role in the respondents’ answers, which should not be the case; however, their absence in the highway landscape and along the roadway led to a lack of observed quality by drivers. This underscores the need for the scientific community and policymakers to delve deeper into these issues with a broader perspective, and to elevate highway safety standards accordingly.

1. Introduction

Fatalities and injuries as a result of traffic accidents represent a serious problem in road traffic safety on a global level. Large material damage and a large number of human victims have made road traffic safety one of the most pressing societal issues of the 21st century [1,2,3,4]. Current global statistics underscore the severity of the problem, with an alarmingly high road death rate reported [5,6]. Annually, traffic accidents claim approximately 1.35 million lives and cause injuries to up to 50 million people worldwide [6,7]. In terms of the main causes of human death, research by the WHO [6] ranks traffic accidents 8th, but predicts it will rise to 5th place globally by 2030.
There are numerous associations and organizations (PIARC, IRU, ERF, ETSC, etc.) at both the global and the European level that focus on traffic safety analysis and traffic sustainability. They publish reports on the current situation in various countries, where data are accessible. These organizations play a key role in raising public and professional awareness and finding solutions about pressing issues. As a result, they create a network that links spatial planners, policymakers, engineers from various disciplines and the road users [8,9,10]. Looking at the European level, the European Union (EU) has set an ambitious long-term goal of achieving zero fatalities and serious injuries in road traffic by 2050 [11]. So, how to achieve this ambitious goal when the average death rate across the 28 EU countries is 47.5 deaths per million inhabitants and when in some countries of the EU, the death rate reaches as high as 93 deaths per million inhabitants, such as in Romania [12]?
Injuries and fatalities result from factors such as inattention, negligence, exceeding speed limits, poor road signs and poor quality of asphalt, but also from the impacts that arise from the surrounding landscape, dominantly climatic elements [13,14]. According to United Nations data, more than 12,000 weather disasters were documented between 1970 and 2021, with developing countries experiencing disproportionately high impacts—nine out of ten such disasters are fatal, and 60% of economic losses stem from extreme weather conditions [15].
A variety of studies on road traffic safety have been conducted worldwide [13,14,15,16,17,18,19], and the literature predominantly focuses on technical standards such as adequate geometric roadway features—roadway width, asphalt quality, and effective signalisation [20,21,22]. The less visible yet highly impactful effects of climatic elements on traffic safety are seldom discussed except in cases of extreme events [23,24]. There is very little literature related to the analytical approach how drivers perceive traffic safety, particularly on highways in rural areas [25,26]. This raises the question of whether drivers are aware of the potential risks to their safety and whether they can react to them in a timely manner.
Defining the relationship between drivers, the highway and highway landscapes design is certainly a complex task [27]. It is a fact that the landscape design through which the road passes also affects drivers’ behaviour [28]. Road traffic safety is, thus, determined by the relationship between drivers, vehicles, roads and the surrounding landscape [29] where each sub-factor interacts with the others [30]. Thus, road traffic safety must have a broader perspective, given the current insufficient coverage of these topics and a societal lack of awareness about the associated risk factors [25].
So, is the scientific community adequately informed about this issue, and are they making appropriate calls for policy changes to enhance road safety? There is a clear need for additional strategies and policies that aim to improve road safety [31]. Road safety policies in Serbia are poor, failing to address the issues raised in this paper, and they offer no effective solutions to the mentioned issues [32]. Effective evidence-based policy making within road safety is a multiple step process that involves gathering data about crashes and their causes. The need for the collection of new data and the establishment of a transparent database on traffic safety becomes increasingly important [31].

1.1. Influence of Landscape and Climatic Elements on Driving

For over a century, there has been focus on improving knowledge in the field of traffic engineering, often overlooking the landscape through which the road passes [33]. Consequently, there is a misconception that traffic accidents solely result from driver errors and inadequate road infrastructure [34]. It is extremely important to respect natural laws before moving even one lump of earth during the construction of a road [35]. In this concept, traffic safety should be approached from two different perspectives: from the physical characteristics of the traffic landscape and from the driver’s viewpoint of their influences that may pose a threat to them while driving.
The visual elements that drivers respond to while driving such as notable roadside objects—vegetation barriers and landmarks, their continuity and repetition, and the size of groupings—all influence a drivers’ concentration and awareness of safety while driving [25,36]. Traffic safety can be very low if visual elements of any kind are absent along the roadway or in the surrounding landscape [37]. One example is that some of the most scenic roads can be very monotonous if their connection to the surrounding landscape is not made [36,38]. Monotonous highway landscapes often induce boredom and sleepiness, impacting driver concentration negatively [39,40]. Psychologists studying environmental impacts on driver concentration suggest that pleasant landscape views can reduce stress [28,34].
On the other hand, a beautiful tree can be a hazardous tree as well; thus, the focus should not be just on the aesthetic value of vegetation when discussing highway landscape [41]. Tall trees planted close to roads can be particularly dangerous, since strong storms can bring down parts of trees onto the road surface [36]. The impact of climatic elements on traffic safety can largely be controlled and their threat minimised through appropriate road landscape vegetation design [27,42,43,44,45,46]. It is important not only in terms of reducing wind speed, but also in terms of snowdrifts, as well as soil fractions of surrounding landscape on the road surface [47,48,49,50]. Vegetation in the road median protects drivers from the glare of sunlight, but also from the light of the headlights of oncoming vehicles [51]. Visual guidance through road curves is essential for visibility. In foggy conditions, the traffic signs by themselves might not always be sufficient, but in combination with vegetation, they can be a strong safety measure regarding visual guidance on the road [52,53].
So, integrating roads with their surroundings can provide driving assistance through informative messages or warnings that can help drivers to make significantly better driving decisions [54]. Modifying highway landscapes to improve safety can also mitigate the severity of injuries caused by accidents and reduce the overall crash rate notably [54,55,56]. The fact is that the connection between the landscape and road is clearly recognised but, unfortunately, in many countries, especially in developing countries, they are often not in a coordinated relationship [57].
It is important to emphasise that the visual experience of the landscape is qualitative [52]. Factors such as the driver’s age, character, and attention to other parts of the highway play significant roles in the influence and individual perception of the landscape and this should be a topic of further analysis [29,52] to achieve a broader perspective of traffic safety through the prism of drivers’ observations. This variability underscores the challenge in precisely defining how drivers perceive and interact with the landscapes they traverse on highways [29].
Good coordination between the landscape and the road would enable drivers to make better decisions and enhance their safety on the road. On the other hand, spatial planners and policymakers, by keeping this in mind, could prevent potential traffic accidents by developing adequate spatial plans.

1.2. Influence of the Specific Key Engineering Features on Driving

Highway accidents are influenced by a broad range of factors, such as driver and vehicle characteristics, enforcement levels, environmental conditions and road design features, as well as the many complex interactions among them [58,59]. Unfortunately, accident databases do not cover the full spectrum of these factors. Casualty-related accidents are more affected by traffic volume, lane width, hard shoulder width, and road surface condition. Findings seem to confirm that these factors significantly impact the likelihood of accidents and that drivers are generally aware of this [58].
Traffic control devices are a crucial component of road infrastructure, with road markings and signs playing a key role. Generally, these markings and signs serve as the primary means of communication between road authorities and drivers, providing essential information about rules, warnings, obligations, and other details related to upcoming situations and road alignment [60]. They are crucial elements of traffic safety from drivers’ perspective [59].
The human factor ranks first among the causes of road accidents. According to statistics, a significant number of road accidents (including those involving injuries) happen in the region of highway junctions [61]. This is the reason this factor is ranked very high by drivers. Properly designed and landscaped highway junctions with high visibility and transparency contribute to greater driver safety. Additionally, vegetation can be used for visual guidance, emphasising curves, junctions, and other features, further improving road safety [52].

1.3. The Aim of the Research

The most typical measures for reducing road traffic deaths and injuries are aimed at improving road infrastructure and driver education. While significant knowledge and experience has been applied to preventive measures, including the advancement of highway construction and infrastructure, there remains a critical gap in understanding traffic safety from the driver’s perspective. Additionally, climatic elements—often overlooked—act as hidden factors influencing road safety. The surrounding landscape features, such as vegetation and animals, also play a significant role in affecting traffic conditions and deserve greater attention when considering traffic safety measures.
In connection with all the above, this research aims to demonstrate the extent to which drivers understand and perceive factors that can influence road traffic safety, as well as their related un(awareness).Ultimately, the findings of this research are crucial for spatial planners and practitioners, including policymakers and other experts, when considering the design of highway landscapes. This consideration is pivotal in enhancing road traffic safety and should be viewed in terms of the practical benefits they can offer.The research questions that were raised are as follows:
  • Which highway characteristics (both engineering and technical and those related to the surrounding landscape) influence drivers’ perceptions of road traffic safety the most?
  • To what extent are drivers aware of how the surrounding landscape affects road safety?
  • Do drivers perceive road traffic safety on highways differently as a result of gender and years of driving experience and type of vehicle?
By posing these research questions, the paper aims to broaden the perspective of road traffic safety by focusing on users’ experiences along the Belgrade–Novi Sad highway section. Finding answers to these questions can provide a solid foundation for improving legislation related to this issue and enhancing public awareness.
The paper structure is organized as follows. Section 1 provides an overview of the relevant research on the traffic safety and drivers’ perception on the key traffic safety elements. Section 2 describes the researched area, followed by a description of the work methodology. The results are presented in Section 3, divided by the methodological steps used in the study. Section 4 discusses the results obtained in the study. The main conclusions and considerations for future research are outlined in Section 5.

2. Materials and Methods
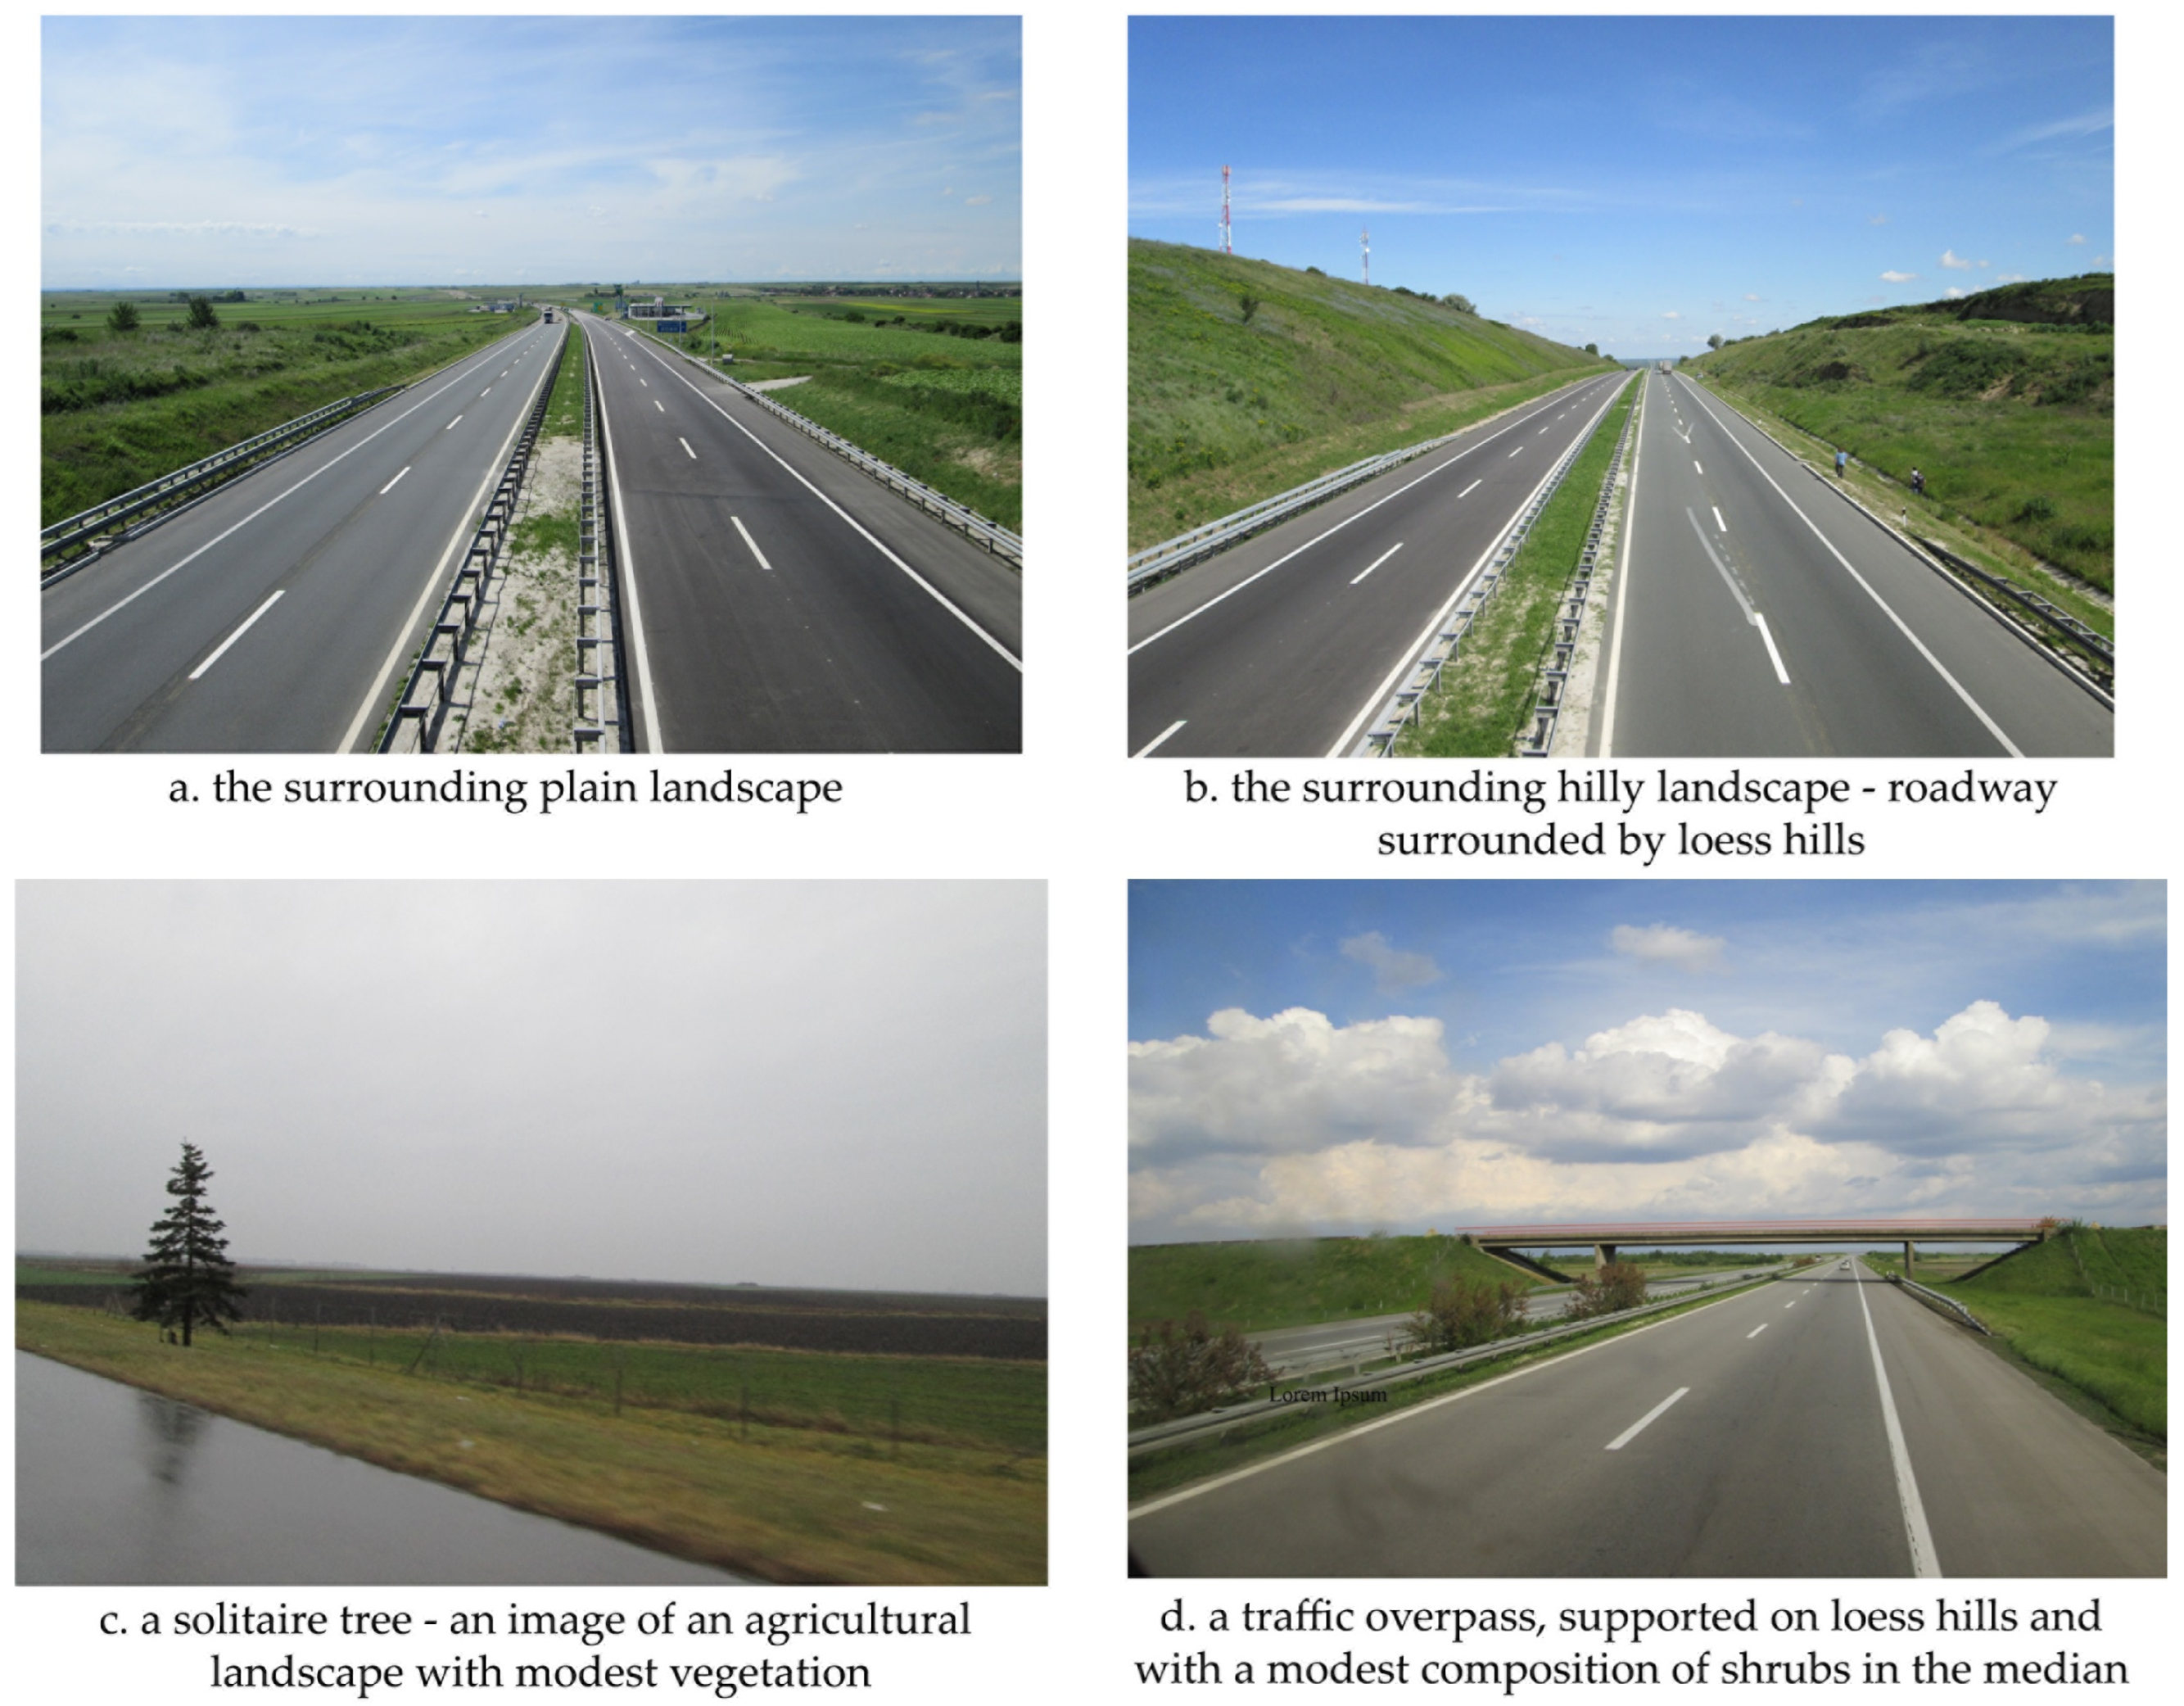
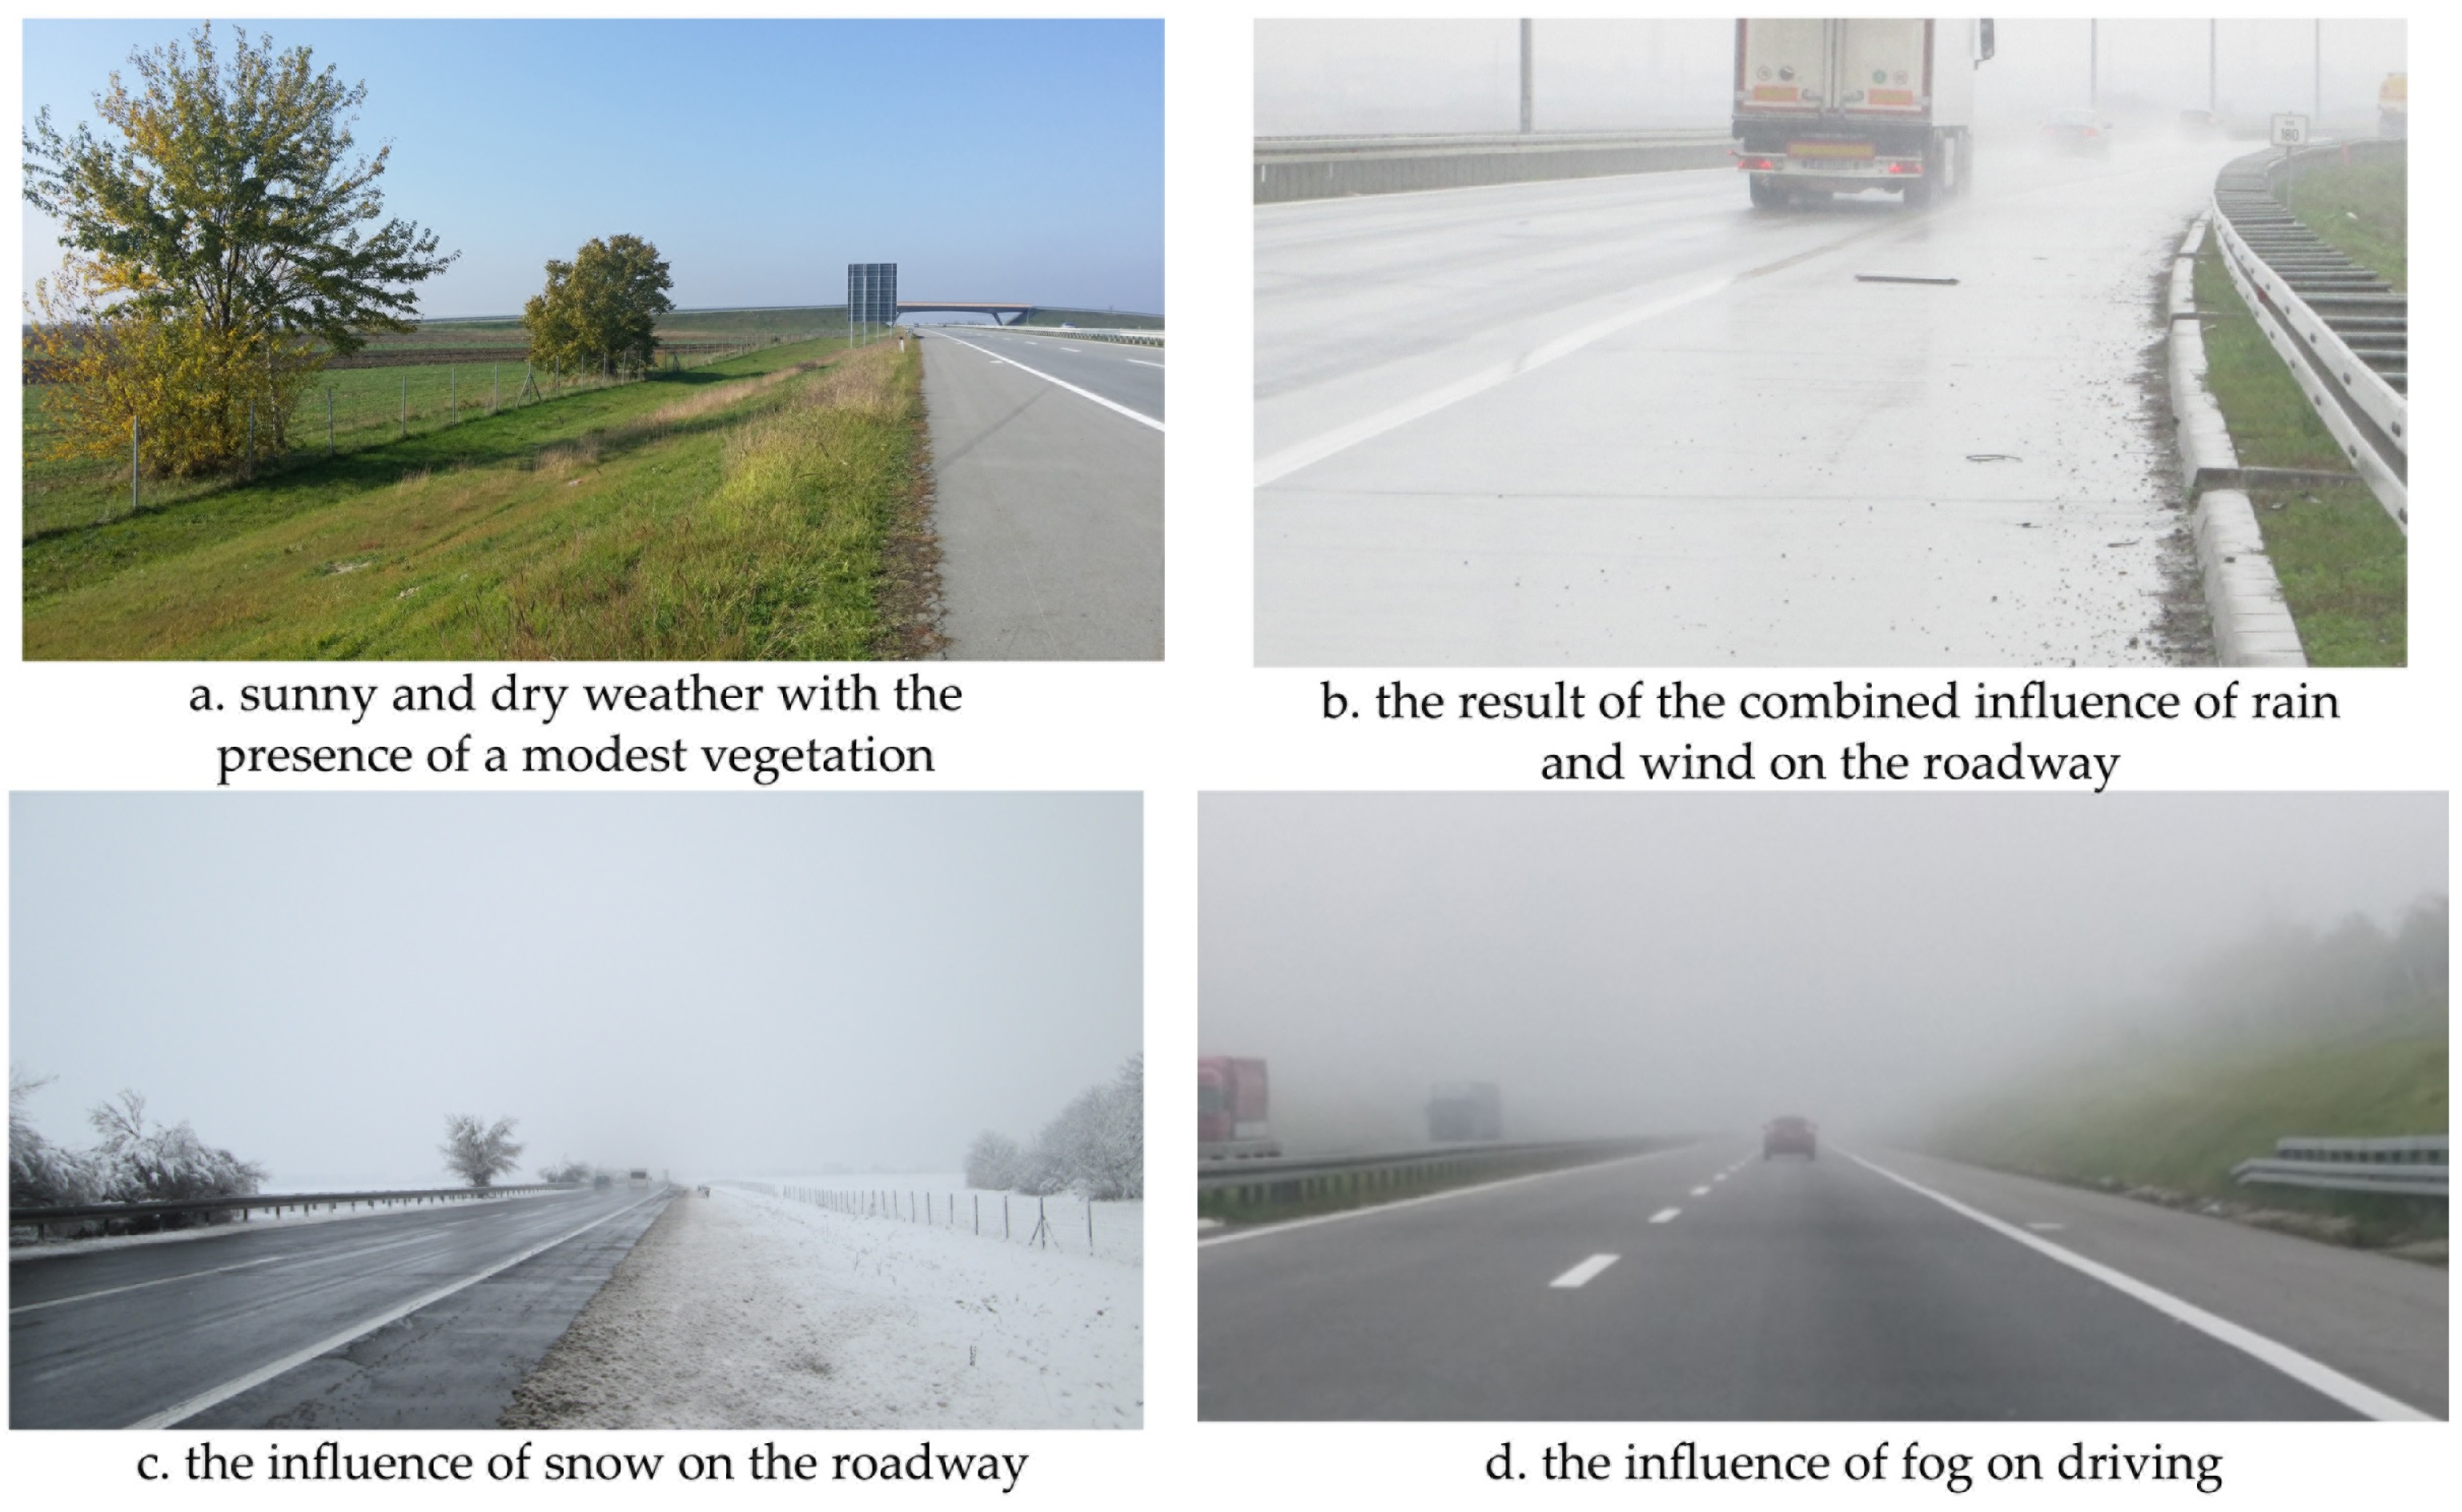
2.1. The Study Area

The Belgrade–Novi Sad traffic infrastructure corridor (Figure 1) is located in the northern part of the Republic of Serbia. It is about 80 km long [45] with two lanes in each direction, separated by a median. It extends at an altitude from 74 m (Novi Sad) to 89 m (Belgrade). The highway section itself intersects several main and regional roads. It features 6 interchanges and crosses one passable waterway (the Danube River). There are 9 overpasses along this section, most of which are located in the northern part. The examined highway is one of the most important transportation corridors in Serbia, playing a key role in national and international traffic flow. This highway has a history of frequent accidents, making it a relevant and critical subject for investigation. As an integral part of several prominent European roads (E75, Pan-European Corridor X, TEM, etc.), it represents an important connection of roads in Europe [62].
The landscape through which the research section of the highway passes is a quite monotonous, agricultural area. It is predominantly flat, mainly straight and without many curves—a favourable format for achieving high speeds. It is not perceived to be part of a cohesive spatial entity, i.e., the human–vehicle–road–environment traffic system, which is considered the foundation for traffic safety [63]. During the construction of the Belgrade–Novi Sad highway (further, the BG–NS highway), the emphasis was on meeting the technical standards in the construction process, but not on its surroundings (Figure 2). As a consequence, the landscape had to adapt to the road, and the influence of climatic elements on traffic safety is very pronounced.
The surrounding landscape of the research highway is open, without any planned ornamental or protective vegetation. Thus, the road itself is exposed to constant influences of climatic elements such as strong winds or snowdrifts. Since there is no development plan for the surrounding landscape arrangement, it is clear that the highway is vulnerable to natural risks (Figure 3). Therefore, drivers are also exposed to potential danger. There are no agroforestry shelter belts to control wind and snowdrifts, and vegetation in the median is almost non-existent (with the exception of only a few sections), where drivers are further endangered by the glare of sunlight and car headlights. Additionally, in foggy conditions, there is no visual guidance, which could easily be provided by vegetation (Figure 3). Given that the vegetation is sparse and modest, wandering animals encountered on the highway is also a common occurrence observed by drivers.

2.2. Survey Methodology and Data Analysis

For this research, it was essential to survey a large and diverse group of drivers operating various categories of motor vehicles on the highways, encompassing a wide range of driving experience levels. The study focused on assessing the perception of traffic safety on the BG–NS highway, covering various factors such as technical elements (traffic signs, road width, highway junctions and condition of rest areas), climatic influences (wind impacts, snowdrifts and reflected sunlight), and encounters with animals along the route.

2.2.1. The Questionnaire Structure

The survey was conducted between January and May 2022. In order to obtain credible data, three key criteria were applied: respondents had to be over 18 years old (a requirement for holding a driver’s license in Serbia), actively driving (not observing from the passenger seat), and have a good degree of familiarity with the BG–NS highway (driving it several times a year). Due to these criteria, gender distribution in the sample was not evenly balanced.
The research was conducted face to face, with respondents selected via random sampling at bus stations in the cities of Belgrade and Novi Sad. To ensure a comprehensive representation across different categories of motor vehicles, surveys were also emailed to drivers of specific vehicle categories. The survey was anonymous and responses were obtained from 138 participants.
The survey comprised 31 questions, divided into three sections. The first section focused on gathering basic demographic data about the respondents. Its goal was to determine whether factors such as gender, education, years of driving experience, and vehicle category influenced perceptions of traffic safety. The second section referred to the BG–NS highway traffic safety assessment. The set of questions in this section examined drivers’ awareness of the presence of technical elements along the highway roadway (traffic signs, condition of hard shoulder, quality of the roadway’s surface, visibility of the highway junction), and whether some climatic elements were prone to disturb their driving (wind impact, snowdrifts or reflected sunlight). Also, through the driver’s perception, the vegetation that follows the highway was analysed, as well as how often drivers had met animals walking on the highway. Respondents rated these factors on a Likert scale ranging from 1 (do not agree at all) to 5 (completely agree). The third section allowed respondents to provide open-ended comments about any unsafe situations they had encountered on the highway. This included feedback on technical elements of the road and the influence of the surrounding landscape.

2.2.2. Statistics Evaluations

The data were statistically processed in Excel and IBM SPSS 2023. Descriptive statistics were applied, where frequencies and percentages were used (categorical variables in the first section of the survey), as well as the arithmetic mean and standard deviation (numerical variables in the second section of the survey). Analytical statistics (correlations between variables and between different groups of respondents) were also applied.
However, this research deals with parametric statistics and the Pearson coefficient of correlation was applied in order to analyse the variables mutually. Determining the quantitative differences between two groups of respondents (male and female) in answering the conducted survey was carried out using a t-test, where the differences between the arithmetic means of the two groups of respondents were analysed based on one continuous variable. Independent samples were selected within the population. The data were analysed using a t-test of the independent samples (the Independent Sample Test, t-test), that is, statistical significance was sought between the arithmetic means of two random causes of men and women. The equation for Pearson coefficient of correlation is as follows:
r x y = i x i y i n x ¯ y ¯ i x i 2 n x ¯ 2 i y i 2 n y ¯ 2
Legend: n is the sample size; xi and yi are the individual sample points represented by “i”;
x ¯ = 1 n i = 1 n x i (the sample mean), which is analogous for y ¯ .
In the case when the respondents were divided into several groups (e.g., according to the motor vehicle they drive, years of driving as an active driver and education), the application of the t-test was not justified, so a one-factor analysis of variance, better known as ANOVA (ANALYSIS OF VARIANCE), was applied. The equation for ANOVA is as follows:
F = MST/MSE
MST = SST/p − 1     MSE = SSE/N − pSSE = ∑ (n − 1)
Legend: F—ANOVA Coefficient; MSE—mean sum of squares due to error; SST—total sum of squares; p—total number of populations; n—the total number of samples in a population; N—total number of observations.

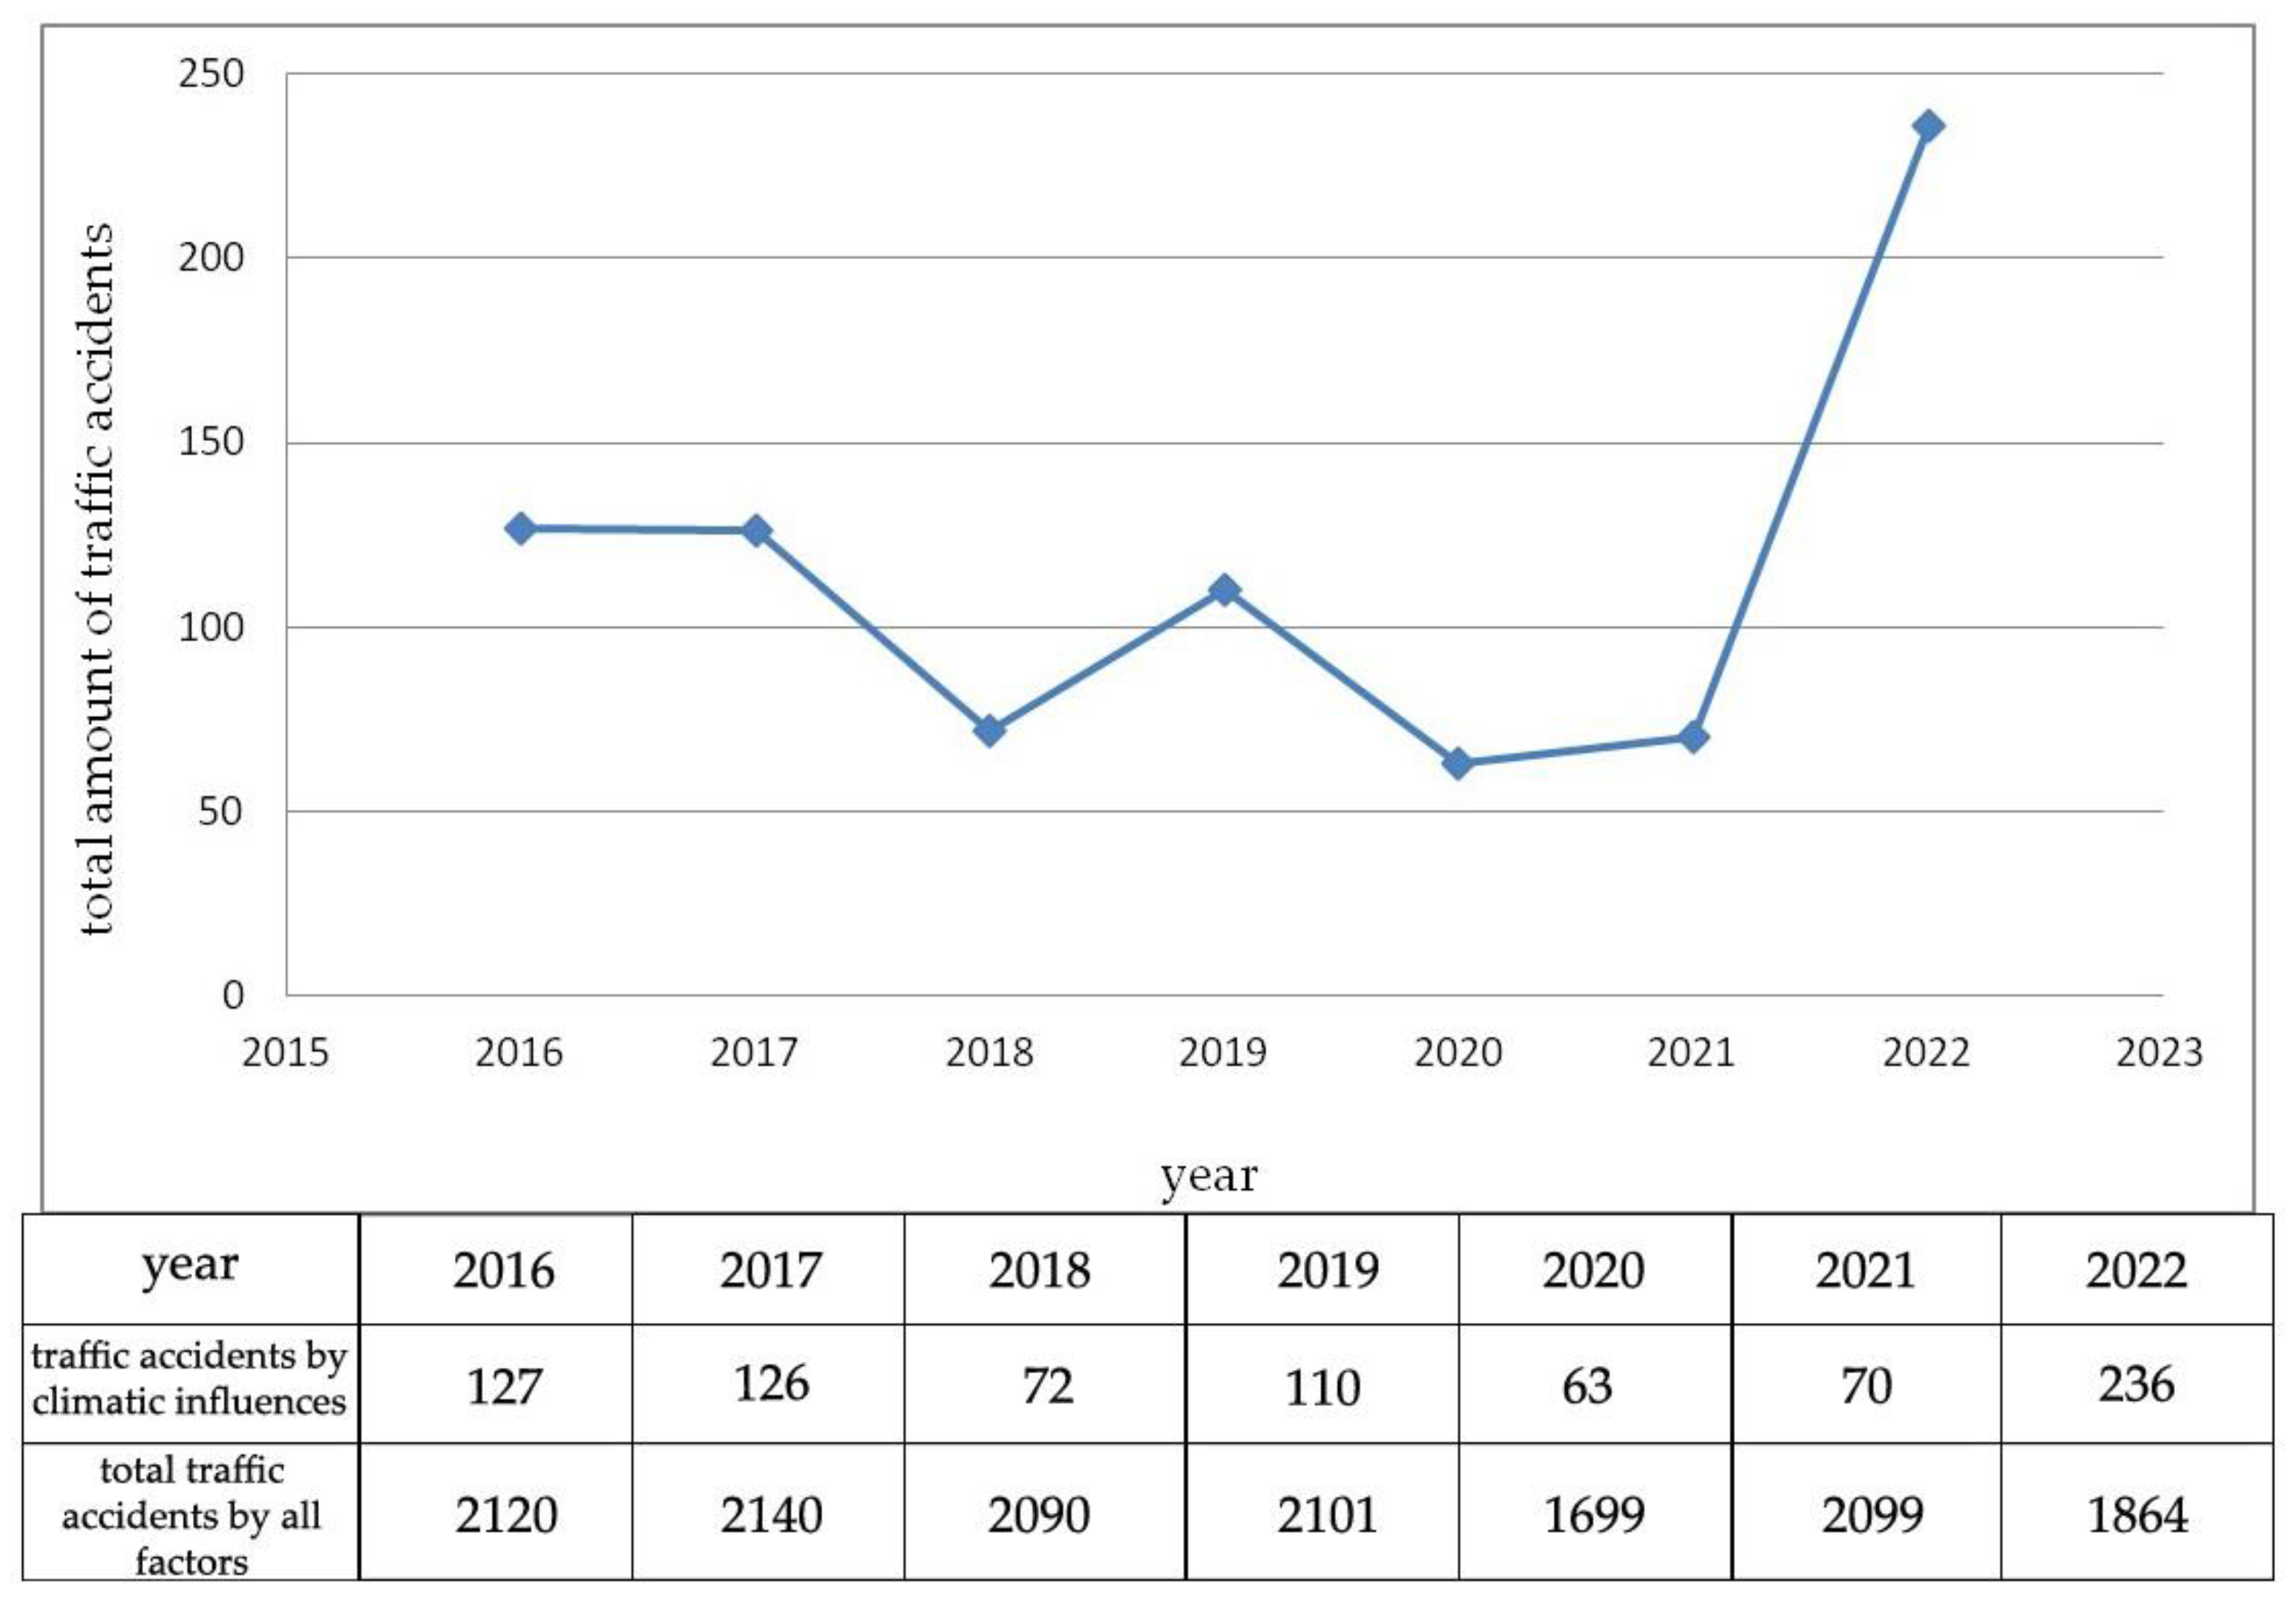
2.2.3. Traffic Accident Access Estimations

To confirm the findings of this sociological analysis, data on traffic accidents from the research highway section were examined. These data were obtained through a WEB GIS application managed by the Traffic Safety Agency in Serbia [64], the only method authorised by law [65] to collect data on traffic accidents and their consequences. The unique database is supported by data collected by traffic police departments across municipalities along the various types of roads in Serbia, as well as from the public enterprise “Roads of Serbia”. The Ministry of the Interior provides data on traffic accidents from the previous year to the Traffic Safety Agency using a methodology established by the Faculty of Traffic and Transport Engineering, University of Belgrade.
The application uses attribute analysis to display information on traffic accidents and the involved individuals, with the option to filter specific datasets. The WEB GIS application is based on the GDi GISDATA LOCALIS Visios platform, a configurable web GIS viewer developed in JavaScript for visualising spatial data, primarily intended for internet use.
Given that the survey was conducted during 2022, acquiring data for only one year does not provide a significant sample. Therefore, for the purposes of this research, the chosen time frame was from 2016 to 2022. The year 2016 was the first year that this method of data collection was implemented in Serbia, and thus the analysis of traffic accidents began from this point. The analysed attributes were the municipalities through which the research highway passes; influencing factors with filters that display only the impact of climatic elements on the cause of traffic accidents, such as vegetation and the presence of animals on the motorways; categories of motor vehicles (car, truck, tanker truck, and bus); and the attributes of the participants, i.e., the drivers.
It is well known that many traffic accidents are caused by engineering and technical errors on the road itself. However, the danger that comes from the surrounding landscape has been less monitored through statistics. These sets of data highlighted the importance of keeping in mind that neglecting this approach to road safety has far-reaching consequences for the lives of road users, particularly drivers.

3. Results

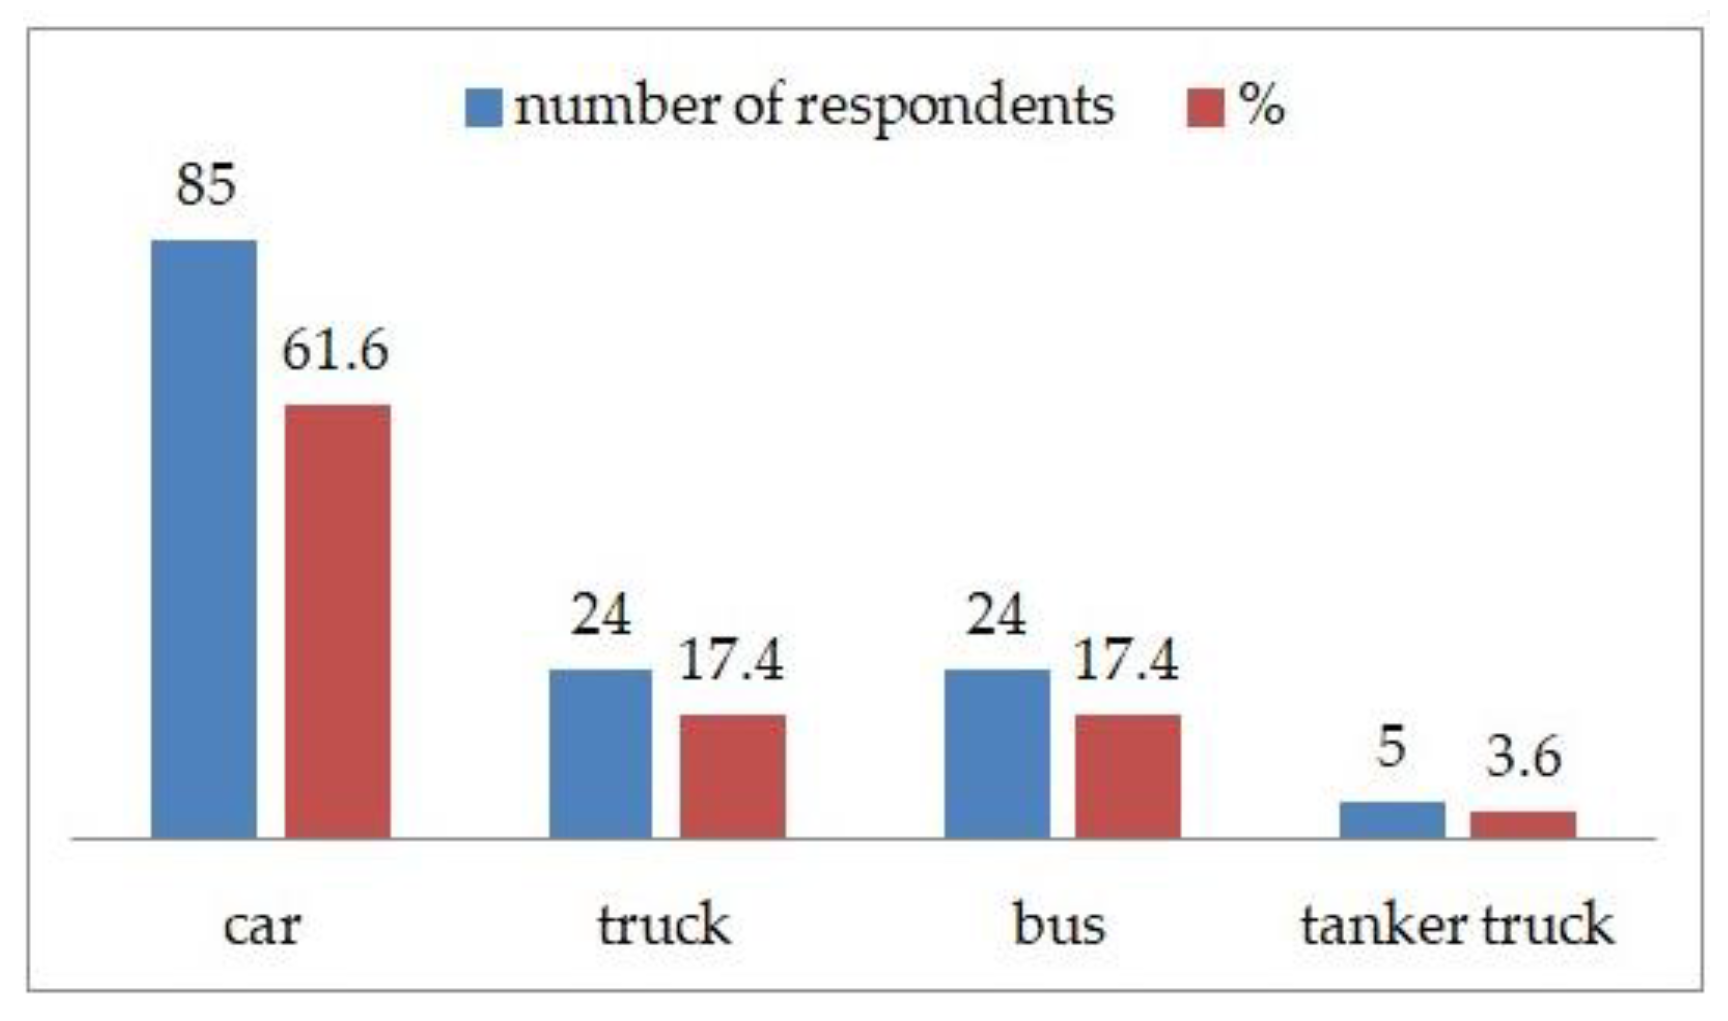
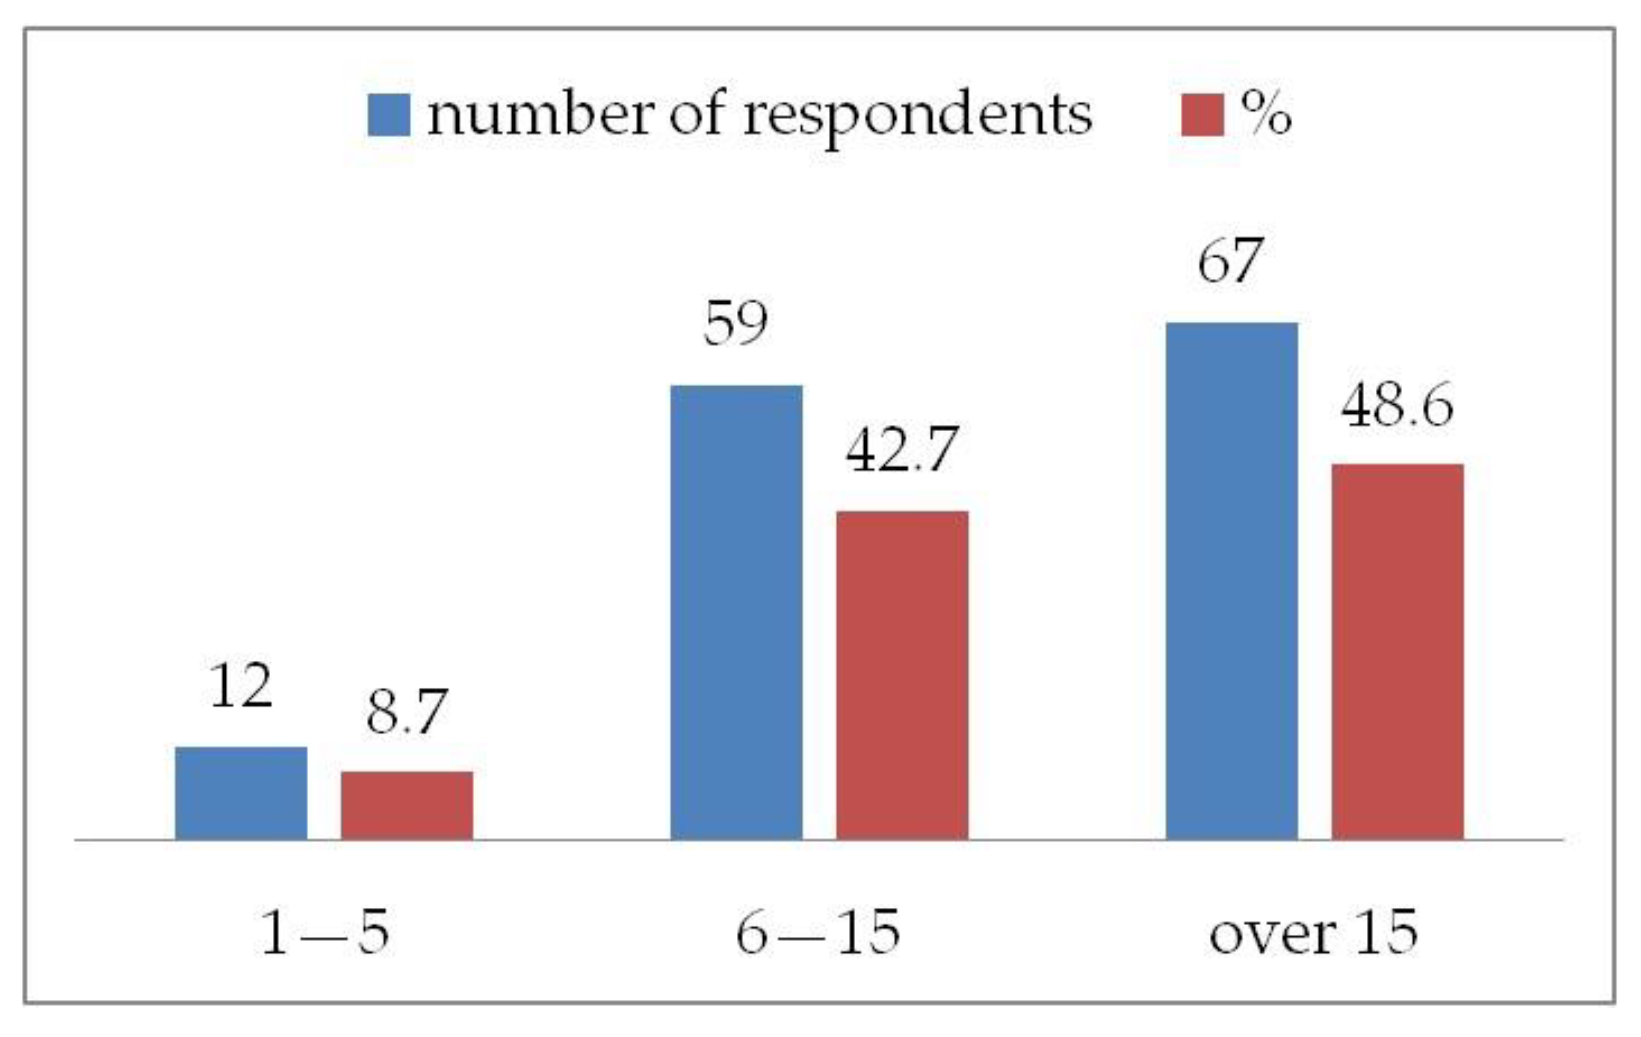
3.1. Respondent Data

The research was conducted on a sample of 138 respondents, 77.5% of whom were male (107 respondents), and 22.5% female (31 respondents). Within the sample, the majority of respondents indicated that cars were the category of motor vehicle they drove most frequently, while tanker trucks were the least common choice (Figure 4). Most respondents had over 15 years of driving experience (Figure 5).
Regarding the educational profile of the respondents, most were highly educated—58% (mostly car drivers). There were 58 respondents with secondary school education (mainly truck, bus and tanker truck drivers), which represents 42% of the total surveyed sample. There were no respondents who had only primary school education.

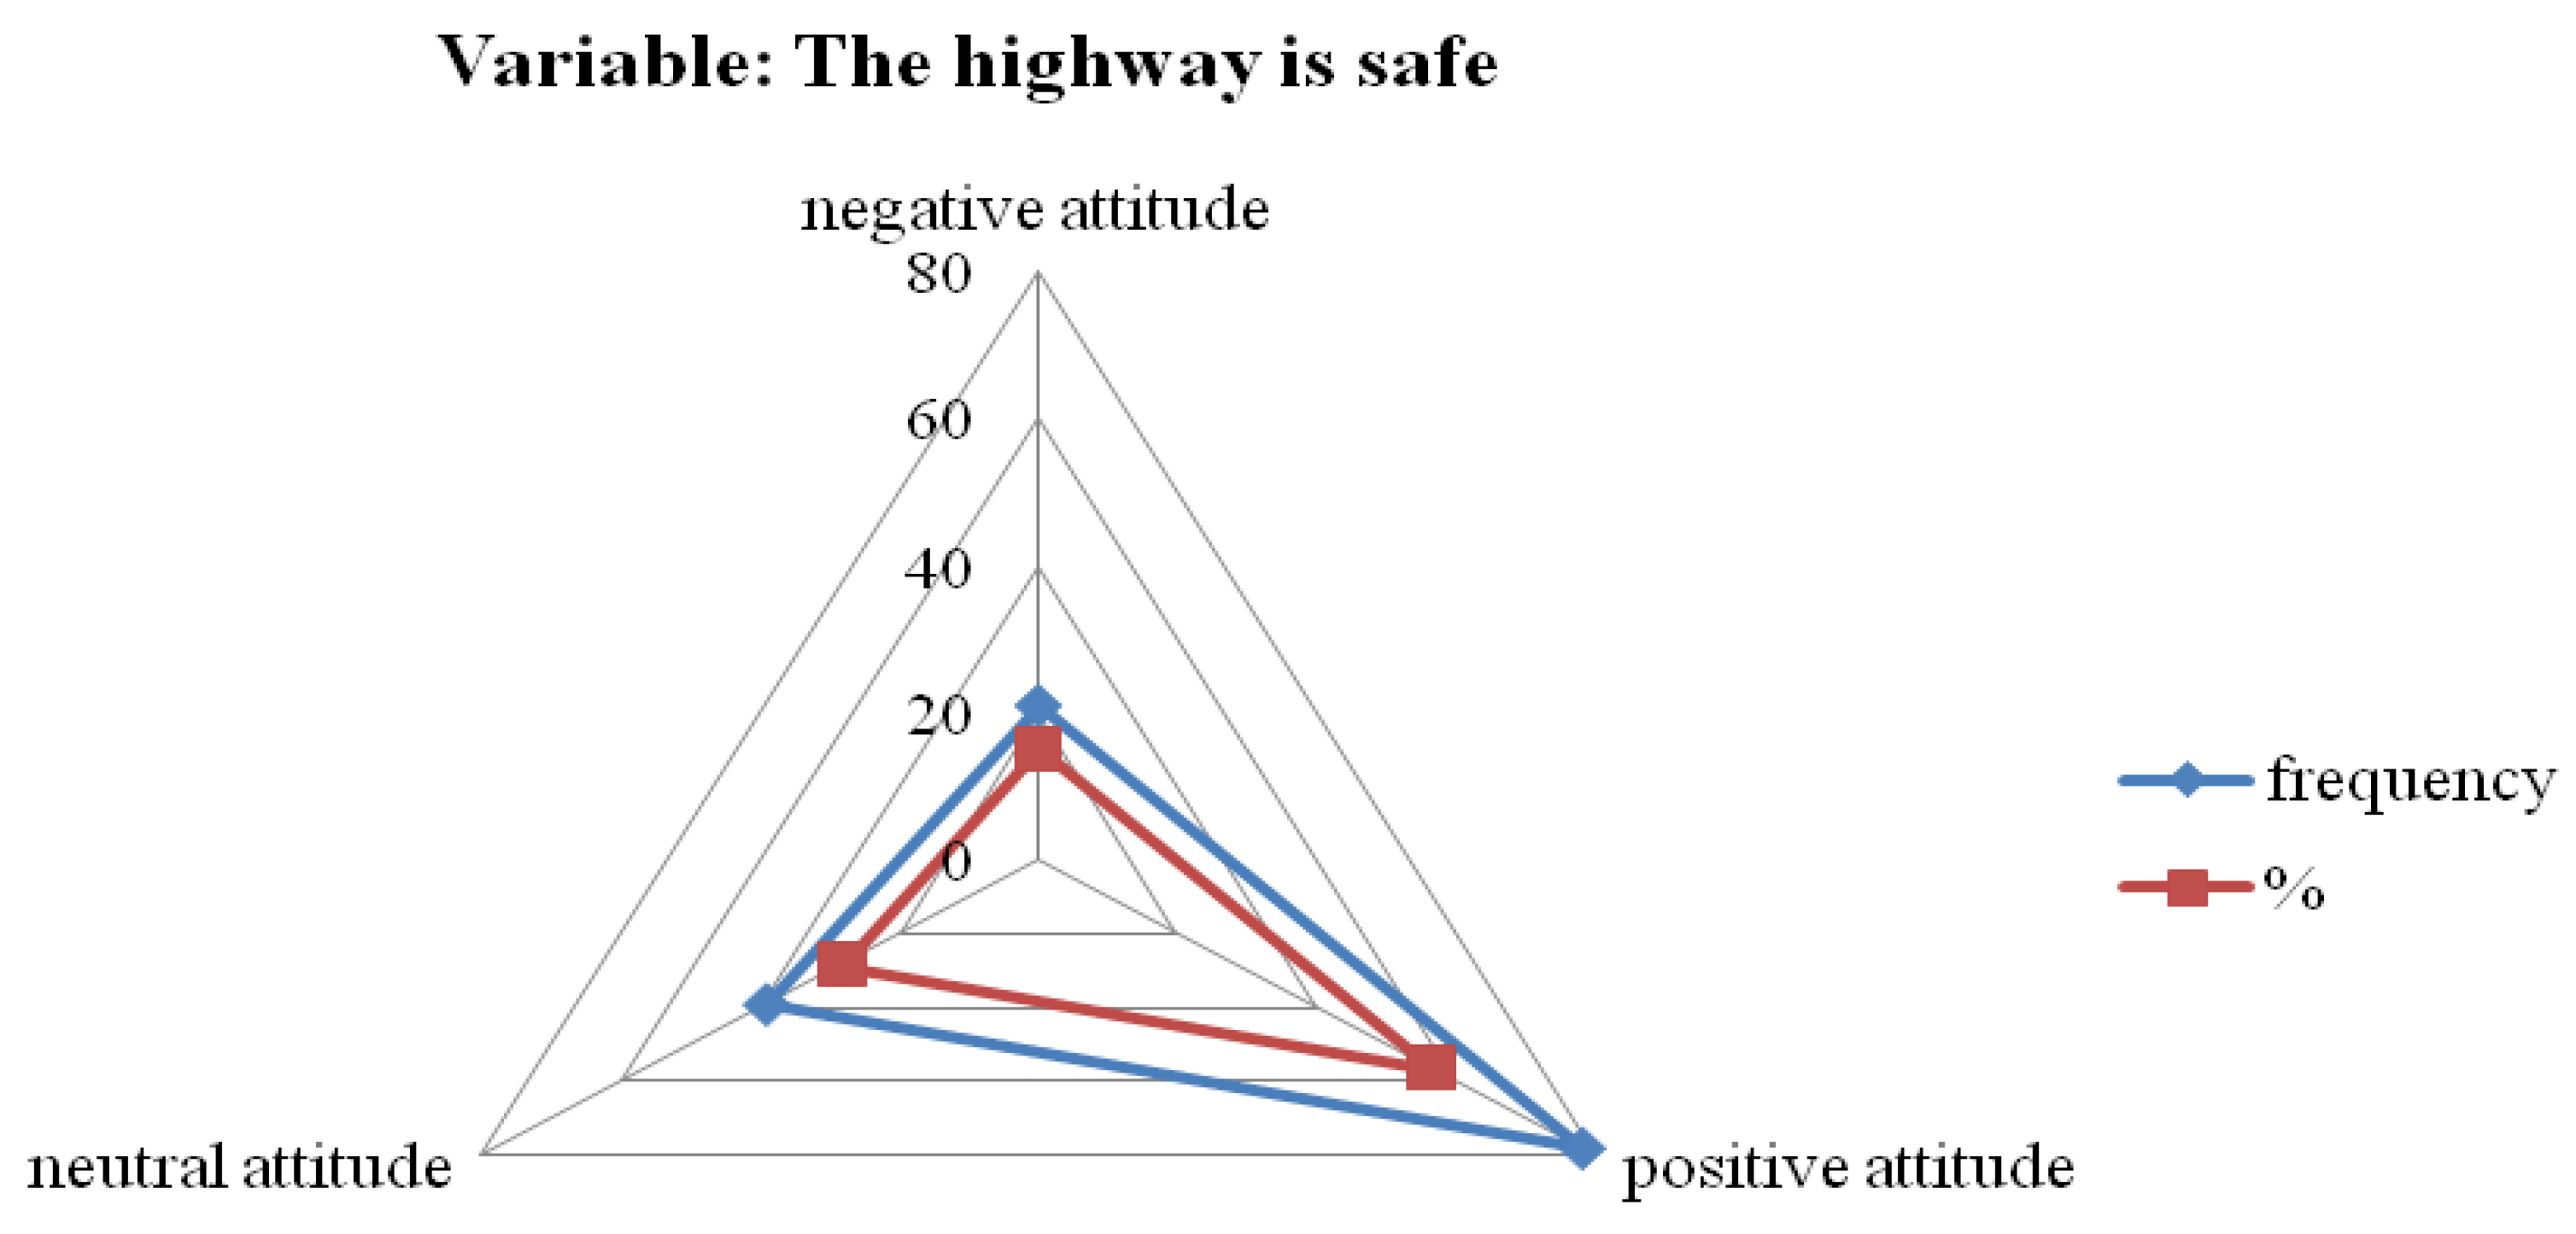
3.2. Traffic Safety Assessment in the Research Area

Considering all the variables examined, as outlined in Table 1, the arithmetic means and standard deviations of the quantitative variables were calculated and described. Since the minimum answer value could be 1, and the maximum 5, it is considered that the values of the arithmetic means were above the average (2.79). Observing the values of the standard deviations, which in most cases are quite high, it is concluded that there were large oscillations in the respondents’ opinions regarding the questions. As a result of this, it was necessary to further analyse them in more detail through descriptive frequencies.
According to the survey, respondents had a positive attitude (Figure 6) towards the safety rating (56.5%). Of the total number of respondents, 15.2% had a negative attitude, while 28.3% held a neutral opinion. Although drivers generally rate the overall safety of the BG–NS highway positively, a more detailed analysis of the questionnaire reveals negative evaluations of specific aspects of traffic safety, as will be demonstrated later in the paper. This raises the question as to whether drivers fully understand what traffic safety entails and how reliable their assessment of general traffic safety on the highway is.

3.3. Traffic Safety Through the Prism of Driver Perception

Based on the respondents’ answers, it was observed that highway safety is primarily evaluated through the perception of roadway quality and width, the availability of an adequate number of rest areas, and the visibility of highway junction points. Regarding roadway cracks, the majority of respondents were undecided (33.3%), while 21.1% completely agreed that the roadway is free of cracks. On the statement that the roadway is protected from wind impact, 33.3% of respondents partly disagreed, and 32.6% completely disagreed. A total of 53 respondents did not agree at all that the roadway is protected from snowdrifts. Similar answers were related to the statement that the roadway is protected from reflected sunlight (29.7% partly disagreed, while 26.1% partly agreed). According to the answers, it can be concluded that the respondents believe that there are a lot of cracks on the roadway, that the impact of wind and snowdrifts is very strong and that reflected sunlight was observed as a very disturbing factor when driving (Table 2).
The respondents were not clear regarding other parameters of traffic safety. For example, 35% of the respondents completely agree that the highway signs along the road are appropriate and 26.8% had a neutral attitude, while 13% of the respondents did not agree. Regarding the item “The shoulder along the route is safe”, 29.7% of the total number of respondents completely agreed with this statement.
Respondents have a very positive attitude towards the level of safeness of the junctions (entrances and exits), which is shown in Figure 7. Namely, the results indicate that 34.1% of respondents partly agreed with the statement that highway junction points are safe; 23.9% fully agreed, and 29% were of neutral attitude. A smaller percentage of respondents have the negative opinion with the statement, where 8.7% do not agree at all, while 4.3% partly disagree. This opinion has likely arisen from the fact that the highway junction points are clear and visible. They are indeed visible, as no planning was carried out regarding their greening. Regarding the rest areas (landscape designed exits from the highway and petrol stations), drivers agreed that there are enough of them (45% of the total number of respondents). The “Kovilj” rest area was marked as the area that meets all the necessary needs of drivers (30% of the total number of respondents).
Based on the insight into the Pearson coefficient of correlation (Table 3), it was observed that the variable “I consider the BG–NS highway route to be safe” shows a strong correlation with the variables “The highway signs are satisfactory” (r = 0.518, p = 0.00) and “The roadway is free of cracks” (r = 0.628, p = 0.00). Additionally, this variable shows a medium strong correlation with the following variables: “The roadway is protected from snow” (r = 0.307, p = 0.00); “The BG–NS highway route is always passable” (r = 0.483, p = 0.00; “The roadway is protected from reflected sunlight” (r = 0.413, p = 0.00); “The highway junction points are safe” (r = 0.387, p = 0.00) and “Animals are not endangered by the highway traffic” (r = 0.429, p = 0.00). All this leads to the conclusion that the roadway without cracks, good highway signalisation, the road being constantly passable, roadway without snow, safe highway junction points and not encountering animals on the highway road are positive feedback points with which drivers can evaluate the highway safety positively.
The following variables were also cross-referenced: “I often drive along the BG–NS highway route”; “The highway signalisation is satisfactory” and “The roadway is free of cracks”. A significant and medium-strong relationship was established. Namely, more frequent driving along the BG–NS highway allows one to see that the highway signalisation is getting worse and that the roadway has a lot of cracks, which raises the question as to how safe this highway route can really be considered.

3.4. Observing Traffic Safety in Relation to Gender

Furthermore, differences between various groups of respondents were tested using the t-test method and the traffic safety perception among these two groups of respondents was observed (Table 4). The null hypothesis was that men and women have the same attitude towards highway traffic safety. A t-test was conducted and based on Levene’s Test for Equality of Variance, statistical data were obtained where F = 0.112 and p = 0.738, which is not a statistically significant value. Therefore, the assumption of homogeneity of variances is confirmed and the results of the t-test from the second row in Table 4 (the row named Independent Sample Test) were used to test the null hypothesis regarding the equality of the average values of the two already mentionedgroups of respondents.
According to the results, t = 2.719, df = 136, and p = 0.007. Since p < 0.05, the probability of obtaining a value of t = 2.719 is significant. As the value of the confidence interval (95% Confidence Interval of Difference) ranges from 0.066 to 0.414, it does not exceed zero, and this analysis does not include the null hypothesis. Therefore, the null hypothesis that the attitudes of men and female in the examined sample are equal, regarding the overall assessment of highway safety, is rejected. Looking at the arithmetic means in the row named Group Statistics in Table 4, it can be said that men have a slightly more favourable attitude than women.

3.5. Observing Traffic Safety in Relation to the Years of Driving Experience

In order to determine whether the overall evaluation of the highway traffic safety was conditioned by the years of driving experience, the variables were crossed in the ANOVA test. Namely, the null hypothesis was set out—The different subpopulations of respondents, equal in terms of arithmetic means, have the same opinion about the overall highway traffic safety, no matter the number of years of driving experience. The Levene’s test of homogeneity of variances (Table 5) showed p = 0.288, which is significantly high. Therefore, there is no reason to doubt the homogeneity of the variances, and thus the conditions for using the ANOVA test are met. However, the F test is 3.101, and the probability of obtaining this test value is on the border and amounts to p = 0.058. Therefore, the value is not below the expected 0.05, and there are no statistically significant differences between the groups, so the null hypothesis is accepted. It is concluded that men and women have the same opinion about highway traffic safety, regardless of the years of driving experience.

3.6. Observing Highway Traffic Safety in Relation to the Category of Motor Vehicle

The next null hypothesis was set out—The different subpopulations of respondents, equal in terms of arithmetic means, have the same opinion about the overall highway traffic safety, no matter of the category of motor vehicle they drive. Levene’s test of homogeneity of variances showed that p = 0.611, which satisfies the condition of homogeneity of variances, and the use of the ANOVA test is justified (Table 6). Observing the further values, the F-test is 6.771, and the probability of obtaining that test value is p = 0.000. The F-statistic is considered statistically significant, so the null hypothesis of equality between the groups is rejected. It is concluded that, depending on the category of motor vehicle they drive on the highway, the respondents have a divided opinion regarding the evaluation of highway traffic safety. Based on the overall test, it can be concluded that truck drivers have a slightly more favorable attitude towards traffic safety on highways compared to car and bus drivers. However, this cannot be considered definitive, as the sample size among the different categories was not equal.
In order to determine the reason for these inequalities between the groups, a Scheffe posthoc test was carried out. Comparing groups “I” and “J”, differences between the values of arithmetic means were observed (Table 6). Analysing the level of confidence, the value of zero is not exceeded, which only confirms the previous analyses, meaning that the null hypothesis is not included. Based on the entire test, it can be concluded that truck drivers have a slightly more favourable attitude towards the highway traffic safety than car and bus drivers.
Within the education variable, three categories were defined (primary school, secondary school education and higher education). This analysis should have been carried out with the ANOVA test. However, since there were no respondents with only primary school education, this variable was sorted into two categories. In order to determine whether the respondents’ education had an impact on the overall assessment of the highway traffic safety, a t-test was performed. The value of the t-test was 3.139, and the probability of obtaining this value is 0.002, which is a statistically significant value, and the null hypothesis of equality between the respondents with secondary school education and higher education is rejected. It can be concluded that drivers with secondary school education (mean = 2.9298) have a slightly more positive attitude towards the assessment of the overall highway traffic safety than drivers with higher education (mean = 2.6977). This, again, does not necessarily mean that they are more competent, but rather that their professions may be closely related to driving or dependent on it, and therefore their responses are more numerous.

3.7. Observing the Highway Traffic Safety in Relation to the Influences of the Surrounding Landscape

Researching how drivers perceive climatic elements as a factor of (un)safeness in traffic, the arithmetic mean values were found to be around or slightly below the average for the entire sample in the study. At the same time, there are variables that mainly evaluate the impact of climatic elements on highway traffic safety, including “The roadway is protected from wind impact” (2.13); “The roadway is protected from snowdrifts” (2.14) and “The roadway is protected from reflected sunlight” (2.69). The variable “Driving is not monotonous along the route” had a value of 2.83, around the average.
Considering the percentage frequency, 32.6% completely agreed and 33.3% partly agreed that the roadway is protected from wind impacts. Furthermore, 46.4% of the total examined sample agreed that the roadway is not protected from snow and 38.4% of respondents answered that they completely disagree that the roadway is protected from reflected sunlight. The answers related to the question “Is the BG–NS highway route always passable, no matter the weather conditions” were not clearly distinguished either (13% of the total fully agreed, 34.8% partly agreed and 32.6% were neutral).
There is a strong and significant linear correlation between the variables “The roadway is protected from wind impacts” and “The roadway is protected from snowdrifts” (r = 0.848, p = 0.00). Also, there is a significant and moderately strong correlation between the variables “The roadway is protected from wind impacts” and “The roadway is protected from reflected sunlight” (r = 0.488, p = 0.00). It can be concluded that if the highway is well protected from wind impacts, it will also be well protected from snow drifts and reflected sunlight (Table 7).
The group of questions related to the role of vegetation in increasing highway traffic safety had the lowest values of arithmetic means. It is assumed that the answers were undervalued for the reason that vegetation is planted separately and modestly in smaller groups and does not attract the drivers’ attention. The respondents did not have a positive attitude about the landscape vegetation of the BG–NS highway (Table 8). The following variables stood out: “The vegetation in the highway landscape endangers traffic safety” (1.95) and “The vegetation in the highway median endangers safety” (1.87).
The presence of vegetation along the highway is important not only for controlling harmful natural impacts from the surrounding environment but also because it serves as a habitat for many animals. During the construction of the highway, its removal essentially disrupts the animals’ movement patterns. Therefore, the study of traffic safety and animal movement along highways, as well as their sudden appearance on the road, is a very important factor. When considering the presence of animals on the BG–NS highway, respondents expressed uncertainty about whether animals are endangered, with 26.8% agreeing and disagreeing, and 25.4% partly agreeing(Table 8). This balanced distribution of responses is likely influenced by the frequency with which each driver has encountered animals on the highway and the time of year during which these encounters occurred.
In the search for a connection between the first two examined variables from Table 8 and variables where vegetation potentially plays a role in protecting against the influence of climatic elements from the surrounding landscape (such as wind impact, snowdrifts, and reflected sunlight), significant and strong correlations were not found (Table 9). This means that drivers do not view the existing vegetation along the roadway as significant in mitigating factors affecting traffic safety, such as wind, snow, or animal movement. This perception is understandable, given that the vegetation is quite sparse and often outside the drivers’ direct line of sight.

3.8. Observing Traffic Safety in Relation to WEB GIS Application

The causes of traffic accidents can be numerous. As noted in the Methodology, an analysis was conducted by isolating attributes and selecting filters from publicly available databases to assess the natural impacts of the surroundings (Figure 8). According to the data, the years 2018 and 2021 recorded a drastic decline (72 and 70) in the number of traffic accidents where drivers sustained minor or serious injuries. The year 2020 showed an expectedly low number of traffic accidents (63) due to the COVID-19 pandemic and the associated movement restrictions.
Conversely, in 2022, there was a significant rise in traffic accidents (236/804), all attributed to the influence of climatic elements of the environment. In terms of percentages, over 12% of the total number of traffic accidents on the research highway in 2022 was due to the impact of climatic elements. These are significant data and represent a warning to the community that the awareness of this issue is very low.
As for the category of vehicles involved in traffic accidents from 2016 to 2022, cars slightly lead with 50%, followed by drivers of trucks and tanker trucks at 46%, while bus drivers accounted for only 4%. Drivers involved in traffic accidents are mostly uninjured, with minor physical injuries and/or material damage. An exception is the year 2022, which recorded a considerable number of fatalities and a significant number of drivers with serious physical injuries.

4. Discussion

Traffic safety is a growing concern [6,44], with many researchers aiming to improve it through scientific studies [8,66], focusing on road geometry, technical and technological standards and the relationship between the landscape and the roadway [8,26,33,67,68]. While these factors are emphasised in many countries [69,70,71,72], in Serbia, the focus remains solely on roadway construction, with little attention given to the surrounding landscape [62,73,74]. Drivers’ road safety attitude and risk perception are crucial factors in road accidents. The way drivers perceive driving tasks influences the probability of traffic accidents [75]. So, it can be a serious cause of traffic accidents if some elements in the surrounding landscape or the roadway itself are confusing for drivers, sometimes even hazardous [76,77]. Thus, the contribution of this paper is to fill a gap in the literature database of the research topic, especially in the case of Serbia.

4.1. Traffic Safety Through the Planning Act Systems

As shown in this research, the number of traffic accidents on the research highway in Serbia is increasing, which is partly attributed to the influence of the surrounding landscape. Moreover, the results of this study indicate that drivers do not perceive traffic safety on this section of the highway as sufficiently strong, likely due to various factors, including poor communication with the monotonous surrounding landscape, the absence of crucial highway landscape design elements for safety, and the poor quality of the road surface.
Although there are studies that have been conducted that highlight driver confusion due to inadequate road landscape design as a safety threat [76,77], planning documents overlook the need to approach traffic safety from the driver’s perspective. There are some examples beyond the boundaries of Europe that consider this issue in a different way [78,79]. Therefore, it is crucial for planners and policymakers to understand how drivers perceive safety, enabling the development of policies and the implementation of effective measures to achieve road safety goals [80].
According to the aforementioned global traffic safety regulations [6,11,13,17], it is emphasised that environmental factors from the surrounding landscape should be given more focus. Resulting from this kind of focus, there are a number of EU countries with a low death rate from traffic accidents per million inhabitants (Sweden: 21.7, Denmark: 26.2 and Germany: 33.5). In their traffic laws, the incorporation of the roadway with the surrounding landscape and consideration of their influences is strongly highlighted. The laws of these countries tend to achieve a balance between the road and the landscape, with a focus on traffic safety [70,71,72]. However, the laws at a national and local level in developing countries such as Serbia deal with this issue poorly or even not at all. This means that there is no spatial plan concerning traffic safety requiring experts involved in the highway design to ensure that the roadway is in a coordinated relationship with the surrounding landscape [62,65,73,74] and that any hazardous influences are suitably controlled.

4.2. Drivers’ Perspective on Traffic Safety Through Technical Elements

In the survey, it was found that drivers primarily view traffic safety through the prism of good roadway surface quality, traffic signs, and road visibility. While other factors listed in the survey were important to drivers as well, the primarily listed factors were seen as more significant. Answers to the survey questions of this research emphasise that there are almost no differences between genders, years of driving experience or category of motor vehicle. Similarly, these findings are highlighted by the several other authors [80,81,82,83], but with the emphasis that men have a greater tendency to expose themselves to risks on the roads than women [82]. This was also confirmed by the authors Kulkarni et al. [84].
The reason might be their lack of awareness that road safety should be considered more broadly, not just in technical terms, and the poor characteristic of planning tools (the case of Serbia). Some of the reasons could be related to the traffic safety culture of drivers [85], while others could be related to educational and institutional factors [57]. This last one might be particularly relevant in the Serbian context, since the answers related to educational profile were of no significance. As previously mentioned [67], numerous engineering improvements to roadways lead to a reduction in the number of traffic accidents, but the issue should not be viewed solely from the one perspective [86]. Similar patterns were observed by other authors [81,87].

4.3. Drivers’ Perspective on Traffic Safety Regarding the Influences of the Surrounding Landscape

This study has shown that drivers are aware of influences from the surrounding landscape, such as the impact of climatic elements and animals, but they do not prioritise these factors. Furthermore, while they are aware of the vegetation in the overall highway landscape, drivers do not consider vegetation to be the main factor endangering their safety on the road, especially since there is no vegetation that follows the road itself. This may be consistent with case studies from developing countries [88], but contrasts with international research that highlights the importance of landscape design [89,90,91] and its integration in a highway layout [92]. As mentioned earlier, it is governed by the national laws of the countries [70,71,72].
An optimal highway design can only be achieved when technical, technological, and aesthetic standards are integrated and perfectly balanced [93]. This goes beyond merely planting vegetation along the roadside for scenic beauty and enjoyment [26]. It is a case of the technical control of traffic safety and it has been highlighted by many authors [26,29,39,40,52,68]. As has been mentioned, in Serbia, these aspects are not deemed essential, butrather the accent is put on the highway construction and the landscape is not observed at all [62,65,73,74]. This may lead to an understanding of why vegetation in the traffic safety perception of drivers in this researched highway section is not a priority.
On the other side, animals on the road can cause serious accidents, especially when the road design did not consider the effects of the reduction in animal habitats, leading to potential harm for both drivers and animals [47]. The respondents in this research had divided opinions regarding the presence of animals on the BG–NS highway, as encounters with animals on this section of highway werecertainly variable. While drivers on highways in Serbia have a neutral attitude on this matter, globally, significant attention is paid to this aspect of traffic safety in a two-way manner, both in terms of roadway construction design and animal safety [94,95].

4.4. Sustainability Aspects of Traffic Safety and Driver Perceptions

A broader approach to traffic safety must prioritize sustainability as a core element of road design and decision-making processes [96]. A highway safety cannot be determined solely by its engineering and technical specifications. Instead, roads must be designed in harmony with their surrounding landscapes to promote sustainability.
Vegetation plays a critical role in achieving this goal, serving multiple environmental, social, and economic functions. Policymakers and transportation planners should recognize the multifunctional role of vegetation in achieving these. Sustainable vegetation management not only enhances safety but also provides ecological benefits such as reducing air and noise pollution. Strategically placed vegetation acts as a natural barrier, absorbing gaseous pollutants like CO2 and particulate matter, thereby improving air quality and public health [97]. Additionally, vegetation can mitigate the heat island effect and regulate local microclimates, which is vital for climate-resilient infrastructure [98]; particularly native and drought-resistant species can also serve as a buffer against extreme weather conditions [96].
Socially, well-coordinated vegetation along highways improves road readability and safety by providing visual cues for drivers, reducing fatigue, and creating a more engaging driving experience. Furthermore, green infrastructure near highways contributes to the well-being of surrounding communities, offering aesthetic value, recreational opportunities, and habitats for wildlife [99].
From an economic standpoint, sustainable road infrastructure reduces long-term maintenance costs by stabilizing soil, preventing erosion, and reducing runoff through natural drainage systems. These measures not only preserve the environment but also cut costs associated with frequent repairs and water management [100].

4.5. Limitations of the Study and Suggestions for Future Research

A limitation of this research is certainly the sample size, which should be larger and more evenly distributed across genders and different vehicle categories. The nature of online and face-to-face sampling may limit the number of respondents due to the potentially uncomfortable format and issues related to internet access. It would also be interesting to compare how spatial planners and other experts respond to the same questions as drivers, in order to compare different perspectives on traffic safety between these two groups of respondents.
Some questions related to cross-cultural differences in road traffic risk should be added. Additionally, the questionnaire could be improved by including a version where certain questions, accompanied by figures, simulate abstract models of the highway designs and its landscape. In the end, it could be useful to compare the number of traffic accidents with those occurring on similar roads in different environments to determine whether climate-related accidents are less frequent on those roads.

5. Conclusions

The study primarily examines the behavioural aspects related to road accidents. Factors such as environmental influences, engineering, road design, vehicle safety features, and road lighting all play a role in road accidents. While accidents cannot be completely eliminated, efforts are necessary in order to reduce their occurrence and minimise the severity of injuries. Consequently, thisresearch focuses on the analysis of traffic safety from the perspective of drivers and how aware they are of certain elements that are not only of a technical nature but could threaten their safety. The paper provides a detailed report of the drivers’ focus during driving, but also the tendency to underestimate the presence of other dangerous elements that may not seem significant to the safety of traffic flow. Road safety refers not only to measures for reducing traffic injuries and fatalities, but also to the feeling of being safe within the road system. New research can identify sustainable traffic safety strategies that provide lasting and cost-effective crash reductions. This article discussesconcepts for a new approach to researching sustainable traffic safety from the drivers’ perceptive, reviews factors affecting traffic risk and outlines insights for truly sustainable safety planning.
The answers to the research questions have been obtained, and in the case of highways in Serbia, they are not at a satisfactory level. This is probably the case in many other developing countries and certainly remains a subject of interest for future research. Based on the research questions, stated at the beginning of the text, the results clearly indicate the following:
  • Drivers consider cracks in the road surface, wind and snow impact, sun reflection, and animals crossing the highway as factors that reduce their safety while driving;
  • Drivers provided inconsistent responses regarding safety—initially rating the highway as safe, but later offering negative feedback when elaborating on their safety concerns. This suggests that drivers’ awareness is not at an adequate level. Lawmakers should take this into account to ensure that engineers have the necessary flexibility when designing highways to address these nuanced safety perceptions;
  • All drivers, regardless of gender (exception is that men have a slightly more favorable attitude than women), age, or mode of transportation, share a similar view on safety, indicating the same level of unawareness.
Highways in Serbia face additional challenges, as they are relatively under-landscaped and lack integration as a cohesive entity between the roadway and the surrounding environment. Thus, this study serves as a significant warning to the scientific community, as well as to policymakers, not to rely on the assumption that drivers will recognise danger, but rather to take preventive measures to address the risks that can affect traffic safety. Furthermore, they should be aware of the broad perspective on vehicle movement safety in traffic and ensure that legal measures raise drivers’ awareness so that their safety on the road is unquestionable. The path to achieving this involves professionals understanding that the broader picture involves a much wider concept than just the creation of the road, and taking action to control or even prevent certain unsafe influences on the road.
In the end, a country’s highway network cannot be transformed into a totally safe zone, nor can a police officer be assigned to every car to monitor every driver. Instead, scientific approaches to the issues and a comprehensive policy on traffic safety for roads of different categories are required. Actively involving and surveying users, i.e., drivers, is one step toward achieving this goal. Strengthening awareness also enhances drivers’ safety on the road. Influences from the roadside environment must be understood and controlled, construction technology needs continual improvement, and driver awareness of potential dangers should be bolstered through educational programmes. These are all calls to the scientific and professional community, and certainly represent some topics for further research. The significance of this study is reflected in the need to encourage other researchers to take sociological approaches to traffic safety, so that spatial planners and other policymakers can be better assisted in their work.

Author Contributions

I.S.: Conceptualization, Investigation, Methodology, Writing—original draft, Writing—review & editing, Visualization. I.Ž.: Writing—original draft, Writing—review & editing. J.Đ.: Conceptualisation, Methodology, Writing—review & editing, Supervision. J.T.-D.: Conceptualization, Writing—review & editing, Supervision. All authors have read and agreed to the published version of the manuscript.

Funding

This research was funded by the Ministry of Science, Technological Development and Innovation of the Republic of Serbia, grant number 451-03-65/2024-03/200117 and the Centre of Excellence Agro-Ur-For, Faculty of Agriculture, Novi Sad, supported by the Ministry of Science, Technological Development and Innovations, grant number 451-03 1524/2023-04/17.

Institutional Review Board Statement

The study was approved by The Scientific and Teaching Council of the Faculty of Agriculture, University in Novi Sad, Serbia (Approval Code: 1000/0102, Number: 1672/2/12, Approval Date: 16 December 2024.

Informed Consent Statement

Informed consent was obtained from all subjects involved in the study.

Data Availability Statement

Data is contained within the article.

Acknowledgments

We would like to thank all the participants in our study for their time and valuable insights. Special thanks to the University of Novi Sad and the University of Belgrade, Serbia, for their support and expertise throughout this research, which greatly enhanced the quality of the study.

Conflicts of Interest

The authors declare no conflict of interest.

References

  1. Elvik, R. Why some road safety problems are more difficult to solve than others. Accid. Anal. Prev. 2010, 42, 1089–1096. [Google Scholar] [CrossRef] [PubMed]
  2. Ziakopoulos, A.; Yannis, G. A review of spatial approaches in road safety. Accid. Anal. Prev. 2020, 135, 105323. [Google Scholar] [CrossRef] [PubMed]
  3. Fric, S.; Ilić, V.; Trpčevski, F. Driver-vehicle-environment system and modern road design. In Proceedings of the First Serbian Road Congress, Belgrade, Serbia, 5–6 June 2014; Vujanić, M., Vuksanović, B., Eds.; The Serbian Road Society: Belgrade, Serbia, 2014. [Google Scholar]
  4. Topolšek, D.; Babić, D.; Fiolić, M. The effect of road safety education on the relationship between Driver’s errors, violations and accidents: Slovenian case study. Eur. Transp. Res. Rev. 2019, 11, 18. [Google Scholar] [CrossRef]
  5. Karapetrović, J.; Jolović, D. Improvement of current anti-corruption measures for traffic safety development. In Proceedings of the Second Serbian Road Congress, Belgrade, Serbia, 9–10 June 2016; Mladenović, G., Andrić, I., Eds.; The Serbian Road Society: Belgrade, Serbia, 2016. [Google Scholar]
  6. WHO. Global Status Report on ROAD Safety 2022, Time for Action; World Health Organization: Geneva, Switzerland, 2022; Available online: https://www.who.int/publications/i/item/9789240086517 (accessed on 13 March 2023).
  7. Wegman, F. The future of road safety: A worldwide perspective. IATSS Res. 2017, 40, 66–71. [Google Scholar] [CrossRef]
  8. PIARC Strategic Plan 2024–2027. STRATEGIC PLAN 2024–2027 PIARC—THE WORLD ROAD ASSOCIATION. World Road Association (PIARC), France. Available online: https://www.piarc.org/ressources/documents/source/Strategic-Plan-PIARC-World-Road-Association-2024-2027/10390f51-42980-Strategic-Plan-2024-2027-PIARC-World-Road-Association-December-2023.pdf (accessed on 17 January 2025).
  9. FERSI-Towards Safer Roads in Europe. Available online: https://fersi.org/wp-content/uploads/2019/02/140512-Towards-safer-roads-in-Europe_final.pdf (accessed on 17 January 2025).
  10. ETSC-18th Annual Road Safety Performance Index (PIN Report). Available online: https://etsc.eu/18th-annual-road-safety-performance-index-pin-report/ (accessed on 19 January 2025).
  11. European Commission—Fact Sheet, 2019. 2018 Road Safety Statistics: What Is Behind the Figures? Available online: https://ec.europa.eu/commission/presscorner/detail/pl/MEMO_19_1990 (accessed on 26 December 2023).
  12. European Commission. Facts and Figures Main Figures. European Road Safety Observatory. Brussels, European Commission, Directorate General for Transport. 2024. Available online: https://road-safety.transport.ec.europa.eu/document/download/cd2dd292-4776-4b6c-9b89-212dc646907a_en?filename=ff_main_figures_20240315.pdf (accessed on 13 May 2024).
  13. ITF-International Transport Forum. 2022. Road Safety Annual Report 2022. France: The International Traffic Safety Data and Analysis Group (IRTAD). Available online: https://www.itf-oecd.org/sites/default/files/docs/irtad-road-safety-annual-report-2022.pdf (accessed on 4 April 2024).
  14. Svenson, O.; Fischhoff, B.; MacGregor, D. Perceived driving safety and seatbelt usage. Accid. Anal. Prev. 1985, 17, 119–133. [Google Scholar] [CrossRef] [PubMed]
  15. UN. 2023—UN News Global Perspective Human Stories: Extreme Weather Caused Two Million Deaths, Cost $4 Trillion over Last 50 Years. Available online: https://news.un.org/en/story/2023/05/1136897 (accessed on 30 May 2024).
  16. WBG—The World Bank Group. A Stronger, Connected, Solutions World Bank Group: An Overview of the World Bank Group Strategy. World Bank Publications—Books, The World Bank Group, Number 16093. 2019. Available online: https://documents1.worldbank.org/curated/en/602031468161653927/pdf/816970WP0v10WB0Box0379842B00PUBLIC0.pdf (accessed on 28 March 2024).
  17. UN—A/RES/74/299. Resolution Adopted by the General Assembly: Improving Global Road Safety, 2022. 74th Session, Agenda Item 12, United Nations. Available online: https://digitallibrary.un.org/record/3879711/files/A_RES_74_299-EN.pdf (accessed on 27 December 2024).
  18. Williams, A.F.; Paek, N.N.; Lund, A.K. Factors That Drivers Say Motivate Safe Driving Practices. J. Saf. Res. 1995, 26, 119–124. [Google Scholar] [CrossRef]
  19. Williams, A.F. Views of U.S. drivers about driving safety. J. Saf. Res. 2003, 34, 491–494. [Google Scholar] [CrossRef] [PubMed]
  20. Waard, D.; Jessurun, M.; Steyvers, F.J.J.M.; Reggatt, P.; Brookhuis, K. Effect of road layout and road environment on driving performance, drivers’ physiology and road appreciation. Ergonomics 1995, 38, 1395–1407. [Google Scholar] [CrossRef]
  21. Daniels, S.; Martensen, H.; Schoeters, A.; Vanden Berghe, W.; Papadimitriou, E.; Ziakopoulos, A.; Kaiser, S.; Aigner-Breuss, E.; Soteropoulos, A.; Wijnen, W.; et al. A systematic cost-benefit analysis of 29 road safety measures. Accid. Anal. Prev. 2019, 133, 105292. [Google Scholar] [CrossRef] [PubMed]
  22. Yan, J.; Zeng, S.; Tian, B.; Cao, Y.; Yang, W.; Zhu, F. Relationship between Highway Geometric Characteristics and Accident Risk: A Multilayer Perceptron Model (MLP) Approach. Sustainability 2023, 15, 1893. [Google Scholar] [CrossRef]
  23. Perry, A.; Symons, L. The wind hazard in the British Isles and its effects on transportation. J. Transp. Geogr. 1994, 2, 122–130. [Google Scholar] [CrossRef]
  24. Edwards, J. Weather-related road accidents in England and Wales: A spatial analysis. J. Transp. Geogr. 1996, 4, 201–212. [Google Scholar] [CrossRef]
  25. Williamson, A.; Friswell, R.; Olivier, J.; Grzebieta, R. Are drivers aware of sleepiness and increasing crash risk while driving? Accid. Anal. Prev. 2014, 70, 225–234. [Google Scholar] [CrossRef] [PubMed]
  26. Lanphear, F.O. Aesthetics of Highway Design. 1967. Available online: https://docs.lib.purdue.edu/cgi/viewcontent.cgi?article=3152&context=roadschool (accessed on 27 December 2024).
  27. Sentić, I.; Đorđević, T.; Đorđević, J.; Ljubojević, M.; Čukanović, J. Understanding the influence of climate elements on traffic: The wind impact approach. Theor. Appl. Climatol. 2022, 149, 661–681. [Google Scholar] [CrossRef]
  28. Antonson, H.; Mårdh, S.; Wiklund, M.; Blomqvist, G. Effect of surrounding landscape on driving behaviour: A driving simulator study. J. Environ. Psychol. 2009, 29, 493–502. [Google Scholar] [CrossRef]
  29. Horneback, P.L.; Forster, R.R.; Dillingham, M.R. Highway Aesthetics-Functional Criteria for Planning and Design in Highway Research Record. Roadside Dev. 1969, 250, 25–38. [Google Scholar]
  30. Yao, X.; Ji, B.; Mingda, L.; Yuzhuo, M.; Xin, J. Research on the Impact of Road Landscape Color on the Driving Fatigue of Drivers. IOP Conf. Ser. Earth Environ. Sci. 2020, 440, 042044. [Google Scholar] [CrossRef]
  31. Talbot, R.; Filtness, A.; Morris, A. Proposing a framework for evidence-based road safety policy-making: Connecting crash causation, countermeasures and policy. Accid. Anal. Prev. 2024, 195, 107409. [Google Scholar] [CrossRef] [PubMed]
  32. PWC. A Guide for Policy Makers: On Reducing Road Fatalities, 2017. Loughborough University. 2017. Available online: https://www.pwc.com/m1/en/publications/road-safety/pwc-guide-on-reducing-road-fatalities.pdf (accessed on 27 December 2024).
  33. Pérez de la Cruz, L.J.; Conejo-Muñoz, R.; Morales-Bueno, R.; Puy-Huarte, J. Highway design by constraint specification. Artif. Intell. Eng. 1995, 9, 127–139. [Google Scholar] [CrossRef]
  34. Rowden, P.; Matthews, G.; Watson, B.; Biggs, H. The relative impact of work-related stress, life stress and driving environment stress on driving outcomes. Accid. Anal. Prev. 2011, 43, 1332–1340. [Google Scholar] [CrossRef]
  35. Moran, J. On Roads a Hidden History; Profile books Ltd.: London, UK, 2010; pp. 1–320. [Google Scholar]
  36. Thiffault, P.; Bergeron, J. Monotony of road environment and driver fatigue: A simulator study. Accid. Anal. Prev. 2003, 35, 381–391. [Google Scholar] [CrossRef]
  37. Mitchell, S.J. Wind as a natural disturbance agent in forests: A synthesis. For. Int. J. For. Res. 2013, 86, 147–157. [Google Scholar] [CrossRef]
  38. Crowe, S. The Landscape of Roads; Architecture Press: London, UK, 1960; pp. 1–136. [Google Scholar]
  39. Horne, J.; Reyner, L. Sleep-related vehicle accidents: Some guides for road safety policies. Transp. Res. Part F 2001, 4, 63–74. [Google Scholar] [CrossRef]
  40. Dharmasena, S.; Edirisooriya, S. Impact of Roadside Landscape to Driving Behaviour; Lessons from Southern Highway, Sri Lanka. Cities People Places Int. J. Urban Environ. 2018, 3, 66–86. [Google Scholar] [CrossRef]
  41. Eck, W.R.; McGee, W.H. Vegetation Control for Safety, a Guide for Local Highway and Street Maintenance Personnel; U.S. Department of Transportation, Federal Highway Administration: Washington, DC, USA, 2008; pp. 1–45. [Google Scholar]
  42. NCDT—North Carolina Department of Transportation. Guidelines for Planting Within Highway Right-of-Way; Department of Transport, Roadside Environment Unit: Raleigh, North Carolina, 2016; pp. 1–15.
  43. Hassan, A.B.; Barker, J.D. The impact of unseasonable or extreme weather on traffic activity within Lothian region, Scotland. J. Transp. Geogr. 1999, 7, 209–213. [Google Scholar] [CrossRef]
  44. Chapman, L. Transport and climate change: A review. J. Transp. Geogr. 2007, 5, 354–367. [Google Scholar] [CrossRef]
  45. Sentić, I.; Đorđević, T. Understanding physical environment through safe highway transport mobility with special review on climate—The highway route Belgrade-Novi Sad, Serbia. Geogr. Pannonica 2019, 23, 1–13. [Google Scholar] [CrossRef]
  46. Brijs, T.; Karlis, D.; Wets, G. Studying the effect of weather conditions on daily crash counts using a discrete time-series model. Accid. Anal. Prev. 2008, 40, 1180–1190. [Google Scholar] [CrossRef] [PubMed]
  47. Forman, T.T.R.; Sperling, D.; Bissonette, A.J.; Clevenger, P.A.; Cutshall, D.C.; Dale, H.V.; Fahrig, L.; France, R.; Goldman, R.C.; Heanue, K.; et al. Road Ecology: Science and Solutions; Island Press: Washington, DC, USA, 2003; pp. 1–481. [Google Scholar]
  48. Lalić, B.; Eitzinger, J.; Dalla Marta, A.; Orlandini, S.; Firanj Sremac, A.; Pacher, B. Agricultural Meteorology and Climatology; Firenze University Press: Florence, Italy, 2018. [Google Scholar]
  49. Gao, W.; Larjavaara, M. Wind disturbance in forests: A bibliometric analysis and systematic review. Forest Ecology and Management 2024, 564, 122001. [Google Scholar] [CrossRef]
  50. Wight, B.; Straight, R. Windbreaks. In Training Manual for Applied Agroforestry Practices; Gold, M., Cernusca, M., Hall, M., Eds.; University of Missouri Center for Agroforestry: Columbia, SC, USA, 2015; pp. 92–114. [Google Scholar]
  51. Bolin, F.M.; Chesney, E.C. 4-H FORESTRY PROGRAM––Unit C-2 FOREST RECREATION. 2016. Available online: http://4hforestryinvitational.org/training/unitc2.PDF (accessed on 30 April 2018).
  52. Lorenz, H. Designing and Tracing Roads and Highways; IRO Građevinska knjiga: Belgrade, Serbia, 1980. (In Serbian) [Google Scholar]
  53. Musk, F.L. The fog hazard. In Highway Meteorology; Perry, A., Symons, L., Eds.; E&FN SPON, An Imprint of Chapman & Hall; Taylor & Francis Books: London, UK; New York, NY, USA; Tokyo, Japan; Melbourne, Australia; Madras, India, 2003; pp. 105–144. [Google Scholar]
  54. Ali, Y.; Sharma, A.; Haque, M.; Zheng, Z.; Saifuzzaman, M. The impact of the connected environment on driving behavior and safety: A driving simulator study. Accid. Anal. Prev. 2020, 144, 105643. [Google Scholar] [CrossRef]
  55. Boufous, S.; Finch, C.; Hayen, A.; Williamson, A. The impact of environmental, vehicle and driver characteristics on injury severity in older drivers hospitalized as a result of a traffic crash. J. Saf. Res. 2008, 39, 65–72. [Google Scholar] [CrossRef] [PubMed]
  56. Perrels, A.; Votsis, A.; Nurmi, V.; Pilli-Sihvola, K. Weather Conditions, Weather Information and Car Crashes. Int. J. Geo Inf. 2015, 4, 2681–2703. [Google Scholar] [CrossRef]
  57. Staricco, L. The Difficult Relationship between Land Use Planning and Transport Planning: Evidences from the City of Turin, Italy. Recent Researches in Mechanics. 2011. Available online: http://www.wseas.us/e-library/conferences/2011/Corfu/CUTAFLUP/CUTAFLUP-52.pdf (accessed on 23 November 2023).
  58. Chen, S.; Usman Saeed, T.; Alinizzi, M.; Lavrenz, S.; Labi, S. Safety sensitivity to roadway characteristics: A comparison across highway classes. Accid. Anal. Prev. 2019, 123, 39–50. [Google Scholar] [CrossRef] [PubMed]
  59. Lotan, T.; Shinar, D. Sustainable Public Safety and the Case of Two Epidemics: COVID-19 and Traffic Crashes. Can We Extrapolate from One to the Other? Sustainability 2021, 13, 3136. [Google Scholar] [CrossRef]
  60. Babić, D.; Babić, D.; Fiolic, M.; Ferko, M. Road Markings and Signs in Road Safety. Encyclopedia 2022, 2, 1738–1752. [Google Scholar] [CrossRef]
  61. Batishcheva, O.; Ganichev, A. Measures to improve traffic safety at road junctions. Transp. Res. Procedia 2018, 36, 37–43. [Google Scholar] [CrossRef]
  62. The Spatial Plan for the Infrastructure Corridor Area of the E-75 Highway Subotica-Belgrade (Batajnica) (Official Gazette RS, 69/2003, 36/2010, and 121/2014). [In Serbian]. Available online: https://pravno-informacioni-sistem.rs/eli/rep/sgrs/vlada/uredba/2003/69/2 (accessed on 27 December 2024).
  63. Haddon, W. Advances in the epidemiology of injuries as a basis for public policy. Public Health Rep. 1980, 95, 411–421. [Google Scholar]
  64. Traffic Safety Agency, Serbia, 2015. Traffic Accidents and Consequences of Traffic Accidents, Accessed on 23.09.2023. [In Serbian]. Available online: https://bazaabs.abs.gov.rs/smartPortal/saobNezgode (accessed on 27 December 2024).
  65. The Law on Road Traffic Safety (Official Gazette RS, 41/2009, 53/2010, 101/2011, 32/2013-Decision US, 55/2014, 96/2015-and Other Laws, 9/2016-Decision US, 24/2018, 41/2018, 41/2018-and Other Laws, 87/2018, 23/2019, 128/2020-and Other Laws 76/2023). [In Serbian]. Available online: https://www.mgsi.gov.rs/cir/dokumenti/zakon-o-bezbednosti-saobratshaja-na-putevima (accessed on 27 December 2024).
  66. Abdulhafedh, A. Road Traffic Crash Data: An Overview on Sources, Problems, and Collection Methods. J. Transp. Technol. 2017, 7, 206–219. [Google Scholar] [CrossRef]
  67. Mahalel, D.; Szternfeld, Z. Safety improvements and driver perception. Accid. Anal. Prev. 1986, 18, 37–42. [Google Scholar] [CrossRef] [PubMed]
  68. Lanarc Consultants Ltd. Manual of Aesthetic Design Practice. British Columbia Ministry of Transportation. 1991. Available online: https://www2.gov.bc.ca/assets/gov/driving-and-transportation/transportation-infrastructure/engineering-standards-and-guidelines/environment/madp/manual_aesthetic_design.pdf (accessed on 27 December 2024).
  69. RAA. Guidelines for the Design of Motorways. 2011. Available online: https://www.fgsv-verlag.de/pub/media/pdf/202_E_PDF.v.pdf (accessed on 27 December 2024).
  70. Road to Road. Available online: https://www.aca-europe.eu/colloquia/2006/sweden.pdf (accessed on 27 December 2024).
  71. Ring, E.; Wallgren, M.; Mårald, E.; Westerfelt, P.; Djupström, L.; Davidsson, A.; Sonesson, J. Forest roads in Sweden—Infrastructure with multiple uses and diverse impacts. Silva Fenn. 2024, 58, 24021. [Google Scholar] [CrossRef]
  72. Højring, K. The right to roam the countryside—Law and reality concerning public access to the landscape in Denmark. Landsc. Urban Plan. 2002, 59, 29–41. [Google Scholar] [CrossRef]
  73. The Law on Planning and Construction (Official Gazette RS, 72/2009, 64/2010-Decision US, 24/2011, 121/2012, 42/2013-Decision US, 50/2013-Decision US, 98/2013-Decision US, 132/2014, 145/2014, 83/2018, 31/2019, 37/2019–and Other Laws, 9/2020, 52/2021 i 62/2023). [In Serbian]. Available online: https://www.mgsi.gov.rs/lat/dokumenti/zakon-o-planiranju-i-izgradnji (accessed on 27 December 2024).
  74. The Law on Roads (Official Gazette RS, 41/2018, 95/2018-and Other Laws and 92/2023-Other Law). [In Serbian]. Available online: https://www.mgsi.gov.rs/lat/dokumenti/zakon-o-putevima (accessed on 27 December 2024).
  75. Ram, T.; Chand, K. Effect of drivers’ risk perception and perception of driving tasks on road safety attitude. Transp. Res. Part F Traffic Psychol. Behav. 2016, 42, 162–176. [Google Scholar] [CrossRef]
  76. Karlsson, M.; Johansson, M. Understanding drivers’ interaction with traffic environments—A traffic semantic approach. In Advances in Human Factors of Transportation; Praetorius, G., Sellberg, C., Patriarca, R., Eds.; Springer: Berlin/Heidelberg, Germany, 2020. [Google Scholar]
  77. Rejali, S.; Watson-Brown, N.; Kaye, S.-A.; Senserrick, T.; Oviedo-Trespalacios, O. Is it all about mobile phones? Exploring drivers’ perceptions of government information and road rules on distracted driving. Accid. Anal. Prev. 2024, 208, 107770. [Google Scholar] [CrossRef] [PubMed]
  78. Saeidi, T.; Mishra, S.; Mehran, B. Influencing factors on drivers’ support for traffic safety laws in Canada. Case Stud. Transp. Policy 2024, 15, 101150. [Google Scholar] [CrossRef]
  79. Du, Z.; Deng, M.; Lyu, N.; Wang, Y. A review of road safety evaluation methods based on driving behavior. J. Traffic Transp. Eng. 2023, 10, 743–761. [Google Scholar] [CrossRef]
  80. Dewi, A.A.D.P. Investigating Motorists Perceptions towards Road Safety. Civ. Eng. Archit. 2021, 9, 1339–1346. [Google Scholar] [CrossRef]
  81. Wigh, F. Detection of Driver Unawareness Based on Long and Short-Term Analysis of Driver Lane Keeping. Master’s Thesis, Linkopings Universitet, Linköping, Sweeden, 2007. [Google Scholar]
  82. Arnau-Sabatés, L.; Garcia, J.M.; Muñoz, M.M.; Capdevila, M.J. The relationship between awareness of road safety measure and accident involvement in pre-drivers: The basis of a road safety programme. J. Risk Res. 2013, 16, 635–650. [Google Scholar] [CrossRef]
  83. Russo, F.; Biancardo, S.A.; Dell’acqua, G. Road Safety from the Perspective of Driver Gender and Age as Related to the Injury Crash Frequency and Road Scenario. Traffic Inj. Prev. 2013, 15, 25–33. [Google Scholar] [CrossRef]
  84. Kulkarni, V.; Kanchan, T.; Palanivel, C.; Papanna, M.K.; Kumar, N.; Unnikrishnan, B. Awareness and practice of road safety measures among undergraduate medical students in a South Indian state. J. Forensic Leg. Med. 2013, 20, 226–229. [Google Scholar] [CrossRef]
  85. Mishra, S.; Mehran, B. Traffic safety culture of drivers in Canada: Implications for new traffic law implementation to enhance traffic safety. IATSS Res. 2022, 46, 82–96. [Google Scholar] [CrossRef]
  86. Tazul Islam, M.; Thue, L.; Grekul, J. Understanding Traffic Safety Culture: Implications for Increasing Traffic Safety. Transp. Res. Rec. 2017, 2635, 79–89. [Google Scholar] [CrossRef]
  87. Suzuki, K.; Tang, K.; Alhajyaseen, W.; Suzuki, K.; Nakamura, H. An international comparative study on driving attitudes and behaviors based on questionnaire surveys. IATSS Res. 2022, 46, 26–35. [Google Scholar] [CrossRef]
  88. Matijošaitienė, I.; Navickaitė, K. Aesthetics and Safety of Road Landscape: Are they Related? J. Sustain. Archit. Civ. Eng. 2012, 1, 20–25. [Google Scholar] [CrossRef]
  89. Rodrigue, J.P.; Comtois, C.; Slack, B. The Geography of Transport Systems; Routledge: New York, NY, USA; Taylor & Francis Group: Abingdon, UK, 2013; pp. 1–352. [Google Scholar]
  90. Snæbjörnsson, J.T.; Baker, C.J.; Sigbjörnsson, R. Probabilistic assessment of road vehicle safety in windy environments. J. Wind. Eng. Ind. Aerodyn. 2007, 95, 1445–1462. [Google Scholar] [CrossRef]
  91. Malin, F.; Norros, I.; Innamaa, S. Accident risk of road and weather conditions on different road types. Accid. Anal. Prev. 2019, 122, 181–188. [Google Scholar] [CrossRef] [PubMed]
  92. Clay, G.R.; Daniel, T.C. Scenic landscape assessment: The effects of land management jurisdiction on public perception of scenic beauty. Landsc. Urban Plan. 2000, 49, 1–13. [Google Scholar] [CrossRef]
  93. Ding, X.; Wang, H.; Wang, C.; Guo, M. Analyzing Driving Safety on Prairie Highways: A Study of Drivers’ Visual Search Behavior in Varying Traffic Environments. Sustainability 2023, 15, 12146. [Google Scholar] [CrossRef]
  94. Ament, R.; Jacobson, S.; Callahan, R.; Brocki, M. Highway Crossing Structures for Wildlife: Opportunities for Improving Driver and Animal Safety; Gen. Tech. Rep. PSW-GTR-271; US Department of Agriculture, Forest Service, Pacific Southwest Research Station: Albany, CA, USA, 2021; 51p. [Google Scholar]
  95. Mowen, D.; Munian, Y.; Alamaniotis, M. Improving Road Safety during Nocturnal Hours by Characterizing Animal Poses Utilizing CNN-Based Analysis of Thermal Images. Sustainability 2022, 14, 12133. [Google Scholar] [CrossRef]
  96. Montgomery, R.; Schirmer, H., Jr.; Hirsch, A. Improving Environmental Sustainability in Road Projects; International Bank for Reconstruction and Development: Washington, DC, USA, 2015. [Google Scholar]
  97. Barwise, Y.; Kumar, P. Designing vegetation barriers for urban air pollution abatement: A practical review for appropriate plant species selection. Clim. Atmos. Sci. 2020, 3, 12. [Google Scholar] [CrossRef]
  98. Marando, F.; Heris, M.H.; Zulian, G.; Udías, A.; Mentaschi, L.; Chrysoulakis, N.; Parastatidis, D.; Maes, J. Urban heat island mitigation by green infrastructure in European Functional Urban Areas. Sustain. Cities Soc. 2022, 77, 103564. [Google Scholar] [CrossRef]
  99. Lucey, A.; Barton, S. Public Perception and Sustainable Management Strategies for Roadside Vegetation. Transp. Res. Rec. 2011, 2262, 164–170. [Google Scholar] [CrossRef]
  100. Freer, R. Bio-engineering: The use of vegetation in civil engineering. Constr. Build. Mater. 1991, 5, 23–26. [Google Scholar] [CrossRef]
Figure 1. The spatial location of the Belgrade–Novi Sad highway in Serbia.
Sustainability 17 01936 g001
Figure 2. The BG–NS highway.
Sustainability 17 01936 g002
Figure 3. Different climatic influences from the surrounding landscape on the research highway surface.
Sustainability 17 01936 g003
Figure 4. The various categories of vehicles operated by the respondents.
Sustainability 17 01936 g004
Figure 5. Years of experience as an active driver.
Sustainability 17 01936 g005
Figure 6. Frequency of descriptions of responses to the questions about the BG–NS highway traffic safety.
Sustainability 17 01936 g006
Figure 7. Frequency of descriptions of responses to questions about the safeness of the highway junction points.
Sustainability 17 01936 g007
Figure 8. Number of traffic accidents on the research highway from 2016 to 2022.
Sustainability 17 01936 g008
Table 1. Evaluation of the individual variables related to the BG–NS highway.
Descriptive StatisticsNMin.MaxMeanStd.
Deviation
I often drive along the BG–NS highway route.138353.980.867
I consider the BG–NS highway route to be safe.138153.510.961
Driving is not monotonous along the route.138152.831.212
The highway signs are satisfactory.138153.540.982
The roadway is free of cracks.138152.571.100
The shoulder along the route is safe.138152.991.094
The roadway is protected from wind impact.138152.131.010
The roadway is protected from snowdrifts.138152.141.122
The highway route is always passable.138153.331.096
The roadway is protected from reflected sunlight.138152.691.119
The highway landscape vegetation does not
endanger safety.
138151.951.069
Vegetation in the highway median does not
endanger safety.
138151.871.017
The highway junction points are safe.138153.601.156
The “Kovilj” rest area satisfies the needs of drivers.138153.061.289
Animals are not endangered by the highway traffic.138153.041.328
Table 2. Frequency of descriptions of responses of the answers that evaluate a more detailed understanding of traffic safety from the point of view of the respondents.
The BG–NS Highway:
The Examined Variables
Do Not Agree at AllPartly
Disagree
Agree and DisagreePartly AgreeCompletely Agree
Frequency%Frequency%Frequency%Frequency%Frequency%
The shoulder along the route is safe.1611.52014.52820.333244129.7
The highway signs are satisfactory.18132014.53726.82820.33525.4
The roadway is free of cracks.2921.013424.64633.32518.0942.9
The roadway is protected from wind impact.4532.64633.33223.21410.110.7
The roadway is protected from snowdrifts.5338.43525.43122.51611.632.2
The roadway is protected from reflected sunlight.2316.74129.73424.63626.142.9
Table 3. The Pearson coefficient of correlation evaluating safety parameters from the drivers’ point of view.
The BG–NS HighwayThe Highway Signs Are SatisfactoryThe Roadway Is Free of CracksThe Roadway Is Protected From SnowThe Highway Route Is Always PassableThe Highway Junction Points Are SafeAnimals Are Not Endangered by the Highway Traffic
I often drive along the BG–NS
highway route
Pearson Correlation (r)−0.326 **−0.301 **−0.0940.008−0.271 **0.330 **
Sig. 2-tailed (p)0.0080.0000.2700.9290.0010.007
N138138138138138138
I consider the BG–NS
highway route to be safe
Pearson Correlation (r)0.518 **0.628 **0.307 **0.483 **0.387 **−0.513 **
Sig. 2-tailed (p)0.0000.0000.0000.0000.0000.000
N138138138138138138
** A correlation is significant when p ≤ 0.01.
Table 4. An independent sample analysis of two groups of respondents using the t-test method.
Group Statistics
Overall safety
rating
genderNMeanStd. DeviationStd. Error Mean
male1072.84910.431670.04173
female312.60930.434750.07808
Independent Sample Test
Overall safety
rating
Levene’s Test for Equality of
Variances
t-test for Equal Means
95% Confidence Interval of Difference
FSig. (p)tdfSig. 2-tailed (p)Lower boundUpper bound
Equality of variances is assumed0.1120.7382.7191360.0070.065370.41416
Equality of variances is not assumed2.70848.4660.0090.061790.41773
Table 5. One-factor analysis of variance of the overall highway traffic safety in relation to the years of driving experience.
Test of Homogeneity of Variances
Levene’s statisticdf1df2Sig. (p)
1.25621350.288
Analysis of Variances (ANOVA)
F-testdfFSig. (p)
Between the groups23.1010.058
Withinthe group135
Table 6. One-factor analysis of variance of the overall highway traffic safety in relation to the category of motor vehicle.
Test of Homogeneity of Variances
Levene’sstatisticdf1df2Sig. (p)
0.60831330.611
Analysis of Variances (ANOVA)
F-testdfFSig. (p)
Between the groups36.7710.000
Withinthe group133
Multiple Comparisons: Scheffe Post HocTest
(I) Motor vehicle(J) Motor vehicleDifferences between values of arithmetic means (I-J)Std. ErrorSig.95% confidence interval of difference
Lower boundUpper bound
CarTruck−0.34722 *0.096750.006−0.6212−0.0733
Bus0.083330.096750.863−0.19060.3573
Tanker truck−0.453700.192420.141−0.99860.0911
TruckCar0.34722 *0.096750.0060.07330.6212
Bus0.43056 *0.120660.0070.08890.7722
Tanker truck−0.106480.205490.966−0.68830.4754
BusCar−0.083330.096750.863−0.35730.1906
Truck−0.43056 *0.120660.007−0.7722−0.0889
Tanker truck−0.537040.205490.083−1.11890.0448
Tanker truckCar0.453700.192420.141−0.09110.9986
Truck0.106480.205490.966−0.47540.6883
Bus0.537040.205490.083−0.04481.1189
* The difference in arithmetic means is significant for a value of 0.05 and over.
Table 7. The Pearson coefficient of correlations that evaluate the relationship between the influence of climatic elements and traffic safety.
The BG–NS HighwayThe Roadway Is
Protected from
Snowdrifts
The Roadway Is
Protected from
Reflected Sunlight
The roadway is protected from wind impactsPearson correlation (r)0.848 **0.488 **
Sig. 2-tailed (p)0.0000.000
N138138
** a correlation is significant when p ≤ 0.01.
Table 8. Frequency of descriptions of responses to questions about the presence of vegetation and animals along the roadway of the BG–NS highway.
The BG–NS Highway:
The Crossing of Examined Variables
Do Not
Agree at All
Partly
Disagree
Agree and DisagreePartly AgreeCompletely Agree
Frequency%Frequency%Frequency%Frequency%Frequency%
The vegetation in the
highway landscape
endangers traffic safety.
58424834.8181396.553.6
The vegetation on the
highway median endangers
safety.
6244.94633.32115.242.953.6
Animals are not endangered by highway traffic.2618.81913.83726.83525.42115.2
Table 9. The Pearson coefficient of correlations evaluating the influence of vegetation and the effects of climatic elements.
The BG–NS HighwayThe Roadway Is Protected from Wind Impact.The Roadway Is Protected from Snowdrifts.The Roadway Is Protected from Reflected Sunlight.
The vegetation in the highway landscape endangers traffic
safety.
Pearson Correlation (r)0.1480.128−0.196 *
Sig. 2-tailed (p)0.0830.1360.021
N138138138
The vegetation on the highway median
endangers safety.
Pearson Correlation (r)0.0020.009−0.267 **
Sig. 2-tailed (p)0.9770.9120.002
N138138138
* A correlation is significant when p ≤ 0.05; ** a correlation is significant when p ≤ 0.01.
Disclaimer/Publisher’s Note: The statements, opinions and data contained in all publications are solely those of the individual author(s) and contributor(s) and not of MDPI and/or the editor(s). MDPI and/or the editor(s) disclaim responsibility for any injury to people or property resulting from any ideas, methods, instructions or products referred to in the content.

