Article

Valorisation of Red Mud: Disclosing the Potential of an Abundant Residue

by
Carlos A. Vielma
1,
Adela Svobodova-Sedlackova
1,2,3,*,
Josep Maria Chimenos
1,
Ana Inés Fernández
1,
Carlos Berlanga
2,3,
Rafael Rodriguez
2,3 and
Camila Barreneche
1
1
Departament de Ciència de Materials i Química Física, Universitat de Barcelona, C/Martí i Franqués 1, 08028 Barcelona, Spain
2
Engineering Department, Public University of Navarre, Campus Arrosadía S/N, 31006 Pamplona, Spain
3
Institute for Advanced Materials and Mathematics (INAMAT2), Public University of Navarre, Campus Arrosadía S/N, 31006 Pamplona, Spain
*
Author to whom correspondence should be addressed.
Sustainability 2025, 17(5), 1849; https://doi.org/10.3390/su17051849
Submission received: 17 January 2025 / Revised: 15 February 2025 / Accepted: 17 February 2025 / Published: 21 February 2025
(This article belongs to the Section Waste and Recycling)

Abstract

:
Red mud (RM), the primary waste product of the aluminium industry, is notable for its high concentrations of metals and rare earth elements (REE). Efforts have been made to develop extraction methods for REE recovery from RM, aiming to enhance its valorisation and reduce the European reliance on external REE sources—particularly crucial for technological advancements and the transition to renewable energy. However, these methods have only been limited to low technology readiness levels (TRLs), with no economically or technically viable processing routes yet defined to enable large-scale industrialisation within a circular economy model. This study characterised RM samples from the Seydişehir region in Türkiye using different techniques and explored the experimental process for recovering metals and REE. Moreover, the study assessed the global prospective potential of RM based on technical and economic data, as well as the sustainability of the implemented process through the life cycle assessment (LCA) tool. Results showed a total REE concentration of up to 1600 ppm, with Ce, being the most abundant (426 ± 27 ppm), followed by La, Nd, and Sc. Concentration efficiencies for La and Nd ranged between 240–300%. Sc, Y, Ce, La, and Nd have significant usage in European markets and represent prime RM targets for further prospecting. The LCA revealed that the highest global warming potential of the sequential extraction process was attributed to hydroxylamine hydrochloride and hydrogen peroxide. The findings highlight the need to explore alternative, more eco-friendly reagents to improve RM valorisation.

1. Introduction

Bauxite residue, also known as red mud (RM), is the main residue of the Bayer process, in which alumina is obtained for subsequent use to produce aluminium. Approximately 1–2.5 tons of RM are produced per ton of aluminium hydroxide, reaching a global stockpile of over 4 billion tons [1], increasing by approximately 175 million tons annually [2]. RM mineralogical composition is based mainly on iron, aluminium, silicon, calcium, and titanium oxides as well as smaller concentrations of rare earth elements (REE) [3]. This residue constitutes a significant environmental concern, and handling it remains a global challenge given the substantial volumes produced and the adverse effects associated with its disposal [4]. It is primarily handled through dry stacking (70%) or storage in ponds (30%), though often with limited effectiveness [5]. Due to its high alkalinity, high heavy metal content, and trace of radioactive elements, RM causes significant environmental issues, including pollution of soil, surface water, and groundwater and dispersion of fine-grained particles [6,7]. Finding a single cost-effective and sustainable method for RM management remains a major challenge [8]. In addition, the variability of the RM composition is notable in terms of main and minor components. However, several studies reveal that this variability is within the range of the vast amounts of by-products used in industry [6,7].
Efforts to reduce RM disposal have explored its potential valorisation in several applications, including (i) environmental uses: water purification, desulphurisation, and soil remediation [9,10]; (ii) formulation of construction material: cement, glass ceramics, and bricks [11,12]; and (iii) geotechnical engineering [13]. Due to its valuable composition, RM is also considered a potential secondary source of REE and other metals [1,14,15,16,17]. Achieving this involves developing and implementing multiple extraction and purification processes, which are quite complex. However, the rising demand and price of REE have increased interest in their extraction from RM [3].
The acquisition of REE, neither earth nor rare, has changed geopolitical paradigms. The search and identification of REE constitute an essential part of the scientific and technological development of the late 19th and early 20th centuries. REE are made up of 17 elements from the lanthanide series in group IIIB of the periodic table of elements (La, Ce, Pr, Nd, Pm, Sm, Eu, Gd, Tb, Dy, Ho, Er, Tm, Yb, and Lu). Sc and Y are also included due to their similar chemical behaviour. Primary REE deposits include carbonatites, alkaline igneous rocks and pegmatites, while secondary sources consist of laterites and ion-adsorption clays. Despite over 250 rare earth minerals, only a few such as bastnaesite, monazite and xenotime are economically mineable [18].
REE are essential for various high-tech industries, such as renewable energies, batteries, phosphors, catalysts, petroleum refining, ceramic, and metallurgy. By the end of 2023, global rare earth oxide (REO) production reached 350,000 tons, with reserves estimated at 110 million tons [19]. China dominates REE supply, controlling 38% of global reserves [20] and accounting for approximately 58% of global production in 2020 [18]. The European Union (EU) has experienced a notable rise in REE imports, reaching 18,000 tons in 2022—60% higher than in 2019 [21]. Recognising their importance, the EU has classified REE as critical raw materials (CRMs) [22,23] and heavily relies on China to meet their demand.
Ensuring a stable REE supply has demonstrated challenging. Trade policies, industrial adjustments, and innovation strategies should be implemented to reduce this dependency [24,25]. Consequently, it is critical to characterise the RM potential as a REE source and develop innovative and feasible extraction methods.
Globally, approximately 9.14 million tons of REE remained within stockpiled RM by 2019 [26]. The industrial-scale recovery of these elements has the potential to release around USD 4.3 trillion worth [16]. However, RM valorisation remains technologically unviable. This presents a fascinating area for further research, especially since extracting metals from mines and industrial waste is often more economically feasible than mining primary deposits [27].
Analysing REE concentrations in RM is crucial to evaluating its prospective potential as a secondary raw material. While numerous studies have reported REE concentrations in RM, a comprehensive global assessment of its potential as a secondary REE source remains incomplete. Additionally, the environmental sustainability of REE extraction from RM has not been deeply addressed.
This work aims to (i) physiochemically characterise RM samples from Türkiye, (ii) perform a five-step sequential extraction process to assess the technical feasibility of REE recovery, and (iii) evaluate the prospective potential of RM as an alternative REE source based on relative concentrations and market demand. Furthermore, this research uses the life cycle assessment (LCA) tool to assess the environmental sustainability of the sequential extraction process in terms of its global warming potential. The analysis integrates chemical, geological, production, environmental, and market data, focusing on European resource independence.

2. Material and Methodology

2.1. Materials

The Turkish Company ETI Alüminyum A.Ş (Konya, Turkey) supplied the RM samples. The Mortaş and Doğankuzu bauxite deposits, operated by ETİ Aluminum A.Ş, are the most significant aluminium sources in the Akseki region of Southern Türkiye and provide the raw material for the country’s aluminium smelter in Seydişehir region [28]. The sample’s previous characterisation was left for 72 h in an oven at 105 °C to remove possible moisture. This was followed by grounding in an agate mortar to reduce particle size and homogenise the sample. Finally, a standard quartering method was followed to obtain representative subsamples for further analysis.

2.2. Methodology

2.2.1. Characterization Techniques

An air-suspended particle size distribution (PSD) by volume was determined with a laser diffraction particle size analyser (Beckman Coulter LSTM 13 320, Beckman Coulter Life Sciences, Indianapolis, IN, USA). Three independent samples were analysed, with three repetitions conducted for each sample to ensure accuracy and consistency in the results.
The crystallographic phases of the samples were identified using an X-ray powder diffraction (XRD) with the PANalytical X’Pert PRO. CoKα (λ = 1.79 Å) radiation with a voltage of 40 kV and a tube current of 45 mA were used. 2θ/θ scan from 7 to 125° 2θ with step size of 0.017° and measuring time of 100 s per scan.
The semi-quantitative analysis of trace, minor and major elements was conducted using X-ray fluorescence (XRF, Malvern Panalytical, Almelo, The Netherlands) with a Panalytical Axios Advanced wavelength dispersive X-ray spectrometer. To analyse trace elements, the sample pellets were made with 6 g of the sample mixed with Resine (Elvacite®, Chempoint, The Netherlands). For minor and major elements, the powder sample (0.3 g) was mixed with flux in a 1:20 proportion and then melted at 1200 °C for 11 min in a melting machine (PERL X3, Philips, Amsterdam, The Netherlands), obtaining a glass bead-shaped sprue. For both techniques, four replicates were performed per sample.
Inductively coupled plasma atomic emission spectroscopy (ICP-OES) using a PerkinElmer ELAN 6000 ICP mass spectrometer (PerkinElmer, Waltham, MA, USA) and inductively coupled plasma mass spectrometry (ICP-MS) with the PerkinElmer Optima 3200R spectrometer were performed to identify and quantify the metal and metalloid content in the sample’s composition. The samples were prepared through an alkaline fusion, which involves mixing the sample with an alkaline flux and then performing an acid digesting in a zirconium crucible; 0.1 g of RM sample was mixed with 1 g of sodium peroxide (Na2O2) and 0.5 g of sodium hydroxide (NaOH), and the mixture was heated in an oven until 470 °C.

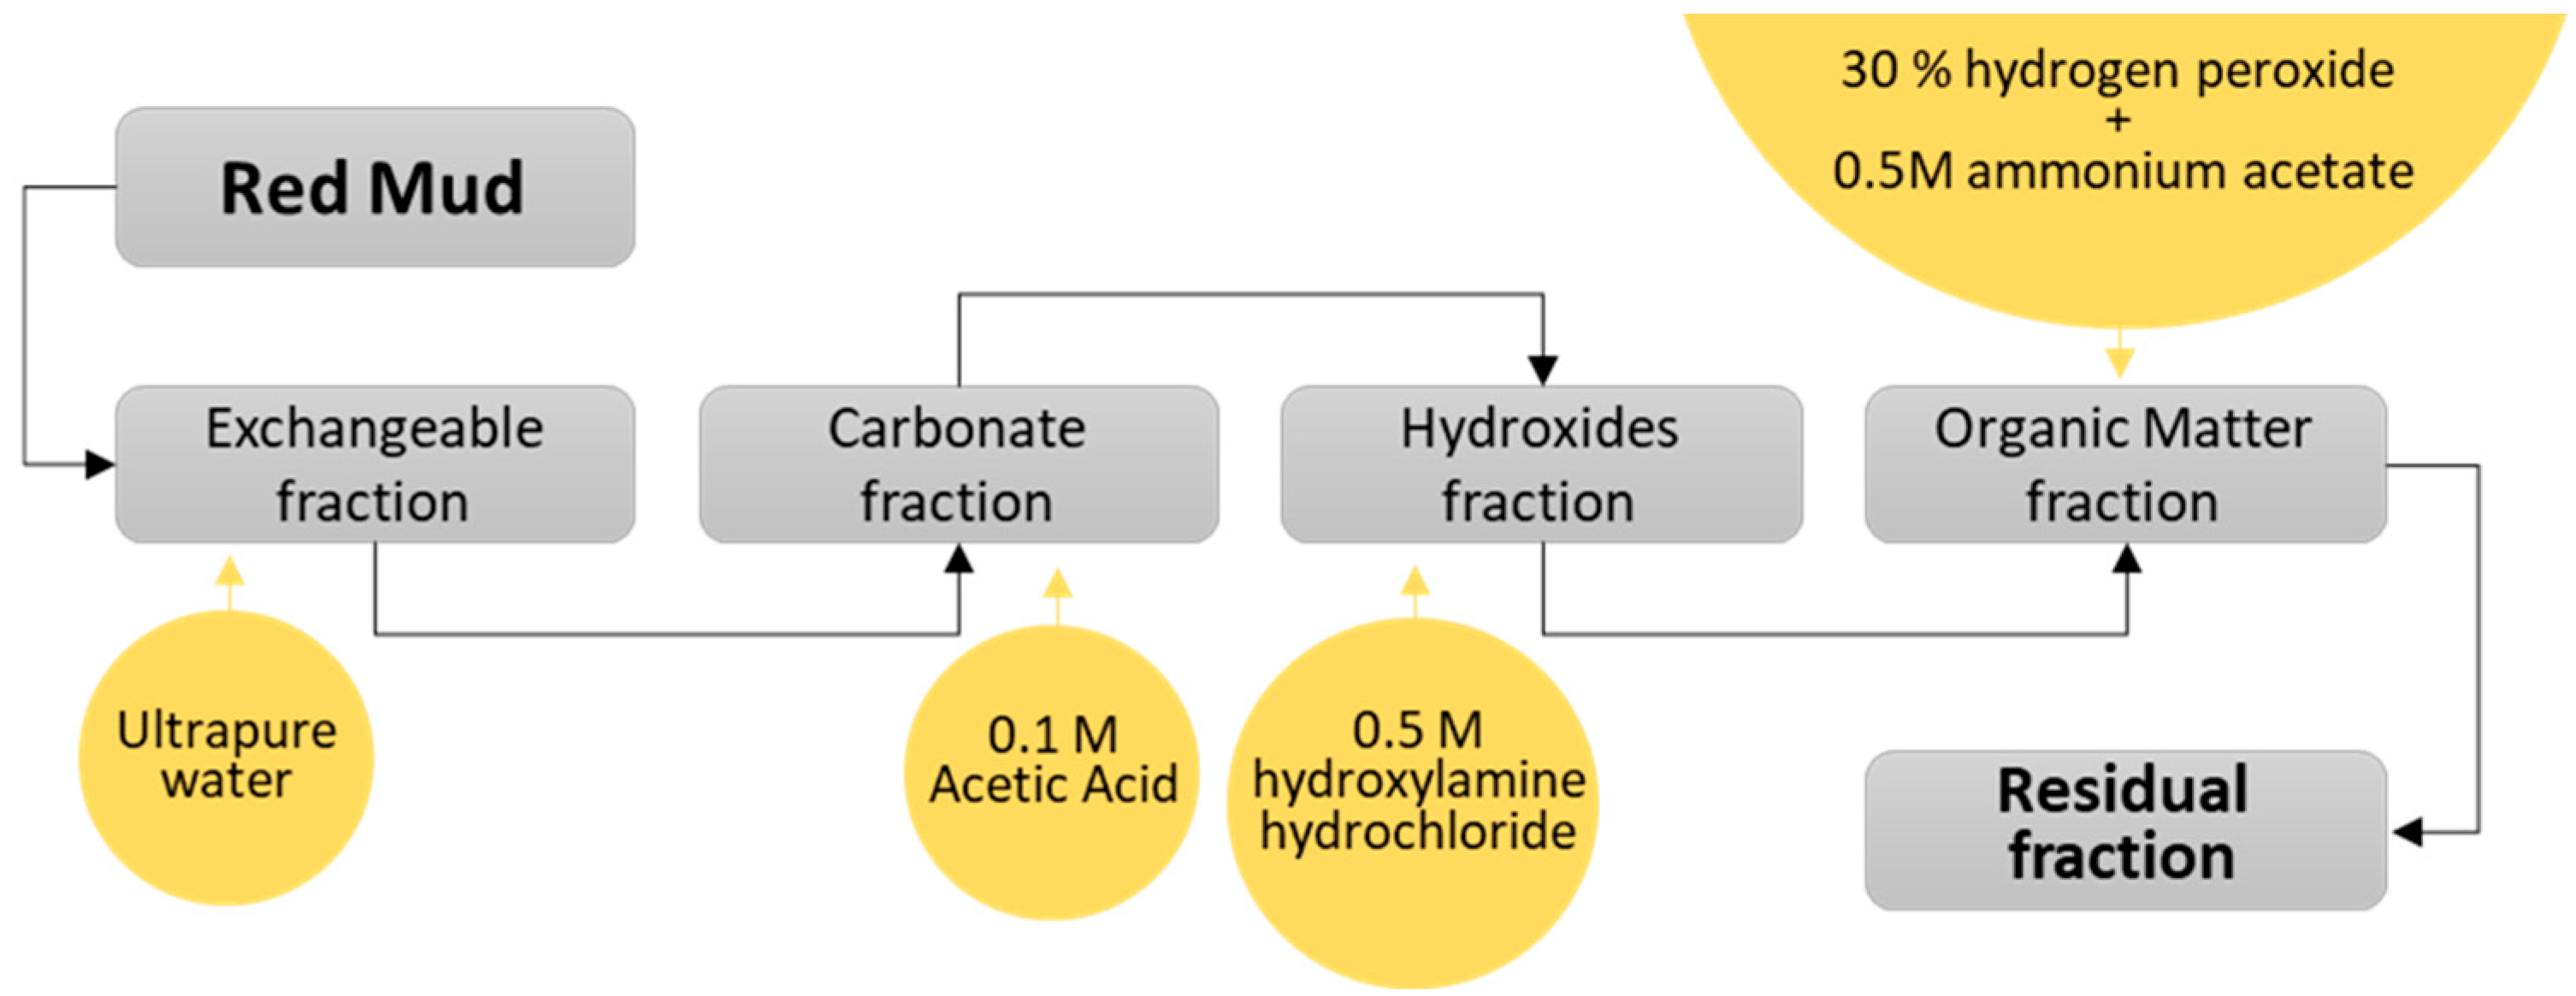
2.2.2. Sequential Extraction Procedure

A modified 5-step sequential extraction procedure developed by [29] was followed, Figure 1.
Each step is described in the following:
  • Exchangeable fraction (Step 1): 5 g of RM sample were weighed and stirred for 16 h at room temperature with 200 mL of ultrapure water and covered with watch glasses.
  • Carbonate fraction (Step 2): The residue obtained in Stage 1 (Residue 1) was stirred for 16 h at room temperature with 200 mL of 0.1 M acetic acid (CH3COOH), covering the beakers with watch glasses.
  • Hydroxides fraction (Step 3): The residue obtained in Step 2 (Residue 2) was stirred for 16 h at room temperature with 200 mL of 0.5 M hydroxylamine hydrochloride (NH2OH·HCl; pH = 2–3), covering the beakers with watch glasses.
  • Organic matter fraction (Step 4): The residue obtained in Step 3 (Residue 3) was stirred for 1 h at room temperature with 50 mL of 30% hydrogen peroxide (H2O2) covering the beaker with watch glasses. The watch glasses were removed, and the solution was again stirred for 1 h in a water bath at 85 ± 5 °C. Subsequently, a further 50 mL of 30% H2O2 was added. This solution was covered with a watch glass, and the agitation was stopped. The water bath was kept at the same temperature for another hour. Finally, the solution was removed from the water bath, and 250 mL of 0.5 M ammonium acetate (NH4CH3COO) was added and stirred at room temperature for 16 h [30].
  • Residual fraction (Step 5): The residual fraction from Step 4 (Residue 4) was subjected to an alkaline fusion.
After each step, the leachates were analysed by ICP-OES and ICP-MS, and the residual fraction was treated with alkaline fusion. XRD also investigated the residue fractions obtained in the first four stages.

2.2.3. Life Cycle Assessment

The life cycle assessment (LCA) methodology is regulated by the ISO 14040 [31] and ISO 14044 [32] standards. The software GaBi [33], the Ecoinvent 3.9.1 database [34], and the IPCC GWP 2013 impact evaluation method were used to assess the potential greenhouse gas emissions associated with the materials and equipment used in the leaching process. The IPCC GWP 2013 method estimates the greenhouse gas relative contribution to global warming compared to the impact of 1 kg of carbon dioxide emissions (CO2eq) [35]. The system boundaries included the first four steps of the REE lixiviation process as described in the previous section (gate-to-gate perimeter). The quantity of input material or intermediates needed to produce 1 kg of REE could not be precisely determined. Therefore, the functional unit (FU) chosen was “1 kg of processed RM”. The life cycle inventory (LCI) data were measured and compiled at the laboratory scale (Table 1) following the datasheet proposed by Grzesik et al. [36]. At this scale, direct emissions to the air and other releases were not measured. The outcomes of this section are presented in Section 4.3.

3. Results

3.1. Physicochemical Characterisation of RM

The particle size distribution of RM is characterised by a fine grain size, with approximately 90% of particles (d90) being smaller than 75 μm. Based on the analysis of three independent samples, the average particle size (d50) by volume of the sample is 34.7 ± 0.6 μm.
The semi-quantitative chemical characterisation of RM, conducted by XRF, enabled the determination of the major, minor, and trace element contents. The results for major and minor elements are presented in Table 2, while those for trace elements are shown in Table 3.
As expected, the chemical composition results, expressed as oxides, indicated that RM has high iron content, with Fe2O3 accounting for 33.3 ± 0.1 wt.%, followed by a significant amount of aluminium (Al2O3 20.6 ± 0.1 wt.%) and silica (SiO2 13.9 ± 0.2 wt.%). RM composition depends on the location of the mine, the type of bauxite, and the Bayer process parameters. The main chemical composition aligns with the results provided by other researchers [4,37,38,39,40]. In addition to the typical bauxite composition, there are also compounds such as CaO and alkalis, which are added during the refining process [8].
The trace elements concentration, as described in Table 3, revealed the presence of 27 elements in the samples, with Zr, Cr, Ce, Ni, and V being the most abundant. Additionally, the sample contains about 1065 ppm of elements from the lanthanide series.
Figure 2 shows the RM sample’s main crystalline phases, determined by XRD. The diffraction pattern identifies three main mineral phases: hematite, calcite, and gibbsite, consistent with the findings of other studies [40,41,42,43,44,45,46,47,48].
After the semi-quantitative analysis by XRF, the concentration of REE and Th in RM samples were analysed quantitatively through chemical analysis using ICP-OES (Figure 3). This analysis was conducted following the alkaline fusion and subsequent acid digestion of the samples, as described above. The sample contained over 1635 ppm of REE and Th. The REE were further classified into light rare earth elements (LREE), including La, Ce, Pr, Nd, Pm, Sm, and Eu, and heavy rare earth elements (HREE), including Gd, Tb, Dy, Ho, Er, Tm, Yb and Lu. Additionally, Y and Sc were analysed separately. Through this classification, the RM sample showed an average concentration of LREE = 1105 ppm, HREE = 126 ppm, and Y o Sc = 281 ppm. Among them, Ce was the most abundant element with a concentration of 589 ± 25 ppm, followed by La, Nd, and Sc, consistent with the findings reported for most RM samples in the literature [49]. The remaining elements are present in trace amounts (≤100 μg/g). Nevertheless, the REE are relatively abundant as expected, except for Nd, which is more abundant than other regional RM [37,50,51]. Additionally, all the trace elements detected in XRF were analysed quantitatively by ICP, and the results corroborate those presented in Table 2 and Table 3.

3.2. Sequential Extraction

The extraction of REE from RM primarily involves two main approaches: purely hydrometallurgical methods or a combination of pyrometallurgical and hydrometallurgical processes, referred to as complex processing. In combined treatments, the pyrometallurgical step is usually performed first to recover iron from RM and concentrate the REE into an oxide slag. Hydrometallurgical methods then selectively leach the trace metals, including REE, from the residue. A significant finding is that REEs are readily leachable using diluted mineral acids, whereas most elements, such as iron, remain non-leachable under the same conditions [52].

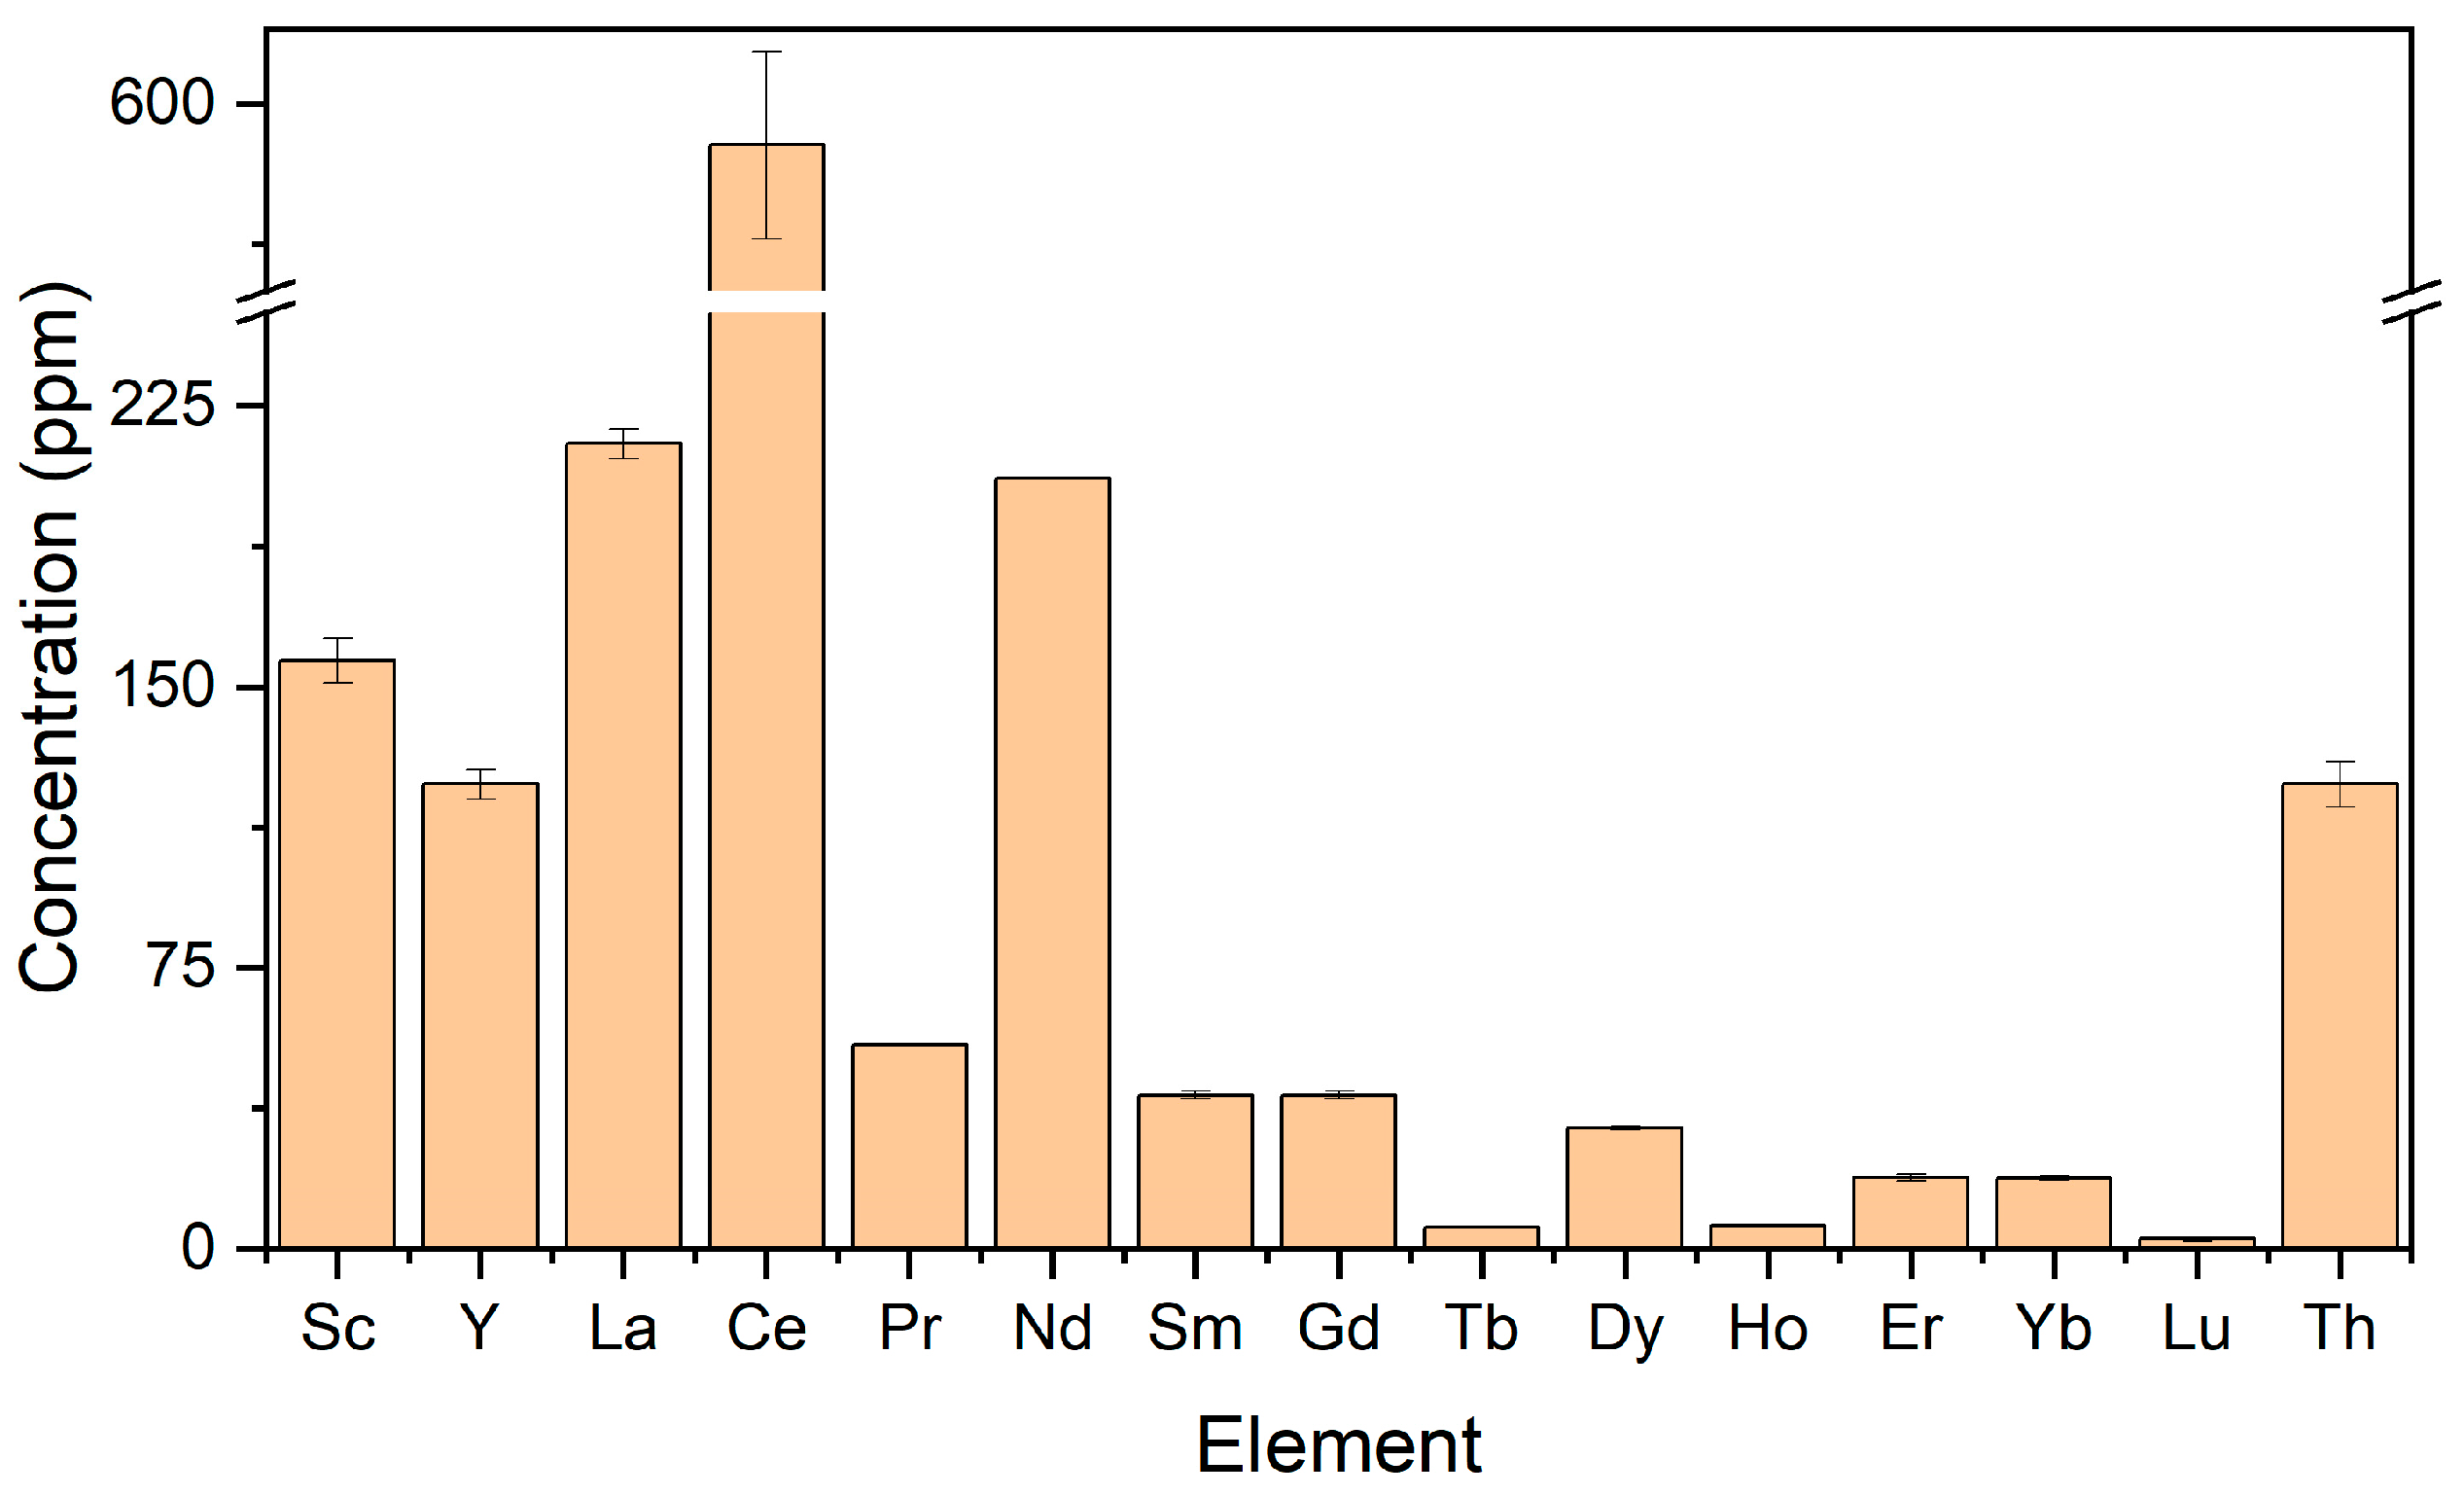
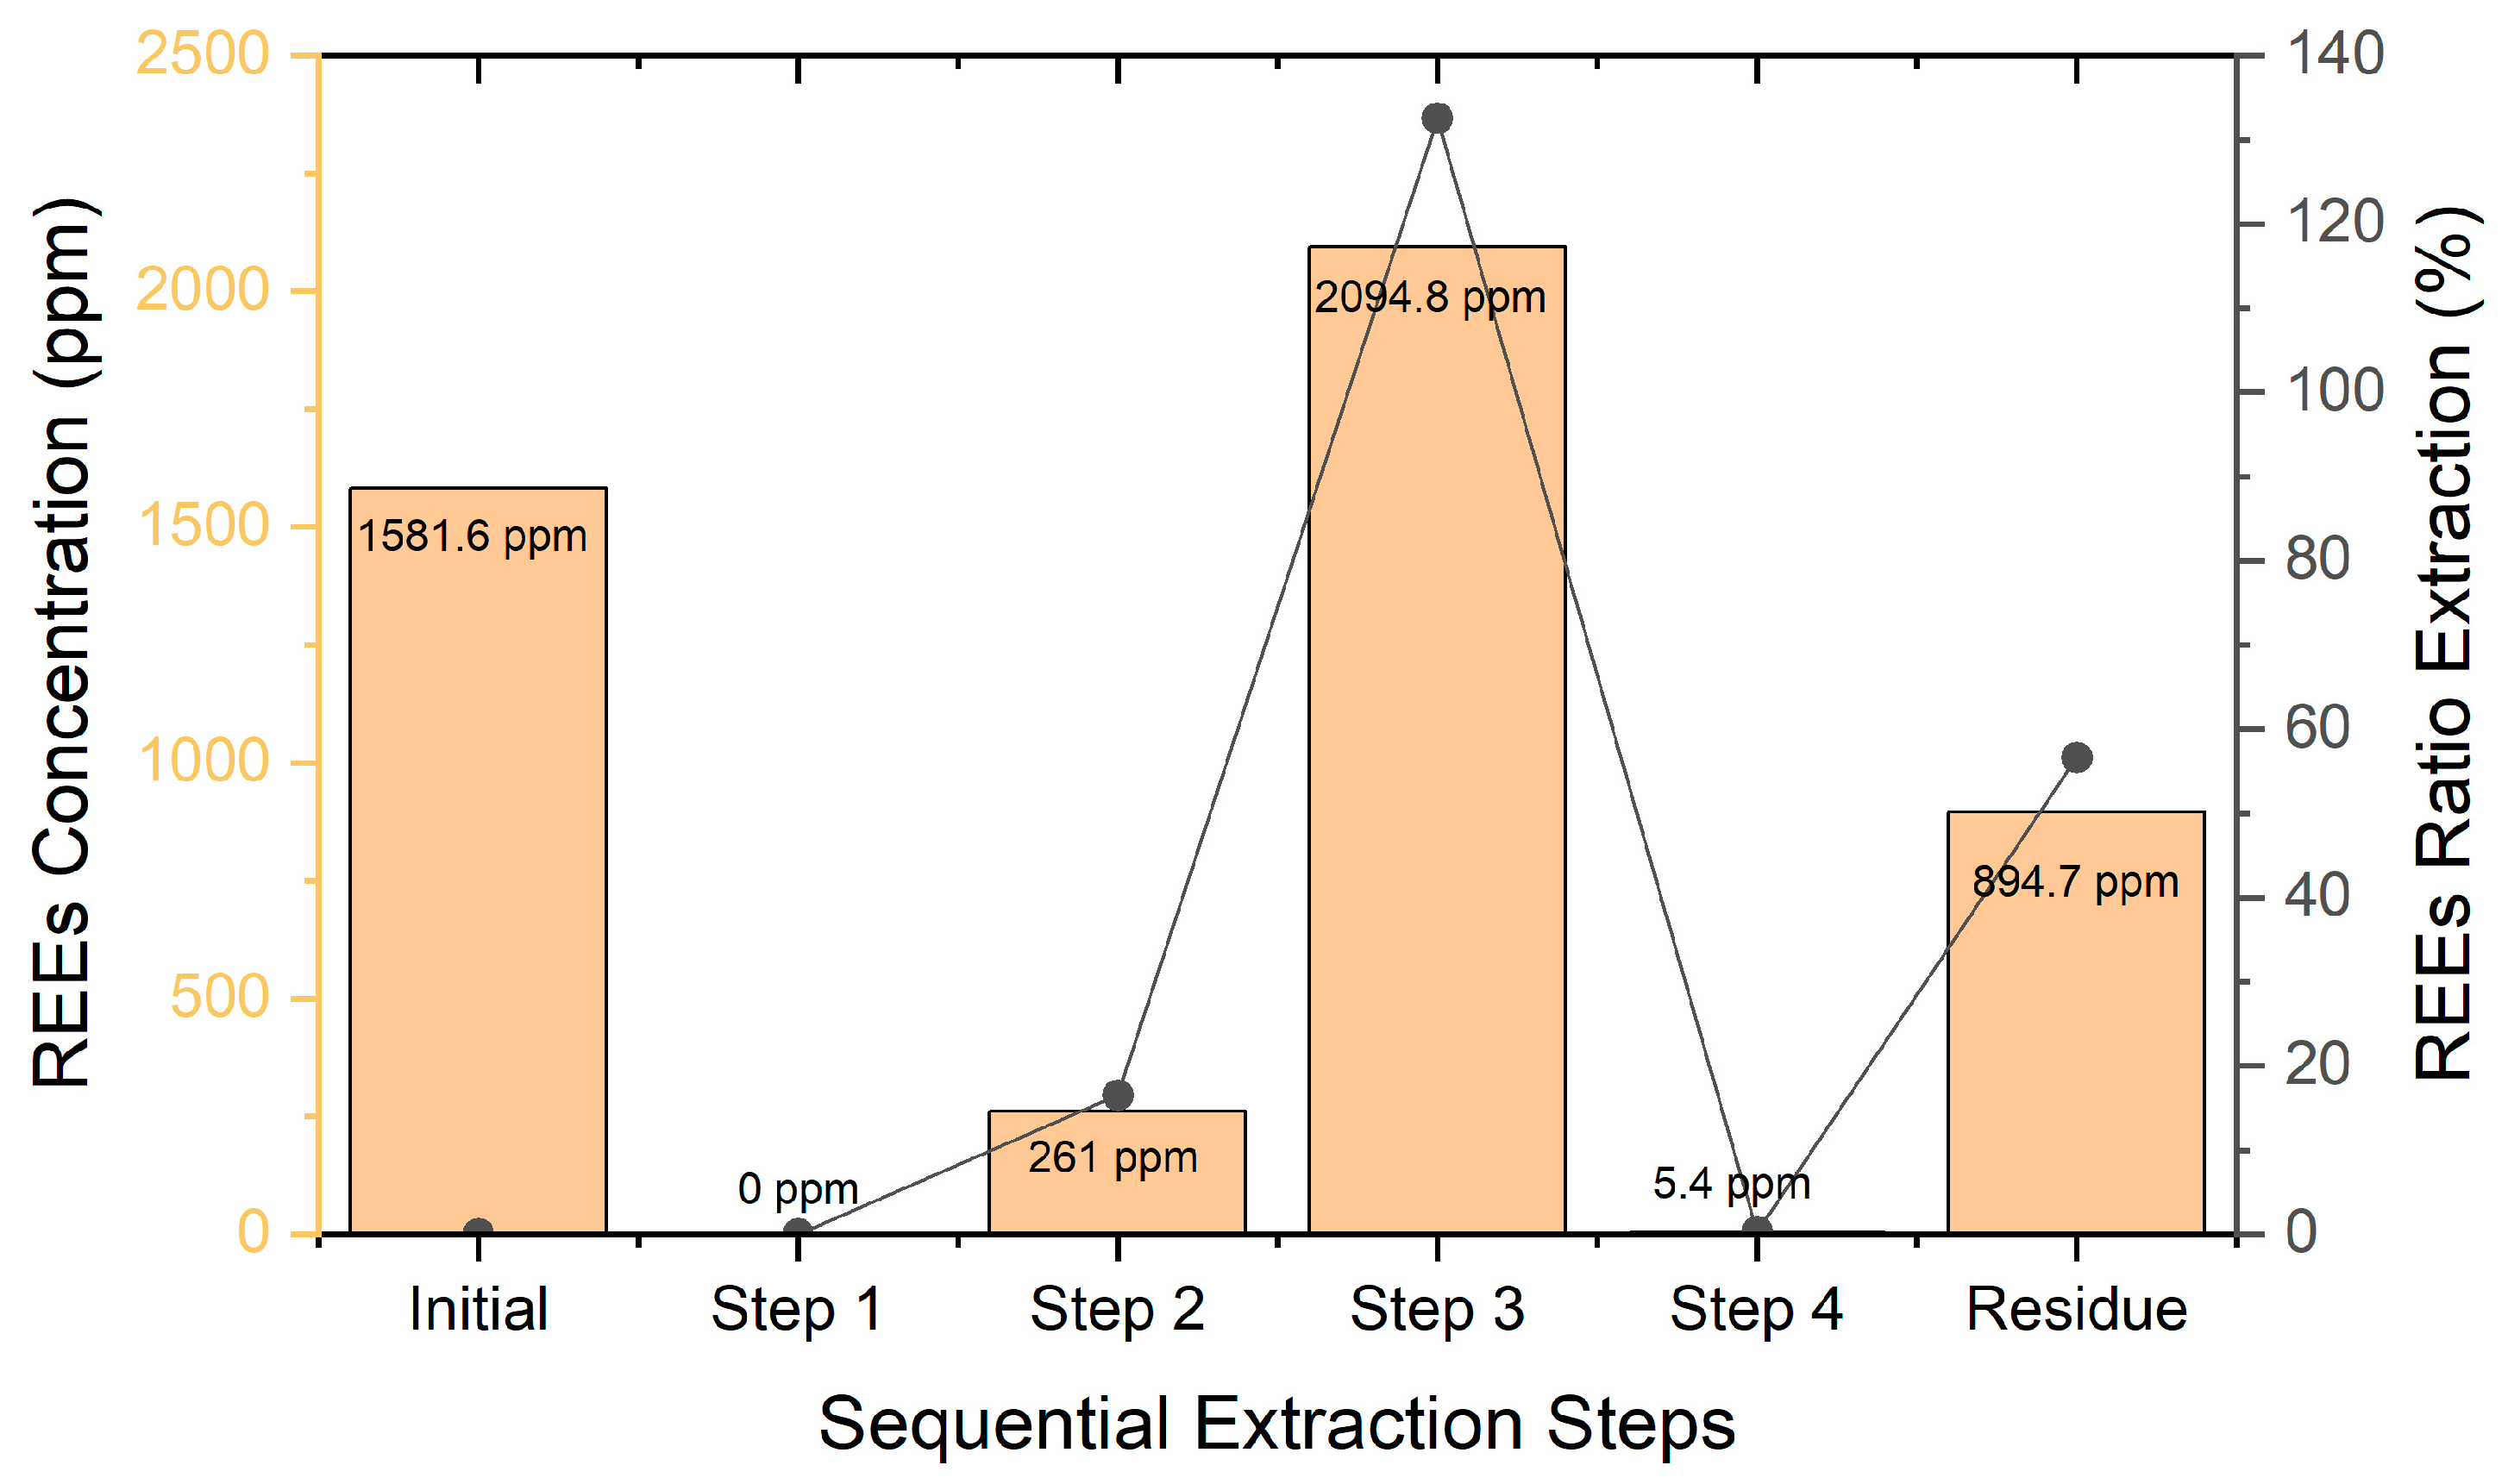
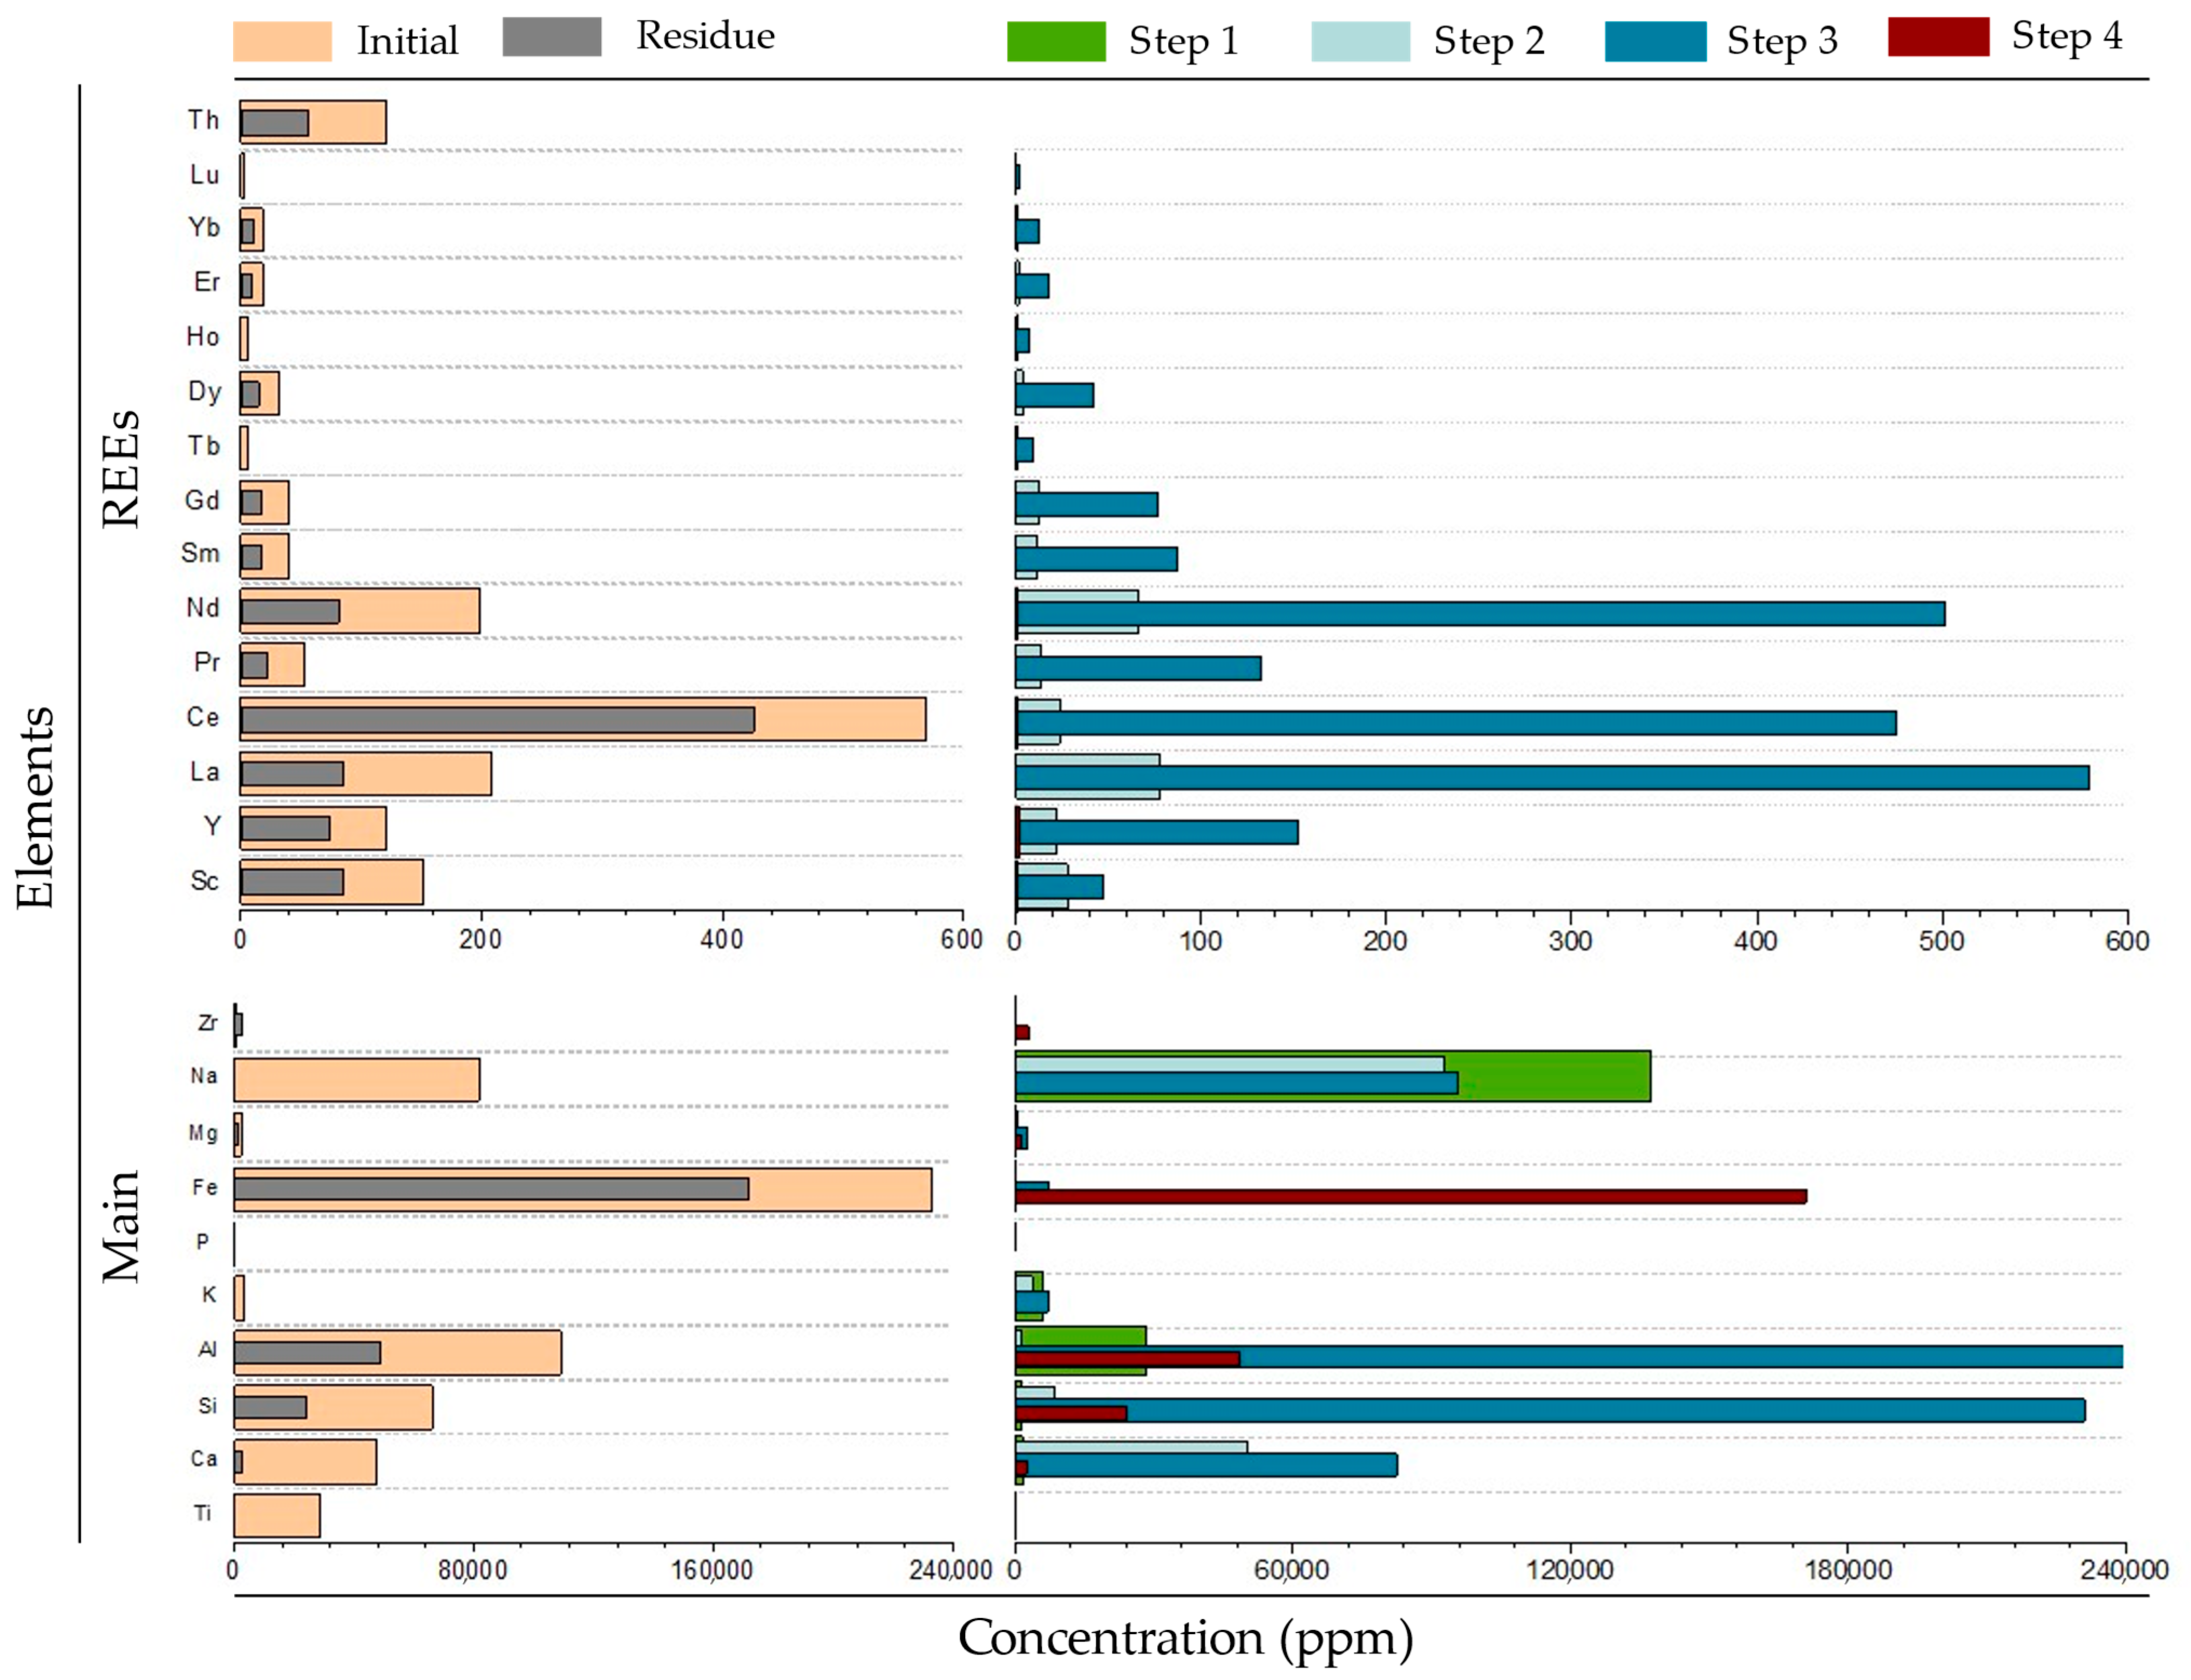
3.2.1. Extraction of REE and Other Valuable Elements

Figure 4 illustrates the total concentration of REE leached during each stage of the sequential extraction process. Step 3, where the sample underwent an acid attack using hydroxylamine hydrochloride, exhibited the highest efficiency in REE concentration, reaching over 2000 ppm—an increase of 32% compared to the initial sample. Moreover, the concentration was significantly reduced in the final residue of the process. In contrast, the efficiency of steps 1, 2, and 4 was negligible, indicating that the mineralogical phases of the RM remained largely unaffected by these treatments.
To gain deeper insights into the sample’s chemistry, Figure 5 presents the variation in the concentration of each analysed REE alongside the main elements constituting the sample. The first column (orange and grey bars) represents the initial and final concentrations of each element in the residue. The second column shows the concentration of these elements across the sequential extraction stages. Nd, Ce, La, and Y stand out with significantly higher concentrations in step 3 compared to the other REE analysed, reaching 500 ppm for Nd and Ce and up to 600 ppm for La. These concentrations are promising for the technical and economic feasibility of their extraction.
Regarding the major associated elements, the variation in Al, Si, and Fe concentrations within the residue is noteworthy. Higher leaching of Al and Si is observed in Step 3, alongside the REE, suggesting that the higher reducible fraction corresponds to the dissociation of Al hydroxide and oxyhydroxide phases [28].

3.2.2. RM Residue After Sequential Extraction

Table 4 presents the average concentration of minor and trace elements in the final residue obtained from the sequential extraction process, along with their variation relative to the original RM sample. Most elements were found at lower concentrations in the residue compared to the initial sample, except for Zr, Pb, Cu, Ba, Sn, and Co. Notably, Zr and Ba were significantly more concentrated. The most relevant finding is the reduced concentration of REE in the residue, corroborating that the proposed extraction process effectively separates REE from the remaining RM. Consequently, the residue is enriched in iron, which could be repurposed for other applications, thereby enhancing the overall value of the process.

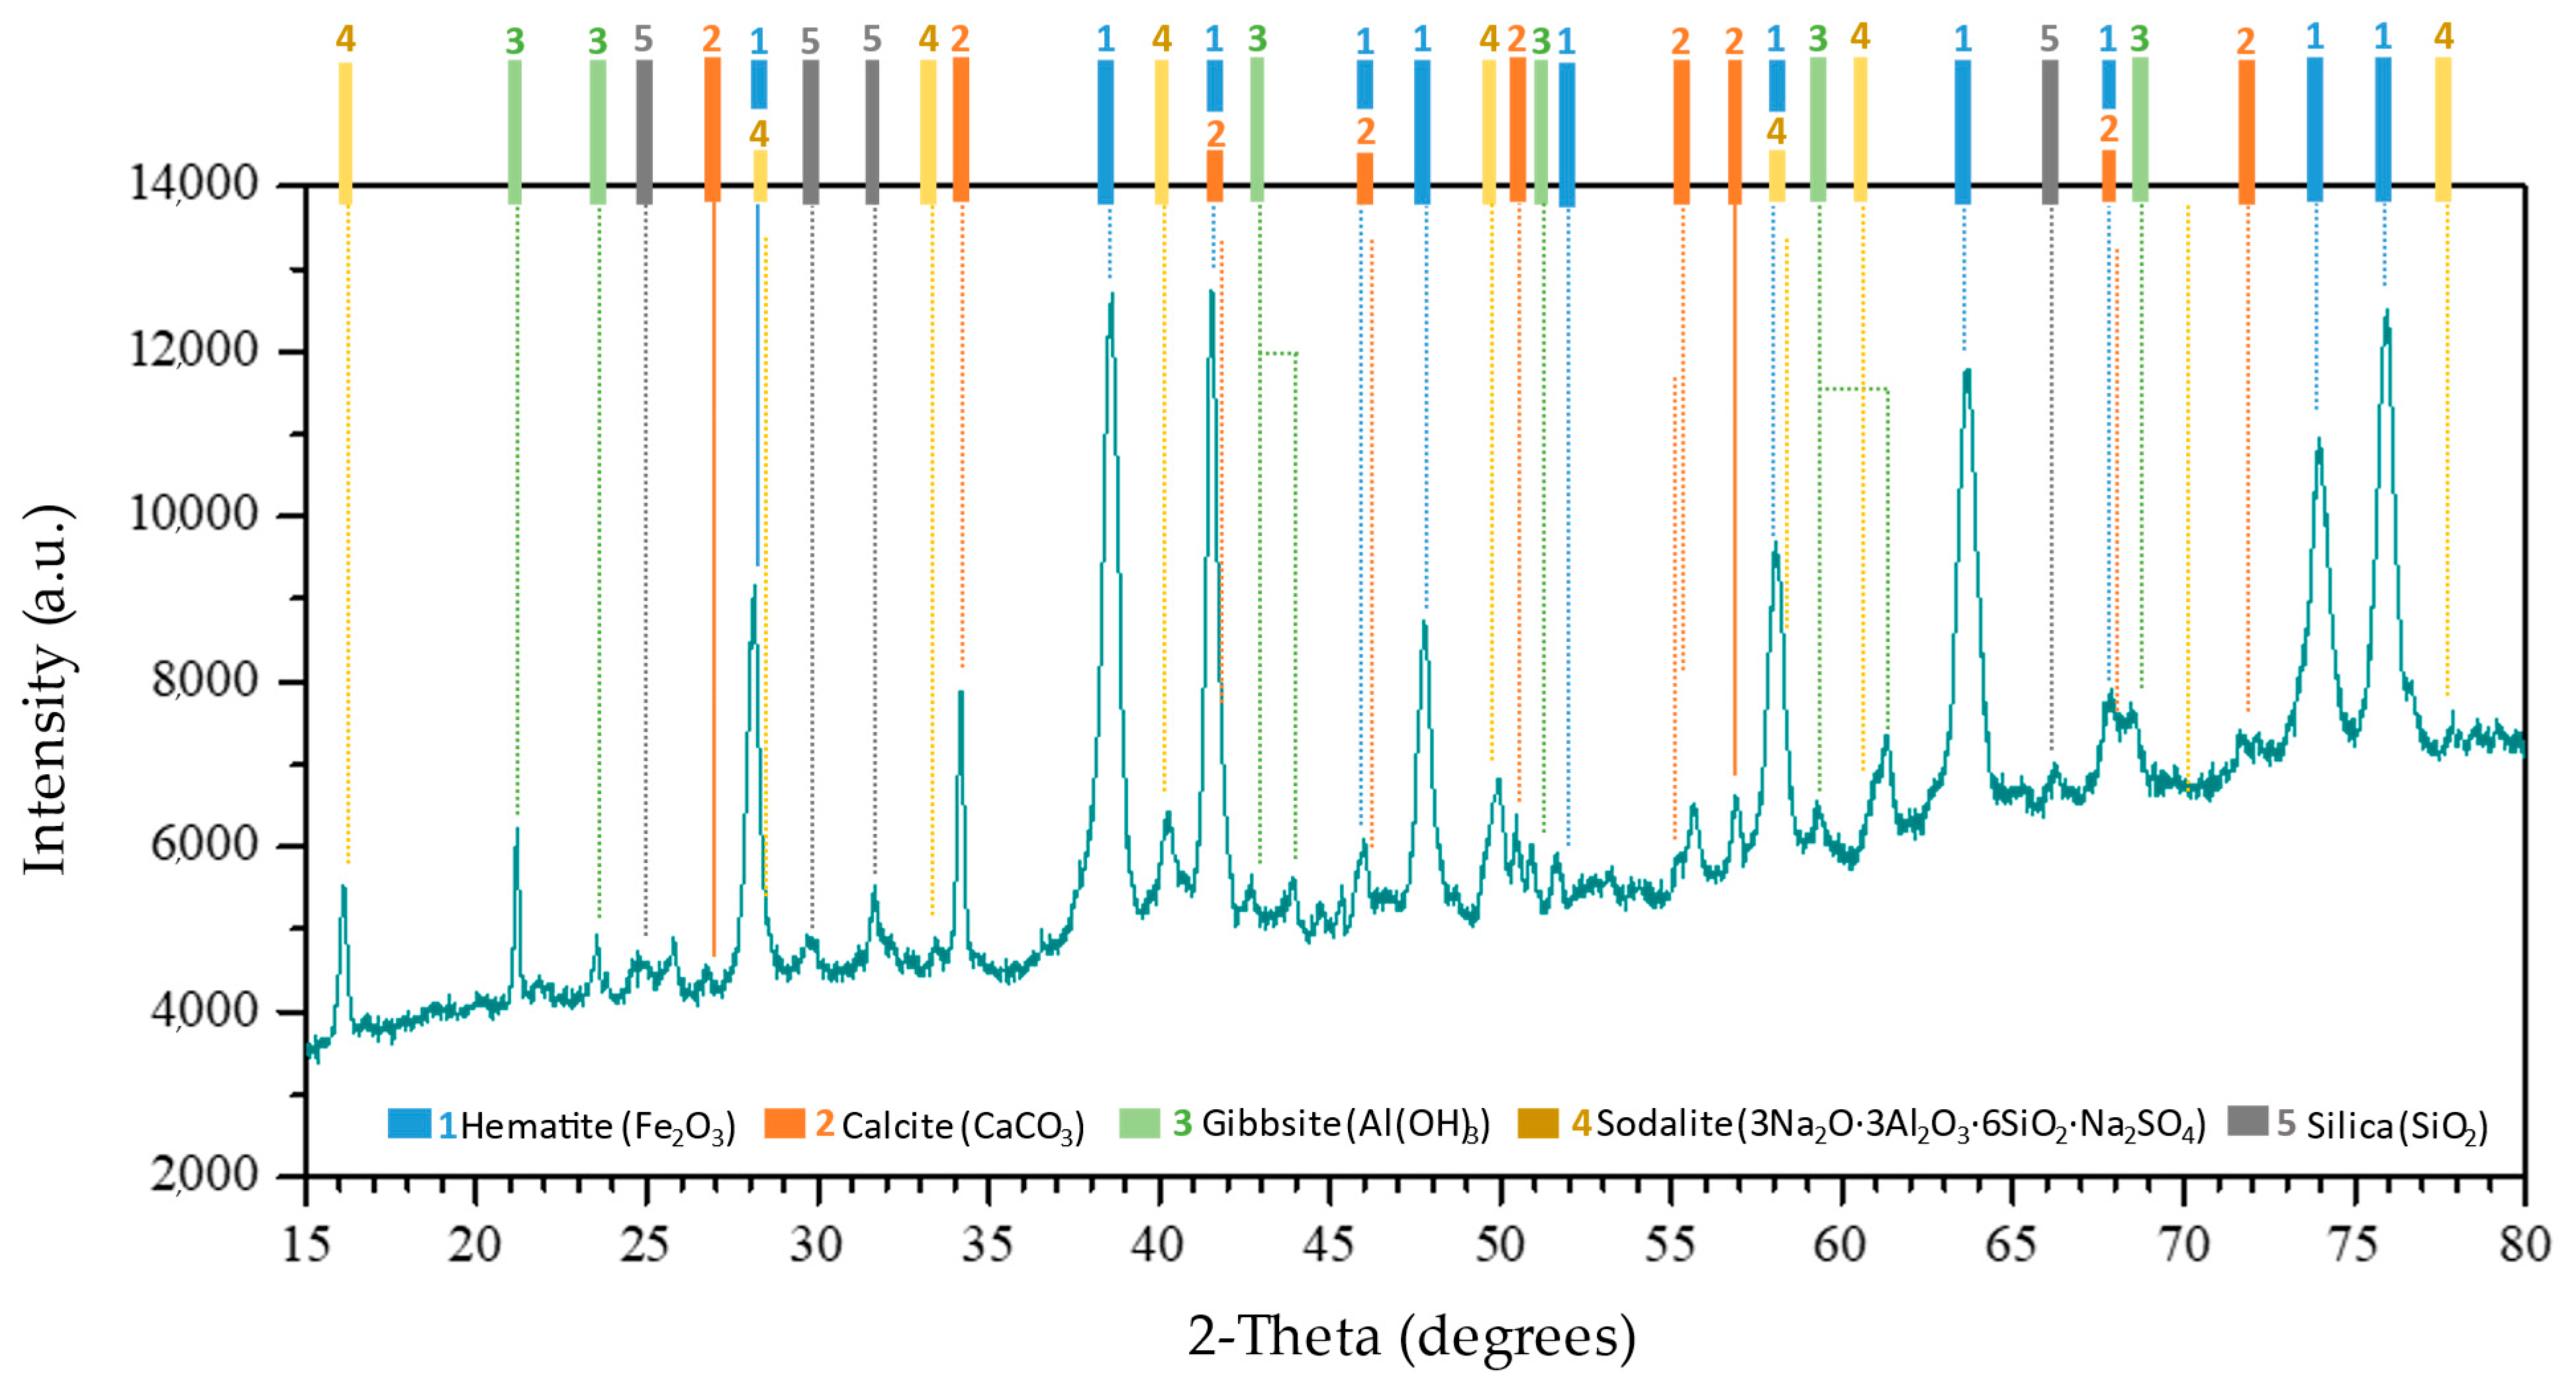
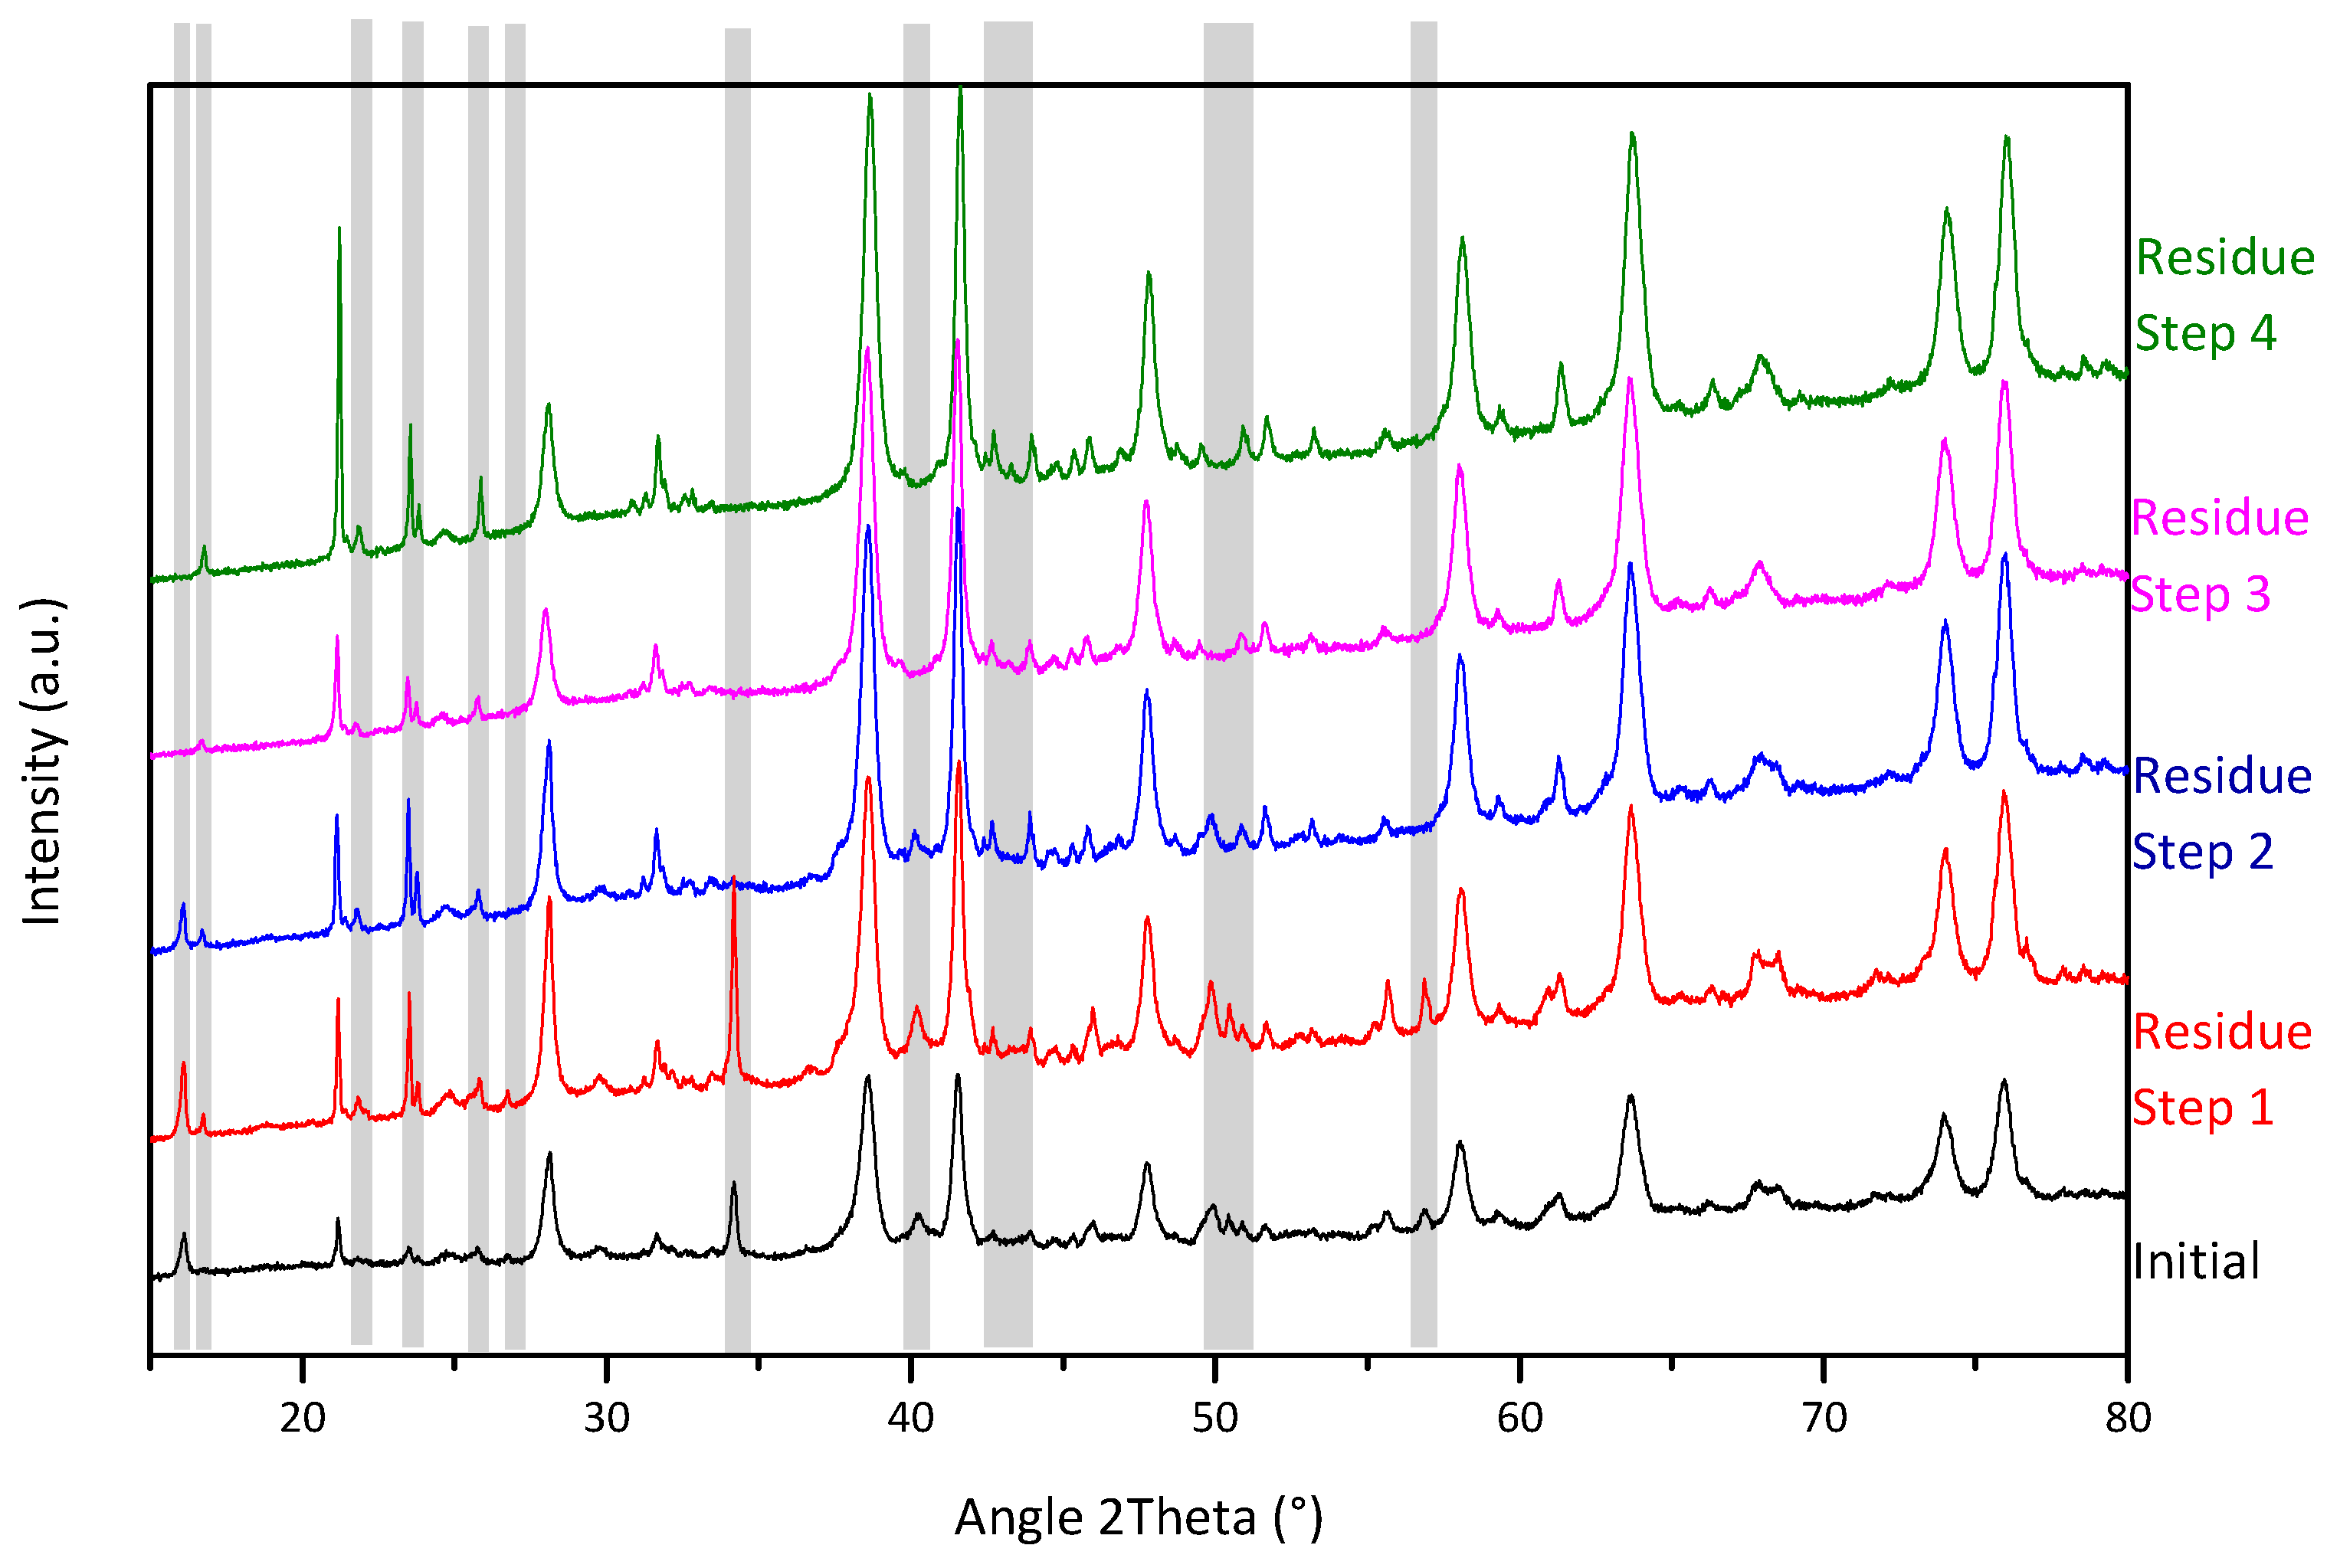
3.2.3. Crystallographic Phases Evolution During Sequential Extraction

XRD analysis was conducted on residue fractions obtained from the sequential extraction process to evaluate the evolution of the mineralogical phases at each step. Figure 6 compares the original RM sample with the residual fractions obtained from each stage. The predominant mineral phase corresponding to Fe2O3 (hematite) remained unaltered throughout the extraction procedure, indicating minimal chemical interaction between the solvents and hematite. This observation further suggests that elements such as Ce are predominantly associated with this mineral phase.
In contrast, significant changes are observed in some diffracted peaks (marked with grey lines). These mineral phases disappear in the residue from Step 2, following treatment with acetic acid, which effectively dissolved the carbonate phases. Additionally, according to ICP results, Al and Si were predominantly leached during Step 3, as evidenced by the reduced intensities of peaks associated with aluminosilicates and oxyhydroxide phases (e.g., sodalite).

4. Discussion

4.1. Potential Prospectivity of REE from RM

The global stock of REE in RM (as a potential resource), calculated for 2019, exceeded 9 million tons [16,26], which represents approximately 8% of conventional world reserves, estimated at 110 million tons by 2023 [19]. Table 5 presents the concentrations of REE in conventional deposit venues, and Table 6 shows the concentrations of REE in RM. These data indicate that the average REE content in RM (1260 ppm) reached approximately 8.4% of that in mineral deposits (14,970 ppm). This ratio is expected to rise as traditional deposits continue to deplete and aluminium production increases annually.
Globally, most current REE production comes from high-grade carbonatite deposits, such as Bayan Obo in China and Mountain Pass in the USA, while European deposits generally have lower grades [22]. The Bayan Obo mine is the largest REE ore deposit worldwide [53], though precise data on rare-earth oxide (REO) reserves vary among published sources, potential resources are estimated to reach up to 333 million tons [54], with reserves estimated at 57.4 million tons [55]. This deposit is intensely enriched in LREE but contains lower quantities of the more critical HREE (see Table 5). Although the REE concentration at Mountain Pass is significantly lower than at Bayan Obo, its reserves were estimated at 20 million tons of ore containing 8.9% REO in 2008 [56] and continues holding significant reserves (approximately 18.4 million tons of REO, in 2023 [57]), producing during 2020 about 38,500 tons of REO [58].
The recent increase in REE production by the USA and other countries made China’s share of global REE production decrease from 86% in 2014 [59] to less than 70% in 2023 [19] when it produced 240,000 tons of REO. China is expected to reach peak production levels between 2038 and 2045, with output ranging from 265,000 to 385,000 tons [55]. No other venue on the planet contained the REE concentrations offered by Chinese deposits. Other conventional reservoirs such as those in the USA, Brazil, Sweden, and Madagascar tend to have REE concentrations much lower and closer to those offered by the RM. Then, there could be a window of about 20 years to develop optimal methods for the feasible extraction of REE from RM before the depletion of known conventional resources intensifies and the decrease in production could accentuate the risk of global REE supply.
In the RM, the average distribution of LREE (75%), HREE (10%), and ∑Y + Sc (15%) resulted in generally uniform (see Table 6), with LREE averaging approximately 950 ppm, being the most abundant La, Ce, and Nd. RM from China and Jamaica is enriched in Dy, Gd, Y, and Sc. Mediterranean RM is also richer in Y and Sc, representing 10–20% of the total REE concentration. Although China’s RM has the highest REE concentration, it only reached about 5% of the REE content in Bayan Obo carbonatites (Table 5). Nonetheless, the average concentration of REE in RM is comparable to that of carbonatites from the Mountain Pass deposits in the USA. This confirmed a high potential for this residue. Additionally, RM contains a higher accumulation of some HREEs, like Tm, Yb, and Lu, than the prominent Bayan Obo and Mountain Pass conventional deposits. This potential should not be underestimated.
Comparing these concentrations may seem impractical, as the residue cannot currently be beneficiated into the high-grade concentrates typically used in the REE industry, and there is yet to be an active industrial-scale method for valorising RM [14,16]. However, this comparison can help identify the potential that RM could have once new extraction routes to achieve an optimum level of development and industrialisation. In RM, the concentration and distribution of REE can vary significantly depending on the type of bauxite, mine location, and processing conditions. However, this residue is usually enriched by a factor of approximately two [51]. Samples from Seydişehir (Turkey), including those characterised in this study, showed a two-fold increase in REE concentration compared to the Mortas bauxite source [60]. Similar findings were observed for RM from Greek and Jamaican bauxites [61].
The total REO consumption across several European market sectors—including magnets, batteries and metal alloys, automotive catalysts, petroleum refining, polishing powders, glass additives, phosphors, and ceramics, among others—has been studied. Analysis of specific REO content in products revealed that La, Ce, Nd, Pr, and Y are the most in-demand [62]. Three sectors accounted for the majority of REE demand in the EU: automotive catalysts (27%, of which 90% corresponds to Ce), glass additives (19%, of which 90% corresponds to Ce + La), and fluid-cracking catalysts (16%, of which 90% corresponds to La) [63]. Additionally, Nd comprised 70% of REE demand in the magnets sector, while ceramics and phosphors required 53% and 70% of Y, respectively. Sc is used in several niche applications and serves as a key alloying element in certain high-performance aluminium alloys, used in sectors such as fuel cells, sporting goods, commercial aviation, and conventional and electric vehicles [64]. Economically, Sc accounts for approximately 95% of the value held by the REE in RM [1]. Over the past two decades, growing demand has driven the price of distilled dendritic Sc to approximately USD 269/g in 2023, more than four times the price of gold, which was around USD 61/g during the same year [19]. Most conventional REE deposits studied do not report Sc concentrations (Table 5), while this element is usually common and relatively abundant in RM (Table 6).
Recovering Nd, Eu, Tb, Dy, and Y is critical for sustainable development, as their demand is expected to increase by 30% over the next decade [65]. Tb and Dy are attractive due to their prices (USD 1000/kg and USD 300/kg, respectively [14]) and their multiple applications in the magnet market. Their relatively low concentration in RM [5] should not be considered a limitation as conventional deposits also have low concentrations. Gd and Er are among the most abundant HREE in RM. After Sc, they represent the largest economic potential locked in RM dry-stock inventory [5]. However, they have lower concentrations than traditional mines, which limits the interest in extracting them from RM. In traditional ores, the proportion of Nd is relatively low compared to other LREE, typically comprising 50% Ce, 20–25% La, 12–20% Nd, and 4–5% Pr. This distribution imbalance contributes to the supply and demand gap [62]. The abundant availability of Ce and La may shift focus towards Nd extraction from RM [53]. This interest in Nd is further supported by its market price, which is currently higher than that of Ce and La [14,66]. The cost of Nd has almost doubled over recent years, rising from USD 45/kg to USD 80/kg [19]. Additionally, an evaluation of the potential for substituting REE in wind turbine magnets to reduce dependency on them found that this substitution is not feasible without Nd [67]. This study identified Sc, Y, Nd, La, and Ce as the most demanded REE, making them prime targets for prospecting. The feasibility of extracting these elements from RM is discussed in the following section. Additionally, it is important to highlight that HREE fractions, especially Gd, Dy, and Er, will become increasingly interesting due to their high economic value.
Table 5. Average REE concentration (ppm) in conventional ore deposits, including Y and Sc.
RefOre TypeRegionLocationLREEHREEOthersTotal
LaCePrNdSmEuGdTbDyHoErTmYbLuYSc
REE

LREE

HREE

Y + Sc
[27]Average in Earth’s crustGlobal-39679427261514130.833222421652255
[68]Bayan Obo SedimentsChinaBayan Obo region3363829515141303024-1791391724
[69]Iron-rich/dolomiteChinaBayan Obo ore body610510,13412065490360752532361719141142-23,88223,371369142
[70]Iron-rich/dolomiteChinaBayan Obo ore body886934,4305525229367611652121132291134-49,87549,507234134
[70]Iron-rich/dolomiteChinaBayan Obo ore body460517,7443453986285611301102701091-27,26827,02515391
[70]Iron-rich/dolomiteChinaBayan Obo ore body127979771522100259391821428020181-12,18611,805200181
[70]Iron-rich/dolomiteChinaBayan Obo ore body938032,558497441432873121317310130110-47,51847,250158110
[71]CarbonatitesUSAMountain pass belt30365883330641441418351316918161515287687
[72]CarbonatitesUSAMountain pass belt2354655219733723210240304712109310344559
[73]Ion-adsorption claysMadagascar-9082761565069676010266623102.4166-22941949179166
[73]Ion-adsorption claysSouth-East Asia-52513011040511051403018035315309512.41020-314312858371020
[73]Ion-adsorption claysBrazil-4501201002906020100602207021050260501200-3260104010201200
[74]Iron oreSwedenKiirunavaara252782101524122151572313025769668802430971796495806
[74]Iron oreSwedenKiirunavaara5441650188846151221632310820597516638344803401438641
Average REE (ppm) in conventional ores278889102952026186331281566166794273831214,97614,249350386
Table 6. Average REE concentration (ppm) in RM, including Y and Sc.
RefOre TypeRegionLocationLREEHREEOthersTotal
LaCePrNdSmEuGdTbDyHoErTmYbLuYSc
REE

LREE

HREE

Y + Sc
[3]RMGreece-1564833212525523-24-14-14-115134115082775249
[75]RMGreeceAgios Nikolaos11436828992152241741421427612191063578197
[76]RMGreece 1494182611529523-13417-16291128103674276219
[77]RMGreeceAoG plant-Boeotia13048029107195223204132142108-95977081108
[78]RMGreeceParnassus-Giona1274092810320418219311213298-8596917098
[61]RMGreeceParnassus-Giona1514222612129523-14417-16293-9237547693
[79]RMChina-41684295341641105618448252814281426615826891868397424
[79]RMIndia-1121911848927-4-1-2-13584653801471
[80]RMJamaica-2873667469003703862114172373551359797134429
[81]RMJamaicaAlcan Plant626714-2958015-1483---346-16220291730137162
[82]RMRussiaRusal Plant234508582224384453161721521458614251072122231
[83]RMMontenegroPodgorica3035585821540836633720320318010515941183127284
[66]RMMontenegroPodgorica2925395620839835532719319317410215411142123276
[66]RMSloveniaKidričevo1823633311621419322515215213185102071985216
[66]RMHungaryAlmásfüzíto24142654199387335296163163155771308965111232
[66]RMHungaryAjka21042946171326274245142142136n/a112289492136
[84]RMHungaryAjka114368-99----------68547035810122
[61]RMTürkiyeSeydişehir21961662210429634316173183145-14201157118145
[28]RMTürkiyeSeydişehir20940699186541261231615-1791351041309955115239
* RMTürkiyeSeydişehir2155895420641-41632619-19312415715121105126281
Average REE (ppm) in RM22447549163341228202971641741381061267948108211
* Sample from ETI Alüminyum A.Ş analysed in this study.

Feasibility of Extracting Main Targets from RM

Sc concentrations exceeding 100 ppm are rarely formed due to geological processes, thus materials containing 20–50 ppm can be classified as ore [51]. This element is typically recovered as a by-product from the production of host metals such as aluminium, titanium, and REE [85], being particularly abundant in tailings. Sc is distributed within detrital mineral phases, predominantly in Sc-enriched zircons within bauxite. It may also be adsorbed onto the surface of iron oxide phases or enriched in the outer layers of iron oxide particles [61]. Globally, RM contains Sc concentration ranging from 55–170 ppm, depending on the source [86]. The analysed samples in this study showed a concentration within the upper range (157 ppm), indicating its potential as a valuable secondary source for Sc extraction. However, the efficiency of Sc extraction through the experimental process used in this study was relatively low (10%), with significant recovery occurring only during step 2. Therefore, Sc extraction should be conducted using alternative methods.
Other studies have explored extracting Sc from RM using two primary approaches: purely hydrometallurgical processes or a combination of pyrometallurgical and hydrometallurgical techniques. Ochsenkühn-Petropulu et al. [87] demonstrated the most efficient recovery, achieving up to 80% Sc extraction using 0.5 M nitric acid (HNO3) under ambient conditions [86]. Sc can also be effectively separated from the leachate using a combination of bis(2-ethylhexyl) phosphoric acid (D2EHPA) and tributyl phosphate (TBP) at pH 0.4, with minimal co-extraction of iron [52].
Beyond laboratory studies, press releases announced the successful commercialisation of Sc recovered from RM. In 2014, RUSAL Company launched a pilot facility at Uralsk Aluminium Smelter in Russia [88,89]. The company reported having the largest reserves of Sc in RM, estimated at 32,500 tonnes [90], and it concentrated Sc through carbonisation leaching, initially achieving a yield of 23%. This process was described as environmentally friendly technology [91]. In 2016, 10 kg of 99.4% Sc were obtained, appealing to increase the performance to 0.8–1.4 tons of Sc2O3 per year [92]. In 2021, RUSAL successfully reduced the Sc leaching time by half and achieved an extraction rate of 40–45% [82].
RM from Mediterranean bauxites (Turkey, Greece, and Montenegro) contain higher concentrations of Sc than the slurry used in RUSAL (Table 6), where the concentration is approximately 90 ppm [82,91]. However, the latter stands out for its content of “easily leachable” Sc-containing phases, which can make up to 60% of the total content in the original RM. Since the chemical and mineral composition of RM can vary significantly, it is essential to determine the form in which Sc is present in each sample before conducting extraction experiments [93]. Previous analyses of Turkish RM samples indicated that Sc was mainly associated with Fe compounds.
Even though extracting Sc from RM has been demonstrated to be scalable, its economic feasibility ultimately determines its practical application. In this sense, the recovery of Sc should follow these strategies: (1) minimising the use of organic chemicals in solvent extraction due to their high cost, (2) using concentrated solutions to reduce the amount of reagents needed, thereby generating less waste, and (3) optimising process selection based on cost savings [86]. Additionally, an economic evaluation of a lab-scale Sc (59 ppm) recovery process from Jamaican RM, involving roasting, leaching, and selective precipitation, resulted in 75% efficiency, suggesting that this approach is economically viable [80].
In 2023, world mine Y production in REE minerals was estimated at 10,000 to 15,000 tons [19]. While global Y2O3 reserves are unknown, they appear sufficient for near-term demand. However, China’s high demand for ion-adsorption REE as well as economic, environmental, and regulatory changes may impact the availability of Y, the cost of which nearly tripled, rising from USD 3000/ton in 2019 to USD 8000/ton in 2023, with a peak at USD 12,000/ton in 2022 [19]. Y is present in phosphate minerals such as xenotime and churchite within the bauxite and tends to accumulate in RM, where it may be incorporated into mixed REE phases [77]. Its concentrations generally range from 60–150 ppm [94]. Steps 2 and 3 of the extraction method performed in this work were able to concentrate important fractions of Y, reaching efficiencies in terms of concentration of 15% and 130%, respectively.
As with Sc, Y from RM is reported to be successfully recovered through selective leaching with dilute HNO3 under moderate conditions, without any preliminary treatment, achieving a 96% recovery rate [87]. Previous processes for extracting Y from RM include the sulfation process, which involves a smelting pretreatment (1500–1550 °C for 1 h) and water leaching post-treatment, achieving an 80–90% extraction yield. However, both treatments have elevated water and energy demands. Pyro–hydro process pretreatments such as smelting, alkali roasting, and microwave exposure, are required and the extraction yield ranges from 30–90%. In contrast, hydrometallurgical process requires no pre- or post-treatment and achieves 60–90% yields [1]. Conversely, some bioleaching experiments have reached efficiencies of 60–80% of Y extraction [94]. The highest extraction efficiencies in the bioleaching of REE are typically achieved for Y [52], which makes it a technique of great interest for future developments.
Most natural REE deposits are primarily composed of La, Ce, and Nd [53]. In RM, LREE ferrotitanate (REE, Ca, Na)(Ti, Fe)O3 is the most abundant phase, forming a solid solution between the ideal end-members (Ca, Na)(Ti, Fe)O3 and (REE, Ca, Na)(Ti, Fe)O3 These occurrences further sub-divide into cerium-predominant and neodymium-lanthanum predominant types [77]. These LREE are presumed to co-occur, as evidenced by the strong correlation in their dissolution behaviour during leaching studies, excluding Ce, which exists as a stable tetravalent oxide (CeO2) and as a discrete bastnaesite phase ((Ce, La)CO3F), making it more resistant to acid leaching [1]. Globally, RM from China, Jamaica, Greece, and Turkey contains the highest concentrations of LREE, with Ce, La, and Nd making up 85–95% of the total LREE concentration (Table 6).
Other lab-scale experiences to separate and purify La, Ce, and Nd include: (i) the extraction of La (70 ppm) and Ce (110 ppm) from Indian RM achieved optimal dissolution (99.9%) by leaching with 3 M H2SO4 at room temperature for La and at 75 °C for Ce, followed by liquid–liquid extraction [49]; (ii) Hungarian RM containing La (114 ppm) and Ce (368 ppm) was treated with HCl (6 M), H2SO4, HNO3, C2H2O4, and C6H8O7, reaching a recovery yield of 98% for La and 74% for Ce. When D2EHPA was used as the extracting solution, extraction yields increased to 96% for La and 92% for Ce [51]; (iii) using imidazolium-based ionic liquid 1-ethyl-3-methylimidazolium hydrogen sulfate (Emim[HSO4]) as a leaching agent at elevated temperatures can achieve recovery rates of 60–70% for Ce and Nd, while La recovery reaches 100% [15,51]; and (iv) extraction of Nd and La was higher with the HCl-based dry digestion compared to H2SO4-based dry digestion, reaching a yield of 10–99% for Nd [95].
Bioleaching using green algae was employed for the intracellular accumulation of lanthanides, achieving an accumulation rate of 27.3 ppm per day with an RM concentration of 0.1%. Higher RM levels resulted in a reduced accumulation rate. In the alga Desmodesmus quadricauda, concentrations of Ce, La, and Nd reached 22.5%, 11.9%, and 10.1%, respectively, outperforming other algae species in effectiveness [96].

4.2. Sustainability of RM Valorisation

Traditionally considered industrial waste, RM is now recognised as a valuable resource for REE production [66]. Rather than pursuing new mining ventures, extracting REE from bauxite residues presents a promising and sustainable alternative to REE supply [25,27]. The feasibility of REE extraction depends on the process design, which must demonstrate both financial and operational viability under current and future free market conditions. To meet the fast-growing demand for REE while promoting circularity, it is necessary to extract them utilising sustainable practices. These requirements have made it difficult to advance the development of these technologies on an industrial scale.
Reprocessing REE from stockpiled mine waste can be more environmentally sustainable than extracting non-renewable virgin ore [66,97]. This approach conserves finite resources, boosts biodiversity, and reduces the production of radioactive elements, dust, and contamination of water and soil. Additionally, it lowers energy consumption, CO2 emissions, and landfill waste. It can also address environmental issues like tailings disposal, heavy metal contamination, and dam failures. Redirecting RM to a valorisation system prevents it from being sent to landfills, thereby avoiding the associated impacts. When waste-based materials are included in other systems they displace the need for new raw materials made through conventional methods. This substitution consequently reduces the environmental impact associated with traditional production (avoided burden) [98]. However, achieving this substitution through RM valorisation remains challenging due to technical, economic, and environmental limitations.
Several obstacles must be addressed to reach metal recovery from RM with sustainable practices. Common REE recovery technologies often produce significant acid residues, leading to secondary pollution. Additionally, some high-temperature processing routes consume large amounts of energy, making them less appealing to companies from both economic and environmental perspectives [6]. Additionally, there are limitations related to the available technology and poor waste management strategies. Pyrometallurgical processes are effective for selective metal recovery but have a high carbon footprint and present issues with post-recovery slag treatment. Scaling these processes requires substantial investment and significant technological modifications [5]. In contrast, hydrometallurgical techniques operate at lower temperatures, demand lower capital expenditures (CAPEX), and—depending on the leaching process—can offer greater selectivity [99,100]. Thus, hydrometallurgy may present a more efficient solution for REE recovery.
Bioleaching processes provide advantages such as environmental protection, low energy consumption, and reduced investment costs. However, their recovery and processing efficiencies are typically lower than conventional hydrometallurgical and pyrometallurgical methods [94]. This is primarily due to slower reaction rates and difficulties in optimising bioleaching conditions for extracting specific REE. Consequently, the practical application of bioleaching for large-scale REE recovery still faces significant challenges that require further research and development.
The maximum theoretical avoided burden, calculated for processing 1 ton of RM to extract 0.416 kg of REO (including Sc) and assuming 100% extracting efficiency could have potential environmental savings of 1133 kg CO2eq [101]. However, these savings may be overshadowed if high carbon footprint-chemical agents are used. The life cycle thinking (LCT) methodology makes it possible to assess the potential environmental impacts and identify some critical concerns related to specific REE extraction processes. With LCT, it was demonstrated that extracting routes such as carbothermic reduction of iron, soda sintering, or ionic liquids can be more polluting than others [101]. For example, the climate change potential of producing the candidate ionic liquid Emim[HSO4] is 5.1 kg CO2eq/Kg. This is over 30 times higher than that of the traditional solvent (sulfuric acid) [98]. Therefore, special care must be taken when defining extraction and separation methods, especially since achieving greater efficiency in these processes does not necessarily align with using the most sustainable practices.

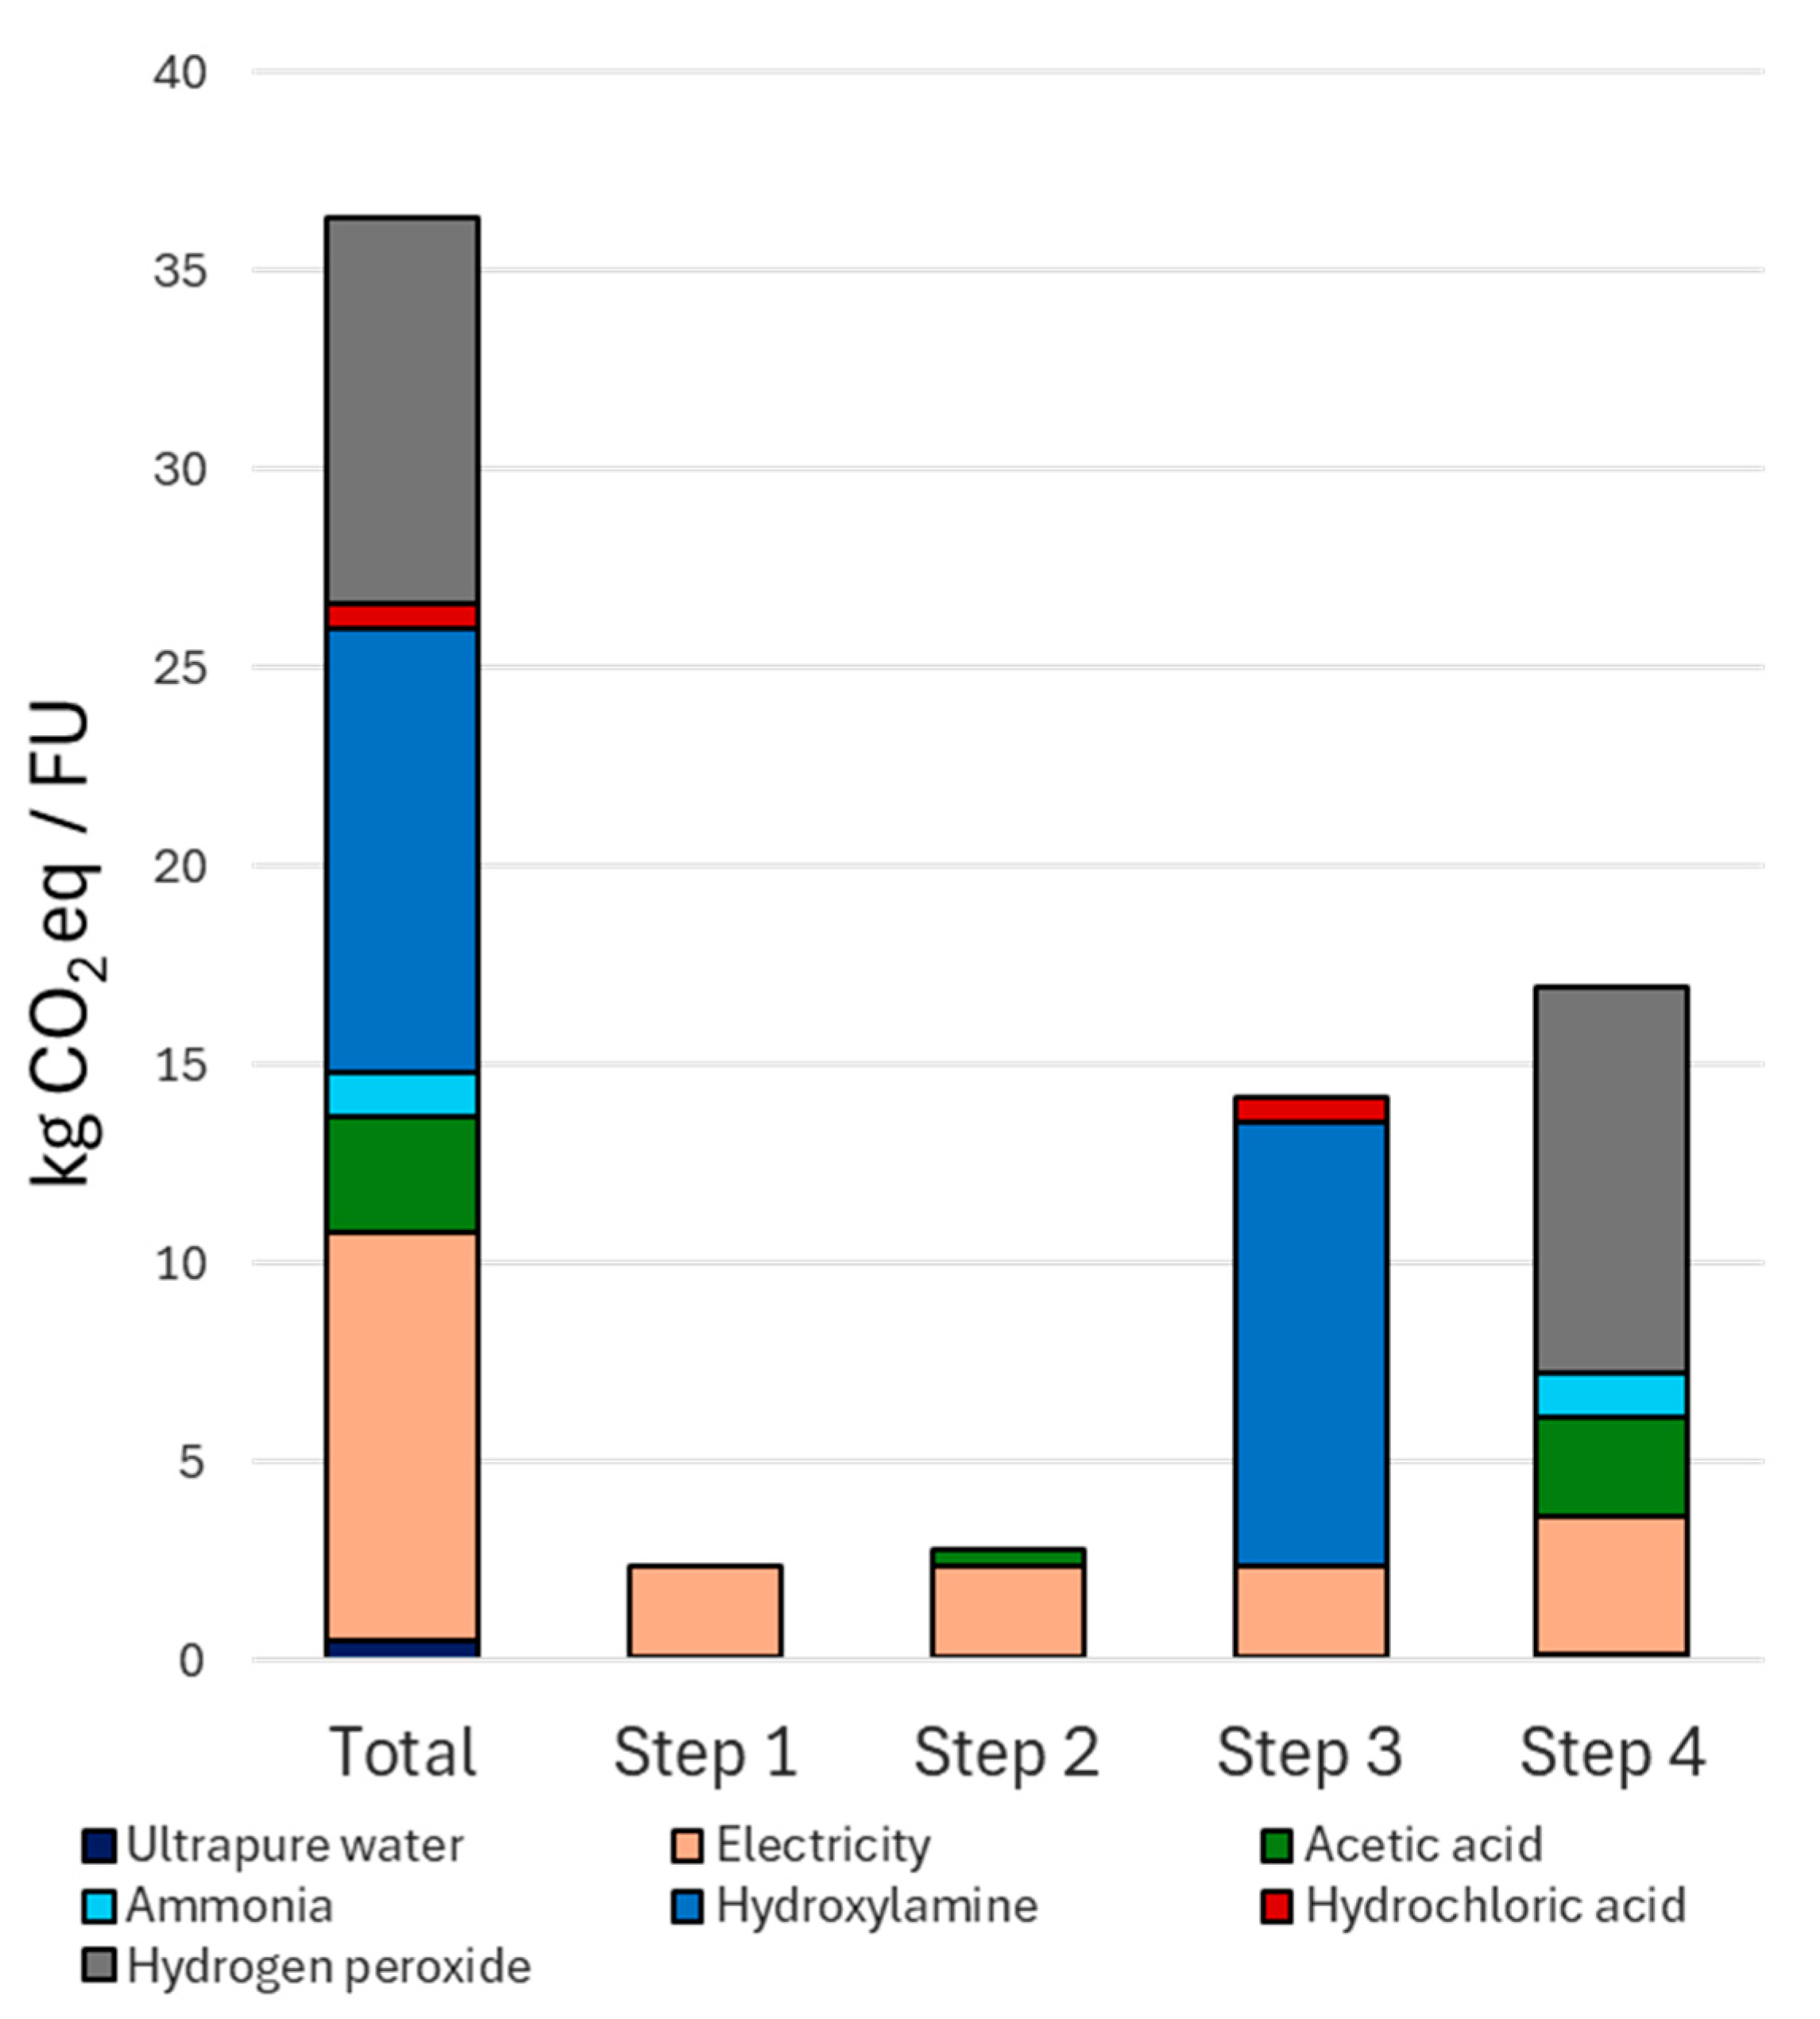
4.3. Global Warming Potential of the Sequential Extraction Process

This study employed the life cycle assessment (LCA) methodology to measure the potential greenhouse emissions associated with the leaching process. The IPCC GWP 2013 impact evaluation method (Figure 7) identified hydroxylamine hydrochloride from step 3 (11.2 kg CO2eq/FU) and hydrogen peroxide from step 4 (9.75 kg CO2eq/FU) as the primary contributors to emissions. These chemicals represented the main environmental concerns of the process as their associated emissions could exceed the theoretically avoided burden. Emissions related to equipment usage, electricity, and water consumption were considered inconclusive on the laboratory scale, thus shifting the focus to the analysis of the chemical inputs.
Due to its low leaching efficiency and high carbon footprint, the hydrogen peroxide used in Step 4 should be replaced, as it contributes 26.8% of the total emissions from this extraction process. The case of hydroxylamine hydrochloride is more complex since it enabled the highest REE recovery efficiencies, a crucial factor in guaranteeing a net environmental benefit from its implementation [98]. The use of 1.39 kg of hydroxylamine hydrochloride (Table 1) results in more than double the CO2eq emissions compared to 1 kg Emim[HSO4] (the agent candidate mentioned in Section 4.2). Only hydroxylamine contributed the highest proportion of total emissions of the process (30.7%). Additionally, the credit for RM valorisation provided by the Ecoinvent database [34] (−0.01 kg CO2eq/FU) is insufficient to offset the emissions associated with hydroxylamine. Therefore, from the perspective of quantifying emissions and global warming potential, the implemented process is not feasible.
Conventional REO extraction in China, which includes iron ore mining, beneficiation and separation, has a carbon footprint of approximately 43 kg CO2eq per 1 kg of REO produced [102]. Furthermore, producing 1 kg of heavy rare earth oxides from ion-adsorption clays results in a global warming potential of 12–36 kg CO2eq [103]. Although the technological maturity, scale, and system boundaries of these examples differ significantly from the case study, this comparison underscores the challenge of developing an efficient process that meets both environmental and economic sustainability criteria.
Due to the limited availability of industrial-scale data, LCA studies in this field are scarce [98]. Nonetheless, this methodology should be broadly applied to identify the most environmentally sustainable processes for RM recycling [104], even for laboratory-scale processes and their potential industrial-scale applications. This approach can facilitate the comparison of different technologies, aiding in the selection of the most efficient and eco-friendly extraction methods.

5. Conclusions

Red mud (RM), a major by-product of aluminium production, presents environmental challenges but also serves as a potential secondary source of rare earth elements (REEs). This study evaluates RM from Seydişehir (Turkey) for REE recovery, its economic feasibility, and environmental impacts using the life cycle assessment (LCA) approach. RM contains up to 1600 ppm of REEs—mainly light elements like Ce, La, Nd, and Sc—whose high demand enhances its strategic importance. Although REE concentrations in RM are lower than those in conventional deposits, such as Bayan Obo, they are economically significant. For instance, scandium (Sc), priced at USD 269/g, represents up to 95% of RM’s REE economic value. Experimental extraction methods achieved REE concentrations of up to 2000 ppm using reagents like hydroxylamine hydrochloride and hydrogen peroxide, but these pose a high potential for global warming emissions.
With over 9 million tonnes of REEs globally stored in RM, it represents 8% of the world’s reserves as of 2023. This positions RM as a sustainable alternative to mining, with potential benefits in reducing radioactive waste, emissions, and resource depletion. However, industrial-scale recovery faces technical and economic barriers that require optimisation for environmental sustainability.
RM recovery could significantly contribute to Europe’s sustainable technology sectors. A life cycle analysis framework highlights improvement opportunities, turning RM into a strategic resource for industrial applications. However, simply quantifying the global warming potential is insufficient for RM LCA modelling. Future approaches must also account for the complete environmental sustainability assessment to quantify the actual benefits of RM valorisation, such as reducing the need for virgin raw material production, avoiding landfilling, and mitigating resource depletion.

Author Contributions

C.A.V.: conceptualization, formal analysis, investigation, resources, rata curation, visualization, writing—original draft. A.S.-S.: conceptualization, formal analysis, investigation, resources, data curation, visualization, writing—original draft, writing—review and editing. A.I.F.: conceptualization, methodology, data curation, writing—review and editing. J.M.C.: supervision, data curation, visualization, writing—review and editing. C.B. (Carlos Berlanga): supervision, eisualization, writing—review and editing. C.B. (Camila Barreneche): supervision, visualization, writing—review and editing, funding acquisition. R.R.: supervision, visualization, writing—review and editing, Funding acquisition. All authors have read and agreed to the published version of the manuscript.

Funding

This research was partially funded by the Gobierno de Navarra (contract 0011-3998-2021-000006), corresponding to the ERA-MIN project JTC-2021_131 “Utilization of aluminum bearing raw materials for the production of aluminium metal, other metals and compounds” (ABTOMAT). Researchers from University of Barcelona belong to DIOPMA group, DIOPMA is a certified agent TECNIO in the category of technology developers from the Government of Catalonia. The authors would like to thank the Catalan Government for the quality accreditation given to their research groups DIOPMA (2021 SGR 00708). Finally, the authors would like to tank to ETİ Alüminyum for providing the samples.

Institutional Review Board Statement

Not applicable.

Informed Consent Statement

Not applicable.

Data Availability Statement

Dataset available on request from the authors.

Conflicts of Interest

The authors declare no conflicts of interest. The funders had no role in the design of the study; in the collection, analyses, or interpretation of data; in the writing of the manuscript; or in the decision to publish the results.

References

  1. Agrawal, S.; Dhawan, N. Evaluation of red mud as a polymetallic source—A review. Miner. Eng. 2021, 171, 107084. [Google Scholar] [CrossRef]
  2. Svobodova-Sedlackova, A.; Calderón, A.; Fernandez, A.I.; Chimenos, J.M.; Berlanga, C.; Yücel, O.; Barreneche, C.; Rodriguez, R. Mapping the research landscape of bauxite by-products (red mud): An evolutionary perspective from 1995 to 2022. Heliyon 2024, 10, e24943. [Google Scholar] [CrossRef]
  3. Balomenos, E.; Davris, P.; Pontikes, Y.; Panias, D. Mud2Metal: Lessons Learned on the Path for Complete Utilization of Bauxite Residue Through Industrial Symbiosis. J. Sustain. Metall. 2016, 3, 551–560. [Google Scholar] [CrossRef]
  4. Liu, Y.; Naidu, R. Hidden values in bauxite residue (red mud): Recovery of metals. Waste Manag. 2014, 34, 2662–2673. [Google Scholar] [CrossRef] [PubMed]
  5. Swain, B.; Akcil, A.; Lee, J.C. Red mud valorization an industrial waste circular economy challenge; review over processes and their chemistry. Crit. Rev. Environ. Sci. Technol. 2020, 52, 520–570. [Google Scholar] [CrossRef]
  6. Wang, L.; Sun, N.; Tang, H.; Sun, W. A review on comprehensive utilization of red mud and prospect analysis. Minerals 2019, 9, 362. [Google Scholar] [CrossRef]
  7. Mayes, W.M.; Burke, I.T.; Gomes, H.I.; Anton, Á.D.; Molnár, M.; Feigl, V.; Ujaczki, É. Advances in Understanding Environmental Risks of Red Mud After the Ajka Spill, Hungary. J. Sustain. Metall. 2016, 2, 332–343. [Google Scholar] [CrossRef]
  8. Khairul, M.A.; Zanganeh, J.; Moghtaderi, B. The composition, recycling and utilisation of Bayer red mud. Resour. Conserv. Recycl. 2019, 141, 483–498. [Google Scholar] [CrossRef]
  9. Xue, S.; Zhu, F.; Kong, X.; Wu, C.; Huang, L.; Huang, N.; Hartley, W. A review of the characterization and revegetation of bauxite residues (Red mud). Environ. Sci. Pollut. Res. 2016, 23, 1120–1132. [Google Scholar] [CrossRef] [PubMed]
  10. Santini, T.C.; Fey, M.V. Spontaneous vegetation encroachment upon bauxite residue (red mud) as an indicator and facilitator of in situ remediation processes. Environ. Sci. Technol. 2013, 47, 12089–12096. [Google Scholar] [CrossRef]
  11. Shi, J.; Liu, Y.; Li, Z.; Lei, J.; Yin, K.; Zhang, Z.; Xie, N. Upcycling use of red mud-based solid waste in engineered cementitious composites: Properties, activation mechanism, and life-cycle assessment. J. Clean. Prod. 2024, 447, 141504. [Google Scholar] [CrossRef]
  12. Zhang, J.; Yao, Z.; Wang, K.; Wang, F.; Jiang, H.; Liang, M.; Wei, J.; Airey, G. Sustainable utilization of bauxite residue (Red Mud) as a road material in pavements: A critical review. Constr. Build. Mater. 2021, 270, 121419. [Google Scholar] [CrossRef]
  13. Adelfio, L.; Sgarbossa, F.; Leone, R.; La Scalia, G. Life Cycle Assessment of Red Mud-Based Geopolymer Production at Industrial Scale, in Advances in Production Management Systems. In IFIP Advances in Information and Communication Technology; Alfnes, E., Romsdal, A., Strandhagen, J.O., von Cieminski, G., Romero, D., Eds.; Springer Nature: Cham, Switzerland, 2023; Volume 692, pp. 593–606. [Google Scholar] [CrossRef]
  14. Swain, B.; Lee, C.G.; Park, J.R. Assessment of bauxite residue as secondary resource for rare earth metal and valorization challenges: A perspective. Resour. Conserv. Recycl. Adv. 2022, 14, 200078. [Google Scholar] [CrossRef]
  15. Bonomi, C.; Cardenia, C.; Yin, P.T.W.; Panias, D. Review of Technologies in the Recovery of Iron, Aluminium, Titanium and Rare Earth Elements from Bauxite Residue (Red Mud). In Proceedings of the International Symposium on Enhanced Landfill Mining, Lisboa, Portugal, 8–10 February 2016. [Google Scholar]
  16. Swain, B. Challenges and Opportunities for Sustainable Valorization of Rare Earth Metals from Anthropogenic Waste; Springer Science and Business Media B.V.: Berlin/Heidelberg, Germany, 2023. [Google Scholar] [CrossRef]
  17. Salman, A.D.; Juzsakova, T.; Rédey, Á.; Le, P.-C.; Nguyen, X.C.; Domokos, E.; Abdullah, T.A.; Vagvolgyi, V.; Chang, S.W.; Nguyen, D.D. Enhancing the Recovery of Rare Earth Elements from Red Mud. Chem. Eng. Technol. 2021, 44, 1768–1774. [Google Scholar] [CrossRef]
  18. Balaram, V. Rare Earth Element Deposits: Sources, and Exploration Strategies. J. Geol. Soc. India 2022, 98, 1210–1216. [Google Scholar] [CrossRef]
  19. U.S. Geological Survey. Mineral Commodity Summaries 2024: U.S. Geological Survey. USGS. Available online: https://www.usgs.gov/centers/national-minerals-information-center/rare-earths-statistics-and-information (accessed on 13 September 2024).
  20. Balaram, V. Sources and applications of rare earth elements. In Environmental Technologies to Treat Rare Earth Element Pollution: Principles and Engineering; IWA Publishing: London, UK, 2022; pp. 75–113. [Google Scholar] [CrossRef]
  21. Eurostat. “Trade in Rare Earth Elements Increases in 2022”, EU. Available online: https://ec.europa.eu/eurostat/web/products-eurostat-news/w/ddn-20231113-1 (accessed on 6 September 2024).
  22. Goodenough, K.M.; Schilling, J.; Jonsson, E.; Kalvig, P.; Charles, N.; Tuduri, J.; Deady, E.A.; Sadeghi, M.; Schiellerup, H.; Müller, A.; et al. Europe’s rare earth element resource potential: An overview of REE metallogenetic provinces and their geodynamic setting. Ore Geol. Rev. 2016, 72, 838–856. [Google Scholar] [CrossRef]
  23. Massari, S.; Ruberti, M. Rare earth elements as critical raw materials: Focus on international markets and future strategies. Resour. Policy 2013, 38, 36–43. [Google Scholar] [CrossRef]
  24. Charalampides, G.; Vatalis, K.I.; Apostoplos, B.; Ploutarch-Nikolas, B. Rare Earth Elements: Industrial Applications and Economic Dependency of Europe. Procedia Econ. Financ. 2015, 24, 126–135. [Google Scholar] [CrossRef]
  25. European Raw Materials Alliance. Rare Earth Magnets and Motors: A European Call for Action. European Raw Materials Alliance: Berlin, Germany, 2021; Available online: https://eit.europa.eu/sites/default/files/2021_09-24_ree_cluster_report2.pdf (accessed on 4 February 2025).
  26. Swain, B. Red Mud: An Environmental Challenge But Overlooked Treasure for Critical Rare Earth Metals; Springer Nature: Berlin/Heidelberg, Germany, 2022. [Google Scholar] [CrossRef]
  27. Balaram, V. Rare earth elements: A review of applications, occurrence, exploration, analysis, recycling, and environmental impact. Geosci. Front. 2019, 10, 1285–1303. [Google Scholar] [CrossRef]
  28. Çelebi, E.E. Determination of metal fractions and rare earth anomalies in red mud: The case of bauxite mining district of Seydişehir (Turkey). Environ. Earth Sci. 2024, 83, 93. [Google Scholar] [CrossRef]
  29. Tessier, A.; Campbell, P.G.C.; Bisson, M. Sequential extraction procedure for the speciation of particulate trace metals. Anal. Chem. 1979, 51, 844–851. [Google Scholar] [CrossRef]
  30. Pérez-Martínez, S.; Giro-Paloma, J.; Maldonado-Alameda, A.; Formosa, J.; Queralt, I.; Chimenos, J.M. Characterisation and partition of valuable metals from WEEE in weathered municipal solid waste incineration bottom ash, with a view to recovering. J. Clean. Prod. 2019, 218, 61–68. [Google Scholar] [CrossRef]
  31. ISO 14040:2006; Environmental Management—Life Cycle Assessment—Principles and Framework. ISO: Geneva, Switzerland, 2006; Volume 14040.
  32. ISO 14044:2006; Environmental Management—Life Cycle Assessment—Requirements and Guidelines. ISO: Geneva, Switzerland, 2006; Volume 14044.
  33. GaBi Software, version 10.7.1.28; Sphera Solutions GmbH, LCA for Experts Software and Database for Life Cycle Engineering: Stuttgart, Germany, 2023.
  34. Wernet, G.B.C.; Steubing, B.; Reinhard, J.; Moreno-Ruiz, E.; Weidema, B. Ecoinvent, Version 3.9.1; Ecoinvent: Zurich, Switzerland, 2016.
  35. Hischier, R.; Jungbluth, N.; Althaus, H.-J.; Hischier, R.; Doka, G.; Bauer, C.; Dones, R.; Nemecek, T.; Hellweg, S.; Humbert, S.; et al. Implementation of Life Cycle Impact Assessment Methods. Ecoinvent Report No. 3, v2.2.; Swiss Centre for Life Cycle Inventories: Dübendorf, Switzerland, 2010. [Google Scholar]
  36. Grzesik, K.; Bieda, B.; Kozakiewicz, R.; Kossakowska, K. Goal and scope and its evolution for life cycle assessment of rare earth elements recovery from secondary sources. In Proceedings of the International Multidisciplinary Scientific GeoConference Surveying Geology and Mining Ecology Management, SGEM, International Multidisciplinary Scientific Geoconference, Albena, Bulgaria, 27 June–6 July 2017; pp. 107–114. [Google Scholar] [CrossRef]
  37. Gu, H.; Wang, N.; Hargreaves, J.S.J. Sequential Extraction of Valuable Trace Elements from Bayer Process-Derived Waste Red Mud Samples. J. Sustain. Metall. 2018, 4, 147–154. [Google Scholar] [CrossRef]
  38. Erçağ, E.; Apak, R. Furnace smelting and extractive metallurgy of red mud: Recovery of TiO2, Al2O3 and pig iron. J. Chem. Technol. Biotechnol. 1997, 70, 241–246. [Google Scholar] [CrossRef]
  39. Şayan, E.; Bayramoğlu, M. Statistical Modelling of Sulphuric Acid Leaching of TiO2, Fe2O3 and A12O3 from Red Mud. Process Saf. Environ. Prot. 2001, 79, 291–296. [Google Scholar] [CrossRef]
  40. Alp, A.; Goral, M.S. The influence of soda additive on the thermal properties of red mud. J. Therm. Anal. Calorim. 2003, 73, 201–207. [Google Scholar] [CrossRef]
  41. Bai, Y.; Guo, W.; Zhang, Y.; Xue, C.; Xu, Z.; Gao, Q.; Zhao, Q. Low carbon binder preparation from slag-red mud activated by MSWI fly ash-carbide slag: Hydration characteristics and heavy metals’ solidification behavior. J. Clean. Prod. 2022, 374, 134007. [Google Scholar] [CrossRef]
  42. Yang, J.; Xiao, B. Development of unsintered construction materials from red mud wastes produced in the sintering alumina process. Constr. Build. Mater. 2008, 22, 2299–2307. [Google Scholar] [CrossRef]
  43. Zhang, N.; Liu, X.; Sun, H.; Li, L. Pozzolanic behaviour of compound-activated red mud-coal gangue mixture. Cem. Concr. Res. 2011, 41, 270–278. [Google Scholar] [CrossRef]
  44. Zhu, X.; Li, W.; Guan, X. An active dealkalization of red mud with roasting and water leaching. J. Hazard. Mater. 2015, 286, 85–91. [Google Scholar] [CrossRef]
  45. Pérez-Villarejo, L.; Corpas-Iglesias, F.A.; Martínez-Martínez, S.; Artiaga, R.; Pascual-Cosp, J. Manufacturing new ceramic materials from clay and red mud derived from the aluminium industry. Constr. Build. Mater. 2012, 35, 656–665. [Google Scholar] [CrossRef]
  46. Lv, Z.; Pan, X.; Pei, J.; Xu, D.; Yu, H. Hydrothermal preparation of lightweight calcium silicate powder from alumina-leaching residue of low-calcium sintering red mud. Ceram. Int. 2022, 48, 33835–33847. [Google Scholar] [CrossRef]
  47. Samouhos, M.; Taxiarchou, M.; Tsakiridis, P.E.; Potiriadis, K. Greek ‘red mud’ residue: A study of microwave reductive roasting followed by magnetic separation for a metallic iron recovery process. J. Hazard. Mater. 2013, 254–255, 193–205. [Google Scholar] [CrossRef] [PubMed]
  48. Tsakiridis, P.E.; Agatzini-Leonardou, S.; Oustadakis, P. Red mud addition in the raw meal for the production of Portland cement clinker. J. Hazard. Mater. 2004, 116, 103–110. [Google Scholar] [CrossRef] [PubMed]
  49. Abhilash; Sinha, S.; Sinha, M.K.; Pandey, B.D. Extraction of lanthanum and cerium from Indian red mud. Int. J. Miner. Process. 2014, 127, 70–73. [Google Scholar] [CrossRef]
  50. Sinha, S.; Abhilash; Meshram, P.; Pandey, B.D. Metallurgical processes for the recovery and recycling of lanthanum from various resources—A review. Hydrometallurgy 2016, 160, 47–59. [Google Scholar] [CrossRef]
  51. Borra, C.R.; Blanpain, B.; Pontikes, Y.; Binnemans, K.; Van Gerven, T. Recovery of Rare Earths and Other Valuable Metals from Bauxite Residue (Red Mud): A Review. J. Sustain. Metall. 2016, 2, 365–386. [Google Scholar] [CrossRef]
  52. Binnemans, K.; Jones, P.T.; Blanpain, B.; Van Gerven, T.; Pontikes, Y. Towards zero-waste valorisation of rare-earth-containing industrial process residues: A critical review. J. Clean. Prod. 2015, 99, 17–38. [Google Scholar] [CrossRef]
  53. Goodenough, K.M.; Wall, F.; Merriman, D. The Rare Earth Elements: Demand, Global Resources, and Challenges for Resourcing Future Generations. Nat. Resour. Res. 2018, 27, 201–216. [Google Scholar] [CrossRef]
  54. Li, Y.K.; Ke, C.H.; She, H.Q.; Wang, D.H.; Xu, C.; Wang, A.J.; Li, R.-P.; Peng, Z.-D.; Zhu, Z.-Y.; Yang, K.-F.; et al. Geology and mineralization of the Bayan Obo supergiant carbonatite-type REE-Nb-Fe deposit in Inner Mongolia, China: A review. China Geol. 2023, 6, 716–750. [Google Scholar]
  55. Dushyantha, N.; Batapola, N.; Ilankoon, I.M.S.K.; Rohitha, S.; Premasiri, R.; Abeysinghe, B.; Ratnayake, N.; Dissanayake, K. The story of rare earth elements (REEs): Occurrences, global distribution, genesis, geology, mineralogy and global production. Ore Geol. Rev. 2020, 122, 103521. [Google Scholar] [CrossRef]
  56. Castor, S.B. Rare earth deposits of North America. In Resource Geology; Blackwell Publishing Ltd.: Oxford, UK, 2008; pp. 337–347. [Google Scholar] [CrossRef]
  57. Burron, I. Mountain Pass: America’s Once and Future Rare Earth King. Geology for Investors, 1 February 2023. Available online: https://www.geologyforinvestors.com/mountain-pass-americas-once-and-future-rare-earth-king/ (accessed on 12 July 2024).
  58. Mahoney, N. US Wants to Reclaim Critical rare Earth Supply Chain. Available online: https://www.freightwaves.com/news/us-wants-to-reclaim-critical-rare-earth-supply-chain (accessed on 12 July 2024).
  59. Fan, H.R.; Yang, K.F.; Hu, F.F.; Liu, S.; Wang, K.Y. The giant Bayan Obo REE-Nb-Fe deposit, China: Controversy and ore genesis. Geosci. Front. 2016, 7, 335–344. [Google Scholar] [CrossRef]
  60. Uyanik, C.; Kocak, K.; Doyen, A.D. The Bauxite deposits of Seydişehir region (Mortaş and Doğankuzu deposits); Their geological, mineralogical and geochemical characteristics. Acta Geobalc. 2016, 2, 21–26. [Google Scholar] [CrossRef]
  61. Deady, É.A.; Mouchos, E.; Goodenough, K.; Williamson, B.J.; Wall, F. A review of the potential for rare-earth element resources from European red muds: Examples from Seydişehir, Turkey and Parnassus-Giona, Greece. Miner. Mag. 2016, 80, 43–61. [Google Scholar] [CrossRef]
  62. Guyonnet, D.; Planchon, M.; Rollat, A.; Escalon, V.; Tuduri, J.; Charles, N.; Vaxelaire, S.; Dubois, D.; Fargier, H. Material flow analysis applied to rare earth elements in Europe. J. Clean. Prod. 2015, 107, 215–228. [Google Scholar] [CrossRef]
  63. Machacek, E.; Kalvig, P. Assessing advanced rare earth element-bearing deposits for industrial demand in the EU. Resour. Policy 2016, 49, 186–203. [Google Scholar] [CrossRef]
  64. Phoung, S.; Williams, E.; Gaustad, G.; Gupta, A. Exploring global supply and demand of scandium oxide in 2030. J. Clean. Prod. 2023, 401, 136673. [Google Scholar] [CrossRef]
  65. Balaram, V. Potential Future Alternative Resources for Rare Earth Elements: Opportunities and Challenges. Minerals 2023, 13, 425. [Google Scholar] [CrossRef]
  66. Tomašić, N. Bauxite and Bauxite Residue as a Potential Resource of REE in the ESEE Region; University of Zagreb Faculty of Science: Zabreb, Croatia, 2020. [Google Scholar]
  67. Pavel, C.C.; Lacal-Arántegui, R.; Marmier, A.; Schüler, D.; Tzimas, E.; Buchert, M.; Jenseit, W.; Blagoeva, D. Substitution strategies for reducing the use of rare earths in wind turbines. Resour. Policy 2017, 52, 349–357. [Google Scholar] [CrossRef]
  68. Zhou, J.; Wang, X.; Nie, L.; McKinley, J.M.; Liu, H.; Zhang, B.; Han, Z. Geochemical background and dispersion pattern of the world’s largest REE deposit of Bayan Obo, China. J. Geochem. Explor. 2020, 215, 106545. [Google Scholar] [CrossRef]
  69. Lai, X.; Yang, X. Geochemical characteristics of the Bayan Obo giant REE-Nb-Fe deposit: Constraints on its genesis. J. S. Am. Earth Sci. 2013, 41, 99–112. [Google Scholar] [CrossRef]
  70. Hou, X.Z.; Yang, Z.F.; Wang, Z.J. The occurrence characteristics and recovery potential of middle-heavy rare earth elements in the Bayan Obo deposit, Northern China. Ore Geol. Rev. 2020, 126, 103737. [Google Scholar] [CrossRef]
  71. Watts, K.E.; Haxel, G.B.; Miller, D.M. Temporal and petrogenetic links between mesoproterozoic alkaline and carbonatite magmas at Mountain Pass, California. Econ. Geol. 2022, 117, 1–23. [Google Scholar] [CrossRef]
  72. Poletti, J.E.; Cottle, J.M.; Hagen-Peter, G.A.; Lackey, J.S. Petrochronological constraints on the origin of the Mountain Pass ultrapotassic and carbonatite intrusive suite, California. J. Pet. 2016, 57, 1555–1598. [Google Scholar] [CrossRef]
  73. Moldoveanu, G.A.; Papangelakis, V.G. An overview of rare-earth recovery by ion-exchange leaching from ion-adsorption clays of various origins. Miner Mag 2016, 80, 63–76. [Google Scholar] [CrossRef]
  74. Frietsch, R. Ore Geology Reviews Rare earth elements in apatite and magnetite in Kiruna-type iron ores and some other iron ore types. Ore Geol. Rev. 1995, 9, 489–510. [Google Scholar] [CrossRef]
  75. Borra, C.R.; Pontikes, Y.; Binnemans, K.; Van Gerven, T. Leaching of rare earths from bauxite residue (red mud). Miner. Eng. 2015, 76, 20–27. [Google Scholar] [CrossRef]
  76. Ochsenkiihn-Petropulu, M.; Lyberopulu, T.; Paris, G. Direct determination of lanthanides, yttrium and scandium in bauxites and red mud from alumina production. Anal. Chim. Acta 1994, 296, 305–313. [Google Scholar] [CrossRef]
  77. Vind, J.; Malfliet, A.; Blanpain, B.; Tsakiridis, P.E.; Tkaczyk, A.H.; Vassiliadou, V.; Panias, D. Rare earth element phases in bauxite residue. Minerals 2018, 8, 77. [Google Scholar] [CrossRef]
  78. Deady, É.; Mouchos, E.; Goodenough, K.; Williamson, B.; Wall, F. Rare Earth Elements in Karst-Bauxites: A Novel Untapped European Resource? In Proceedings of the ERES 2014: 1st Conference on European Rare Earth Resources, Milos, Greece, 4–7 September 2014. [Google Scholar]
  79. Ujaczki, É.; Feigl, V.; Molnár, M.; Cusack, P.; Curtin, T.; Courtney, R.; O’Donoghue, L.; Davris, P.; Hugi, C.; Evangelou, M.W.; et al. Re-using bauxite residues: Benefits beyond (critical raw) material recovery. J. Chem. Technol. Biotechnol. 2018, 93, 2498–2510. [Google Scholar] [CrossRef]
  80. Narayanan, R.P.; Kazantzis, N.K.; Emmert, M.H. Process for Scandium Recovery from Jamaican Bauxite Residue: A Probabilistic Economic Assessment. Mater. Today Proc. 2019, 9, 578–586. [Google Scholar] [CrossRef]
  81. Wagh, A.S.; Pinnock, W.R. Occurrence of Scandium and Rare Earth Elements in Jamaican Bauxite Waste. Econ. Geol. 1987, 82, 757–761. [Google Scholar] [CrossRef]
  82. Boyarintsev, A.V.; Aung, H.Y.; Stepanov, S.I.; Shoustikov, A.A.; Ivanov, P.I.; Giganov, V.G. Evaluation of Main Factors for Improvement of the Scandium Leaching Process from Russian Bauxite Residue (Red Mud) in Carbonate Media. ACS Omega 2022, 7, 259–273. [Google Scholar] [CrossRef] [PubMed]
  83. Radusinović, S.; Papadopoulos, A. The potential for REE and associated critical metals in karstic bauxites and bauxite residue of Montenegro. Minerals 2021, 11, 975. [Google Scholar] [CrossRef]
  84. Ujaczki, É.; Zimmermann, Y.-S.; Feigl, V.; Lenz, M. Recovery of Rare Earth Elements from Hungarian Red Mud with Combined Acid Leaching and Liquid Extraction. 2015. Available online: https://www.researchgate.net/publication/282672503 (accessed on 5 December 2024).
  85. Decarlo, S.; Goodman, S. Russia and Scandium’s Scant Scale. 2022. Available online: https://www.usitc.gov/publications/332/executive_briefings/ebot_russia_and_scandium_scant_scale.pdf (accessed on 5 February 2025).
  86. Narayanan, R.P.; Ma, L.C.; Kazantzis, N.K.; Emmert, M.H. Cost Analysis as a Tool for the Development of Sc Recovery Processes from Bauxite Residue (Red Mud). ACS Sustain. Chem. Eng. 2018, 6, 5333–5341. [Google Scholar] [CrossRef]
  87. Ochsenkiihn-Petropulu, M.; Lyberopulu, T.; Ochsenkiihn’, K.M.; Parissakis, G. Recovery of lanthanides and yttrium from red mud leaching by selective. Anal. Chim. Acta 1996, 319, 249–254. [Google Scholar] [CrossRef]
  88. Russian Aluminum Association (RAA). Aluminium-Scandium Alloys. Available online: https://www.aluminas.ru/en/projects/aluminum_scandium_alloys/?sphrase_id=33349 (accessed on 9 July 2024).
  89. UC RUSAL. RUSAL Sustainability Report 2014. 2015. Available online: https://www.responsibilityreports.com/HostedData/ResponsibilityReportArchive/r/rusal_2014.pdf (accessed on 9 July 2024).
  90. UC RUSAL. RUSAL Sustainability Report 2017. 2018. Available online: https://www.rusal.ru/upload/iblock/247/247fe7043002c65d0835e463cd1d4b92.PDF (accessed on 9 July 2024).
  91. Petrakova, O.V.; Panov, A.V.; Gorbachev, S.N.; Klimentenok, G.N.; Perestoronin, A.V.; Vishnyakov, S.E.; Anashkin, V.S. Improved efficiency of Red Mud processing through Scandium Oxide Recovery. In Light Metals 2015; Wiley: Hoboken, NJ, USA, 2015; pp. 93–96. [Google Scholar]
  92. UC RUSAL. RUSAL Sustainability Report 2016. 2017. Available online: https://www.rusal.ru/upload/iblock/68d/68d57844daba39d2a13ec4fe73b2c07a.pdf (accessed on 9 July 2024).
  93. Zhang, N.; Li, H.X.; Liu, X.M. Recovery of scandium from bauxite residue—Red mud: A review. Rare Met. 2016, 35, 887–900. [Google Scholar] [CrossRef]
  94. Pan, X.; Wu, H.; Lv, Z.; Yu, H.; Tu, G. Recovery of valuable metals from red mud: A comprehensive review. Sci. Total Environ. 2023, 904, 166686. [Google Scholar] [CrossRef]
  95. Rivera, A. Innovative Technologies for Rare Earth Elements Recovery from Bauxite Residue, Leuven. 2019. Available online: https://lirias.kuleuven.be/2334468?limo=0&trk=public_post_comment-text (accessed on 25 September 2024).
  96. Cížková, M.; Mezricky, D.; Rucki, M.; Tóth, T.M.; Náhlík, V.; Lanta, V.; Bišová, K.; Zachleder, V.; Vítová, M. Bio-mining of lanthanides from red mud by green microalgae. Molecules 2019, 24, 1356. [Google Scholar] [CrossRef]
  97. Jouini, M.; Royer-Lavallée, A.; Pabst, T.; Chung, E.; Kim, R.; Cheong, Y.W.; Neculita, C.M. Sustainable Production of Rare Earth Elements from Mine Waste and Geoethics. Minerals 2020, 12, 809. [Google Scholar] [CrossRef]
  98. Joyce, P.J. Environmental Considerations in the Zero-Waste Valorisation of Bauxite Residue: A Life Cycle Perspective. Ph.D. Thesis, KTH Royal Institute of Technology, Stockholm, Sweden, 2018. [Google Scholar]
  99. Panda, S.; Costa, R.B.; Shah, S.S.; Mishra, S.; Bevilaqua, D.; Akcil, A. Biotechnological trends and market impact on the recovery of rare earth elements from bauxite residue (red mud)—A review. Resour. Conserv. Recycl. 2021, 171, 105645. [Google Scholar] [CrossRef]
  100. Binnemans, K.; Jones, P.T.; Fernández, Á.M.; Torres, V.M. Hydrometallurgical Processes for the Recovery of Metals from Steel Industry By-Products: A Critical Review. J. Sustain. Metall. 2020, 6, 505–540. [Google Scholar] [CrossRef]
  101. Joyce, P.J.; Björklund, A. Using Life Cycle Thinking to Assess the Sustainability Benefits of Complex Valorization Pathways for Bauxite Residue. J. Sustain. Metall. 2019, 5, 69–84. [Google Scholar] [CrossRef]
  102. Koltun, P.; Tharumarajah, A. Life Cycle Impact of Rare Earth Elements. ISRN Metall. 2014, 2014, 907536. [Google Scholar] [CrossRef]
  103. Deng, H.; Kendall, A. Life cycle assessment with primary data on heavy rare earth oxides from ion-adsorption clays. Int. J. Life Cycle Assess. 2019, 24, 1643–1652. [Google Scholar] [CrossRef]
  104. Zinoveev, D.; Pasechnik, L.; Fedotov, M.; Dyubanov, V.; Grudinsky, P.; Alpatov, A. Extraction of valuable elements from red mud with a focus on using liquid media—A review. Recycling 2021, 6, 38. [Google Scholar] [CrossRef]
Figure 1. Scheme of sequential step extraction process.
Sustainability 17 01849 g001
Figure 2. X-ray powder diffraction pattern of RM from 10° to 80° (2Ɵ).
Sustainability 17 01849 g002
Figure 3. Rare earth elements, Sc, and Y average concentration determined via ICP in RM samples.
Sustainability 17 01849 g003
Figure 4. Rare earth elements average concentration and extraction efficiency (%) in the initial RM sample at each step of the sequential extraction.
Sustainability 17 01849 g004
Figure 5. RM elements’ average concentration in ppm, determined by ICP in the sequential extraction steps and residue.
Sustainability 17 01849 g005
Figure 6. XRD diffractograms of RM evolution for each step of the sequential extraction process: initial samples (black line), Residue 1 (red line), Residue 2 (blue line), Residue 3 (pink line), and Residue 4 (green line).
Sustainability 17 01849 g006
Figure 7. The IPCC GWP 2013 method yielded the potential greenhouse emissions of the leaching process. Total emissions from Steps 1 to 4 amounted to 36.3 kg of CO2eq/FU (FU: 1 kg of processed RM), with Steps 3 and 4 contributing the most global warming emissions.
Sustainability 17 01849 g007
Table 1. Life cycle inventory (LCI) of the leaching process for REE recovery from RM. Quantities per FU (1 kg of processed RM).
Step of the Leaching ProcessFlowsTypeValueUnit
1Raw Materials
RMInput1kg
Ultrapure waterInput40l
LeachesOutput0.25kg
RM residue (1)Output0.75kg
Energy
MixingElectricity12,800Wh
FilteringElectricity2310Wh
2Raw Materials
RM residue (1)Input0.75kg
Ultrapure waterInput40l
Acetic acid 0.1 MInput0.24kg
LeachesOutput0.15kg
RM residue (2)Output0.60kg
Energy
MixingElectricity12,800Wh
FilteringElectricity2310Wh
3Raw Materials
RM residue (2)Input0.60kg
Ultrapure waterInput40l
HydroxylamineInputs for hydroxylamine hydrochloride 0.5 M0.66kg
Hydrochloride0.73kg
LeachesOutput0.20kg
RM residue (3)Output0.40kg
Energy
MixingElectricity12,800Wh
FilteringElectricity2310Wh
4Raw Materials
RM residue (3)Input0.40kg
Ultrapure waterInput61.30l
Hydrogen peroxideInput8.70kg
AmmoniaInputs for ammonium acetate 0.5 M0.43kg
Acetic acid1.50kg
LeachesOutput0.12kg
RM residue (4)Output0.28kg
Energy
MixingElectricity16,800Wh
Mixing at 85 °CElectricity2000Wh
Heating at 85 °CElectricity1500Wh
FilteringElectricity2310Wh
Table 2. XRF chemical composition of major and minor elements in the RM sample (wt.%).
SampleFe2O3TiO2CaOK2OP2O5SiO2Al2O3MgONa2O
RM 133.314.816.580.380.0514.0320.640.368.60
RM 233.234.836.740.380.0514.2620.500.368.62
RM 333.314.726.160.380.0513.7020.490.338.45
RM 433.484.746.710.370.0513.6920.600.358.40
Average33.3 ± 0.14.78 ± 0.046.55 ± 0.20.38 ± 0.010.05 ± 0.0013.9 ± 0.220.6 ± 0.10.35 ± 0.018.5 ± 0.1
Table 3. XRF chemical composition of trace elements in the RM samples (ppm).
ElementppmElementppmElementppmElementppm
Zr772 ± 12Sc142 ± 2Co29 ± 1Ag27 ± 1
Cr718 ± 16Mn168 ± 1Br9.0 ± 0.1Ba26 ± 2
Ce638 ± 13Pb122 ± 3Tl5.1 ± 0.3Sn18 ± 1
Ni461 ± 6Y101 ± 1Cu31 ± 1Ga10 ± 2
V474 ± 2Nb76 ± 1Mo28 ± 1Bi12.1 ± 0.1
La205 ± 2Th79 ± 1Rb24.3 ± 0.1Se2 ± 1
Nd188 ± 6Sr53 ± 1Cd29.5 ± 04
As151 ± 3Sm34 ± 4W28 ± 1
Table 4. The average concentration (μg/g) of minor and trace elements in RM samples after sequential extraction along with their variation (%) relative to the initial sample concentration.
ElementResidue
μg/g
Δ (μg/g)ElementInitial μg/gΔ (μg/g)ElementResidue
μg/g
Δ (μg/g)
Zr2999288.2Rb24.3−100.0Ce426−27.7
Cr453−36.9W27.5−100.0Gd17−54.1
Ni326−29.3Ba26.3177.1Sc85−45.9
Nd81−60.6Sn17.995.4Yb10−47.1
As67−55.7U12.6−52.3Y73−41.1
Ga24−39.8Co29.236.9Th56−54.8
Pb16635.6REEPr22−59.6
Nb24−69.0La215.0−60.5Sm17−58.5
Sr26−51.3Nd205.6−60.6Tb0−100.0
Cu311.6Lu2.7−100.0Ho0−100.0
Mo15−46.6Er19.0−52.6Dy15−53.6
Disclaimer/Publisher’s Note: The statements, opinions and data contained in all publications are solely those of the individual author(s) and contributor(s) and not of MDPI and/or the editor(s). MDPI and/or the editor(s) disclaim responsibility for any injury to people or property resulting from any ideas, methods, instructions or products referred to in the content.

