Abstract
Gas control and extraction are essential for energy use and sustainable development. In order to study the gas diffusion and transportation law of high-gas tunnels after excavation and blasting and the influence of ventilation on gas concentration, an engineering example is used as a research object. We put forward the “energy concentrating device + digital electronic detonator”, a new type of peripheral hole in the joint initiation of explosive technology, applied to a tunnel in the plateau, studied through field tests and the original “detonating cord + digital electronic detonator” joint detonation technology after a comparative analysis of the blasting effect. On this basis, the characteristics of gas diffusion and transportation near the palm face were studied by numerical simulation under the two working conditions of ventilated and unventilated, and the law of gas diffusion and transportation near the palm face was obtained. The research shows that: with the “energy concentrating device + digital electronic detonator”, a new perimeter hole joint detonation technology compared to the original “detonating cord + digital electronic detonator” joint detonation technology, the explosive unit consumption reduced by 0.2 kg/m3, half-hole retention rate increased by 5%, average charging time shortened from the original 1.3 h to 1.0 h, and stabilizing the cycle of footage at the same time greatly reduces the cost of consumables, improving the tunnel surface blasting effect; numerical simulation shows that under the condition of no ventilation, the gas accumulation near the arch top and arch waist at the tunnel face is severe, with the gas concentration close to 30%, the gas concentration is higher up to 7 m from the face after the gas state is stabilized, and the gradient of the gas concentration in the area beyond 7 m is small. The gas concentration in the area can be reduced to the safe range after ventilation in about 30 s, but gas accumulation easily occurs in the foot and arch waist on the opposite side of the wind pipe. The results of this study can provide a reference basis for similar gas tunnel blasting construction and ventilation optimization and promote the sustainable development of energy.
1. Introduction
In the past decade, China’s tunnel and underground engineering construction business has had rapid development, with the number of tunnels and the total mileage having a trend of year-on-year growth. As of the end of 2023, China’s total mileage of tunnels reached 53,739.8 km, an increase of 4977.8 km compared with 2022. Among them, the mileage of highway tunnels accounts for 56% of the total mileage of tunnels in China; the mileage of railroad tunnels accounts for 44% of the total mileage of tunnels in China. Not only has there been a breakthrough in the number and length of tunnels but the tunnel construction technology and techniques have also been continuously upgraded. However, tunnel gas overrun and gas explosion safety accidents still occur from time to time, and good gas monitoring and emission work is an important guarantee for safe tunnel construction.
In recent years, many scholars have achieved a lot of research results in the field of tunnel blasting, tunnel ventilation, and gas transportation through theoretical analysis, numerical simulation, and field experiments. In the field of tunnel blasting, Zhu et al. [1,2,3] studied the damage and fracture characteristics of the media and the surrounding rock after shaped blasting by means of theoretical research, numerical simulation, and experiment, which provided theoretical references for safe and efficient production in the coal industry. Li et al. [4,5,6,7] theoretically analyzed the in situ stress and the stress distribution around the blast holes under the action of the blasting load, and they used the numerical simulation scheme to study the magnitude of the in situ stress and the lateral pressure coefficient on the impact of the fracture zone and blasting area was studied. Lei et al. [8,9,10] carried out a comparative analysis of the drilling and blasting method and full-section tunnel boring machine (TBM) construction effect to further analyze the deformation of the surrounding rock, overexcavation, underexcavation, and the scope of the loosening of the circle. They discussed the minimum surface blasting parameters under the conditions of the tunnel construction of the actual blasting effect of the test and the establishment of the tunnel fault drilling and blasting parameter optimization algorithm model. Huo et al. [11,12] evaluated the damage degree of transverse blasting of large-diameter holes by measuring the acoustic wave velocity and the boundary of the cavitation zone, studied the blasting damage characteristics of different rows of loading structure, and obtained the optimal loading structure of each row. Yu et al. [13] investigated the blasting-induced rock movement by using the finite element method for calculating the blasting load and the simulation method of the bonded particle method for the simulation of the bench blasting. Yin et al. [14,15,16] investigated the blasting charging method and groove blasting scheme through theoretical analysis and numerical simulation, and they proposed an innovative rock blasting shaping charging method and an improved groove blasting design method for deep rock bodies, respectively. Salum et al. [17] discussed the determination of the optimum excavation circle length and the control of overcutting in tunnel excavation in different rock types, and the excavation sequence, top boring, and step requirements were also addressed. Qiu et al. [18] obtained the deformation response of four strain components during blasting by observing the surface deformation characteristics of the physical model through the DIC system to analyze the effect of the blasting location on the surface deformation and damage characteristics.
In the field of gas numerical simulation, Ding et al. [19] develop a novel analytical solution for a reactive contaminant transport model associated with time- and space-dependent internal and boundary sources. Transient solutions for the multi-type source model were derived using Laplace transform, Fourier cosine transform, variable substitution method, and coordinate transformation techniques. Tan et al. [20] used Fluent software to simulate gas explosions in straight tunnels of different sizes and compared them with the experimental data to conclude that the Fluent software can accurately simulate the conditions of gas explosions. Zhang et al. [21] used the finite volume method to systematically study the key parameters affecting the gas explosion load of the comprehensive pipeline corridor, gave the spatial and temporal distribution equation of the gas explosion load of the comprehensive pipeline corridor, and analyzed the importance of each parameter. Lu et al. [22,23] used the FLAC3D software and the Mohr–Coulomb damage criterion to study the stress difference in the front of the excavation, established 31 homogeneous models to study the stress difference affected by the mechanical properties of coal seams, and established another 8 non-homogeneous models to study the effect of the sudden change in mechanical properties of the coal seams on the stress difference. Zhou et al. [24,25] conducted gas desorption experiments on coal particles of different sizes at different air pressures and temperatures, and they investigated the effect of fast gas desorption on the propagation characteristics of the protruding shock wave and airflow. Wei et al. [26] established an evolution model of porosity and permeability, and, based on the effective stress equation and permeability model, they developed a gas–solid simulation software named TOUGH2(CH4)-FLAC by linking two existing simulators (TOUGH2 and FLAC3D) and simulated and analyzed the gas flow in the rockburst process. Zheng et al. [27] studied the multi-field evolution of the coal spontaneous combustion process and the degree of joint disaster risk in the gas-containing environment of the mining airspace by building a thermal test simulation platform for thermodynamic disaster in the mining airspace. Zhou et al. [28,29] established a mathematical model of protruding dynamic effect and used numerical simulation to study the characterization of different factors in the two-phase flow in the process of protruding. Wang et al. analyzed the factors of leakage of wind around the roadway and drilling holes [30] and analyzed the air leakage factors around the tunnel and borehole, and they studied the influence of each factor on the gas concentration. Zhou et al. [31] established a three-dimensional gas distribution model of the mining area, used COMSOL numerical simulation software to study the influence of extraction parameters on the effect of gas extraction, and, combined with the field experiments, they made conclusions about the influence of the spacing of the inserted pipe and the negative pressure of extraction on the effect of extraction. Gao et al. [32] used OpenFOAM numerical values and numerical simulations to study the effect of a very low gas concentration on the explosive properties of the gas. Gao et al. [33] used a self-developed experimental device for measuring the kinetic effect of coal and gas protrusion to conduct protrusion experiments under different adsorption effects, and they investigated the role of adsorption in the dynamics of coal and gas protrusion. Liu et al. [34,35,36,37,38,39,40,41,42] selected a reasonable model to simulate a tunnel project through repeated comparisons and continuous summarization of the computational methods, and they analyzed the diffusion and accumulation of harmful gases in the tunnel. Wei et al. [43] constructed a thermo-hydraulic–mechanical coupled gas emission (THMGE) model and verified the gas emission results with three driving headings, and through calculations, they analyzed the effects of temperature, time, and gas pressure on gas emission.
In the field of tunnel ventilation, Cao et al. [44] analyzed the main source and formation mechanism of the gas in the tunnel, and a hydrodynamic calculation model was established for gas tunnel ventilation with an auxiliary vertical shaft. The k-ε two-equation turbulence model was used to simulate the ventilation effect under different wind velocities, and the flow field distribution characteristics and gas migration regularity under the auxiliary ventilation conditions were obtained. Zhang et al. [45] apply the CFD numerical simulation method to study the gas tunnel airflow and dust and gas transport law during the digging process, and ventilation optimization was carried out for this gas tunnel. Andrian et al. [46] use computer modeling to study the hypothesis of the piston effect during mine gas migration caused by fault reactivation to explain cases of a sudden appearance of mine gases on the earth surface in coal mining areas. Jaroslaw et al. [47] present the application of numerical modeling with the use of TOUGHv2.0 software, which enabled effective simulation of the multi-phase flow, applying adsorption and diffusion phenomena. Zhang et al. [48,49] took the ventilation system of the gas tunnel in Songjiang District, Shanghai, as the research object, established a fault tree model of the ventilation system, and they built a corresponding Bayesian network evaluation model according to the mapping rules. The fuzzy probabilities obtained from fuzzy set theory and multi-layer expert judgment were used as a priori probabilities to assess the reliability of the ventilation system, and finally, the hierarchical management measures of the ventilation system were formulated. Huang et al. [50,51,52] simulated the ventilation systems of coal mines and subways under complex conditions, and they verified the feasibility of the ventilation system and optimized it. Si et al. [53] constructed a gas transport model for water intrusion into a coal seam, verified the mathematical model by comparing with field data, and then analyzed the effects of diffusion coefficient, permeability, Henry’s constant, and radius of water-saturated coal seam on the residual gas pressure and gas yield by numerical calculations. Wang et al. [54] conducted experimental studies on the propagation rules of shock wave and airflow caused by eruption under different airflow and local resistance conditions by adopting the experimental system of coal and gas protrusion. Zeng et al. [55] investigated the effects of ventilation frequency and longitudinal velocity on ambient temperature in tunnels by numerical simulation, and they conducted scaled-down modeling tests to study the temperature field of the surrounding rock and airflow in longitudinally ventilated tunnels. Xia et al. [56] investigated the effects of the main vent position, the length of the main beam guide plate, and the exhaust air volume on the flow field distribution and dust flow behavior of open TBMs by means of numerical simulation. Cong et al. [57] compared four types of shafts in normal ventilation mode and smoke exhaust mode, and they investigated the effects of the shaft type, the operating frequency of the jet fan, and the position of the plate. Fu et al. [58] established a new unventilated excavation system model for the application of non-ventilated excavation treatment based on closed-space high-gas coal seam coal resources with gas simultaneous mining theory, and a new model of unventilated excavation systems was established, which provides a theoretical basis for the application of non-ventilated excavation treatment. Hou et al. [59,60,61,62,63,64,65,66] established a rectangular spatial finite element model, and they investigated the effect of obstacle location on hydrogen diffusion behavior under unventilated, natural, and mechanical ventilation conditions by monitoring hydrogen concentration along the line and on the iso-surface.
The above study mainly analyzed the ventilation conditions of gas diffusion and transport throughout the tunnel, however, the area near the palm face is the most prone to gas accumulation phenomena and an important safety hazard area. This paper takes a gas tunnel under construction in China as a research object, first of all, to carry out a comparative analysis of the blasting effect of the two old and new peripheral holes and, combined with detonation technology, we demonstrate the superiority of the new peripheral hole joint detonation technology. On this basis, we further use Ansys Fluent 2022 R1 software to simulate the gas flow field during tunnel blasting and excavation, we respectively study the gas spatial distribution characteristics of the gas near the face of the palm of the post-burst ventilation and non-ventilation of the two cases and consider the time of the flow characteristics of the gas, and we analyze the effect of ventilation on the concentration and distribution of the gas, the division of the significant impact of the gas near the face of the palm of the area, and the gas concentration of the tunnel to monitor the optimization of the ventilation to provide a reference for the gas concentration. The technical roadmap of the article is shown in Figure 1.
Figure 1.
Technology roadmap.
2. Project Overview
The tunnel is located in an oil and gas basin and is endowed with coal and, according to the nearby borehole test, the maximum concentration of methane in the Cretaceous Doni Formation coal seam reaches 27,270 ppm, and the Doni Formation coal seam is the main mining layer in the Bianba-Luolong coal belt. Therefore, this section is not only affected by shallow natural gas but also by coal bed methane. According to the calculation results of absolute gas outflow of coal seam parameters, the absolute gas outflow Qabsolute = 5.58 m3/min, and the comprehensive evaluation of this section is that it is a high-gas section. During the survey period, 24 holes/27 on-site harmful gas detections were carried out in the tunnel, and the main harmful gas components detected in each hole of the tunnel were: carbon dioxide (CO2), methane (CH4), hydrogen sulfide (H2S), sulfur dioxide (SO2), and nitrogen oxides (NO2).
3. New Program Blasting Technology
3.1. Parameters of the Original Programmed Holes and the Perimeter Hole Blasting Program
The tunnel inlet length is 3500 m, the rock body is broken, rock stability is poor, and the average compressive strength is 95~120 MPa. The original program adopts “detonating cord + digital electronic detonator” detonation technology (Figure 2) and the use of a three-armed rock drilling cart for drilling. The borehole parameters are shown in Table 1, the borehole layout diagram in Figure 3.

Figure 2.
Diagram of detonating cord + digital electronic detonator connection.

Table 1.
Charging parameters for blast holes of the original scheme.

Figure 3.
Original scheme gun hole layout (unit: cm).
As can be seen from Table 1, the number of peripheral holes is 51, the depth of the holes is 3.8 m, the diameter of the holes is 45 mm, the spacing is 50 cm, the interpolation angle of peripheral holes is 2°, the detonator includes a digital electronic detonator, the segments are set up as 8 segments, emulsified explosives of specification φ32 mm are used, and the loading capacity of a single hole is 1.2 kg.
At present, the tunnel peripheral hole surface blasting charging method basically uses detonator + detonator combined technology. The operating method is to advance the explosives in accordance with a certain distance segmentation tied to a bamboo sheet, and then run through a detonating cord. The combination is transported to the tunnel palms facing the perimeter of the hole, the detonating cord will be stroked and tied to the detonator + detonator, and the detonator + detonator is tied to about 4 to 6 detonating cords. This technology can realize the peripheral hole interval loading but the operation is cumbersome. There is a large consumption of detonating cord and because of the detonating cord’s improper artificial lap it is very easy to blind gun.
3.2. Design of New Perimeter Hole Blasting Program
A fusion device is made of PVC polymerization pipe and a metal drug cover, with PVC polymerization pipe for the side of the cylindrical opening and PVC polymerization pipe on both sides of the inner wall of the two polymerization grooves. The metal drug cover is conical, placed in the PVC polymerization pipe at one end. The working principle of the poly charge is the use of the explosive’s special charging structure (cavities) to transfer energy to the drug cover. For the conical drug cover, the energy generated by the explosion in the axis of convergence forms a high-speed metal jet detonation of the next section of explosives, playing a role in the transmission of explosives. At the same time, the two built-in aggregation device slots and the excavation contour line coincide and can be efficiently utilized along the radial propagation of explosives’ explosion shock wave energy, increasing the peripheral hole spacing as well as the role of the light explosion layer of the explosion energy. The polymerization device of the PVC polymerization pipe points out of the excavation contour of the surrounding rock, through the pipe wall attenuation of the shock wave acting on the surrounding rock, playing a role in protecting the surrounding rock. The polymerization device and charge structure are shown in Figure 4.
Figure 4.
Shaped hood and charge structure diagram.
The design of the new program still includes the idea of explosives in accordance with sections of certain size bound to the bamboo sheet, without the use of detonating cord and instead using the polymerization device. As the plateau tunnel is made using three-arm rock drill truck drilling, with a peripheral hole depth of up to 4 m, the length of the charge needs to be about 3 m. With the use of polymerization device loading mode, for the first section of emulsion explosives, using a knife to cut one end flat, the polymerization device will be pressed into the emulsion explosive plastic film packaging, tie at 1 position on the bottom end of the bamboo sheet, and then both ends of three and a half sections of emulsion explosives are cut with a knife. The same method is used when the polymerization device is inserted into plastic film packaging, bound to the bamboo sheet. Each section of the explosives has a spacing of 50 cm, and for all the polymerization devices, the side with the opening points to the bamboo sheet. Finally, a section of emulsion explosives without poly devices is tied to the bamboo sheet, with the same interval of 50 cm, and the final length of the charge is 305 cm. Finally, the combination will be transported to the tunnel to blast the palm face. In the primer, a digital electronic detonator is inserted into the peripheral holes after adjusting the combination of the angle of the poly slot and the excavation contour line coincides with the blasting operation. The poly energy device charging structure is shown in Figure 5.

Figure 5.
Schematic diagram of the structure of a polycapsule charge.
3.3. Field Tests and Evaluation of Blasting Effectiveness
Because of the tunnels in the plateau region, the construction schedule is difficult and experiments in the tunnel palm face alone cannot be carried out, so the use of a “construction and test” approach is needed. First of all, the original detonating cord + detonator combined technology blasting is carried out for ten cycles. Then, workers are educated with the relevant knowledge of the polymer device charging structure, and then the polymer device charging structure is used to test ten cycles and the data are compared with the original charging method.
3.3.1. Blasting Effects of the Original Program
In accordance with the above gun hole parameters for on-site blasting tests, after on-site research, ten cycles of feeder on-site loading and post-blast effects are detailed in Table 2. As can be seen from Table 2, the original program perimeter hole depth is 3.8 m, the maximum post-blast footage is 3.7 m, the minimum is 3.3 m, the number of detonators used is about 190 rounds, the use of detonating cord is about 300 m, and the average unit consumption of explosives is 1.05~1.22, which is related to the perimeter hole for the evaluation of the effect of blasting after the half-hole rate of more than 80% seven times, belonging to a good level, and there are three from 70~80%, belonging to a moderate level. The utilization rate of the blast holes exceeded 95% on two occasions, which is a good level, and between 85% and 95% on eight occasions, which is an average level. The average loading time of each cycle is 1.3 h. The overall smoothness of the contour in Figure 6a of the actual field research after blasting is average. In Figure 6b the blast pile is concentrated and dense, the rock is more fractured, and the bulk rate is low. In three of these cases, there were individual perimeter holes that refused to burst as shown in Figure 7.
Table 2.
Actual charge parameters and post-explosive effects statistics of the original scheme.

Figure 6.
Original program after the explosion.

Figure 7.
Perimeter hole explosives refused to explode.
3.3.2. Blasting Effects of the New Program
The new blasting program’s shell hole parameters are unchanged, and the perimeter holes are loaded with spaced poly energy devices. Before loading, firstly, according to the technical points, the explosives of the polymerization device are assembled, the explosives are spaced 50 cm, and the length of loading is 305 cm (Figure 8). The combination is transported to the palm surface to be blasted. The digital electronic detonator is inserted in the primer and then slowly put into the peripheral hole, and finally the digital electronic detonator is grouped for detonation.
Figure 8.
Polycap explosive assemblies.
After on-site research, the peripheral holes for spaced polymerization devices loading ten times the cycle of feeding the field loading and post-blast effect details are shown in Table 3. Table 3 shows that the peripheral holes had a depth of 3.8 m, and with the cycle of post-blast footage it was 3.4~3.6 m. The number of digital electronic detonators used increased, with an average of 220 rounds used in one cycle, and the unit consumption of explosives decreased, ranging between 0.91 and 0.97. The half-hole rate associated with perimeter holes for post-blast effect evaluation exceeded 80% on nine occasions, which is a good level, and was below 80% only once, which is an average level. Only the first test was below 90 per cent, and all subsequent tests were above 90 per cent, which is a good level. The loading time of each cycle was significantly reduced, with an average time of 1 h. The overall contour smoothness in Figure 9a of the actual on-site research after blasting is good, and the half-hole marks are clear. In Figure 9b, the burst pile is concentrated and dense, with a general rate of chunking. The shortcomings of the second test are that there was a refusal to detonate, combined with the actual construction of the site analysis, due to the second production of poly energy device spacing charge combination, the distance between the poly energy device spacing not being 50 cm, or even more than 80 cm, and because of the surrounding rock lithology is poor and the existence of the phenomenon of collapsed holes, so the ability of poly energy devices to detonate was reduced and led to the first half of the explosives refusing to detonate. The polymerization device charge refused to explode as shown in Figure 10.
Table 3.
Actual charge parameters and post-explosive effects statistics of the new scheme.
Figure 9.
New program post-explosion effect.
Figure 10.
Right wall fusion hood loaded to resist detonation.
3.3.3. Analysis of New Program Advancement
Comparison of the post-blast effects of the new and original schemes is shown in Table 4, Figure 11, Figure 12, Figure 13 and Figure 14, where the parameters are all averaged over 10 cycles.
Table 4.
Comparison of the effect of the original program and the new program after the explosion.
Figure 11.
Comparison of the unit consumption of explosives.
Figure 12.
Comparison of borehole utilization.
Figure 13.
Comparison of semi-porosity.
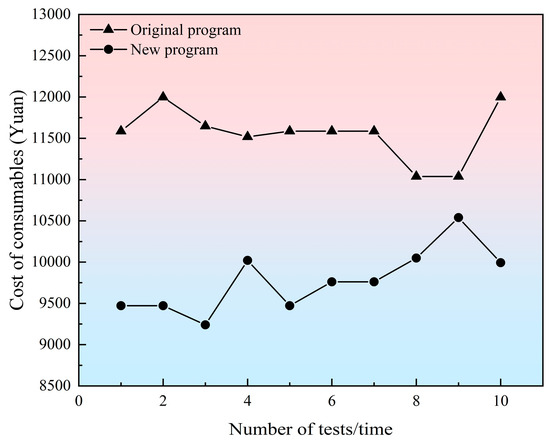
Figure 14.
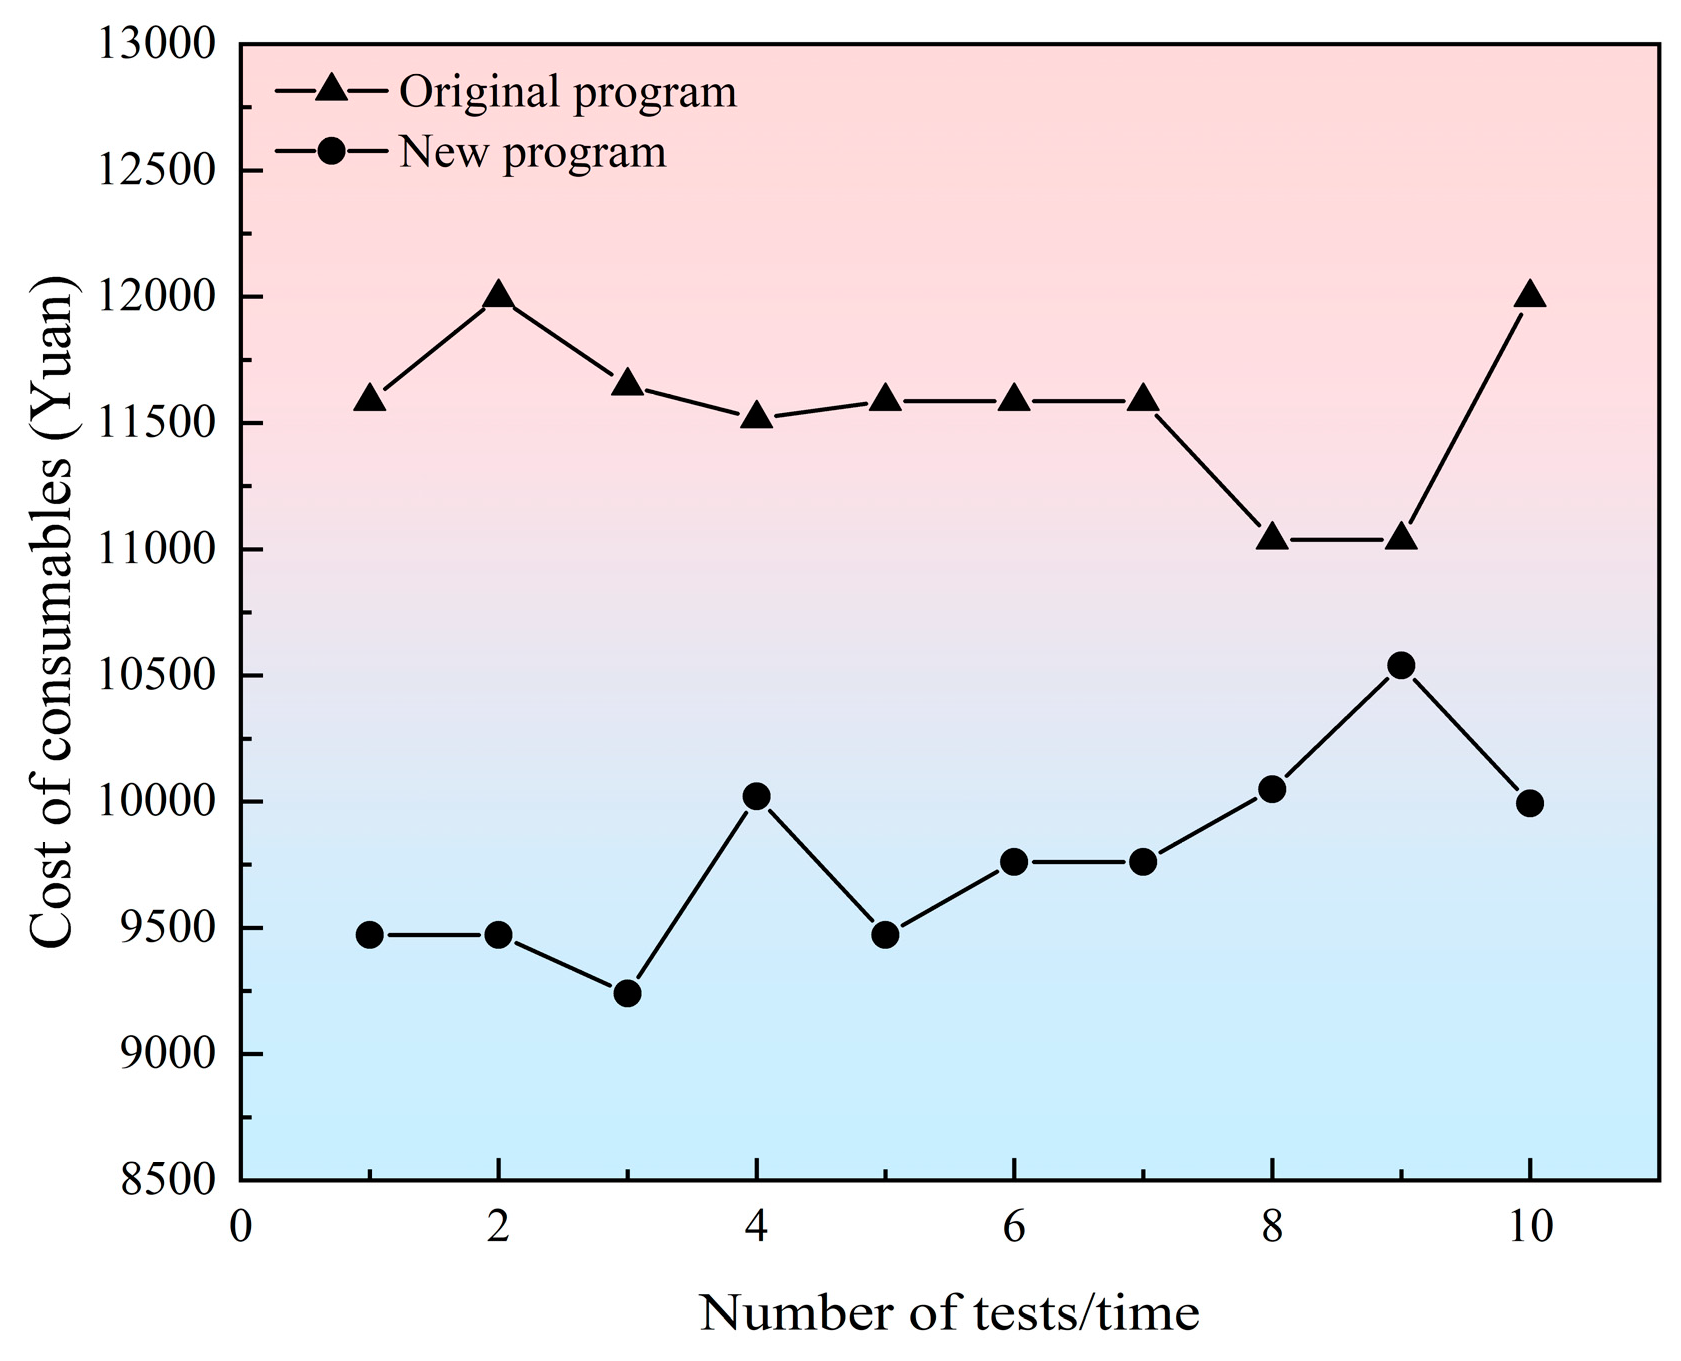
Comparison of consumable costs.
(1) The use of the “energy concentrating device + digital electronic detonator” charging method compared to the original “detonating cord + digital electronic detonator” charging method, because of the polymerization device, can ensure that the explosive explosion energy is fully utilized, and the internal polymerization groove has a jet cutting effect on the contour of the rock. The jet cutting effect, increasing the spacing of explosives, reduces the amount of explosives used in each perimeter hole, compared with the original program’s explosive unit consumption which is higher than 1.05 kg/m3, while the new program reduced the explosive unit consumption to 1.0 kg/m3 or less. Reducing the unit consumption of explosives also means reducing the cost of consumables in each cycle.
(2) The use of the “detonating cord + digital electronic detonator” charging method after blasting cycle footage is not stable, the utilization rate of the gun hole is not stable, and the use of the “energy concentrating device + digital electronic detonator” charging method due to the poly device’s internal polymerization groove in the explosion of explosives makes full use of the energy generated by the explosive device in the explosion of the contour of the rock to play the role of jet cutting. Therefore, the spacing between the explosives can be increased to 50 cm, and the front end of the poly energy device can manage the front end of the drug mask in this spacing in the role of the jet propagation of the explosion. The overall length of the charge is 3 m, so in the peripheral holes with a depth of 3.8 m, the feed can be stabilized at 3.5 m or so.
(3) With the use of the “detonating cord + digital electronic detonator” loading method, the after blasting half-hole residual rate is low and the average half-hole residual rate of 80.19%, while with the use of the “energy concentrating device + digital electronic detonator” loading method, the explosive spacing is larger so that the average amount of each section of charge is different. At the same time, the PVC poly energy pipe of the poly energy device has a certain protective effect on the peripheral rock outside the contour, so the half-hole residual rate is improved, and the average half-hole residual rate is 84.31%.
(4) The original program’s consumables include emulsion explosives, detonating cord, and a digital electronic detonator, while the new program’s consumables include emulsion explosives, polymerization devices, and a digital electronic detonator. Due to the plateau area, the consumables’ cost is higher, and the price of the emulsion explosives is 12,000 ¥/t, detonating cord is 7 ¥/m, the digital electronic detonator unit is CNY 26, and the polymerization device unit is CNY 2. Compared to the old program, for the cost of consumables of each cycle for statistical purposes, it was found that with the use of the new program costs are greatly reduced, each cycle can save a cost of consumables of around CNY 2000.
(5) The new program, in the loading due to the lack of detonating cord lap, is less time consuming compared to the original program and can reduce the average loading time by 0.3 h.
4. Wind Speed Calculation and Numerical Simulation Modeling
4.1. Calculation of Required Air Volume and Air Velocity
(1) Calculated on the basis of the maximum number of people working in the cave at the same time:
where: q is the fresh air needed per minute per person, taken as 4 m3/min; m is the maximum number of people working in the cave at the same time, taken as 50 people.
Then = 4 × 50 = 200 m3/min = 33.3 m3/s.
(2) Calculated on the basis of blast exhaust:
where: t is the ventilation time, generally 20~30 min, taken as 30 min; A is each cycle of blasting explosive dosage, taken as 249 kg; S is the tunnel section area, 95 m2; L is the length of the tunnel or critical length, 150 m; p is the leakage coefficient, according to the performance of the wind turbine and the relevant norms taken as 1.1; b is the amount of harmful gases generated by the explosion of 1 kg of explosives, taken as 40 L/kg; k is the drenching coefficient, taken as 0.8; C is the permissible concentration of CO, 0.024%.
Then = 0.0155 × 177,280 = 2749 m3/min = 45.8 m3/s.
(3) Calculated based on minimum wind speed:
where: V is the minimum wind speed allowed in the hole, taken as 0.3 m/s; S is the tunnel section area, 95 m2.
Then Q3 = 0.3 × 95 × 60 = 1710 m3/min = 28.5 m3/s.
(4) Calculated based on absolute gas outflow:
where: q is the absolute gas outflow, taken as 5.58 m3/min; k is the unevenness coefficient of gas outflow, taken as 1.5~2.
Then = 100 × 5.58 × 2 = 1116 m3/min = 18.6 m3/s.
(5) Calculated based on dilution and discharge of internal combustion engine exhaust gas:
where: q is the air volume required per unit power of the internal combustion engine, taken as 3 m3/(min·kW); Ni is the power of each internal combustion engine, kW; Ti is the utilization coefficient of the internal combustion engine at work, which is taken as 0.65.
In the process of tunnel construction, the internal combustion engine in the tunnel generally includes a loader (with a power of 162 kW), an excavator (with a power of 110 kW), and two dump trucks (with a power of 210 kW). The use of the internal combustion engine is generally avoided in the gas tunnel. Generally, two dump trucks cooperate with the loader and the internal combustion engine to work at the same time. The power of the loader, 162 kW, is taken for calculation.
Then = 3 × (162 + 210 × 2) × 0.65 = 1134.9 m3/min = 18.9 m3/s.
Based on the above calculations, the maximum value of = 2749 m3/min is taken as the control design ventilation volume.
Calculate the air velocity according to the following formula based on the required air volume:
where: Q is the required air volume, m3/min; S is the wind pipe section area, and the wind pipe radius is 0.8 m, so the wind pipe section area is 2.0096 m2.
The wind speed V = 22.8 m/s was calculated.
4.2. Governing Equation
In the tunnel gas ventilation process, the fluid theories of conservation of mass, conservation of energy, and conservation of momentum need to be fulfilled. In addition, the incoming fresh air and gas convection in the tunnel will be turbulent and the airflow field in the tunnel will be turbulent. The ventilation process does not take into account the chemical reaction between the air and the gas, so the use of a turbulence model and the component transport model for tunnel ventilation simulation, turbulence selection of the standard model of the principal structure, and the equations of control, including momentum equations, energy equations, the equation of continuity, and the component transport equations is needed.
4.3. Model Building and Meshing
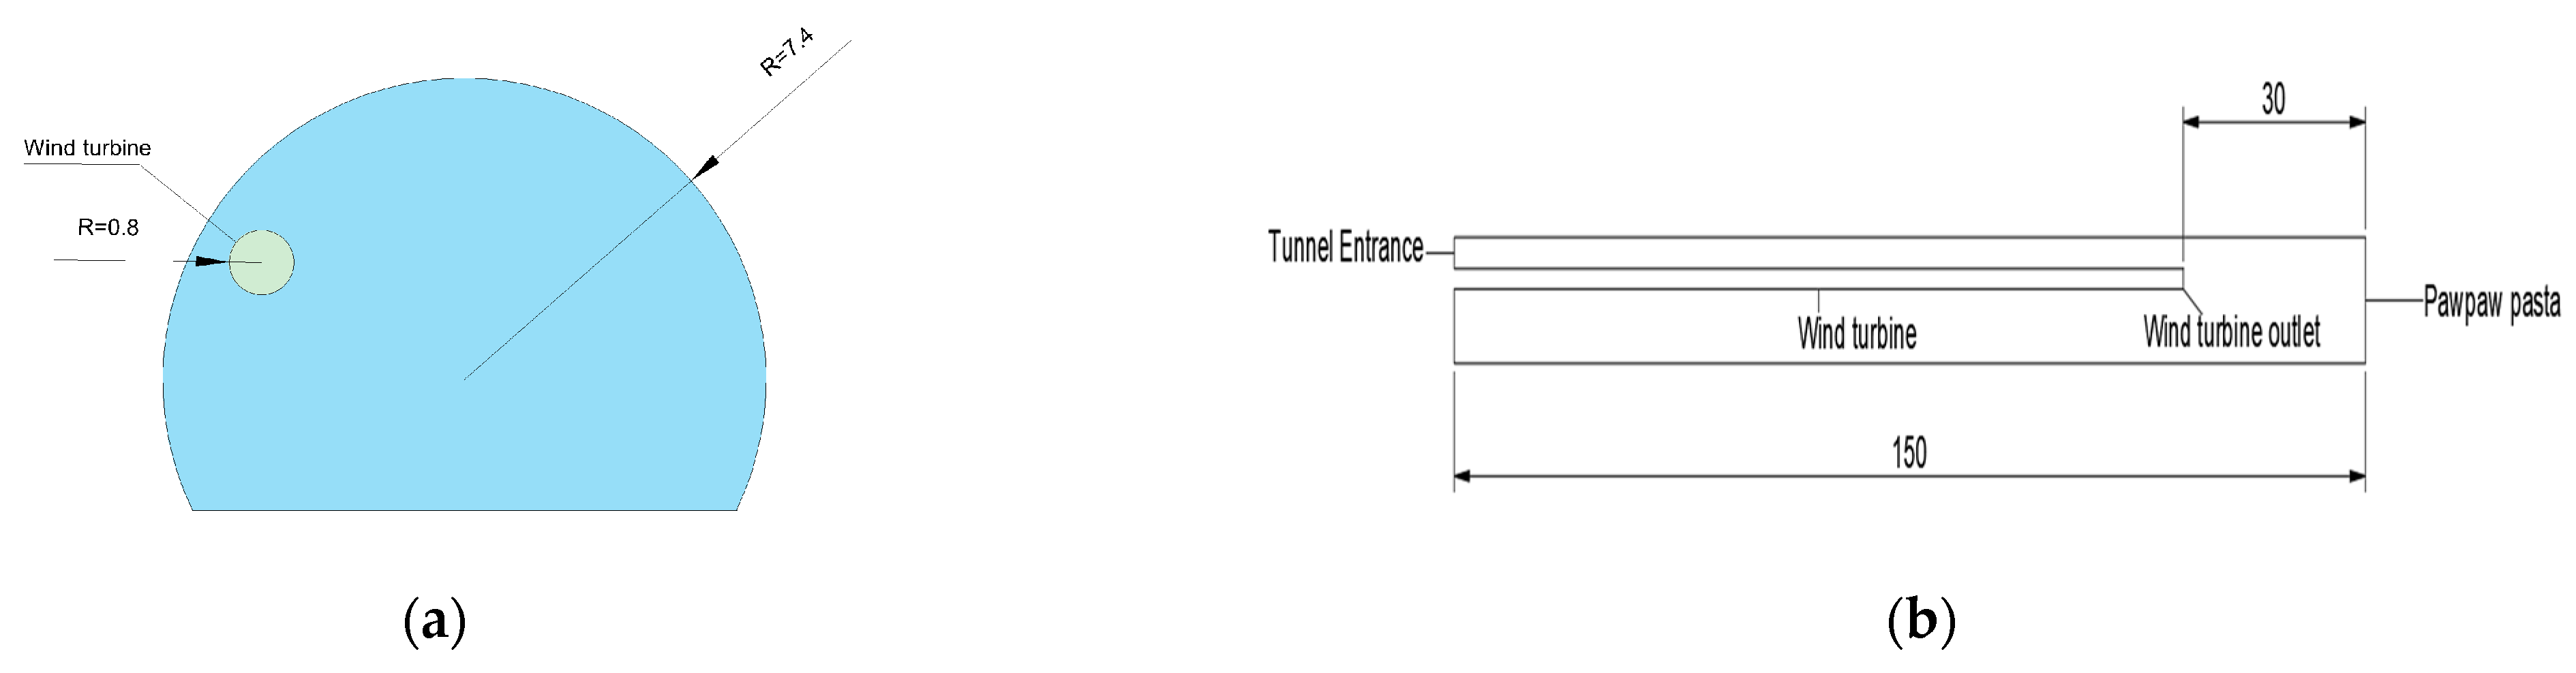
CATIA P3 V5-6R2020 modeling software was used to establish a three-dimensional numerical calculation model of the tunnel. The length of the tunnel is 150 m, the cross-section radius is 7.4 m, the wind turbine is located in the left side of the tunnel exit at the waist of the arch, the radius of the wind turbine is 0.8 m, the length of the wind turbine is set to 120 m, and the wind turbine exit and the distance from the face of the palm is 30 m, in accordance with the following formula after the calculation of the distance in the ventilation of the effective range of the cross-section of the tunnel exit and the longitudinal wall of the wind turbine. The cross-section of the tunnel exit and longitudinal section of the wind pipe side wall are shown in Figure 15.
where: Ls is the wind flow effective range (m); A is the tunnel section area, 95 m2; (4~5) is the wind flow effective range coefficient. When the wind speed of wind turbine outlet is low it is 4, when the wind speed of wind turbine outlet is high it is 5, the wind flow effective range coefficient is 4.

Figure 15.
Schematic diagram of tunnel section. (a) Cross-sectional view of the tunnel exit (unit: m). (b) Longitudinal section of the side wall of the duct (unit: m).
After calculation, the effective range Ls of the wind flow is 39 m, and the distance between the outlet of the wind pipe and the palm face is within this range. The model is meshed using ICEM-CFD 2022 R1 software and the meshed mesh is shown in Figure 16.
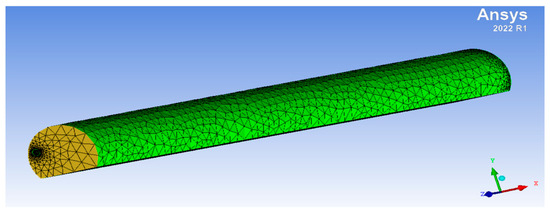
Figure 16.
Model meshing with different colors representing boundary conditions. The yellow region indicates the exit, while the green region represents the wall.
4.4. Basic Hypothesis
The following assumptions are made to make the numerical simulation calculations concise and efficient:
- (1)
- Assume that the fresh air introduced does not react chemically with the gas and is not compressed.
- (2)
- Assume that the tunnel walls are insulated and at a constant temperature.
- (3)
- Assume that the airflow is uniform from the duct and that the gas comes out uniformly in a certain amount per unit of time.
4.5. Boundary Condition Setting
- (1)
- Entrance conditions: Set the outlet of the wind turbine as the entrance of the velocity flow and, according to the results of the calculation in Section 3 of this paper, the wind speed is selected as 22.8 m/s, and the wind flow is uniformly flowing into the tunnel along the direction perpendicular to the outlet of the wind turbine.
- (2)
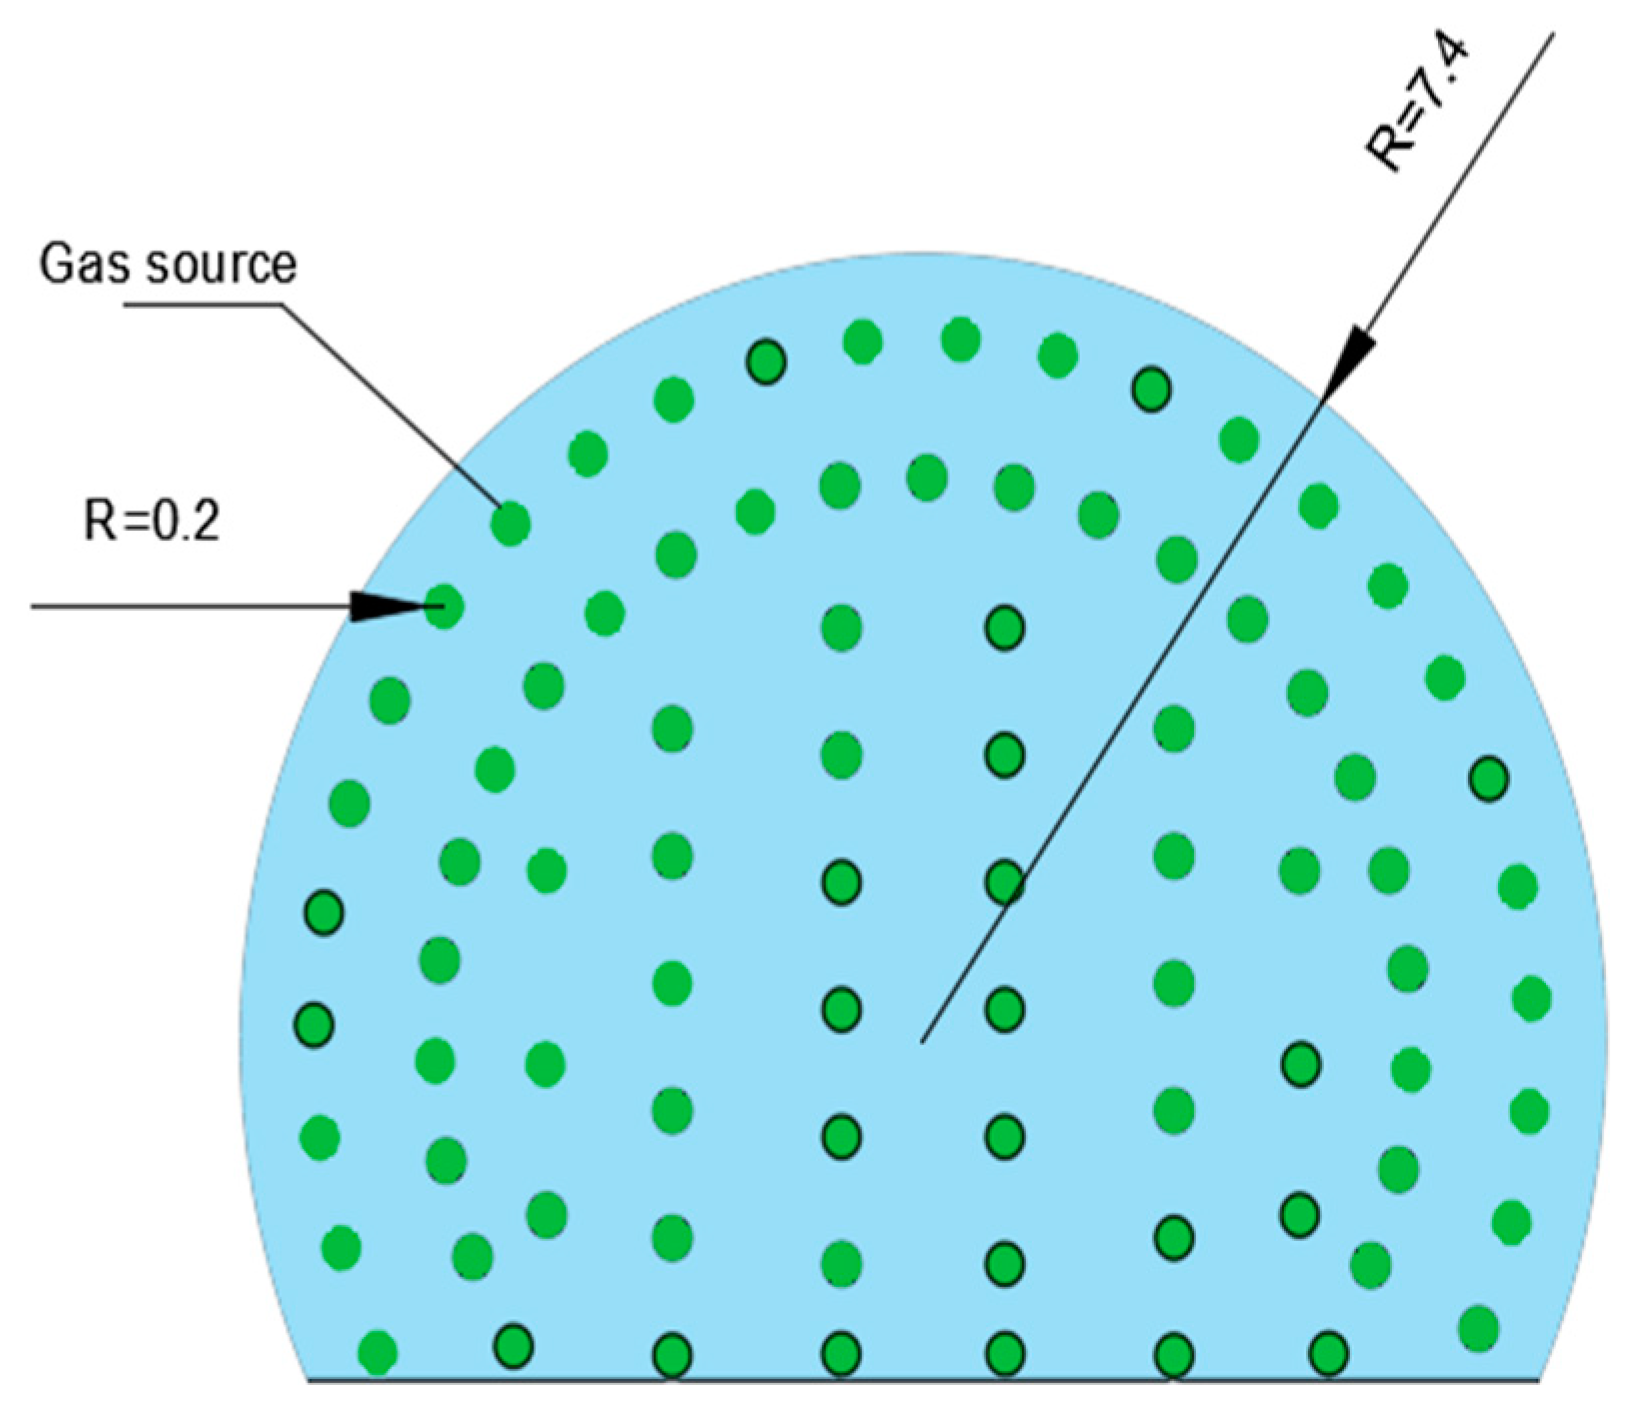
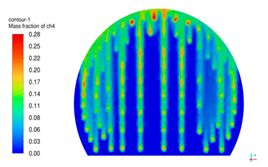
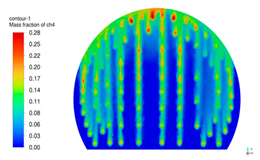
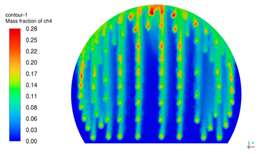
- Working face conditions: In this paper, the gas influx is handled by source terms. In order to facilitate the calculation and processing, 83 gas source terms are uniformly set up in the tunnel palm face, and the arrangement is shown in Figure 17. It is assumed that the gas in a unit of time has uniform outflow, according to the following formula to calculate the value of the gas source term, defining V1 for the unit area and the amount of gas outflow per unit of time in the working face.
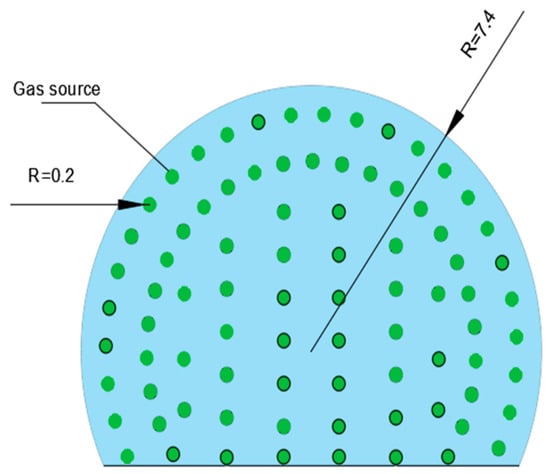 Figure 17. Diagram of gas sources (unit: m).
The gas source term V1 at the palm face was calculated to be 0.0088 kg/(m3⋅s).
- (3)
- Exit condition: Set the tunnel inlet as a free-flow exit, this boundary does not have any effect on the flow field in the tunnel.
- (4)
- Wall conditions: Set the tunnel sidewalls, tunnel floor, and wind tunnel walls as standard wall surfaces, with no wall slippage and isothermal adiabatic.
4.6. Calculation of Working Conditions
The numerical simulation process is carried out according to the following two working conditions:
- (1)
- Simulation of gas diffusion over time at the face of the palm in the case of no ventilation.
- (2)
- Ventilation of the tunnel with an air velocity of 22.8 m/s through an air duct to simulate the change in gas concentration at different distances from the face of the palm in the ventilated condition.
5. Analysis of Simulation Results
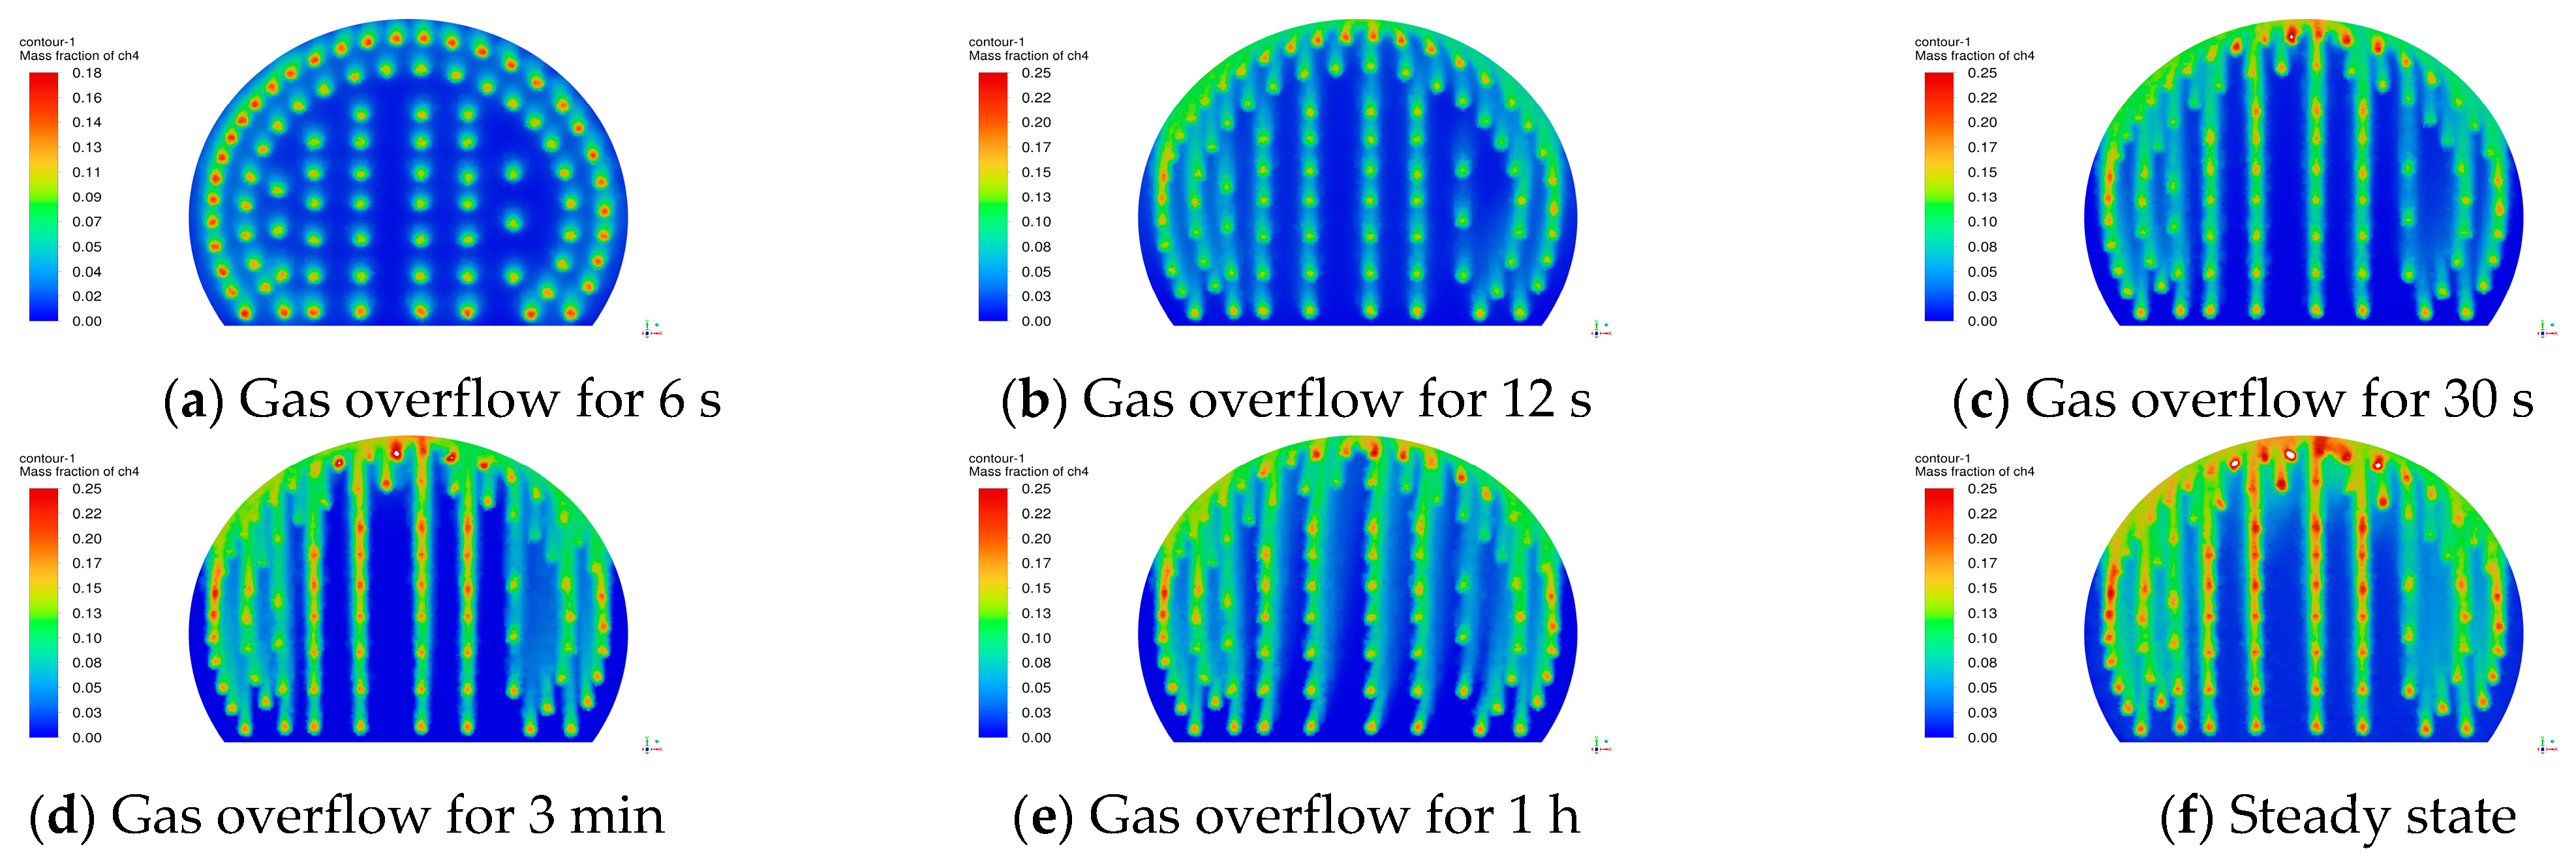
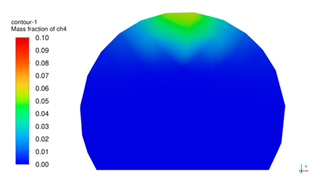
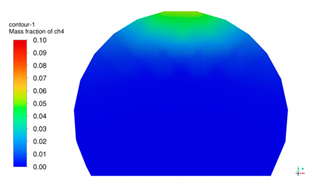
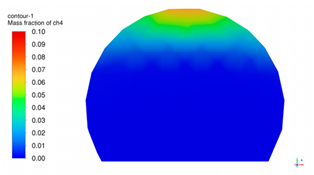
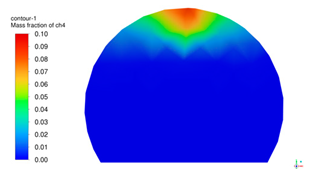
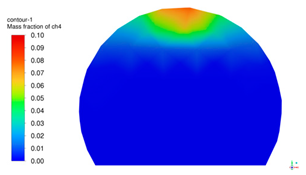
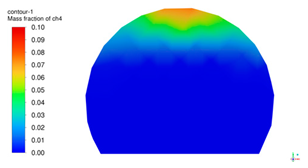
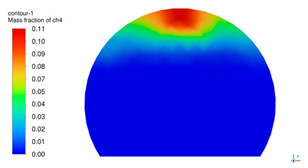
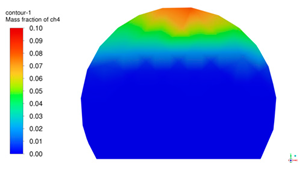
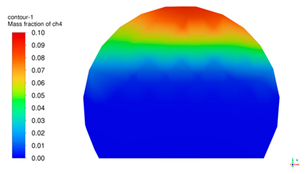
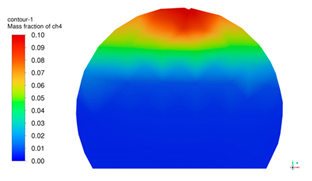
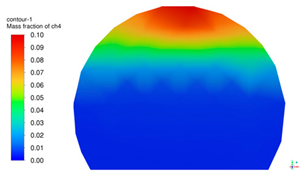
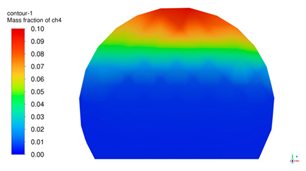
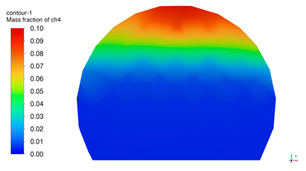
The distribution of gas in the cross-section at 0.1 m from the palm face by transient simulation under unventilated gas overflow for 6 s, 12 s, 30 s, 3 min, 1 h, and steady state is shown in Figure 18.
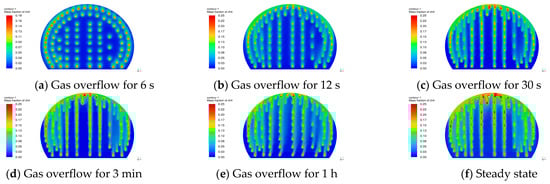
Figure 18.
Gas distribution cloud at 0.1 m away from the tunnel face under non-ventilated conditions.
Analyzing Figure 18, it can be seen that, as the gas density is lower than that of air and it has a strong diffusivity, the gas overflow drifts to the upper part of the tunnel. With the passage of time, the gas gradually filled the entire face of the palm and, due to the non-ventilated conditions near the face of the palm being strictly symmetrical based on the geometry of the model, the gas gushes out of the tunnel near the palm face of the region and also shows the left–right symmetry of the distribution of the law. The concentration of the gas overflowing for 3 min and the steady-state concentration of clouds are roughly the same, indicating that, with the 3 min gas overflow, the gas distribution state tends to stabilize along the tunnel side walls under the action of the tunnel vault and on both sides of the arch waist the gas accumulation phenomenon is severe. The gas concentration is close to 30%, far more than that needed for the occurrence of a gas explosion in the gas concentration conditions. Tunnel blasting and excavation construction should be focused on strengthening the monitoring of the gas concentration of the arch roof and the arch waist.
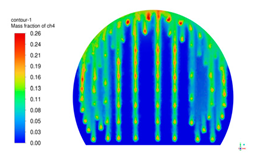
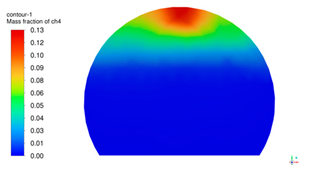
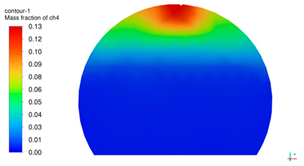
A summary of the gas concentration distribution clouds in the sections 0.1 m, 1 m, 3 m, 5 m, 6 m, 7 m, 8 m, and 9 m from the palm face after 1 min, 2 min, 3 min, 8 min, 15 min, and 25 min of gas overflow without ventilation by transient simulation is shown in Table 5.
Table 5.
Summary of cross-section cloud diagrams of gas overflow after 3 min and 1 h without ventilation.
Analysis of Table 5 shows that, under the condition of no ventilation, the gas concentration near the palm face reached stability when the gas overflowed for 3 min, the gas concentration in the tunnel increases with the passage of time in the same section, and the gas concentration in the section farther away from the palm face is lower at the same point in time. The gas concentration in the area after the section 7 m away from the palm face is slightly changed, so after the gas concentration in the tunnel reaches stability, the gas concentration 7 m away from the palm face is higher, the gradient of the change is larger, and the gas concentration in the area beyond 7 m is more or less the same.
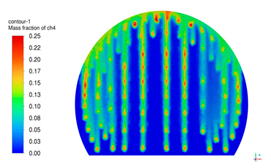
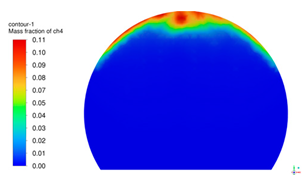
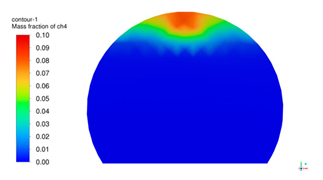
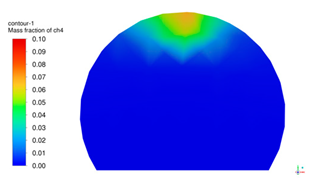
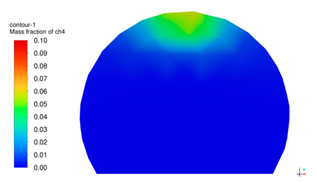
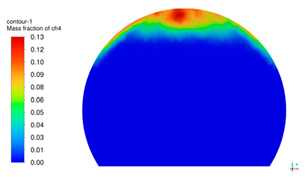
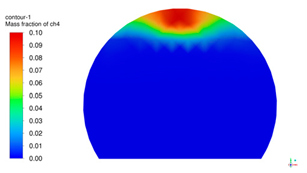
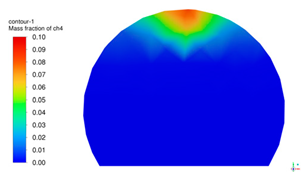
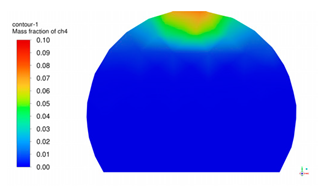
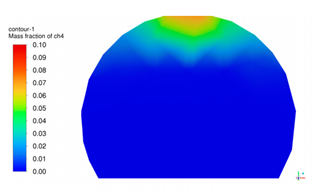
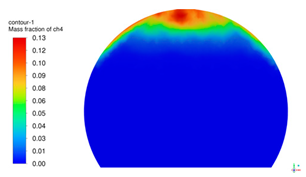
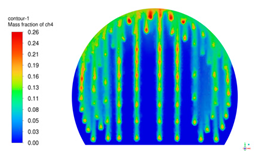
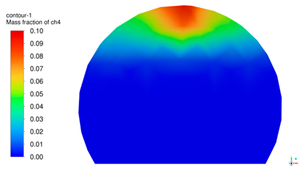
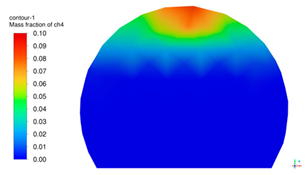
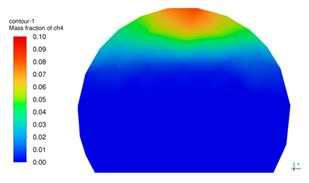
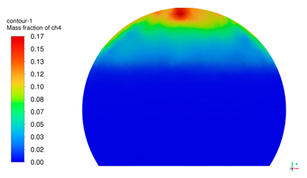
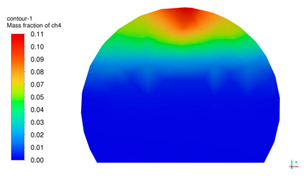
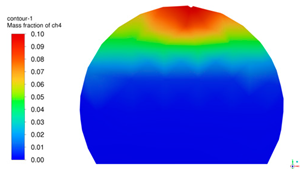
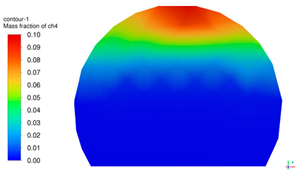
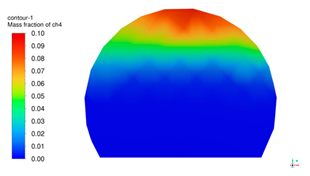
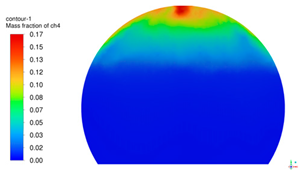
The tunnel was ventilated with a wind speed of 22.8 m/s through a wind pipe, and the gas distribution was simulated for 6 s, 30 s, 60 s, 0.5 h, and 1 h and in a steady state, respectively. The gas concentration cloud map for the cross-section at a distance of 0.1 m from the palm face was obtained as shown in Figure 19.
Figure 19.
Diagram of gas distribution at 0.1 m away from the tunnel face under ventilation conditions.
Analyzing Figure 19, it can be seen that in 6 s of ventilation, the wind flow has less influence on the gas distribution on the face of the palm. With the increase in ventilation time, the wind flow will dilute the gas near the face of the palm, and the gas concentration at the side of the wind pipe decreases significantly. At the same time, when the wind flow arrives at the face of the palm, the area near the face of the palm belongs to the impact area of the jet stream, and part of the wind flow forms a transverse wind flow at the face of the palm and the side walls and sweeps the gas to the opposite side of the wind pipe. This makes the gas accumulate at the arch foot and arch waist of the wind pipe and, especially at the arch foot, the gas concentration is the most obvious. In order to prevent the gas from accumulating at the foot of the arch and the waist of the arch on the other side of the wind pipe, especially at the foot of the arch, where the gas concentration is close to 20%, an explosion-proof local ventilation fan should be installed. In addition, there is a ventilation blind zone at the foot of the arch on the same side of the wind pipe, which is prone to small-scale gas accumulation, with a gas concentration of about 5%. The gradient of the distribution of gas concentration is smaller than that on the opposite side of the wind pipe, so the method of increasing the air volume and induced air blowing can be used to eliminate the accumulation of gas in this area. In this area, the method of increasing air volume and induced air blowing can be used to eliminate gas accumulation. When the amount of gas outflow is large, and the above methods cannot effectively eliminate the phenomenon of gas accumulation, the method of long-distance and large-diameter pre-pumping and pre-discharge of gas should be prioritized.
Except for the above-mentioned areas where gas accumulation is likely to occur, the gas concentration in other areas of the palm face has been reduced to less than 1% in about 30 s of ventilation, which is within the safely allowable range and proves that the designed air velocity meets the ventilation design requirements. The gas distribution near the palm face tends to be stabilized in 30 min of ventilation, and the gas and air are fully mixed in other areas except for the area where the gas accumulates, after which the airflow continues to be fed into the area, which has little effect on the distribution of the gas concentration at the palm face. For areas prone to gas accumulation, the monitoring and prevention of gas concentration in these areas should be strengthened to prevent gas from exceeding the limit.
6. On-Site Monitoring and Analysis
6.1. Gas Concentration Monitoring in Tunnel Excavations
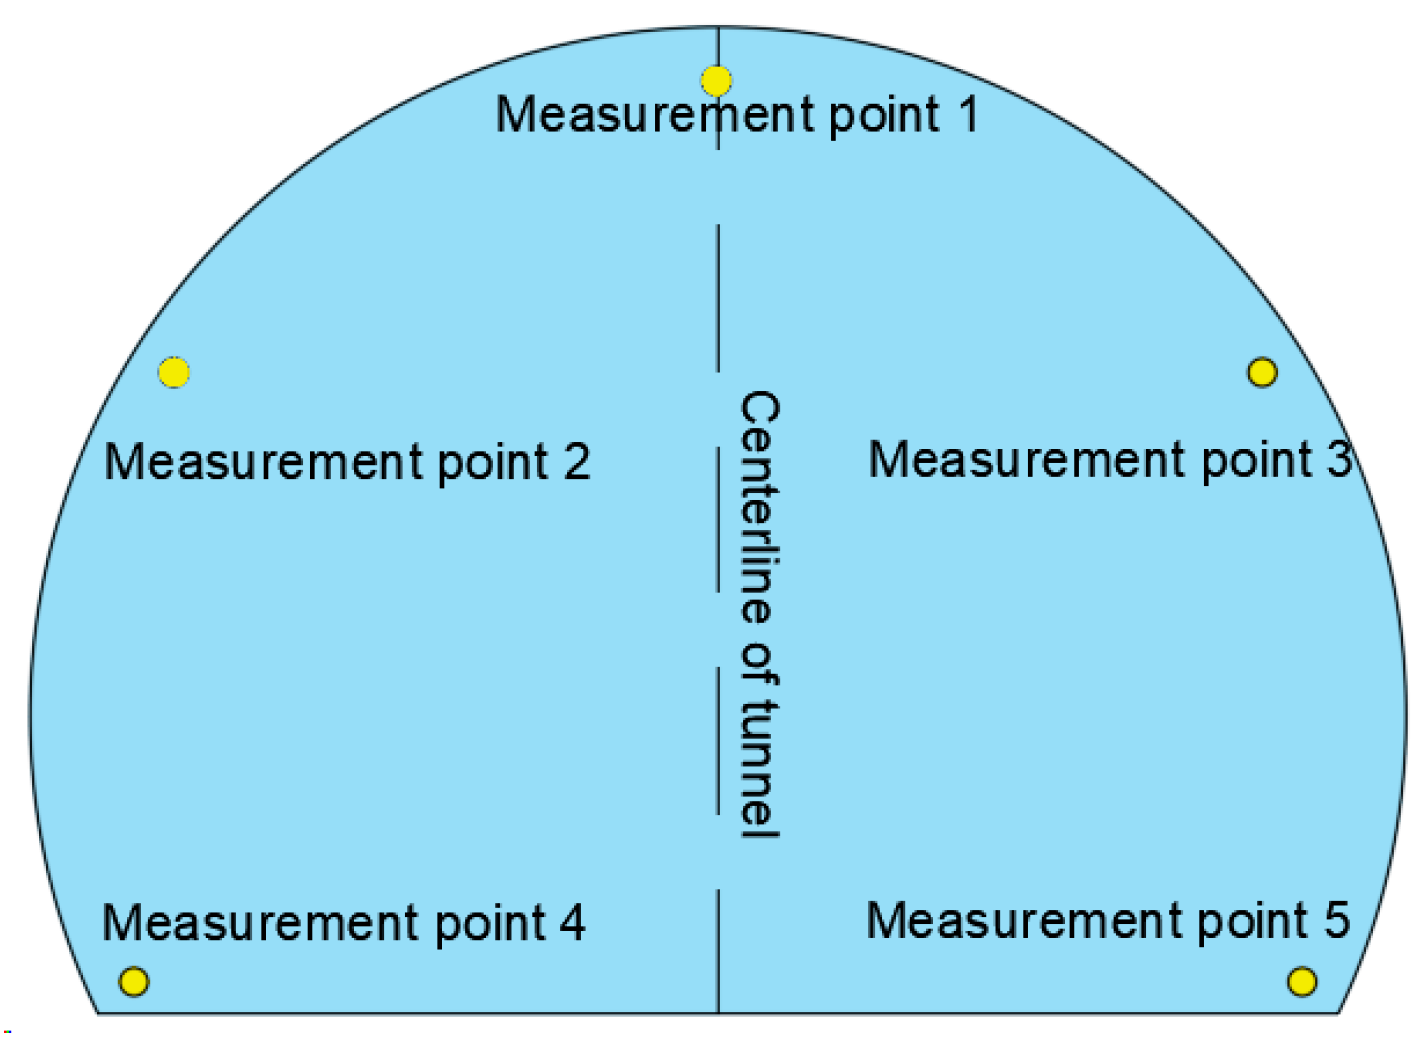
The CJG100 light interference type methane meter was used to monitor the gas concentration in the wind flow of the excavation face. The measurement points selected for the face of the arch, side walls, and the bottom plate were each 200 mm from the arch, side walls and the bottom plate. For the five measuring points, a methane meter was used, and the meter can be monitored by real-time gas concentration data transmission to the backstage monitoring system. The arrangement of the measurement points in the cross-section is shown in Figure 20.

Figure 20.
Layout of cross-sectional measurement points.
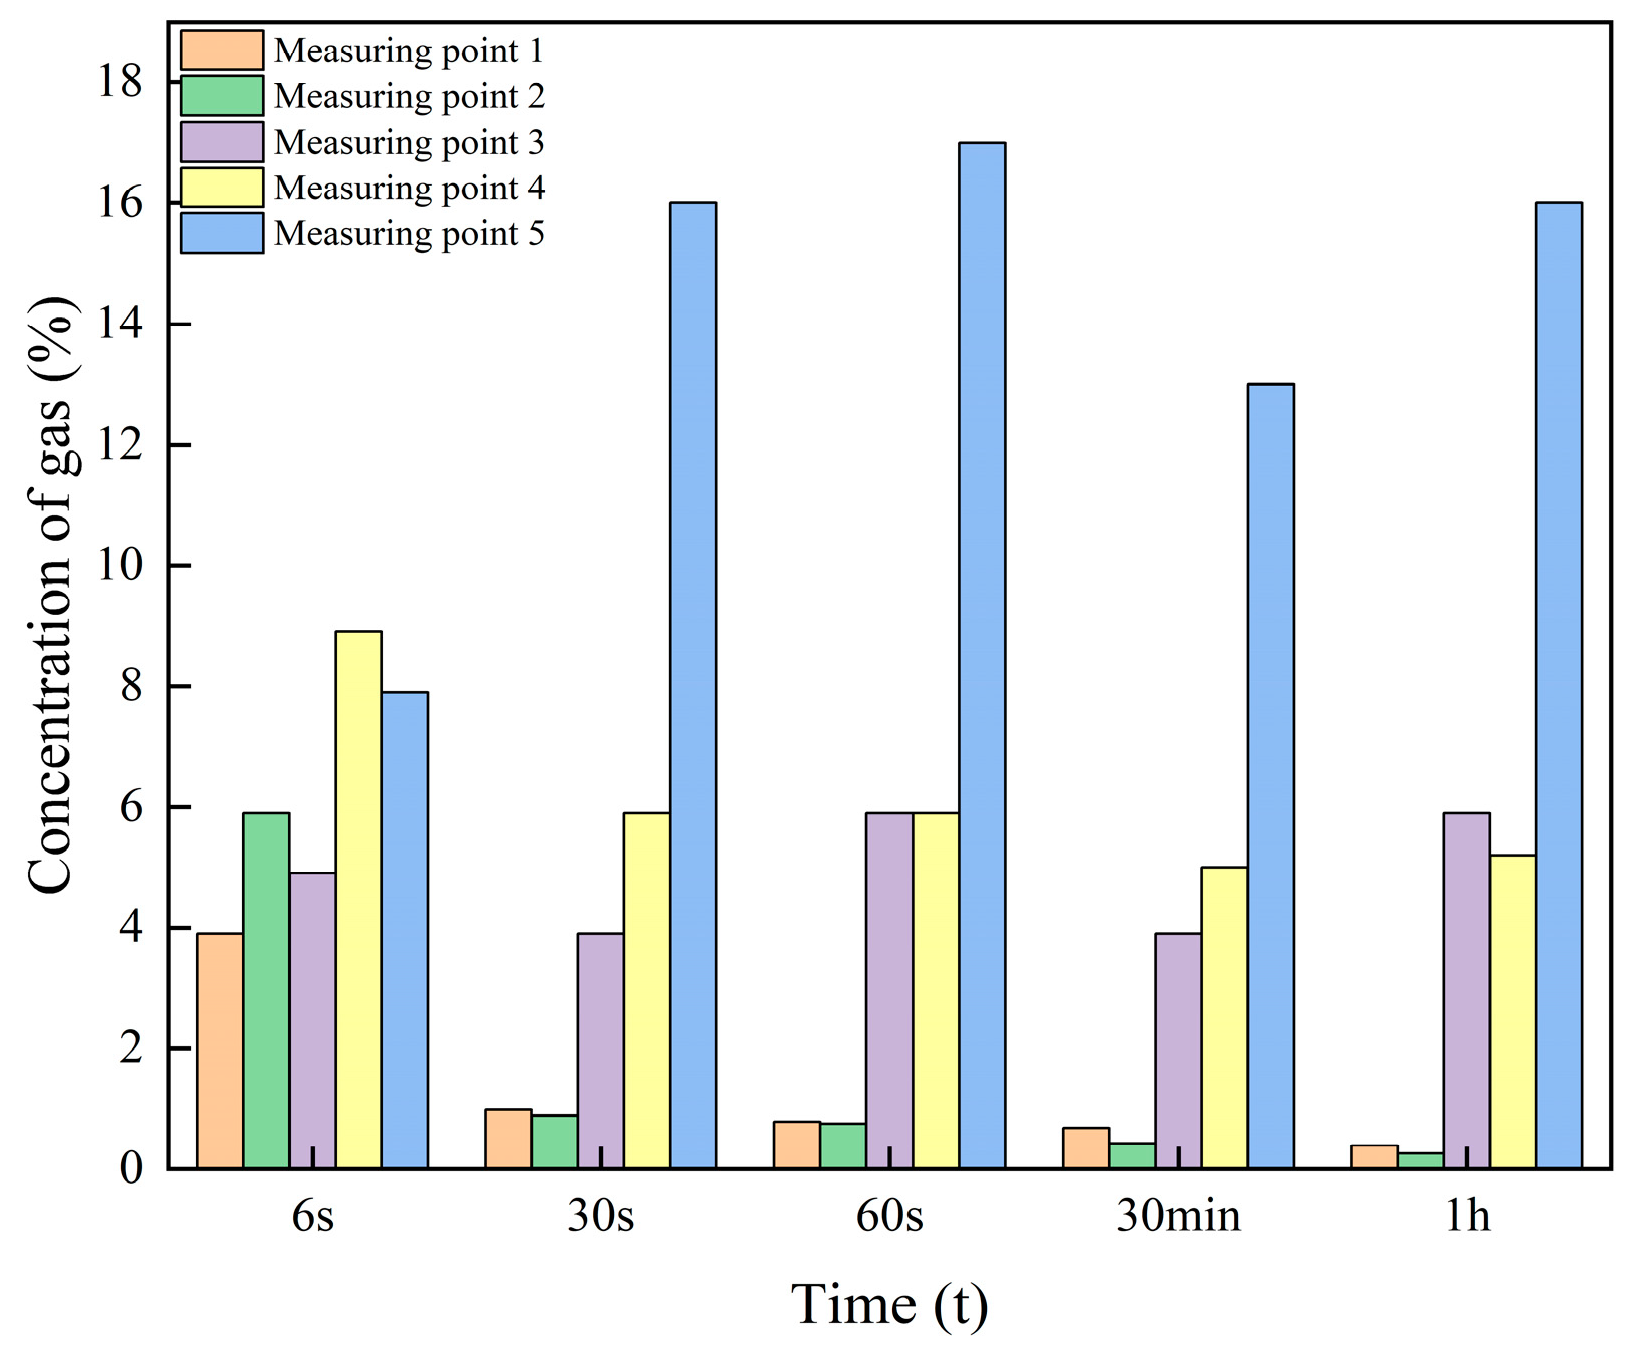
The gas concentrations at the above measurement points were monitored for 6 s, 30 s, 60 s, 30 min, and 1 h after blasting under ventilated conditions, and the field data were obtained as shown in Figure 21.
Figure 21.
Diagram of gas concentration monitoring. Data at the measurement points.
According to the comparison of on-site monitoring and numerical simulation data, it is found that the average error of both is less than 5%, which indicates that the numerical simulation results are accurate and referable. Measurement points 1 and 2 show a reduction in gas concentration to within the safe range in about 30 s of ventilation, a small gas accumulation will occur at measurement points 3 and 4, with the gas concentration fluctuating in a small range and the concentration being roughly maintained at around 5% after 30 s of ventilation, and the gas concentration at measurement point 5 at the foot of the arch on the opposite side of the wind pipe will increase with ventilation, which is prone to a large-scale gas accumulation.
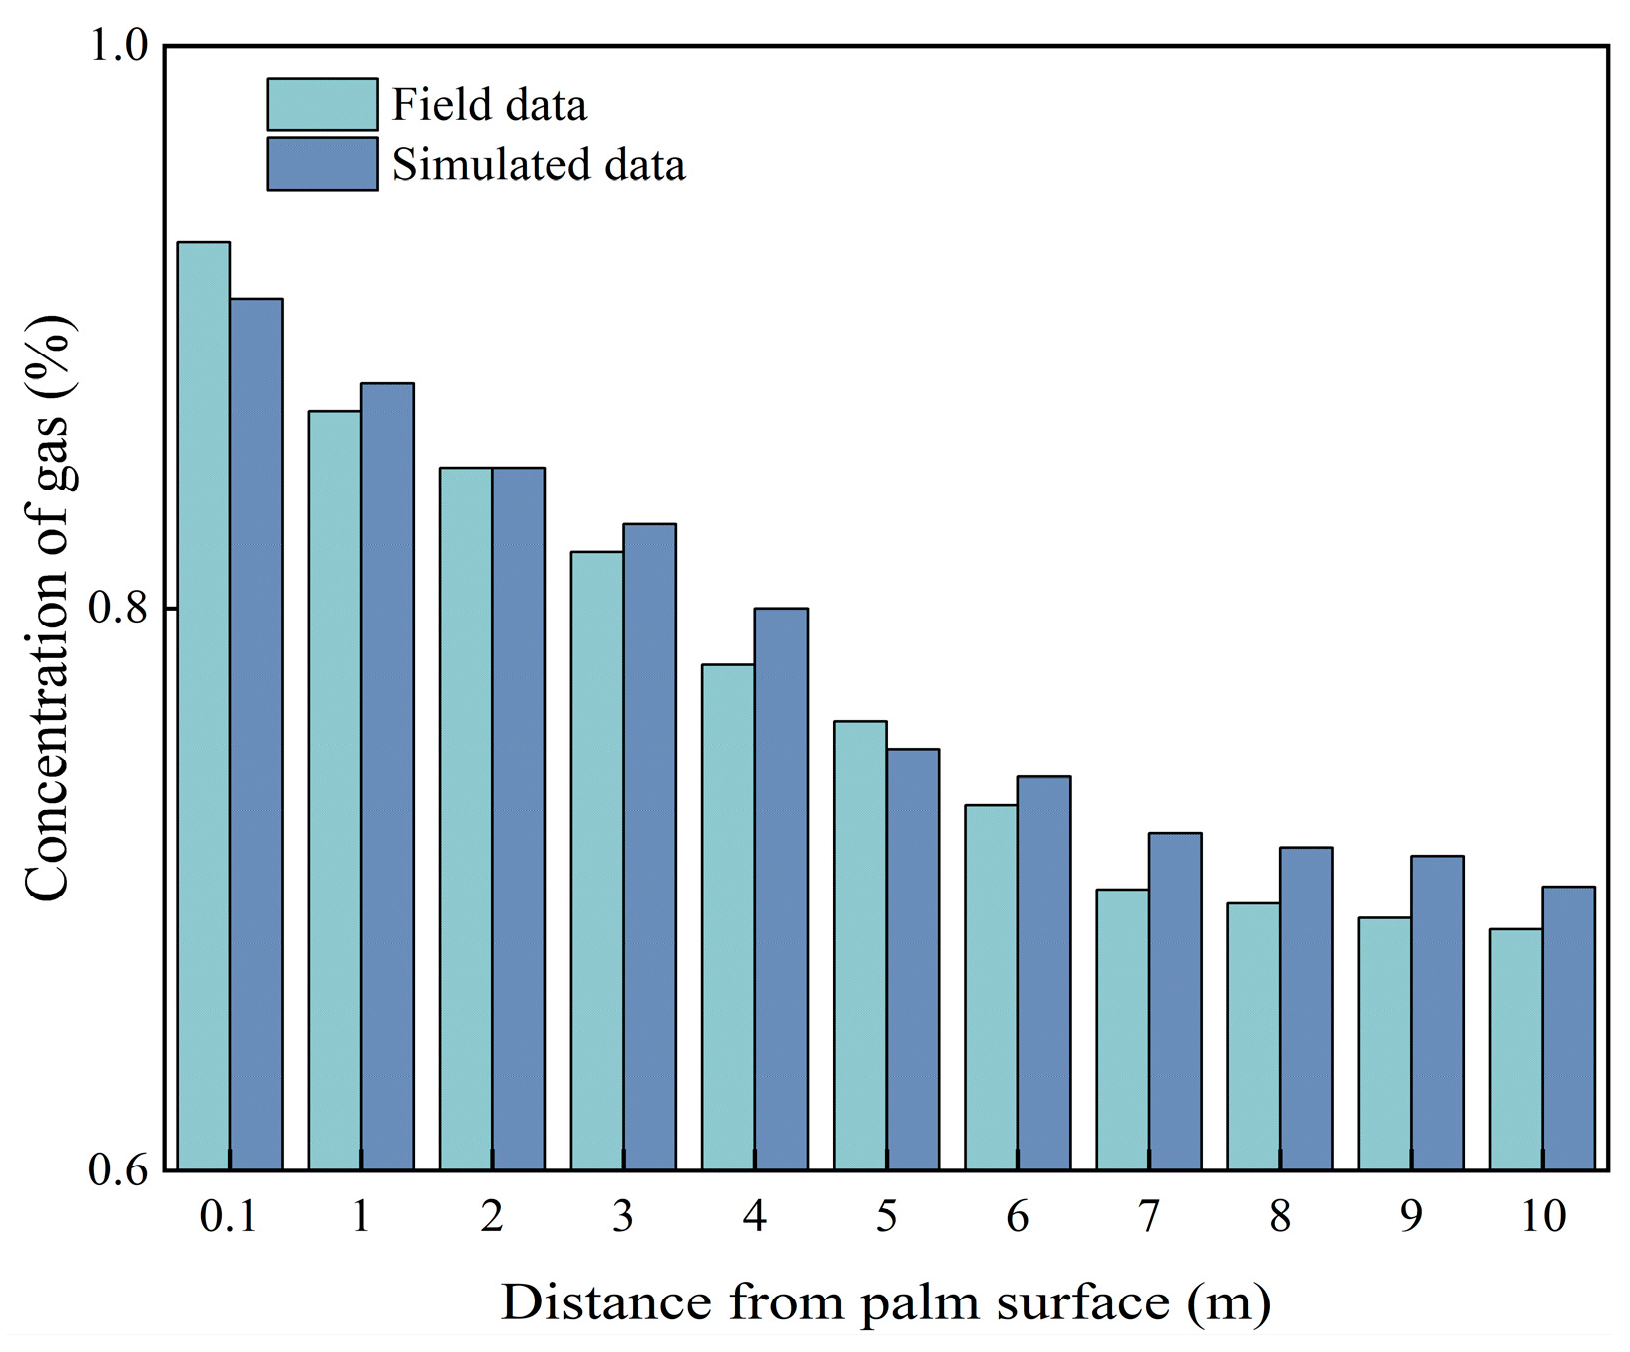
6.2. Monitoring of Gas Concentration Within 10 m near the Palm Face
For the CJG10 optical interference type methane meter on the palm face within the 10 m range, in the gas concentration monitoring of the wind flow, measuring points were selected on the tunnel centerline in the vault. There were a total of 10 measuring points, each point having a methane meter, to collect data on the gas concentration 1 h after the blasting, and numerical simulation data were compared to the data obtained on-site. The simulation of the data is shown in Figure 22.
Figure 22.
Comparison chart of field data and simulated data.
As can be seen in Figure 22, the trends of field monitoring data and numerical simulation results are more consistent after 1 h of ventilation, and the gas concentration in the centerline vault of the tunnel has been reduced to a safe range. The gas concentration at the palm face within 7 m is high, and the gradient of the change is also large. Beyond 7 m the curve of the gas concentration is relatively smooth, while the area within 7 m is an important impact zone. The focus in the construction of the tunnel should be the monitoring of the gas concentration of the above area.
7. Conclusions
This paper takes a gas tunnel under construction in China as a research object. On the basis of existing research, it describes the charging method of peripheral holes for surface blasting of gas tunnels, the distribution characteristics of gas diffusion and transportation, and the influence of ventilation on the concentration of gas, and we draw the following conclusions.
- (1)
- Compared with the original technology, the new technology reduces the unit consumption of explosives by 0.2 kg/m3, increases the half-hole retention rate by 5%, and reduces the average loading time from 1.3 h to 1.0 h, which stabilizes the cyclic feed and greatly reduces the cost of consumables and improves the effect of face blasting in tunnels.
- (2)
- FLUENT numerical simulation shows that, under the condition of no ventilation, the gas distribution tends to stabilize after 3 min of gas overflow, and the closer to the tunnel face, the more severe the phenomenon of gas accumulation in the vault and at the two sides of the arch waist, so strengthening the monitoring of the gas concentration in the vault and at the arch waist during tunnel blasting and excavation construction should be focused upon. After reaching a stable state 7 m from the tunnel face for the obvious impact zone, the gas concentration in the region is high and the gradient of change is large, while beyond 7 m the region is smaller.
- (3)
- Under the ventilation condition, most of the areas at the palm face have a safe range of gas concentration in about 30 s of ventilation, and the distribution of gas near the palm face tends to be stabilized in 30 min of ventilation. Gas easily accumulates at the arch foot on both sides and at the arch waist on the opposite side of the wind pipe, and monitoring, preventing, and controlling the gas concentration in these areas should be strengthened in order to prevent the gas from exceeding the limitation.
- (4)
- The overall trends of the measured data and the simulated data are consistent with each other, with a maximum error of 3%. The accurate delineation of the gas accumulation area based on numerical simulation and supplemented by on-site monitoring can provide a useful reference for the study of similar working conditions in the future.
Author Contributions
C.T.: Conceptualization, Writing—original draft, Funding acquisition. H.W.: Conceptualization, Formal analysis. X.W.: Writing—original draft, Writing—review and editing. T.W.: Software. Y.S.: Supervision, Funding acquisition. Q.W.: Conceptualization. X.L.: Formal analysis. Z.S.: Conceptualization. K.W.: Supervision, Funding acquisition, Validation. All authors have read and agreed to the published version of the manuscript.
Funding
The authors would like to thank the Shandong postdoctoral innovation project (SDCX-ZG-202400203), Qingdao postdoctoral funding program (QDBSH20230202074), National Natural Science Foundation of China (NSFC) (52278359), Taishan Scholars Project (tsqnz20221140), National Natural Science Foundation of China (52104204), Natural Science Foundation of Shandong Province (ZR2024ME097), and Project funded by open fund of state key laboratory of coal mine disaster dynamics and control (2011DA105287-FW202203) for funding provided to this work.
Institutional Review Board Statement
Not applicable.
Informed Consent Statement
Not applicable.
Data Availability Statement
Data are available on request due to restrictions (e.g., privacy, legal, or ethical reasons).
Conflicts of Interest
The authors declare no conflicts of interest.
References
- Zhu, F.; Liu, Z.; Huang, A.C. Study on the coupling mechanism of shaped blasting and empty hole to crack coal body. Process Saf. Environ. Prot. 2023, 175, 644–653. [Google Scholar] [CrossRef]
- Yang, J.H.; Jiang, Q.H.; Zhang, Q.B.; Zhao, J. Dynamic stress adjustment and rock damage during blasting excavation in a deep-buried circular tunnel. Tunn. Undergr. Space Technol. 2018, 71, 591–604. [Google Scholar] [CrossRef]
- Hu, Q.; Zhang, Y.; Li, Q.; Cao, J.; Song, M.; Hu, L.; Liu, J. Experimental research on progressive failure characteristics of water-immersed coal: Implications for hydraulic fracturing. Eng. Geol. 2022, 308, 106809. [Google Scholar] [CrossRef]
- Li, X.; Zhu, Z.; Wang, M.; Wan, D.; Zhou, L.; Liu, R. Numerical study on the behavior of blasting in deep rock masses. Tunn. Undergr. Space Technol. 2021, 113, 103968. [Google Scholar] [CrossRef]
- Hu, Y.; Lu, W.; Wu, X.; Liu, M.; Li, P. Numerical and experimental investigation of blasting damage control of a high rock slope in a deep valley. Eng. Geol. 2018, 237, 12–20. [Google Scholar] [CrossRef]
- Luo, Y.; Xu, K.; Huang, J.; Li, X.; Liu, T.; Qu, D. Impact analysis of pressure-relief blasting on roadway stability in a deep mining area under high stress. Tunn. Undergr. Space Technol. 2021, 110, 103781. [Google Scholar] [CrossRef]
- Sim, Y.; Cho, G.C.; Song, K.I. Prediction of fragmentation zone induced by blasting in rock. Rock. Mech. Rock. Eng. 2017, 50, 2177–2192. [Google Scholar] [CrossRef]
- Lei, M.; He, R.; Liu, L.; Sun, N.; Qin, G.; Zhang, Y. Mechanical mechanism and sha effect of tunnel blasting construction in rock with weak interlayer. Sustain. Sci. 2022, 14, 13278. [Google Scholar] [CrossRef]
- Lai, Z. Analysis on Blasting Effect of Parallel Cut with Empty Hole in Tunnel Construction. IOP Conf. Ser. Earth Environ. Sci. 2021, 719, 032002. [Google Scholar] [CrossRef]
- Cheng, B.; Wang, H.; Zong, Q.; Wang, M.; Gao, P. Study on the improved method of wedge cutting blasting with center holes detonated subsequently. Energies 2022, 15, 4282. [Google Scholar] [CrossRef]
- Huo, X.; Shi, X.; Qiu, X.; Zhou, J.; Gou, Y.; Yu, Z. Rock damage control for large-diameter-hole lateral blasting excavation based on charge structure optimization. Tunn. Undergr. Space Technol. 2020, 106, 103569. [Google Scholar] [CrossRef]
- Liu, K.; Zakharova, N.; Zeng, L.; Haghshenas, M.; Adeyilola, A.; Saurabh, S. Comparison of shale fracture toughness obtained from scratch test and nanoindentation test. Int. J. Rock. Mech. Min. Sci. 2023, 162, 105282. [Google Scholar] [CrossRef]
- Yu, Z.; Shi, X.Z.; Zhang, Z.X.; Gou, Y.G.; Miao, X.H.; Kalipi, I. Numerical investigation of blast-induced rock movement characteristics in open-pit bench blasting using bonded-particle method. Rock. Mech. Rock. Eng. 2022, 55, 3599–3619. [Google Scholar] [CrossRef]
- Yin, Y.; Sun, Q.; Zoy, B.; Mu, Q. Numerical study on an innovative shaped charge approach of rock blasting and the timing sequence effect in microsecond magnitude. Rock. Mech. Rock. Eng. 2021, 54, 4523–4542. [Google Scholar] [CrossRef]
- Xie, L.X.; Lu, W.B.; Zhang, Q.H.; Chen, M. Analysis of damage mechanisms and optimization of cut blasting design under high in-situ stresses. Tunn. Undergr. Space Technol. 2017, 66, 19–33. [Google Scholar] [CrossRef]
- Liu, K.; Zeng, L.; Ozotta, O.; Gentzis, T.; Ostadhassan, M. Alteration in the mechanical properties of the Bakken during exposure to supercritical CO2. Energy 2023, 262, 125545. [Google Scholar] [CrossRef]
- Salum, A.H.; Murthy, V. Optimising blast pulls and controlling blast-induced excavation damage zone in tunnelling through varied rock classes. Tunn. Undergr. Space Technol. 2019, 85, 307–318. [Google Scholar] [CrossRef]
- Qiu, J.; Li, X.; Li, D.; Zhao, Y.; Hu, C.; Liang, L. Physical model test on the deformation behavior of an underground tunnel under blasting disturbance. Rock. Mech. Rock. Eng. 2021, 54, 91–108. [Google Scholar] [CrossRef]
- Ding, X.H.; Luo, B.; Zhou, H.T. Generalized solutions for advection–dispersion transport equations subject to time- and space-dependent internal and boundary sources. Comput. Geotech. 2025, 178, 106944. [Google Scholar] [CrossRef]
- Tan, B.; Liu, Y.; Liu, H.; Wang, H.; Li, T. Research on size effect of gas explosion in the roadway. Tunn. Undergr. Space Technol. 2021, 112, 103921. [Google Scholar] [CrossRef]
- Zhang, Z.; Liu, Z.; Zhang, H.; Meng, S. Spatial distribution and machine learning-based prediction model of natural gas explosion loads in a utility tunnel. Tunn. Undergr. Space Technol. 2023, 140, 105272. [Google Scholar] [CrossRef]
- Lu, S.; Zhang, Y.; Sa, Z.; Si, S.; Shu, L.; Wang, L. Damage-induced permeability model of coal and its application to gas predrainage in combination of soft coal and hard coal. Energy Sci. Eng. 2019, 7, 1352–1367. [Google Scholar] [CrossRef]
- Liu, H.; Liu, C.; Yue, X.; Wang, J. Study on mechanical properties and acoustic emission characteristics of mudstone-clay composites under uniaxial compression. Eng. Geol. 2024, 332, 107478. [Google Scholar] [CrossRef]
- Zhou, A.; Wang, K.; Feng, T.; Wang, J.; Zhao, W. Effects of fast-desorbed gas on the propagation characteristics of outburst shock waves and gas flows in underground roadways. Process Saf. Environ. Prot. 2018, 119, 295–303. [Google Scholar] [CrossRef]
- Lu, Y.; Wang, Q.; Li, G.; Hai, T. Deformation and failure characteristic of open-pit slope subjected to combined effects of mining blasting and rainfall infiltration. Eng. Geol. 2024, 331, 107437. [Google Scholar] [CrossRef]
- Wei, M.; Wang, E.; Liu, X. Assessment of gas emission hazard associated with rockburst in coal containing methane. Process Saf. Environ. Prot. 2020, 135, 257–264. [Google Scholar] [CrossRef]
- Zheng, Y.; Li, S.; Xue, S.; Jiang, B.; Ren, B. Study on the evolution characteristics of coal spontaneous combustion and gas coupling disaster region in goaf. Fuel 2023, 349, 128505. [Google Scholar] [CrossRef]
- Zhou, A.; Zhang, M.; Wang, K.; Zhang, X.; Feng, T. Quantitative study on gas dynamic characteristics of two-phase gas-solid flow in coal and gas outbursts. Process Saf. Environ. Prot. 2020, 139, 251–261. [Google Scholar] [CrossRef]
- Zhou, A.; Hu, J.; Wang, K.; Du, C. Analysis of fault orientation and gas migration characteristics in front of coal mining face: Implications for coal-gas outbursts. Process Saf. Environ. Prot. 2023, 177, 232–245. [Google Scholar] [CrossRef]
- Wang, H.; Wang, E.; Li, Z.; Wang, X.; Zhang, Q.; Li, B. Study on sealing effect of pre-drainage gas borehole in coal seam based on air-gas mixed flow coupling model. Process Saf. Environ. Prot. 2020, 136, 15–27. [Google Scholar] [CrossRef]
- Zhou, A.; Xu, Z.; Wang, K.; Wang, Y.; An, J. Coal mine gas migration model establishment and gas extraction technology field application research. Fuel 2023, 349, 128650. [Google Scholar] [CrossRef]
- Gao, K.; Liu, Z.; Wu, C.; Li, J.; Liu, K.; Liu, Y.; Li, S. Effect of low gas concentration in underground return tunnels on characteristics of gas explosions. Process Saf. Environ. Prot. 2021, 152, 679–691. [Google Scholar] [CrossRef]
- Gao, J.; Dai, L.; Sun, H.; Wang, B.; Zhao, B.; Yang, X. Experimental study of the impact of gas adsorption on coal and gas outburst dynamic effects. Process Saf. Environ. Prot. 2019, 128, 158–166. [Google Scholar] [CrossRef]
- Liu, K.; Zakharova, N.; Adeyilola, A.; Zeng, L. Experimental study on the pore shape damage of shale samples during the crushing process. Energy Fuels 2021, 35, 2183–2191. [Google Scholar] [CrossRef]
- Chang, X.; Chai, J.; Qin, Y.; Xu, Z. Comparison of ventilation methods used during tunnel construction. Eng. Appl. Comput. Fluid. Mech. 2020, 14, 107–121. [Google Scholar] [CrossRef]
- Cao, C.; Zhao, J.; Ding, H. Dust removal of large cross-section tunnels: Following ventilation and its adjustment strategy. J. Braz. Soc. Mech. Sci. 2018, 40, 483. [Google Scholar] [CrossRef]
- Zhang, J.; Dong, Y.; Chen, Y.; Sun, H. Numerical simulation of gas ventilation mode in highway gas tunnel. Geofluids 2021, 2021, 1–9. [Google Scholar] [CrossRef]
- Gao, A.; Qin, B.; Zhang, L.; Ma, D.; Li, L. Experimental Study on Gas Migration Laws at Return Air Side of Goaf under High-Temperature Conditions. Combust. Sci. Technol. 2023, 195, 1930–1944. [Google Scholar] [CrossRef]
- Tomita, S.; Inoue, M.; Uchino, K. Behavior of airflow and methane at heading faces with auxiliary ventilation system. In Proceedings of the ’99 International Symposium on Mining Science and Technology; CRC Press: Boca Raton, FL, USA, 2002; pp. 69–72. [Google Scholar] [CrossRef]
- Peng, G.; Gao, M.; Liu, Q.; Deng, G.; Li, C.; He, Z. Field test research on gas migration law of mining coal and rock. Therm. Sci. 2019, 23, 1591–1597. [Google Scholar] [CrossRef]
- Li, S.; Wang, Z. Study on the coupling effect of stress field and gas field in surrounding rock of stope and gas migration law. Energies 2023, 16, 6672. [Google Scholar] [CrossRef]
- Shang, Y.; Zhang, L.; Kong, D.; Wang, Y.; Cheng, Z. Overlying strata failure mechanism and gas migration law in close distance outburstcoal seams: A case study. Eng. Fail. Anal. 2023, 148, 107214. [Google Scholar] [CrossRef]
- Wei, C.; Hao, M.; Qiao, Z.; Guo, J. Model development and analysis of dynamic gas emission from tunneling face zone. Energ. Source 2022, 44, 10378–10394. [Google Scholar] [CrossRef]
- Cao, Z.; Liu, X. Study on the characteristics of flow field and gas migration in gas tunnel. MSE 2020, 741, 012039. [Google Scholar] [CrossRef]
- Zhang, X.; Wang, Z.; Chen, W. Optimisation of synergistic ventilation between dust and gas in a gas tunne. Sci. Rep. 2024, 14, 27582. [Google Scholar] [CrossRef]
- Batugin, A.; Kobylkin, A.; Kolikov, K. Study of the Migrating Mine Gas Piston Effect during Reactivation of Tectonic Faults. Appl. Sci. 2023, 13, 12041. [Google Scholar] [CrossRef]
- Chećko, J.; Howaniec, N.; Paradowski, K. Gas migration in the aspect of safety in the areas of mines selected for closure. Resources 2021, 10, 73. [Google Scholar] [CrossRef]
- Zhang, P.; Lan, H.; Yu, M. Reliability evaluation for ventilation system of gas tunnel based on Bayesian network. Tunn. Undergr. Space Technol. 2021, 112, 103882. [Google Scholar] [CrossRef]
- Li, D.; Qi, S.; Wang, Y.; Zhou, J.; Simms, P.; Yao, Q. Probabilistic analysis of one-dimensional large-deformation consolidation considering permeability relationship’s variability. Eng. Geol. 2024, 331, 107451. [Google Scholar] [CrossRef]
- Huang, Y.; Gong, X.; Peng, Y.; Kim, C.N. Effects of the solid curtains on natural ventilation performance in a subway tunnel. Tunn. Undergr. Space Technol. 2013, 38, 526–533. [Google Scholar] [CrossRef]
- Weng, M.C.; Yu, L.X.; Liu, F.; Nielsen, P.V. Full-scale experiment and CFD simulation on smoke movement and smoke control in a metro tunnel with one opening portal. Tunn. Undergr. Space Technol. 2014, 42, 96–104. [Google Scholar] [CrossRef]
- Song, S.; Zhou, G.; Duan, J.; Zhang, L.L.; Gao, D. Numerical simulation investigation on optimal dust-exhausting airflow volume in fully mechanized caving face of high-gas coal mine. Process Saf. Environ. Prot. 2021, 146, 853–866. [Google Scholar] [CrossRef]
- Si, L.; Li, Y.; Yang, Y.; Zhou, Y.; Liu, Z.; Liu, L. Modeling of gas migration in water-intrusion coal seam and its inducing factors. Fuel 2017, 210, 398–409. [Google Scholar] [CrossRef]
- Wang, K.; Zhang, X.; Wang, L.; Li, L.; Zhang, M. Experimental study on propagation law of shock wave and airflow induced by coal and gas outburst in mine ventilation network. Process Saf. Environ. Prot. 2021, 151, 299–310. [Google Scholar] [CrossRef]
- Zeng, Y.; Tao, L.; Ye, X.; Zhou, X.; Fang, Y. Temperature reduction for extra-long railway tunnel with high geotemperature by longitudinal ventilation. Tunn. Undergr. Space Technol. 2020, 99, 103381. [Google Scholar] [CrossRef]
- Xia, Y.; Yang, D.; Hu, C.; Wu, C. Numerical simulation of ventilation and dust suppression system for open-type TBM tunneling work area. Tunn. Undergr. Space Technol. 2016, 56, 70–78. [Google Scholar] [CrossRef]
- Cong, H.; Bi, M.; Bi, Y.; Li, Y.; Jiang, H.; Gao, W. Experimental studies on the smoke extraction performance by different types of ventilation shafts in extra-long road tunnel fires. Tunn. Undergr. Space Technol. 2021, 115, 104029. [Google Scholar] [CrossRef]
- Fu, M.; Zheng, Q.; He, S.; Yan, Y.; Wang, X. Oxygen control mechanism in non-ventilation excavation based on the simultaneous mining of coal and gas. Process Saf. Environ. Prot. 2019, 123, 33–38. [Google Scholar] [CrossRef]
- Hou, X.; Lan, H.; Zhao, Z.; Li, J.; Hu, C.; Li, Y. Effect of obstacle location on hydrogen dispersion in a hydrogen fuel cell bus with natural and mechanical ventilation. Process Saf. Environ. Prot. 2023, 171, 995–1008. [Google Scholar] [CrossRef]
- Zhang, Q.; Zhang, X.P.; Liu, Q.; Qiu, J.; Wu, J. Rockburst prediction and prevention in a deep-buried tunnel excavated by drilling and blasting: A case study. Eng. Geol. 2024, 330, 107404. [Google Scholar] [CrossRef]
- Li, X.L.; Chen, D.Y.; Li, Z. Roadway portal and self-moving hydraulic support for rockburst prevention in coal mine and its application. Phys. Fluids 2024, 36, 124136. [Google Scholar] [CrossRef]
- Liu, S.M.; Sun, H.T.; Zhang, D.M. Experimental study of effect of liquid nitrogen cold soaking on coal pore structure and fractal characteristics. Energy 2023, 275, 127470. [Google Scholar] [CrossRef]
- Li, X.; Cao, Z.; Xu, Y. Characteristics and trends of coal mine safety development. Energy Sources Part A Recovery Util. Environ. Eff. 2025, 47, 2316–2334. [Google Scholar] [CrossRef]
- Liu, S.; Li, X.; Wang, D.; Zhang, D. Investigations on the mechanism of the microstructural evolution of different coal ranks under liquid nitrogen cold soaking. Energy Sources Part A Recovery Util. Environ. Eff. 2025, 47, 2596–2612. [Google Scholar] [CrossRef]
- Tian, C.; Wang, X.; Sun, Y.; Wang, Q.; Li, X.; Shi, Z.; Wang, K. Numerical Simulation Analysis and Prevention Measures of Dynamic Disaster Risk in Coal Seam Variation Areas During Deep Mining. Sustainability 2025, 17, 810. [Google Scholar] [CrossRef]
- Wang, X.; Tian, C.; Wang, Q. Study on influencing factors and prevention measures of coal-rock-gas compound dynamic disaster in deep coal mine mining. Sci. Rep. 2025, 15, 2080. [Google Scholar] [CrossRef]


Disclaimer/Publisher’s Note: The statements, opinions and data contained in all publications are solely those of the individual author(s) and contributor(s) and not of MDPI and/or the editor(s). MDPI and/or the editor(s) disclaim responsibility for any injury to people or property resulting from any ideas, methods, instructions or products referred to in the content. |
© 2025 by the authors. Licensee MDPI, Basel, Switzerland. This article is an open access article distributed under the terms and conditions of the Creative Commons Attribution (CC BY) license (https://creativecommons.org/licenses/by/4.0/).