1. Introduction
The logistics system, particularly the truck freight system, is a vital component of modern society, playing a crucial role in supporting socio-economic activities [
1]. However, the road network upon which truck freight systems depend is vast and situated in complex geographical environments, making the system highly vulnerable to various challenges such as natural disasters (e.g., floods and earthquakes), traffic accidents, construction activities, and malicious attacks [
2,
3]. Among natural disasters, floods are the most frequent and widespread, posing a significant threat to road networks and often leading to disruptions in truck freight operations, as well as socio-economic losses [
4]. For instance, in late July 2023, Typhoon Doksuri brought heavy rainfall to Beijing, Tianjin, and Hebei Province in China, causing the largest floods in the upper reaches of the Haihe River in 60 years [
5]. This extreme rainfall led to severe disruptions in the regional road network, resulting in approximately USD 4.14 billion in logistics losses and a 22% decrease in total logistics revenue, severely affecting the smooth operation of the truck freight system [
6]. Given this challenge, this paper proposes a comprehensive method for assessing and improving the resilience of truck freight systems.
Scholars have conducted research on how road networks can respond to disasters such as floods, focusing mainly on the quantification and improvement of transportation resilience [
7,
8,
9]. Truck freight system resilience extends the concept of transportation resilience further and refers to the ability of the freight system to continue operations, minimize disruptions, and ensure the timely delivery of goods during emergencies [
10,
11]. Establishing a resilient truck freight system is essential for effectively addressing current challenges and laying a solid foundation for future sustainable development, particularly in light of ongoing global climate change, which has significantly increased the frequency and intensity of floods [
12], disproportionately impacting certain regions [
13]. Therefore, establishing a resilient truck freight system can effectively address current challenges and lay a solid foundation for future sustainable development [
14].
A significant amount of research on improving the resilience of truck freight systems relies on network science methods [
15,
16]. These studies represent road systems as topological networks, analyzing the structural changes caused by disasters triggered by natural hazards such as floods to assess the robustness and vulnerability of truck freight systems [
17]. While this approach can explain many issues arising in road networks during disasters, it has significant limitations. For example, network topology analysis often overlooks factors such as road infrastructure conditions and traveler behavior, which significantly influence the overall performance of the road system [
18,
19]. As a result, it typically addresses macro-level issues but fails to consider the finer details of the transportation infrastructure and its participants [
20]. Additionally, most studies face challenges in evaluating transportation resilience, particularly in obtaining sufficient freight demand data. The scarcity of data and difficulties in data collection have led researchers to rely on optimization models, simulation models, and other analytical methods, which may not always accurately reflect real-world conditions [
21]. In contrast, the use of big data analysis can significantly improve research accuracy [
22,
23]. Moreover, we found that combining hydrological flood simulations with transportation resilience research is still limited [
24]. Traditional methods often focus solely on roads or transportation systems, neglecting the processes of disasters triggered by natural hazards such as floods, and fail to reliably identify road segments affected by these disasters [
25]. Therefore, integrating network science, freight demand, and flood simulation is critical for analyzing the impact of floods on the resilience of the truck freight system.
To fill the research gap in this field, we analyzed origin–destination (OD) data from 810,000 trucks collected before and after the rainstorms in Beijing, Tianjin, and Hebei Province in 2023. Our research questions are: How do extreme rainfall-induced floods impact the functional and topological resilience of regional truck freight systems? Which road segments are most critical for maintaining system resilience during and after flood events? Our hypothesis is that functional resilience recovery will be slower than topological resilience due to delayed traffic redistribution and behavioral adjustments, even after physical repairs are completed. This study combines meteorological data, including rainfall records from 176 observation stations in the region, and establishes a hydrological flood simulation model based on heavy rainfall to assess the resilience of the truck freight system in the area. The significance of this study lies in its focus on regions including Beijing, the Chinese capital and a major logistics hub in China. First, we established a flood model and a road network topology structure. Next, we constructed a regional truck freight demand model based on truck OD data to describe the road impacts of flood disasters. Finally, by combining two different resilience indicators, we identified the most critical road segments in the resilience road network. The results of this study provide theoretical support for improving the resilience of truck freight systems.
The structure of this paper is as follows:
Section 2 reviews key research in the field and identifies existing research gaps.
Section 3 introduces the data and methods used in this study.
Section 4 presents the analysis of the flood impact and the resilience changes in the truck freight system before and after floods, highlighting the most critical road segments.
Section 5 discusses the results.
Section 6 concludes the study and outlines future research directions.
3. Methodology
3.1. Rainfall Data Collection and Flood Simulation
The CaMa-Flood model was selected for hydrological flood simulation in this paper due to its wide adoption, ease of use, and good performance. It uses a grid-based method to process river and terrain parameters. It divides the study area into small grids, and each grid cell contains its own terrain data. The floodwater amount is generated based on the runoff data from the river and the additional water volume brought by rainfall. The model then allocates the water volume to each grid cell accordingly. If the flow rate exceeds the river’s capacity, grid cells near the river will be flooded, so the model can accurately predict the flooded area [
27,
28]. The runoff data used in this study were derived from the CaMa-Flood model test dataset, which provides global baseline hydrological data. The rainfall data from storms were collected from 176 meteorological observation stations within the study area, covering hourly observations from 00:00 on 17 July 2023 to 24:00 on 14 August 2023. These meteorological data include details such as the date, time, station number, station name, latitude and longitude, station altitude, city location, temperature, and hourly rainfall.
The selected period corresponds to a severe flood disaster that struck the area in late July 2023. During this event, rainfall significantly increased across most districts and counties, with high rainfall areas particularly concentrated in Beijing, Baoding, and Langfang in Hebei Province. As a result, logistics departure volume in the Beijing–Tianjin–Hebei region plummeted from 590,000 units before the flood to 170,000 units during the flood, a 71.3% decrease. The volume gradually recovered to 570,000 units after the flood, representing 97.1% of the pre-flood level. These significant changes in freight demand due to the flood provide an excellent sample for studying freight system resilience.
Using meteorological observation data and existing river runoff data, the flood event was simulated with the CaMa-Flood model. This catchment-based river routing model employs a digital map with a 1 km resolution to determine water storage, water levels, and inundation areas based on elevation. The model uses the diffusion wave equation to calculate water volume [
13]. It is versatile and suitable for both individual basin analyses and global climate simulations.
In the CaMa-Flood model, the water storage in each grid cell is used to determine the flood stage. The parameters required include river water storage , floodplain water storage , river water depth , floodplain water depth , and inundation area . Depending on the comparison between the total water storage and the initial flood storage , one of two sets of Equation (1) or (2) is chosen. The initial flood storage is calculated as , where is the river depth, is the river width, and is the river length.
When the total water storage
is less than or equal to the initial flood storage
, Equation Set (1) is applied:
When the total water storage
is greater than
, Equation Set (2) is applied:
We did not have access to official high-resolution flood extent maps for the 2023 flood to validate the model. To address this limitation, we cross-validated the simulated flood depths with crowdsourced reports from social media (e.g., Weibo posts tagged with flood photos and locations). We cross-validated the simulated flood depths with crowdsourced reports from social media, and the results were consistent at most points.
3.2. Road Network Topology and Freight Demand Modeling
Establishing the road network topology is crucial for studying the resilience of freight transportation systems. In this study, the road network topology is based on a modified version of Open Street Map (OSM), covering all motorways, trunk roads, and their connecting sections in Beijing, Tianjin, and Hebei Province, areas predominantly affected by the heavy rainfall. For each road segment, the data include a unique ID and the latitude, longitude, length, and speed limits. Motorways and trunks were selected due to their representation of the primary road network in the region and their inclusion of most roads commonly used by freight transportation systems. All subsequent analyses of road network resilience were conducted based on this road network, ensuring consistency.
Freight demand data for this study were derived from real-world big data. Heavy-duty truck GPS data were collected from Beijing, Tianjin, and Hebei Province in North China, covering the period from 00:00 on 17 July 2023 to 24:00 on 14 August 2023. Data that were missing, duplicated, or exhibited abnormal trajectories were excluded, resulting in the extraction of origin–destination (OD) data for 810,000 vehicles and 16 million trips. The OD data include vehicle ID, city of departure/arrival, departure/arrival time, main cargo type, rated gross vehicle weight, and rated load capacity. To simplify the calculations, the origin and destination points were set as the government locations of the respective districts and counties. Due to the lack of vehicle model data, we assumed that all trucks are consistent ordinary vehicle models, as the experimental simulation is macroscopic and this does not affect our results.
Travel time calculations assumed that heavy-duty truck drivers would select the shortest route between their origin and destination by default. Road segments flooded to a depth of over 1 m were considered interrupted, meaning that they became impassable in the road network. Drivers who had originally planned to use the interrupted segments would reroute to find the shortest path. The shortest path algorithm used was the A* algorithm.
The A* algorithm is a heuristic pathfinding algorithm that combines the advantages of Dijkstra’s algorithm and the greedy algorithm, optimizing the search process by introducing a heuristic function. The algorithm operates on a graph , where is the set of nodes and is the set of edges, with each edge having a non-negative weight . The A* algorithm uses a cost function to represent the actual path cost from the starting point to node , and a heuristic function to estimate the minimum cost from node to the end node , ensuring that is both admissible and consistent. The total evaluation function combines the actual cost and heuristic estimate.
The algorithm expands the node with the smallest value from the priority queue , updates the cost of the node, and adds its neighboring nodes to the queue until the optimal path to the end node is found. During the algorithm’s execution, the cost of neighboring node m is updated through the formula , and the total evaluation function is calculated, finally reconstructing the optimal path from the end node back to the starting point.
While the A* algorithm assumes that drivers prioritize the shortest paths, real-world behaviors may deviate due to factors such as congestion avoidance or local knowledge. However, sensitivity analyses showed that alternative routing assumptions (e.g., a 10% detour tolerance) altered segment-specific travel times by <5% without affecting overall resilience trends. Thus, the shortest path assumption provides a robust macroscopic approximation for system-level impacts.
3.3. Two Methods of Resilience Evaluation
Inspired by Yin et al. [
21], we employed both functional resilience and topological resilience to evaluate the impact of floods on freight transportation systems. Resilience metrics include functional resilience and topological resilience. The functional resilience represents the ratio of pre-flood to post-flood travel time indices, reflecting operational performance. The topological resilience represents the ratio of the largest connected subgraph links to total links, measuring structural connectivity. Using both evaluation methods together helps overcome the limitations of a single approach, leading to a more comprehensive analysis of the truck freight system.
3.3.1. Functional Resilience
Functional resilience
is calculated based on the travel time in the road network, as shown in Equation (3). The travel time index
represents the travel time of the truck freight system, with
representing the actual travel time and
representing the free-flow travel time of the truck freight system. Functional resilience is described by the ratio of the
before the flood to the
after the flood.
3.3.2. Topological Resilience
Following road disruptions caused by the flood, road segments flooded to a depth of over 1 m were considered interrupted and impassable within the network. The link ratio of the largest connected subgraph was then calculated. Based on the largest connected subgraph, we measured topological resilience
, as shown in Equation (4). In this equation,
represents the link ratio of the largest connected subgraph,
represents the number of the most connected road segments in the network, and
represents the total number of road segments in the network.
The functional resilience and topological resilience values defined by Equations (3) and (4) range from 0 to 1, with higher values indicating better road network performance.
4. Results
4.1. Flood Analysis
4.1.1. Precipitation Distribution
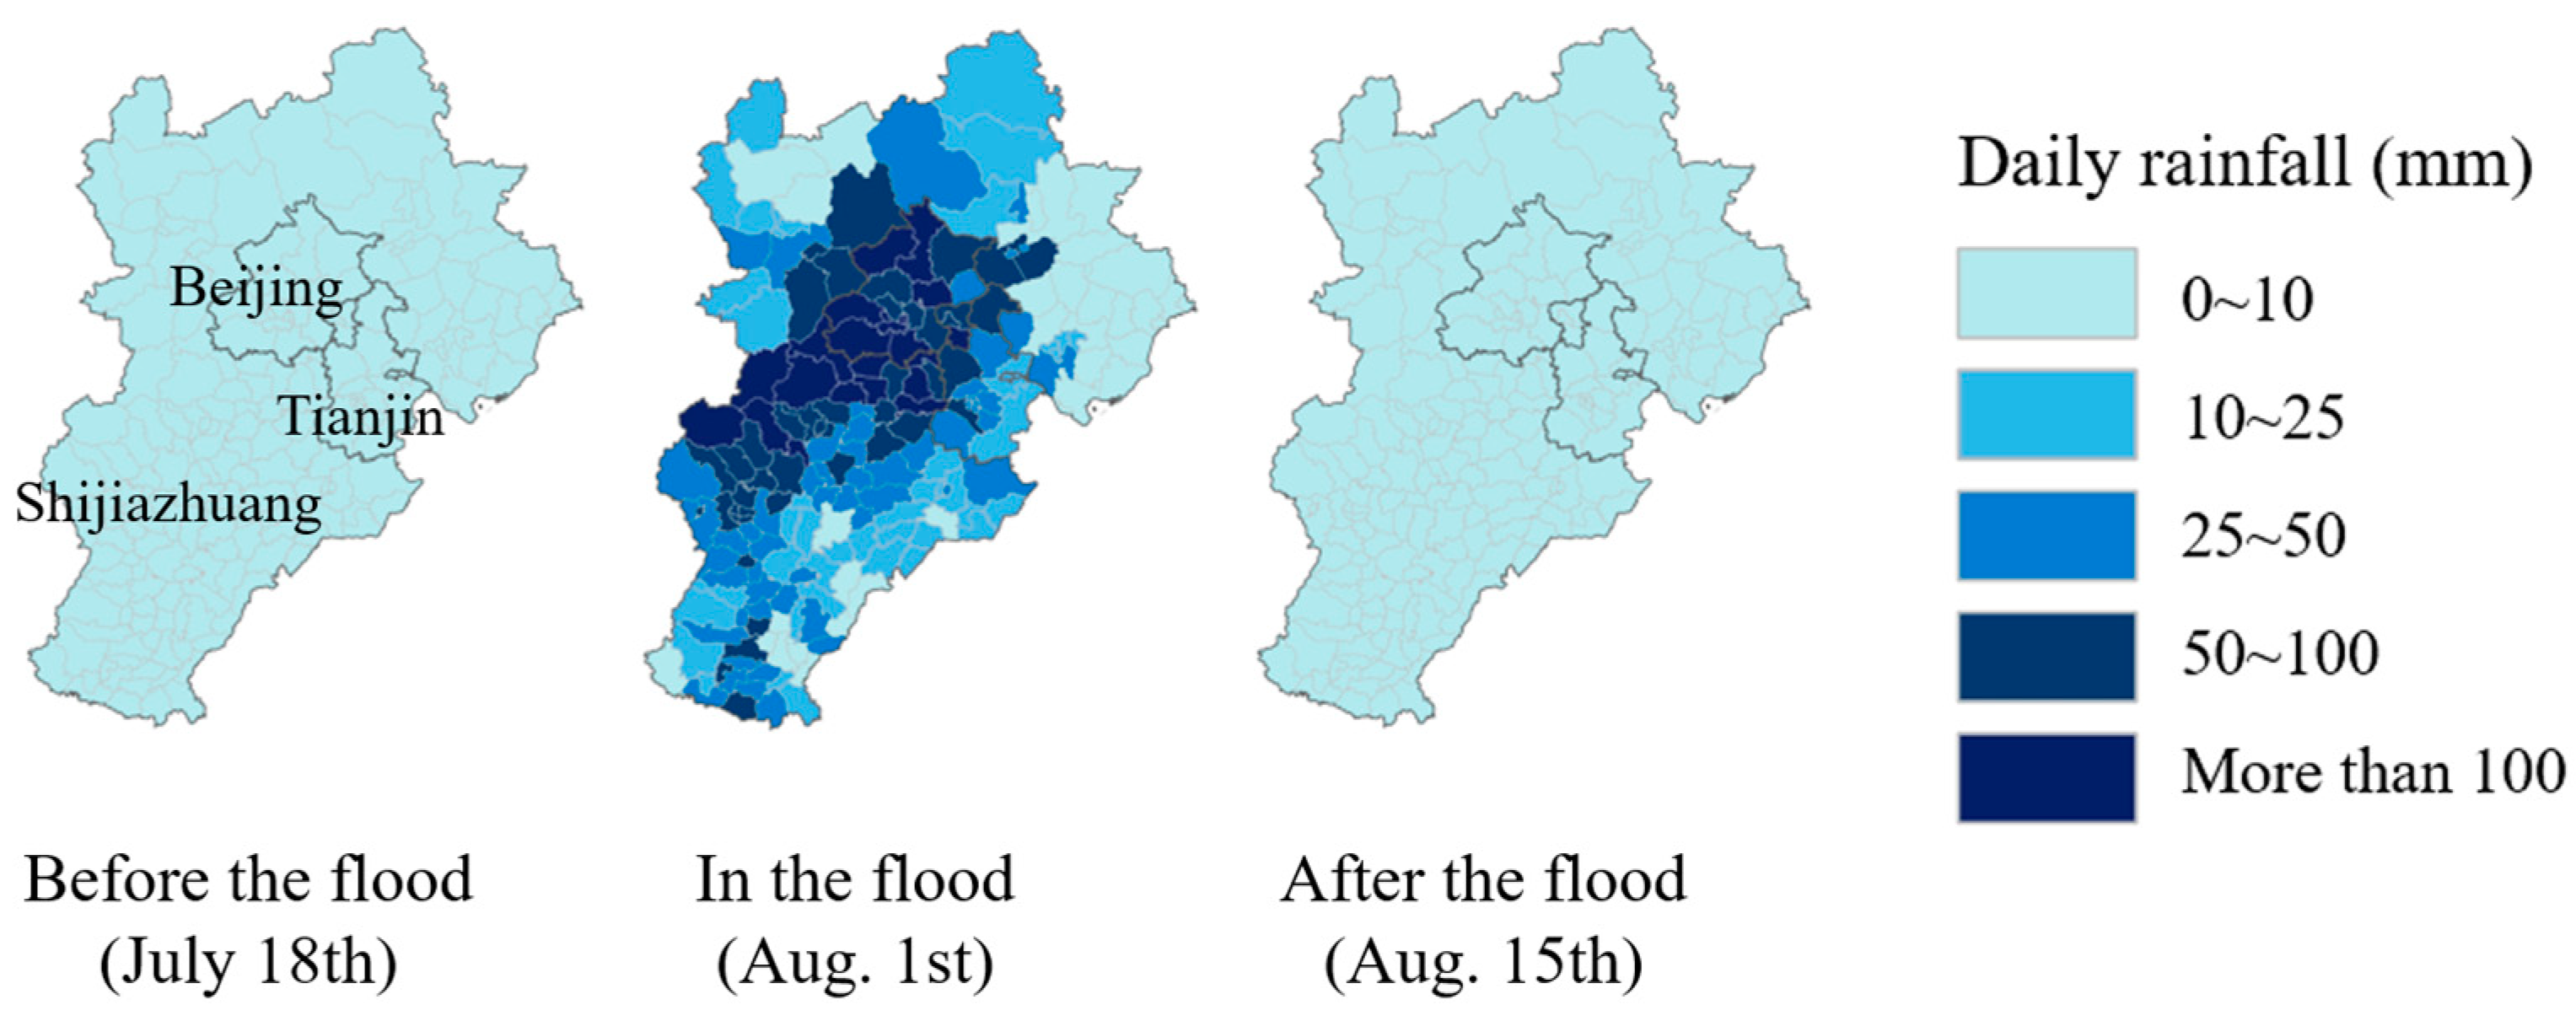
Rainfall data from meteorological stations were collected and mapped to the respective districts and counties, resulting in a rainfall distribution map. This map encompasses the study area, including Beijing, Tianjin, and Hebei Province, with Shijiazhuang, the provincial capital of Hebei, clearly marked. The blue areas on the map represent surfaces covered by water. As shown in
Figure 1, there was minimal precipitation before 18 July and after 15 August, with significant rainfall occurring during the flood event. However, during the event (1 August), most districts and counties experienced a sharp increase in rainfall. The regions with the highest rainfall concentrations were Beijing, Baoding, and Langfang. The data indicate that extreme, heavy rainfall occurred from 29 July to 1 August.
4.1.2. Flood Distribution
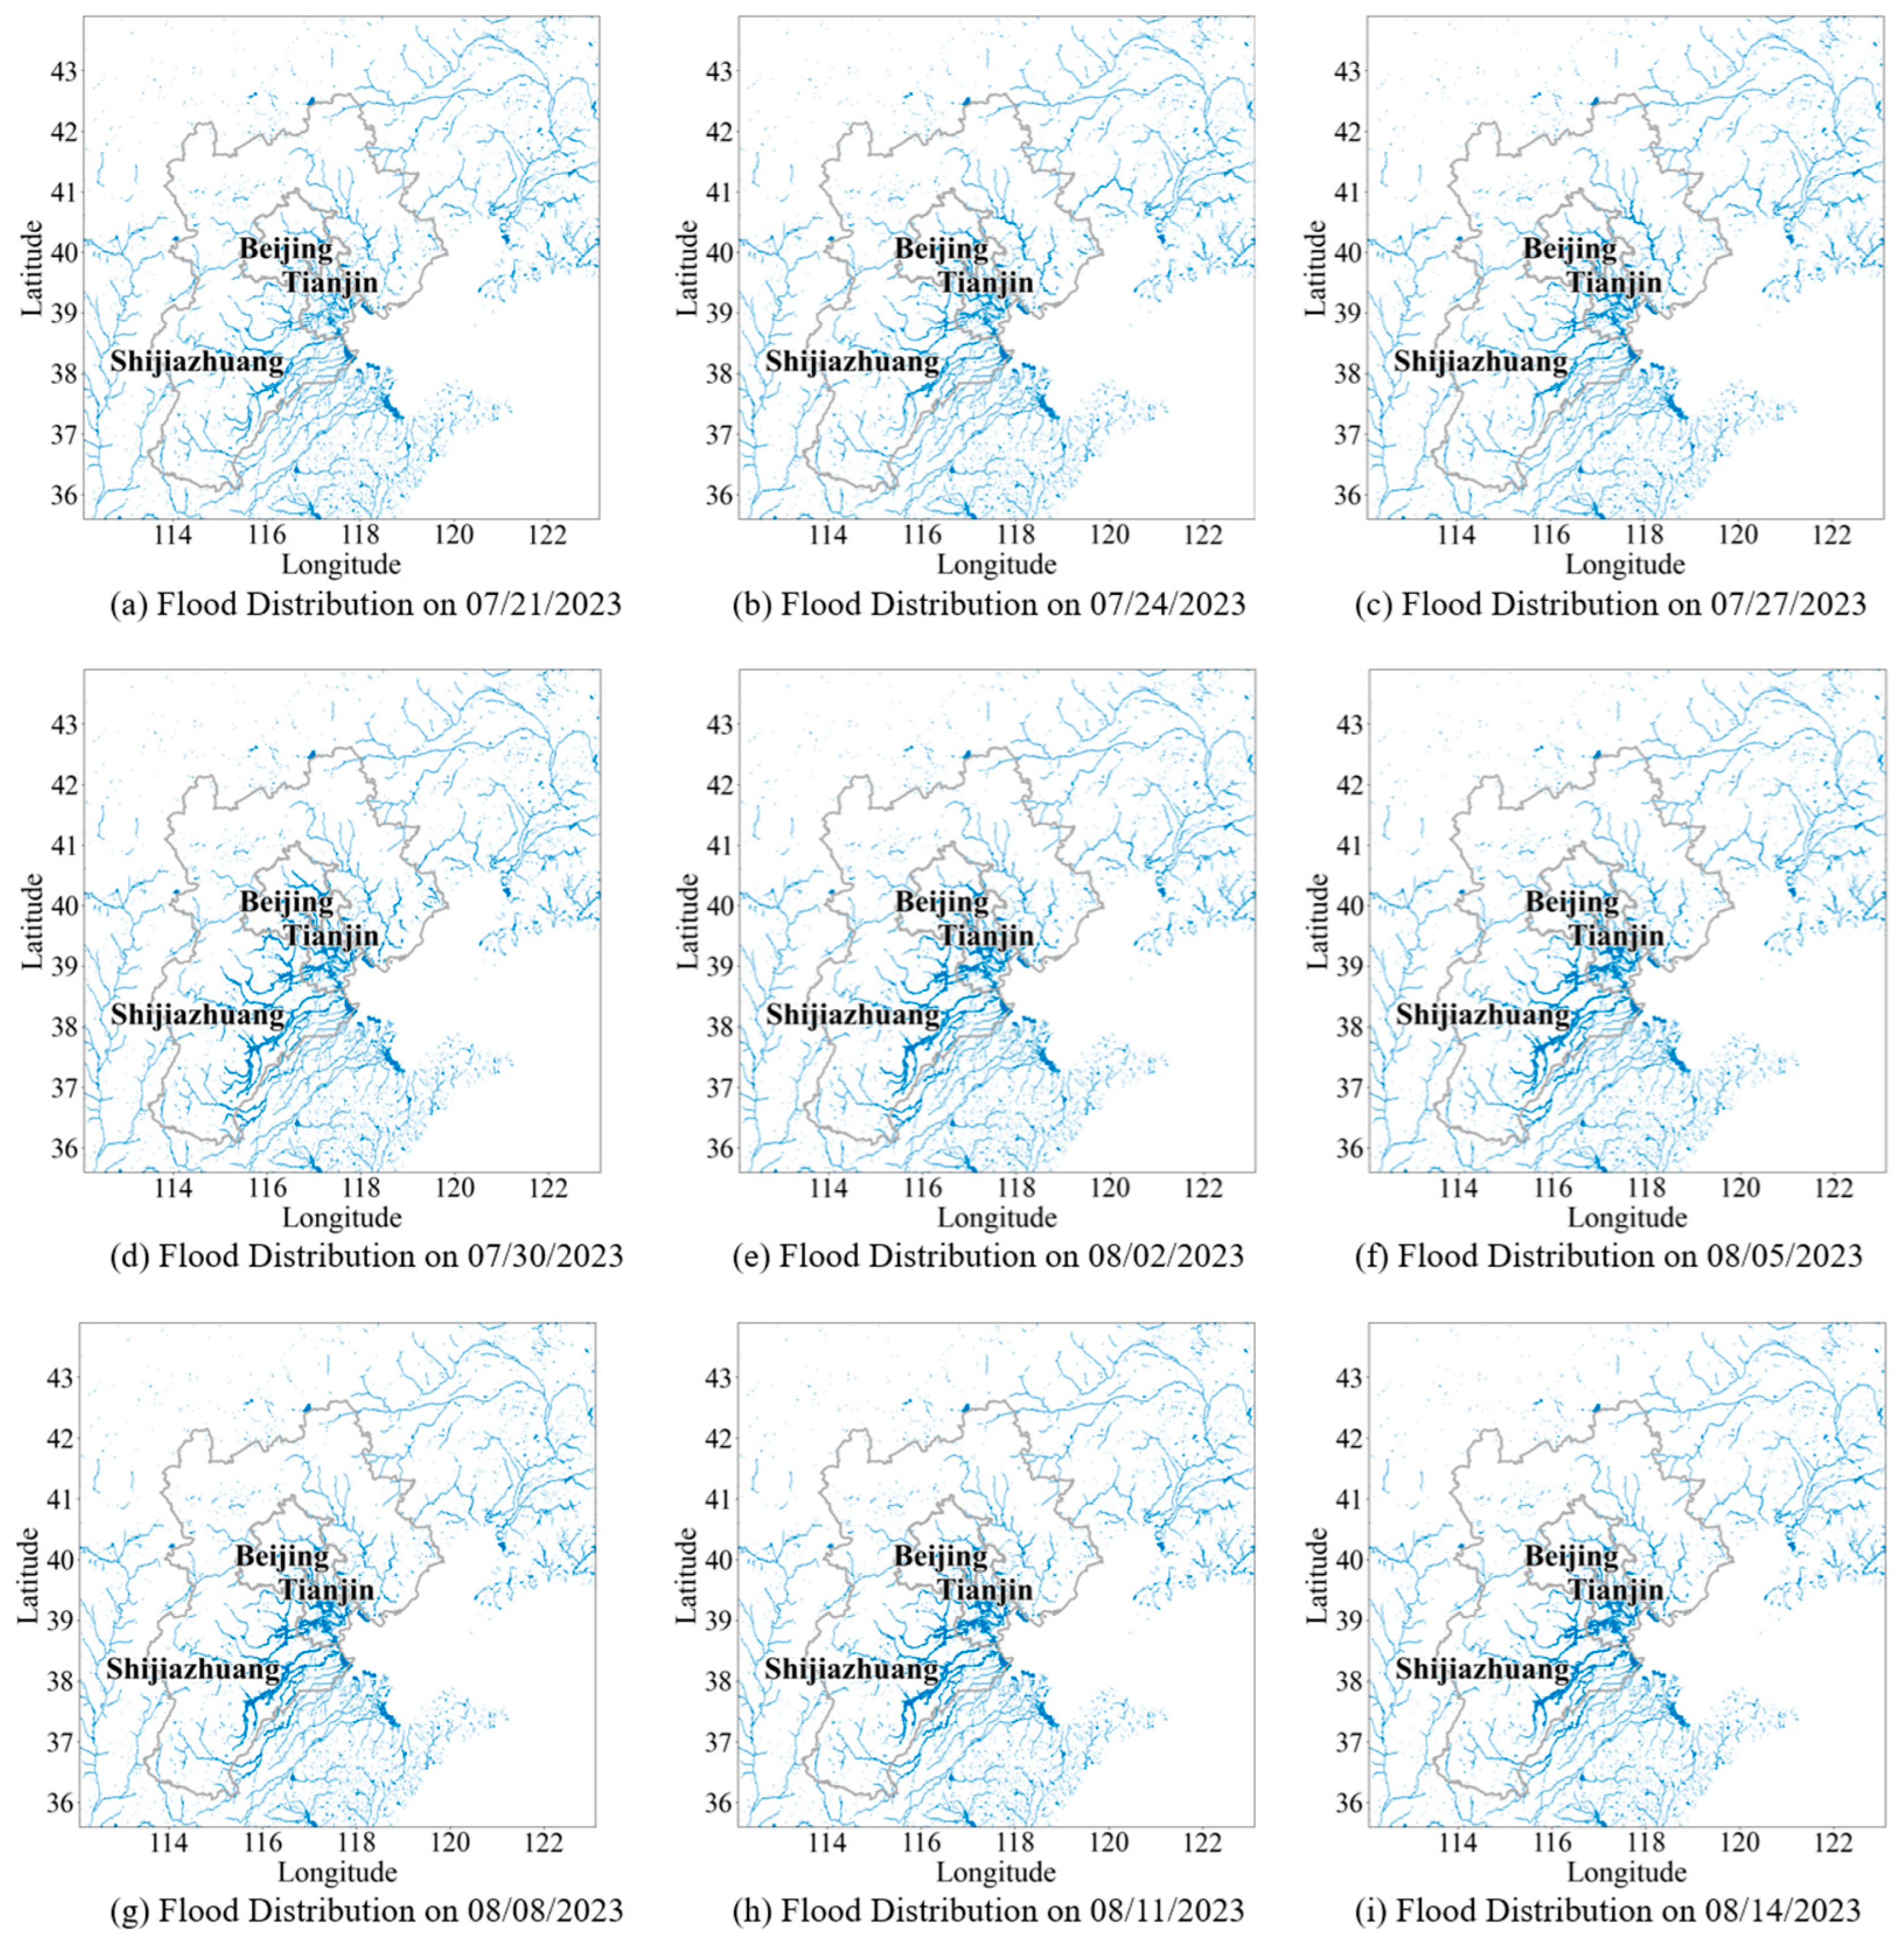
From the pre-flood water coverage images (
Figure 2a–c), it is evident that only coastal regions contained significant water bodies, while inland areas had minimal water. During the flood (
Figure 2d–f), parts of southern Beijing and southern Hebei, which were originally dry, became inundated with blue floodwaters, indicating that these areas, particularly near rivers and low-lying regions, were significantly affected by the flooding. This phenomenon occurs because rivers quickly swell during floods, and when their capacity is exceeded, the water overflows, flooding the adjacent areas. The major river plains in north China, especially those near the Hai River and Yongding River, are particularly susceptible to extensive flooding. As the floodwaters receded (
Figure 2g–i), the extent of the flooded areas gradually decreased. Despite the cessation of heavy rainfall, the flood’s impact persisted, and some regions had not fully returned to their pre-flood conditions.
4.2. Road Network Resilience Analysis
4.2.1. Road Segment Disruptions Due to Floods
Based on the simulated flood inundation areas from the CaMa-Flood model, the disrupted roads in the network were identified.
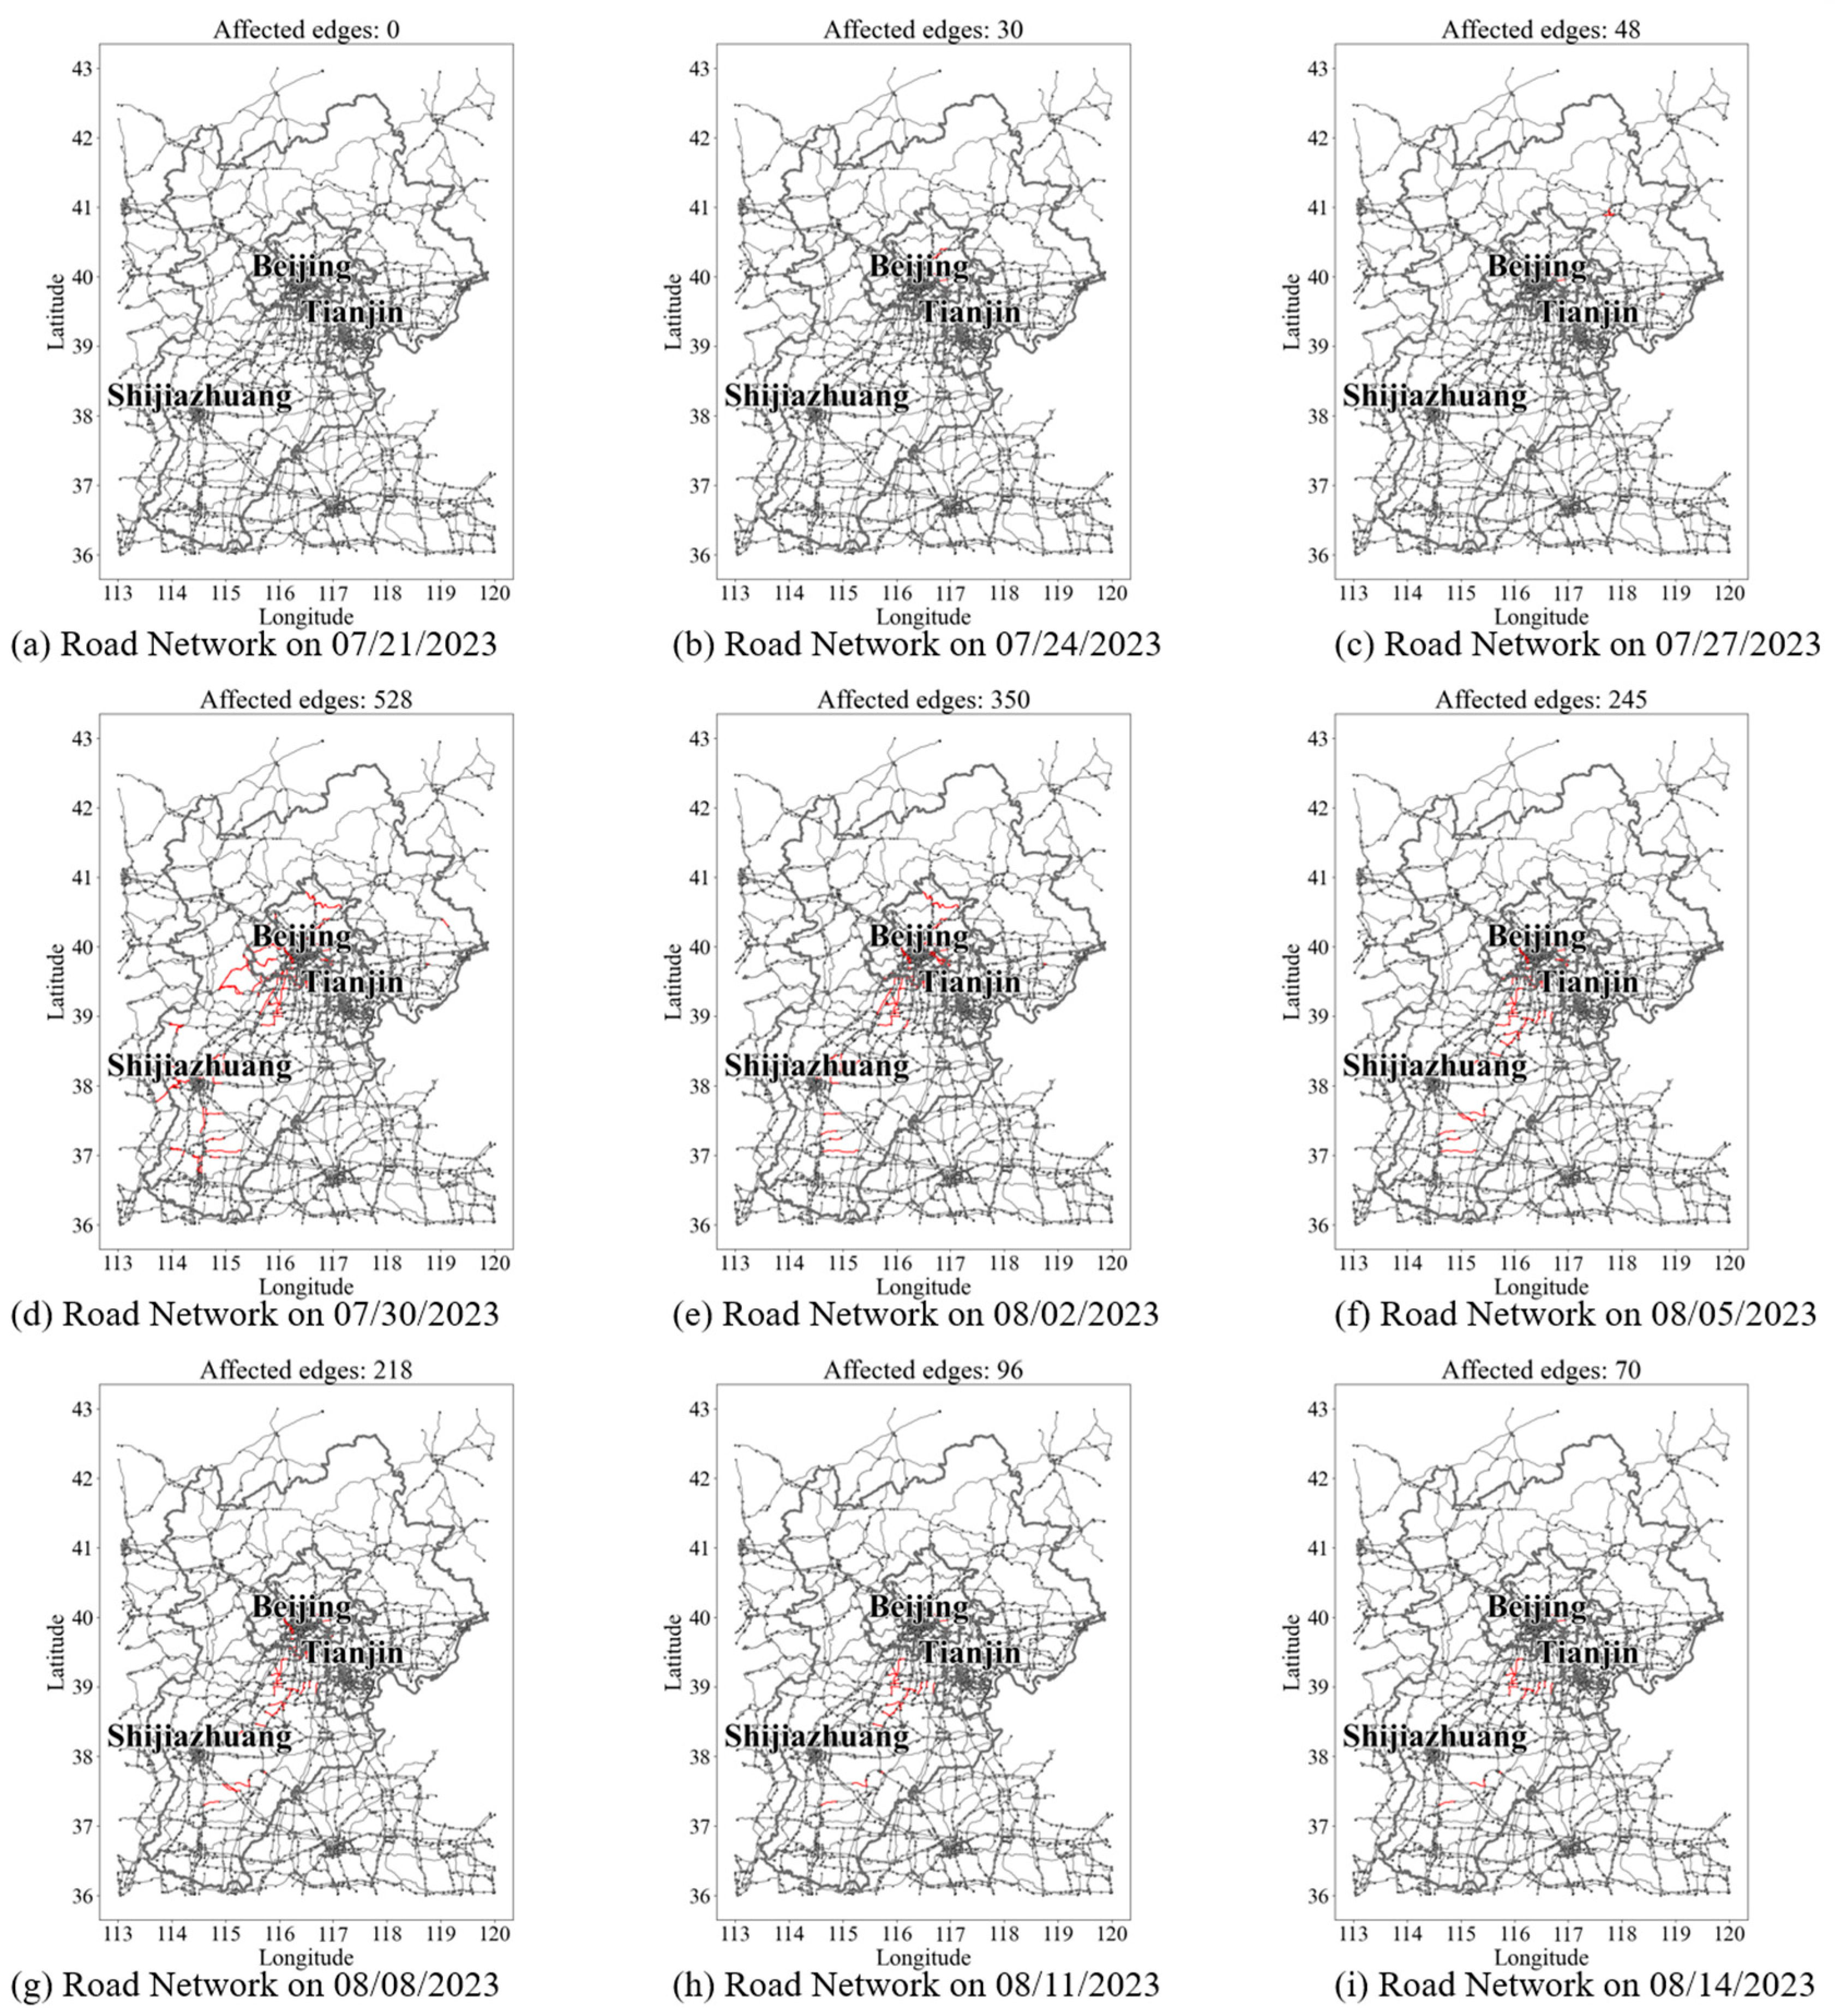
Figure 3 shows the operational status of the roadway network in the study area for every three days from 21 July 2023, corresponding to
Figure 2. In these maps, red segments represent roads submerged by floodwaters and therefore impassable, while gray segments denote passable roads. The study areas, including Beijing, Tianjin, and Hebei Province, are delineated with thick gray lines. Each map is dated and prominently displays the number of affected road segments at the top, providing a clear visual representation of the flood’s impact on the road network.
From the pre-flood road network images (
Figure 3a–c), it is evident that fewer than 50 segments were disrupted, mainly scattered northeast of Beijing and northeast of Hebei, with no widespread disruptions. During the flood (
Figure 3d–f), many road segments in southern Beijing and southern Hebei were disrupted, corresponding to areas of extreme rainfall and flooding, as shown in
Figure 2. Over 9 days, a total of 1585 road segments were affected, with the highest number of disruptions reaching 528 on 2 August. This peak indicates a large-scale disruption of the network on that day, severely impacting the freight transport system. As the flood receded (
Figure 3g–i), the number of disrupted road segments gradually decreased. However, due to the lingering effects of the flood, the road network had not fully recovered. Even two weeks after the floodwaters had receded, 70 road segments continued to experience disruptions.
4.2.2. Changes in System Resilience
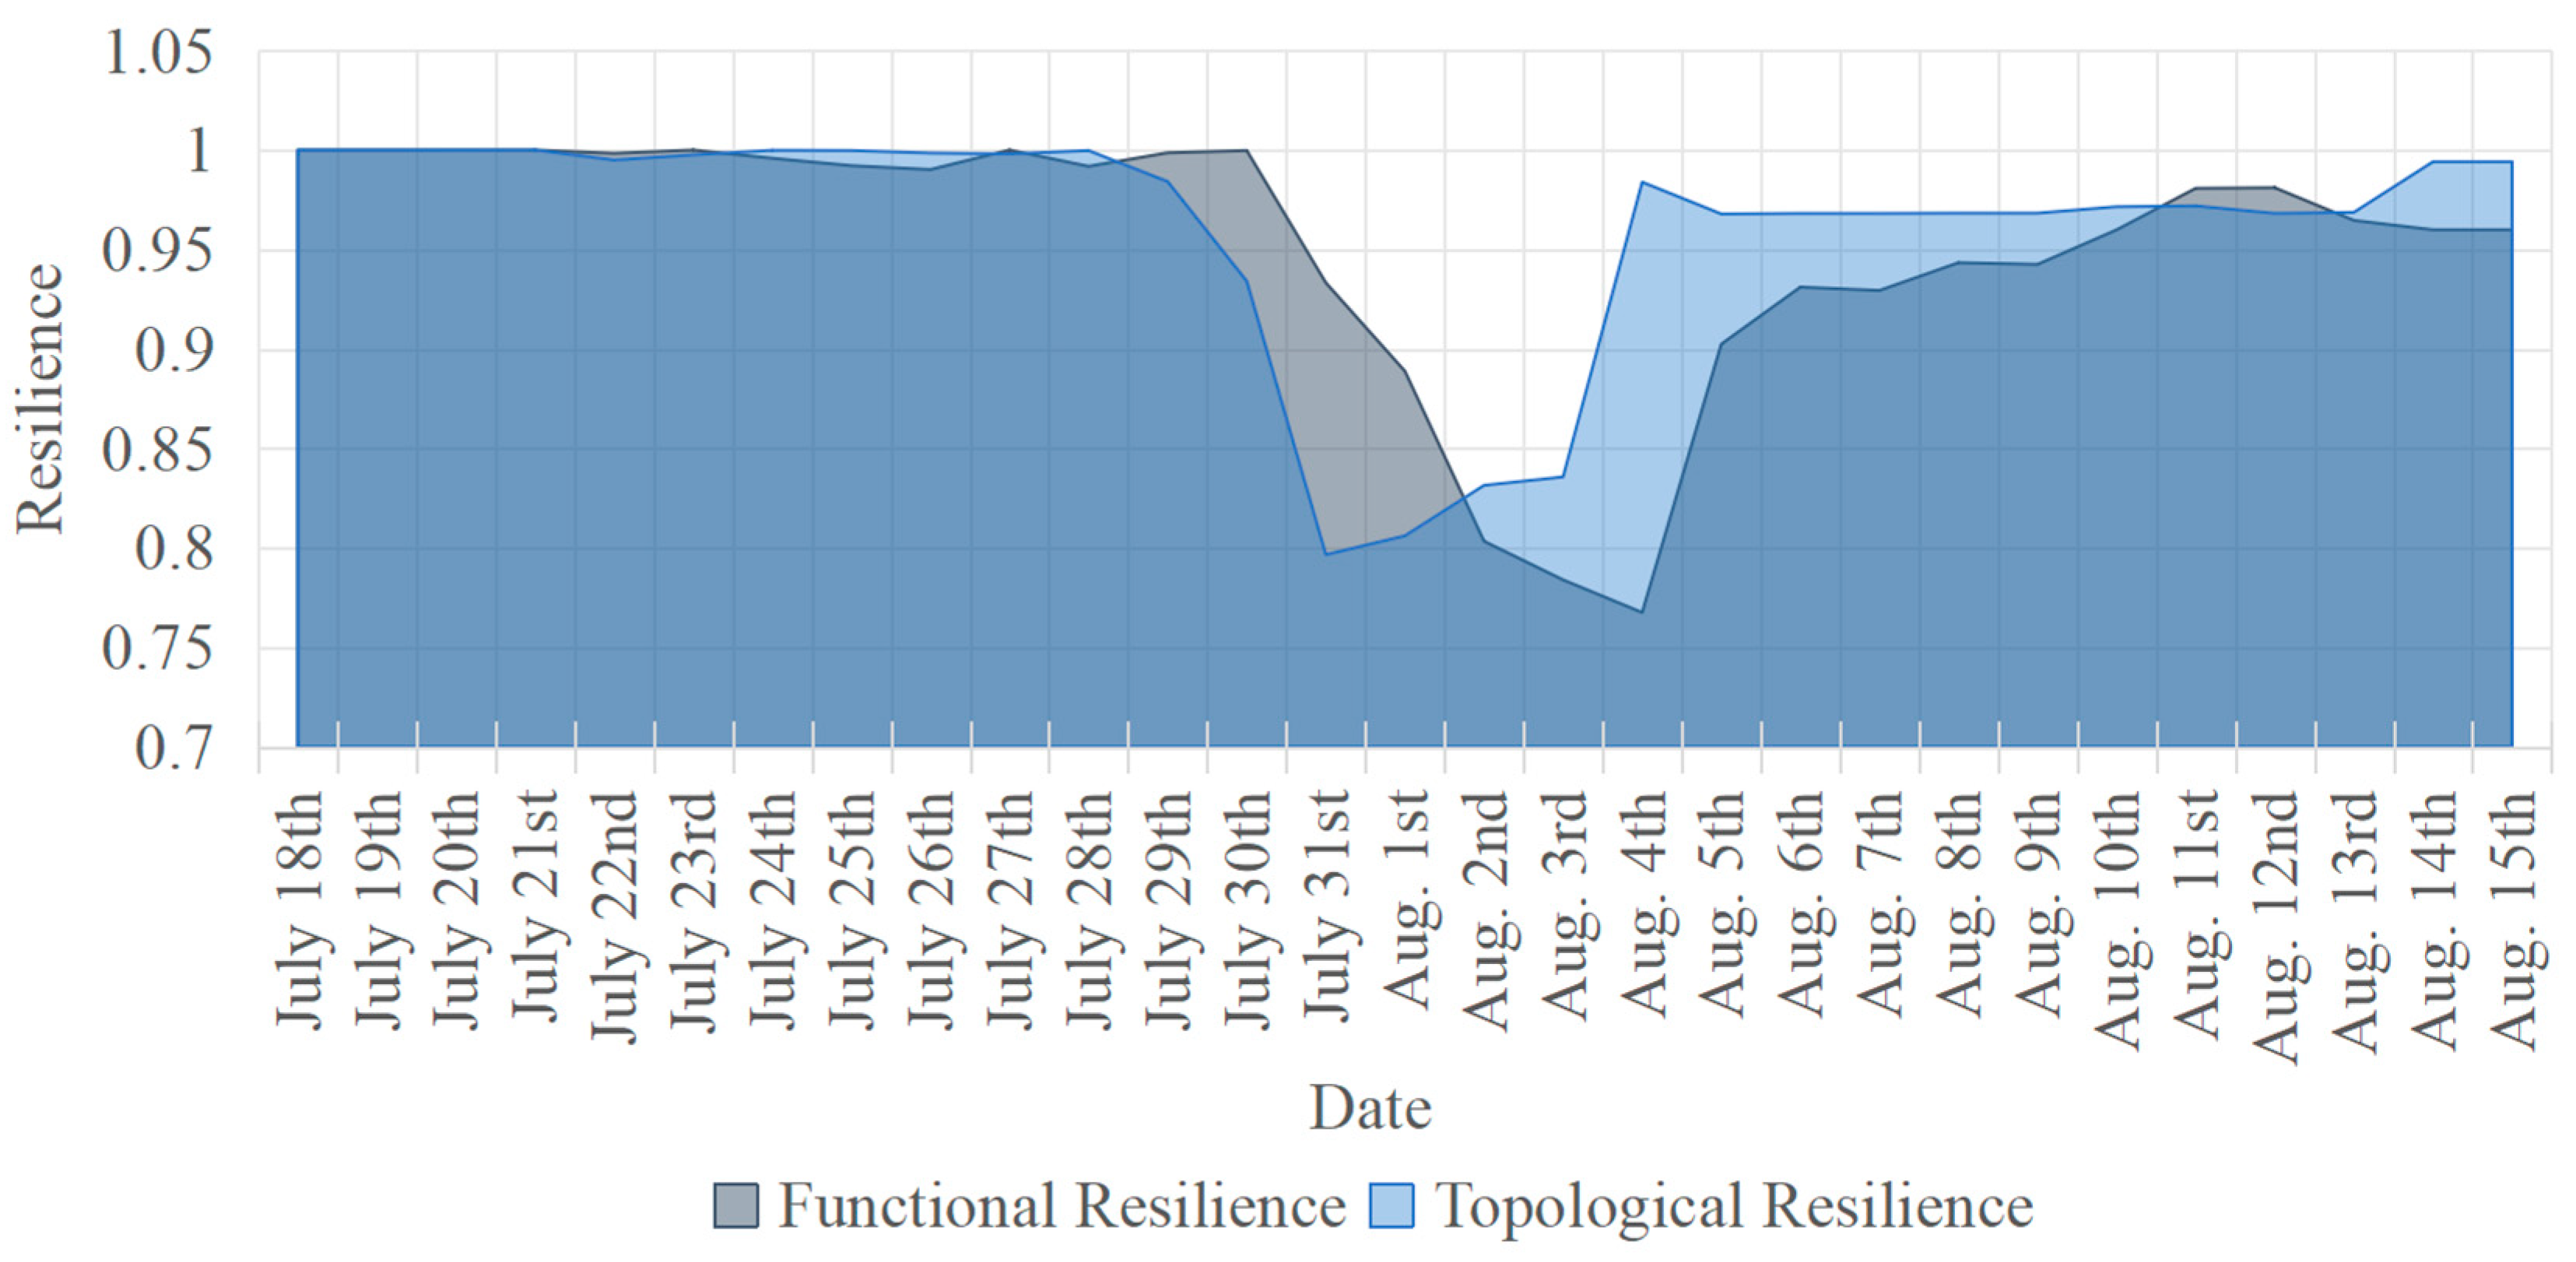
Each day, flood-impacted road segments were systematically removed from the network. Freight demand was then entered, and both the total travel time and the maximum link proportion for the heavy-duty truck freight system were calculated. Using Equations (3) and (4) from the Methods Section, we computed the changes in both functional and topological resilience of the entire heavy-duty truck freight system. These changes are illustrated in
Figure 4.
The changes in functional and topological resilience are not synchronized, indicating different recovery rates. (i) Topological resilience reached its lowest point on 31 July, coinciding with peak rainfall and flood levels, while functional resilience reached its lowest on 4 August, showing a four-day delay. (ii) The decrease in functional resilience and its basic recovery both occurred approximately two days later than topological resilience. (iii) Despite these differences, the areas of the resilience triangles for both functional and topological resilience are comparable, suggesting that the overall losses measured by both types of resilience are roughly equivalent.
The observed lag in functional resilience relative to topological resilience may be attributed to several factors. These include variations in the definitions of resilience, the delayed impact of changes in traffic flow, and the gradual recovery of network functions.
4.3. Road Segment Restoration Decisions
Following the analysis of system resilience, critical road segments that significantly impacted it were identified. By removing one flood-affected road segment at a time from the complete network, changes in both types of resilience for the entire heavy-duty truck freight system were measured before and after each disruption.
Three equally spaced workdays were analyzed: 1 August, 8 August, and 15 August. These dates represent the peak of the flood impact, the receding phase, and the point where the flood’s impact had almost ceased, respectively. For simplicity, only the motorways were analyzed. The number of disrupted segments on these dates was 167, 72, and 20, respectively.
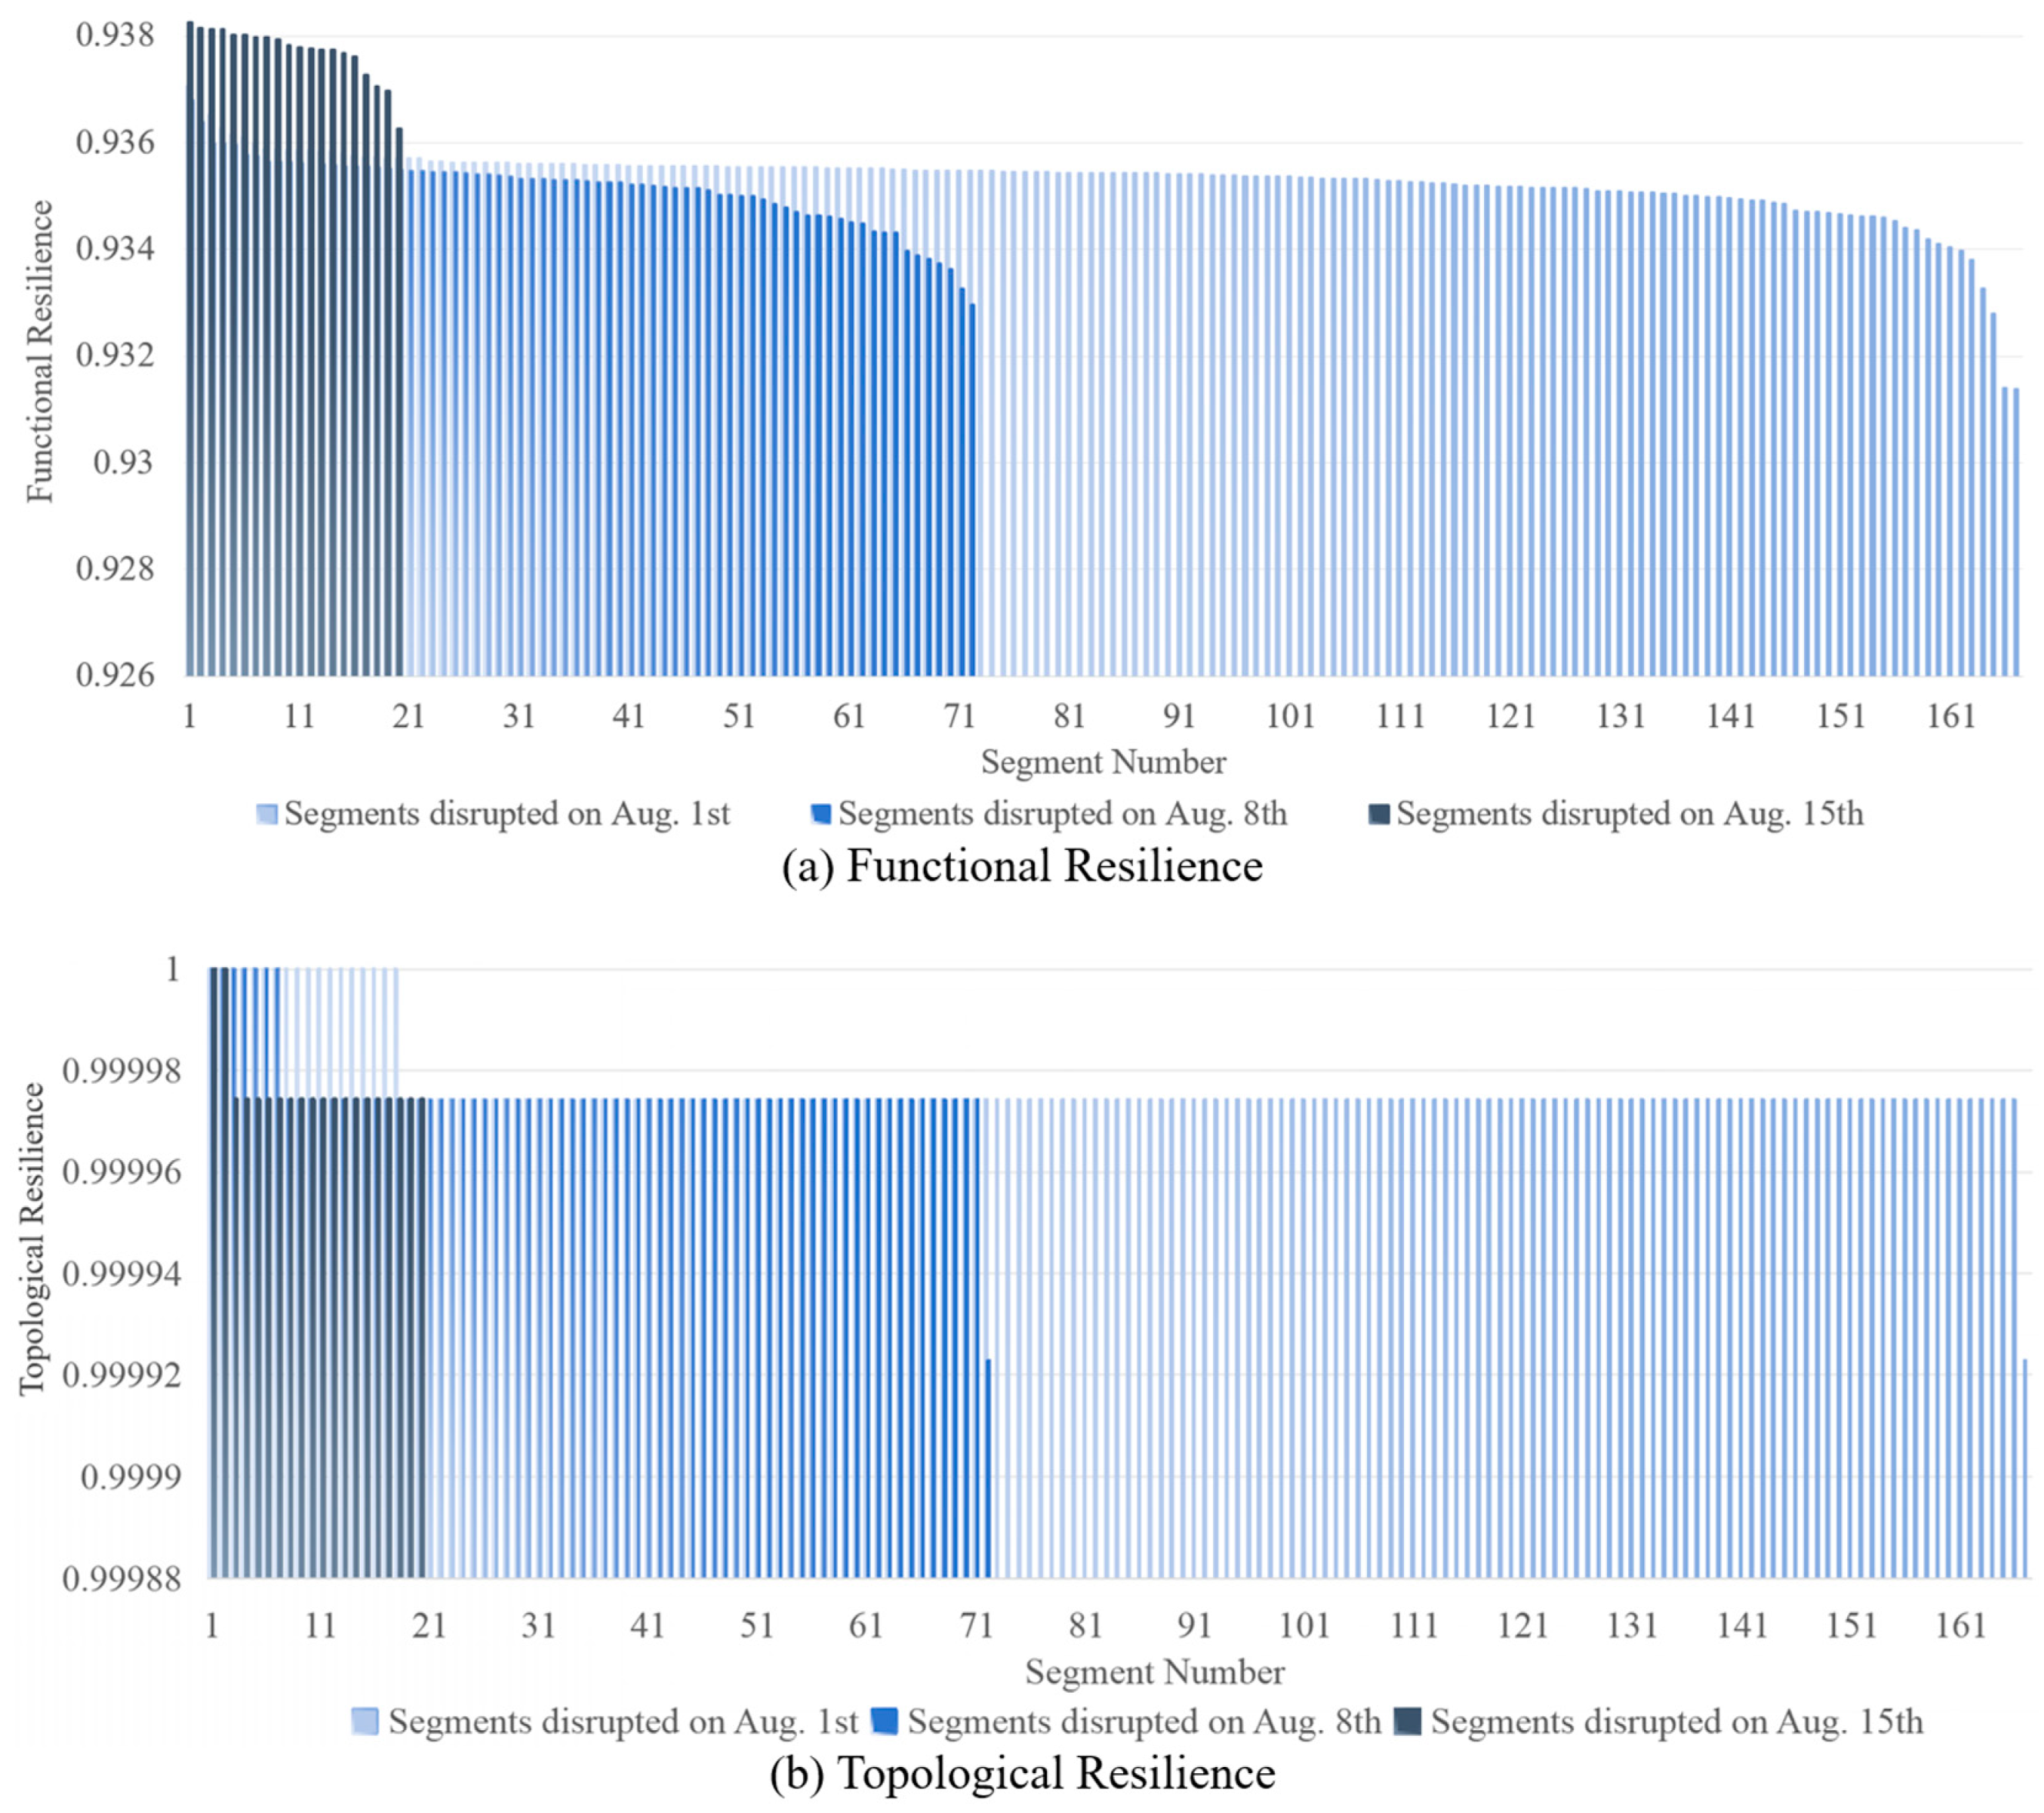
The changes in system resilience for each flood-affected road segment on the three study days were calculated and ranked by impact, as shown in
Figure 5. In this figure, the resilience value of the entire road network is displayed after the removal of each segment. A higher resilience value indicates better network resilience. Consequently, a higher post-removal value suggests that the segment has a minimal impact on network resilience, making its restoration less critical. Conversely, a lower post-removal value indicates a significant impact on network resilience.
The analysis revealed that most segment disruptions had similar effects on system resilience, suggesting that many segments within the road network could be replaced without causing significant disruption. However, a few segments, positioned at the higher-impact end of the ranking, had a considerable effect on resilience when disrupted. These segments were identified as critical, with their restoration crucial for the recovery of system resilience, making them a priority for repair.
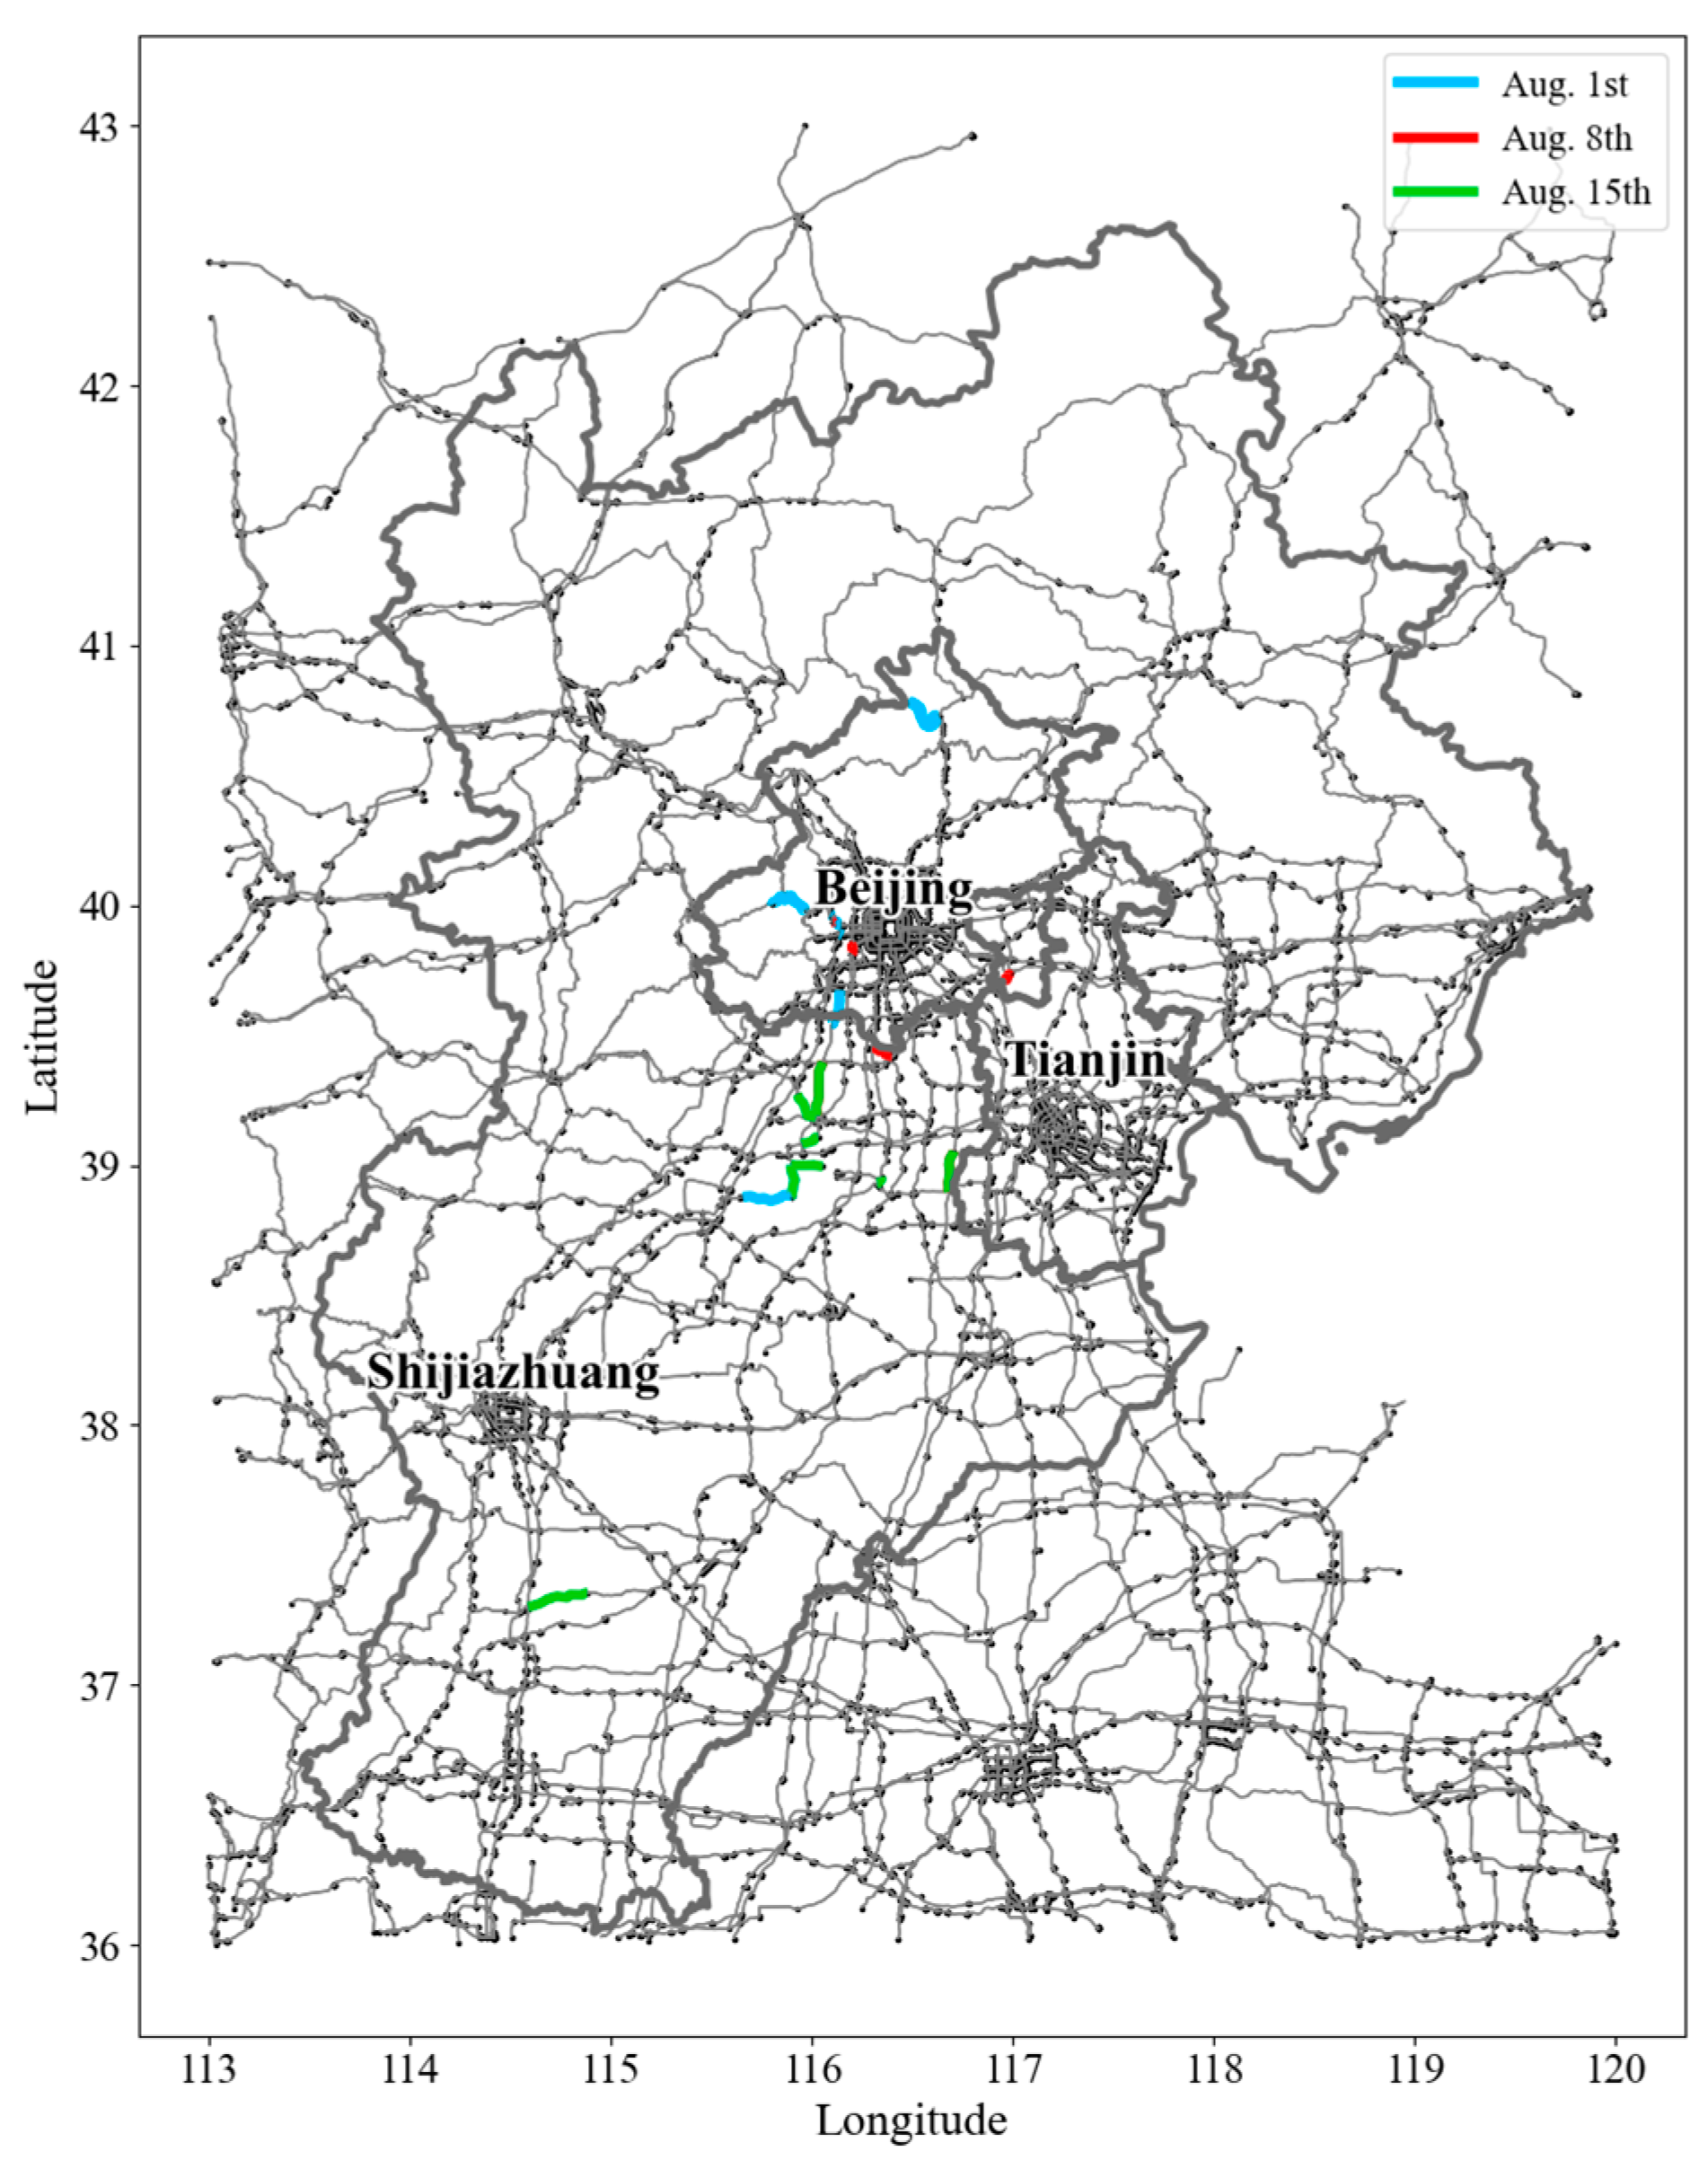
In the road network of
Figure 6, blue, red, and green lines indicate the positions of the top 10 most critical road segments impacting the resilience of the truck freight system on 1 August, 8 August, and 15 August, respectively. The locations of these segments vary significantly over time. During the peak flood impact, the most crucial segments for repair are the main routes in and out of the city in the southwest and north of Beijing. As the flood recedes, the critical segments shift to shorter bottleneck roads closer to the city. When the flood impact nearly ceases, the distribution of the critical segments becomes less distinct.
Repairing these road segments leads to significant improvements in the overall network. A comparison of the removal of all affected segments with the repair of the top 10 most critical segments on the three study dates reveals that on 1 August, during the peak flood impact, repairing the top 10 segments reduces the total travel time of the truck freight system by 8.18%. On 8 August, during the flood recession stage, the total travel time is reduced by 3.45%. By 15 August, when the flood impact has almost ceased, the repair effect is no longer significant, with the change in total travel time not exceeding 1%. This underscores the importance of identifying and promptly repairing critical segments during flood events.
5. Discussion
This study provided a comprehensive analysis of a heavy rainfall event within the study area and its impact on the resilience of the regional truck freight system, identifying road segments affected by flooding and pinpointing those that are critical for enhancing resilience. The analysis revealed three key findings, each with significant implications for transportation management and resilience research.
5.1. Asynchronous Changes in Functional and Topological Resilience
The changes in functional and topological resilience are not synchronized. The topological resilience of the entire truck freight system reached its lowest point during the peak of the flood, whereas functional resilience did not reach its lowest point until four days later. This indicates that the decline and recovery of functional resilience is delayed by approximately two days compared to topological resilience. This difference arises because topological resilience reflects changes in network connectivity and structure, which are directly impacted by physical damage to roads and bridges. As soon as water levels rise during a flood, submerged segments cause an immediate drop in topological resilience. In contrast, functional resilience refers to the network’s ability to maintain service. Although the physical structure of the network is immediately affected during a flood, the reduction and recovery of function are influenced by other factors such as freight demand, traffic flow management, and temporary repairs, resulting in slower and delayed changes compared to topological resilience. During recovery, once the flood recedes and roads are physically repaired or replaced, topological resilience quickly improves. However, functional resilience also depends on the redistribution and restoration of traffic flow, which are more complex and delayed processes. The delayed functional resilience recovery stems from behavioral inertia in freight operators. Even after roads reopen, drivers may temporarily avoid previously flooded routes due to perceived risks or lingering congestion. Additionally, supply chain disruptions (e.g., delayed shipments) prolong the restoration of pre-flood freight demand patterns. This lag highlights the need for real-time traffic advisories and incentives to accelerate behavioral normalization.
Our findings on delayed functional recovery (functional recovery was delayed by four days) align with Mattsson and Jenelius’ observation [
47] of faster topological restoration compared to functional performance in urban passenger networks. However, the extended lag duration in freight systems, which was nearly triple their reported 1.5-day gap, stems from unique behavioral and logistical inertia. For instance, driver avoidance of recently flooded routes persists even after physical repairs, while supply chain rigidities (e.g., inventory replenishment delays) amplify recovery time. This divergence underscores the inadequacy of passenger-centric resilience models for freight networks, where functional recovery is decoupled from topological restoration due to human adaptation dynamics.
Thus, after a flood, it is crucial not only to promptly repair damaged roads and bridges but also to implement effective traffic flow management and temporary traffic arrangements to restore the network’s service capacity. Temporary detours, additional signage, and signals can ensure that the travel needs of rescue operations and residents are met during major road repairs. This finding encourages researchers to delve deeper into the mechanisms of traffic network functional recovery during disasters and explore methods to enhance functional recovery capabilities beyond physical repairs, such as dynamic traffic flow management strategies and emergency response systems.
5.2. Impact of Critical Road Segments on System Resilience
Certain road segments significantly reduce the overall system’s resilience when disrupted, indicating their crucial role in the freight system. On 1 August, during the peak flood impact, repairing the top 10 critical segments reduced the total travel time of the truck freight system by 8.18%. This significant improvement highlights the importance of immediate intervention during extreme weather conditions. On 8 August, during the flood recession stage, repairing critical segments still reduced total travel time by 3.45%. However, when the flood impact nearly ceased, the repair effect became insignificant, with total travel time changes not exceeding 1%. This demonstrates the critical importance of the early identification and repair of critical segments in mitigating flood damage to the freight system. Consistent with Ganin et al.’s [
48] prioritization of critical nodes, repairing the top 10 flooded segments reduced system-wide travel time by 8.18% during peak disruption. However, our analysis revealed temporal decay in repair benefits: post-flood recession phase interventions yielded diminishing returns (3.45% improvement), contrasting with Ganin’s static efficiency assumptions. Over time, the urgency and effectiveness of repairs diminish. Therefore, taking swift and effective repair actions immediately after a flood occurs can maximize the reduction of stress and losses in the transportation system, enhancing resilience and response capability to disasters triggered by natural hazards. Consistent with post-Hurricane Ida recovery patterns in New Orleans [
49], where 47% of food distribution sites in high-poverty tracts operated for only 1 day due to road closures, our model identified that freight recovery for Beijing’s southwestern corridors recovered three days later than expected. Furthermore, most segments have relatively similar impacts on system resilience when disrupted, indicating balanced contributions within the system. When these segments are disrupted, the system can partially maintain functionality through alternative routes or temporary measures, showcasing redundancy and flexibility.
Therefore, transportation management agencies should develop detailed emergency plans and maintain rapid response capabilities. Upon the occurrence of floods, resources should be promptly mobilized to assess and repair critical segments. Routine data analysis and simulations should identify potential bottlenecks in advance, enabling targeted repairs during disasters to minimize overall traffic impact. During peak flood periods, resources should be prioritized for the most critical segments to maximize repair efficiency and effectiveness. This strategy is particularly vital during the most severe impact periods. Future planning and design can enhance the construction and maintenance of these critical segments to improve their disaster resilience. Increasing system redundancy ensures sufficient alternative routes when critical segments are damaged, further enhancing overall system resilience.
5.3. Limitations of Sole Topological Resilience Measures
In practical resilience assessments, relying solely on topological resilience metrics may not fully capture the system’s complexity and actual operational status. Topological resilience primarily evaluates system resilience based on network connectivity and the maximum link ratio. This approach considers only the structural characteristics of the network, neglecting traffic flow, freight demand, and specific traffic behaviors. Consequently, many segments produce identical topological resilience results when disrupted, indicating limitations in finely assessing each segment’s impact on system resilience. This is not to suggest that functional resilience is more accurate than topological resilience. On the contrary, the resilience triangle areas for functional and topological resilience are similar, indicating that the overall losses measured by both types are roughly equivalent, and both methods are valid. Evaluating functional resilience solely through changes in total network travel time can more accurately assess the impact differences of each segment but reveals a noticeable lag.
While Henry and Ramirez-Marquez [
50] theorized the insufficiency of single-metric resilience assessments, our empirical data exposed critical gaps in topological indices. Identical connectivity loss scores (e.g., 15% node isolation) produced functionally divergent outcomes—travel time increases ranged from 8% to 22% depending on disrupted segments’ roles in freight corridors. This discrepancy arises because topological metrics ignore demand-weighted criticality; for instance, a rural highway’s isolation may score equivalently to an urban arterial failure in connectivity terms yet impose freight delays that are three times greater. Our resilience triangle analysis further revealed temporal decoupling: networks with similar topological recovery trajectories exhibited a 2.8-fold variation in functional rebound rates due to supply chain reconfiguration lags.
Therefore, transportation management departments should integrate detailed evaluation methods, such as functional resilience, and consider network structure and traffic behavior to assess system resilience from multiple dimensions. This comprehensive approach helps to accurately identify critical and weak road segments, enabling the development of more effective emergency and recovery plans.
6. Conclusions
This study leverages a comprehensive dataset of over 810,000 heavy-duty trucks to examine the impact of rainfall-induced extreme floods on the resilience of the heavy-duty truck freight system in Beijing, Tianjin, and Hebei Province, China. By integrating the CaMa-Flood model with real-time meteorological data, the truck freight demand model, and the topological road network, a detailed analysis of the effects of the floods on transportation resilience was conducted. Critical road segments were identified, and their timely reopening significantly enhanced the resilience of the truck freight system. This approach addresses the limitations of previous research that often neglected the complex impacts of floods on transportation systems, did not utilize extensive freight demand data, and focused solely on topological resilience analysis.
A two-step framework was systematically established to study changes in travel time and network connectivity within the heavy-duty truck freight system. Initially, the variation in water extent before and after the flood event was determined based on rainfall data. Subsequently, roads interrupted by the flood were identified within the network based on the flood inundation range. Using real freight demand data from the heavy-duty truck freight system, calculations of total travel time and the maximum link proportion of the road network were performed daily for the entire study area. This allowed for the assessment of changes in both the functional resilience and topological resilience of the heavy-duty truck freight system.
Further, changes in both types of resilience were measured by systematically removing one flood-affected road segment at a time from the complete road network, identifying critical segments that significantly impact system resilience. The findings highlight the necessity of rapid physical repairs and efficient traffic management to restore post-disaster network service capacity. Identifying critical road segments allows for prioritizing repairs that have the most significant impact on overall system recovery. This study underscores the limitations of relying solely on topological resilience metrics and emphasizes the importance of incorporating functional resilience assessments to comprehensively capture network performance under flood conditions. Future research will focus on two interconnected pathways to advance transportation resilience modeling. First, real-time traffic data from IoT sensors and crowdsourced platforms such as Amap will be integrated to dynamically update resilience metrics during flood events, enabling granular monitoring of network disruptions. Second, adaptive traffic management strategies, including variable toll pricing for alternative routes and AI-driven rerouting algorithms, will be explored to incentivize the rapid redistribution of freight traffic and mitigate congestion hotspots.
The results provide valuable tools for government agencies to evaluate and enhance the resilience of the heavy-duty truck freight system in response to extreme weather events. Future research will incorporate a broader range of road types, conduct more detailed freight demand analyses, and, combined with heavy-duty truck cargo data, analyze the differential impacts of floods on various types of heavy-duty trucks. This will further enhance the resilience of the heavy-duty truck freight system. Transportation authorities can prioritize rapid repairs of critical segments (e.g., Beijing’s southwestern corridors) identified by our framework. Proactive measures such as elevating flood-prone roads and deploying mobile pumps during forecasts can mitigate disruptions. Real-time resilience dashboards, integrating flood models and GPS data, could enable dynamic rerouting of freight traffic during disasters. Addressing these issues aims to mitigate the impact of disasters triggered by natural hazards on the freight system, ensuring the continuity of socio-economic activities and enhancing disaster response capabilities.


