Article

Primary Particulate Matter and Aerosol Emissions from Biodiesel Engines During Idling in Plateau Environments of China

1
College of Mechanical and Traffic Engineering, Southwest Forestry University, Kunming 650224, China
2
Key Laboratory of Modern Automotive Components Technology of Hubei Province, Wuhan University of Technology, Wuhan 430070, China
3
Key Laboratory of Environmental Protection and Safety for Motor Vehicles in Plateau and Mountainous Regions of Yunnan Province, Kunming 650224, China
*
Author to whom correspondence should be addressed.
Sustainability 2025, 17(3), 976; https://doi.org/10.3390/su17030976
Submission received: 21 October 2024 / Revised: 16 January 2025 / Accepted: 20 January 2025 / Published: 25 January 2025
(This article belongs to the Section Pollution Prevention, Mitigation and Sustainability)

Abstract

:
Diesel vehicles are recognized as significant mobile sources of particulate matter emissions. As a renewable and environmentally friendly alternative to conventional fossil diesel, biodiesel offers the benefit of reducing greenhouse gas emissions. However, existing research on biodiesel emissions primarily focuses on primary emissions, with a limited understanding of their impact on secondary organic aerosol (SOA) formation. In this study, a diesel engine test bench was employed under idle conditions using three commonly used biodiesel blends. Exhaust emissions were directly introduced into the HAP-SWFU chamber, a quartz glass smog chamber designed to characterize both primary emissions and SOA formation during the photochemical oxidation process. The black carbon and primary organic aerosol (POA) emission factors for the three biodiesel blends under idle conditions ranged from 0.31 to 0.58 g kg−1 fuel and 0.99 to 1.06 g kg−1 fuel, respectively. The particle size of exhaust particulates peaked between 20 and 30 nm, and nucleation-idle conditions were found to be the dominating mode. The SOA production factor was between 0.92 and 1.15 g kg−1 fuel, and the SOA/POA ratio ranged from 1.35 to 2.37, with an average of 1.86. This study concludes that the POA emission factor for biodiesel under idle conditions is comparable to values reported in previous studies on pure diesel exhaust, with the maximum SOA production factor reduced by 38%.

1. Introduction

The COVID-19 pandemic heightened awareness of aerosols, with motor vehicle emissions being one of the major sources of secondary aerosol precursors in urban areas [1,2,3], significantly affecting air quality and human health [4]. Numerous studies have shown that aerosols are a key component in the formation of atmospheric PM2.5 [5], and secondary aerosols are formed through atmospheric photochemical oxidation, often exceeding the amount of directly emitted primary aerosols [6]. Diesel vehicles, as key tools in production processes, produce most of the primary emissions from motor vehicles [7]. In China, diesel vehicles accounted for over 90% of PM emissions in 2016 [8,9,10,11]. Biodiesel is regarded as a key research subject for promoting energy sustainability. It can reduce greenhouse gas emissions and pollutants, aligning with global environmental goals to reduce carbon footprints. The use of biodiesel not only alleviates the environmental pressure caused by traditional fossil fuels but also supports the transition to cleaner energy, contributing to sustainable development at the economic, ecological, and societal levels. Biodiesel, as a potential alternative to diesel [12], can be used without engine modification, and it has been shown to significantly reduce primary emissions [13]. The U.S. Environmental Protection Agency reported that biodiesel reduces CO, HC, and PM emissions by 13%, 20%, and 20%, respectively, compared to diesel.
Through tunnel testing [14,15] or portable PEMS testing for pollutants such as PM, VOCs, and BC [16,17,18], studies have effectively explored the effects of vehicle exhaust on the atmosphere. Current research on biodiesel primarily focuses on the emission of primary particulate matter. Cai et al. studied the emission characteristics of biodiesel in agricultural tractors, finding that biodiesel increases their NOx emissions, and NOx emissions increase with the proportion of biodiesel [19]. Sakthi et al. studied the emission characteristics of biodiesel derived from hydrogen and industrial waste in agricultural diesel engines, showing that biodiesel can reduce HC and CO emissions [20]. SOA is a relatively new research area. Previous studies have focused on SOA emissions from diesel vehicle exhaust. Weitkamp et al. reported that diesel vehicle exhaust produces a large amount of secondary organic matter and inorganic aerosols through the photooxidation of primary emissions [21]. Deng et al. conducted specific experiments on the formation of SOA in diesel engines [22,23]. They found that compared to gasoline vehicles, diesel vehicles’ idle emissions had fuel-based POA (primary organic aerosol) emission factors and SOA formation factors that were one to three orders of magnitude higher. They then suggested that, unlike gasoline vehicle exhaust, IVOCs (intermediate volatile organic compounds) related to diesel fuel might be a major source of SOA [24]. Robinson et al. were the first to study SOA formation from diluted diesel engine exhaust in the atmosphere [25]. Chirico et al. studied the formation of SOA from diesel vehicles in Europe [26], and Gordon et al. simulated the SOA production process for five diesel vehicles in the United States [2], providing detailed data on the influencing factors and production factors for POA and SOA. However, with increasingly strict pollution regulations, the blending of biodiesel with diesel is seen as an important method of reducing dependence on petroleum. Currently, countries have established relevant regulations to promote the substitution of diesel with biodiesel. The U.S. Congress introduced the “Biodiesel Tax Credit Extension Act of 2024” to reduce taxes on biodiesel and encourage nationwide biodiesel usage. In 2023, China’s biodiesel production reached 2.15 million tons, 2.6 times that produced in 2019. Under the guidance of China’s “dual carbon” goals, a series of general plans have been formulated to guide and regulate biodiesel pilot projects. Since 2021, Shanghai, China, has established supporting measures for biodiesel production from waste cooking oil, making it the first city in China to apply biodiesel as a renewable energy source. Under stricter environmental regulations in the future, the scope of biodiesel substitution will expand. Therefore, it is important to clarify whether the SOA from biodiesel exhaust is similar to that from fossil diesel. Determining the impact of biodiesel on SOA emissions is crucial for investigating the environmental pollution caused by renewable energy.
According to the 2023 China Mobile Source Environmental Management Annual Report (CMSEMAR, 2023), 64% of diesel vehicles in China are not equipped with exhaust treatment devices, and 36% of diesel vehicles meet National Standard III. These vehicles emitted a total of 29,000 tons of particulate matter. In this study, a Yunnei Power diesel engine test bench was selected as the test platform, without a post-treatment device. The exhaust from biodiesel combustion was diluted and then introduced into an indoor smog chamber, followed by online measurement of initial emissions and SOA formation after photochemical oxidation. The primary aim of this study was to investigate the impact of biodiesel on the primary emissions from diesel vehicle exhausts and on SOA formation. Our findings expand the understanding of biodiesel’s contribution to SOA formation.

2. Materials and Methods

2.1. Diesel Engine and Fuel

In this study, a diesel engine test bench (Yunnei Power, D19TCI, Kunming, China) was utilized to simulate the combustion process. The basic parameters of the test bench are shown in Table 1. The biodiesel used in the experiments was soybean methyl ester biodiesel. The production process follows the Diesel Engine Fuel Blend Biodiesel Standard GB/T 20828-2014 [27], and its physical and chemical properties are listed in Table 2. Since B10, B20, and B30 are common biodiesel blending ratios [28], these three biodiesel ratios were chosen as the research subjects. Locally purchased 0# diesel from Sinopec complies with the GB 19147-2016 standard [29], and this biodiesel was blended with different volumes of diesel to create biodiesel–diesel blends. For example, B20 is a blend consisting of 20% biodiesel and 80% diesel by volume, with B10, B20, and B30 similarly following this ratio.

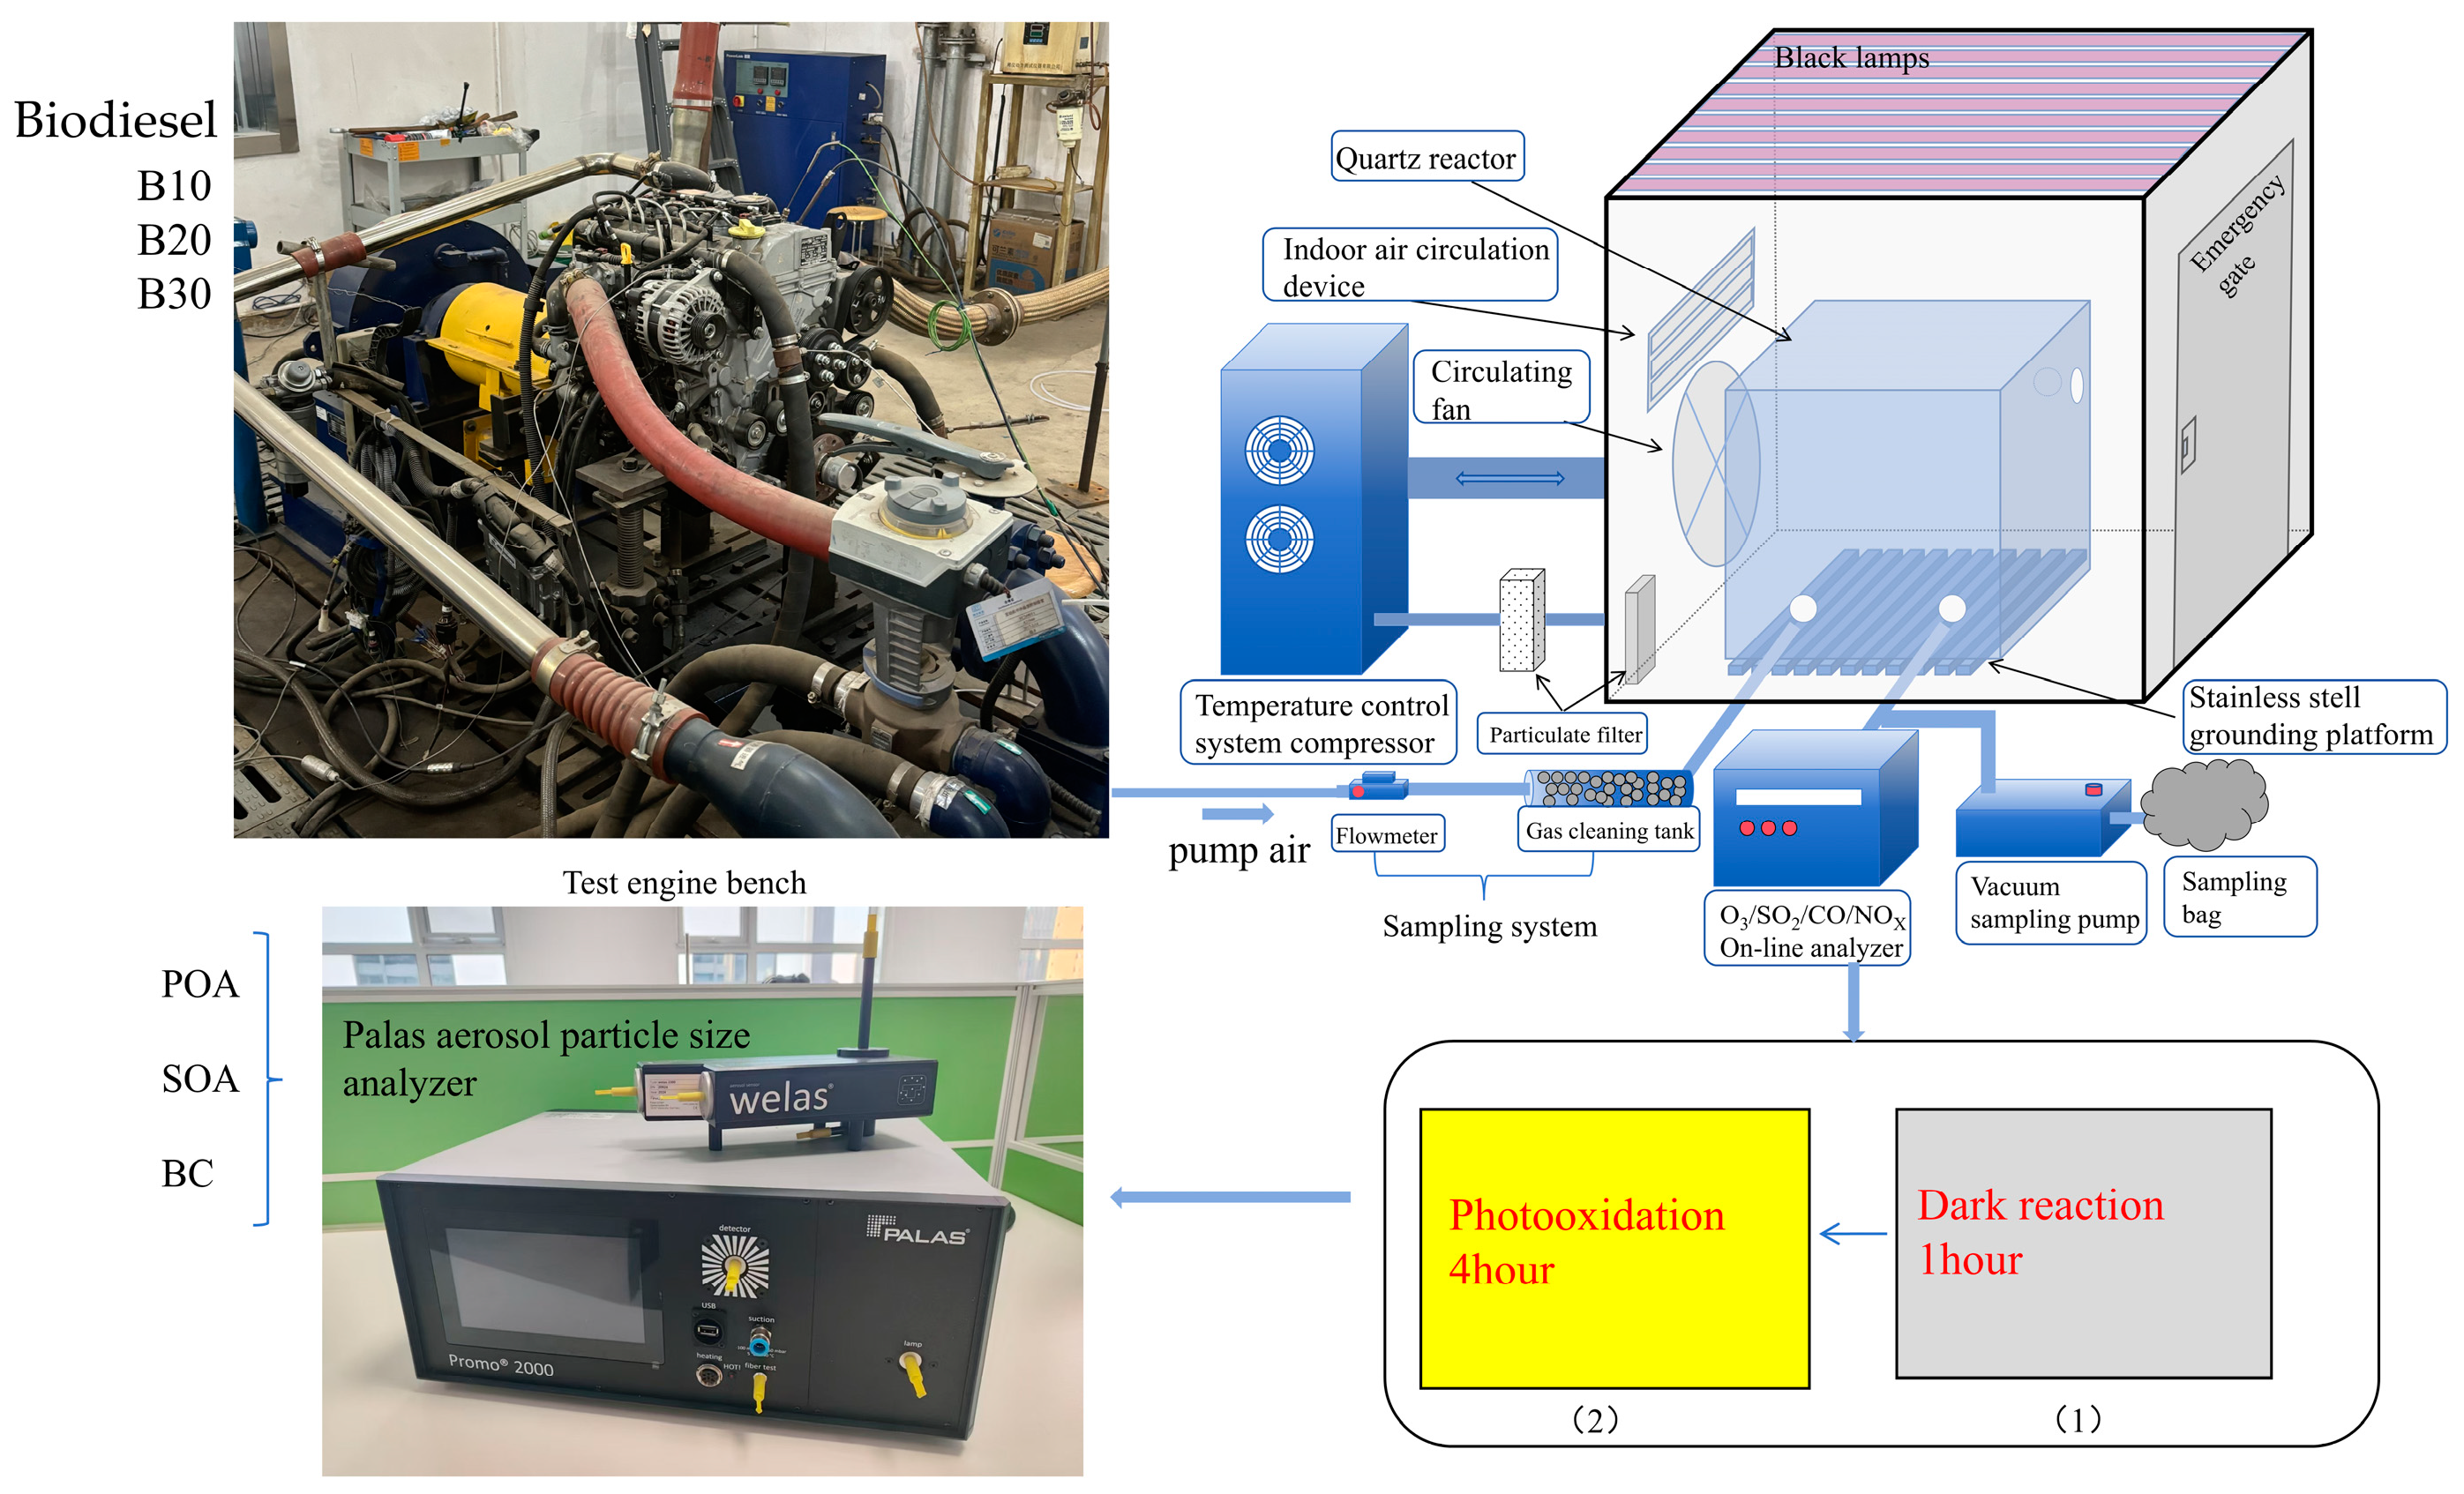
2.2. Experimental Setup

The experiment was conducted in a HAP-SWFU smog chamber at Southwest Forestry University; for a detailed description of the HAP-SWFU, please refer to [30]. The HAP-SWFU smog chamber is made up entirely of quartz and is equipped with 40 blacklight lamps (GE, 365 nm bulb F40 T12, General Electric Company, Boston, MA, USA) as the simulated light source, allowing for a maximum NO2 photolysis rate of 5.87 × 10⁻³ S−1. The indoor temperature was maintained within 25 °C ± 1 °C, and the relative humidity was set to 5%. After each experiment, the reactor was flushed with zero air at a flow rate of 50 L/min for 6 hours, equivalent to flushing the reactor 6 times. After cleaning, NOx and O3 levels were detected to be below 1 ppb, and the particulate matter concentration was close to 0 µg/m3, ensuring a clean background for each experiment.
Before introducing the exhaust gas into the smog chamber reactor, the engine was started and warmed up until the water temperature reached 95 °C, and then an idle speed was selected [31]. A vacuum sampling pump was used to introduce the diesel engine exhaust into the smog chamber. The sampling pump was connected in series with a particulate matter testing device (SEMTECH-COSTAR, American SENSORS Inc., Murrysville, PA, USA). When the particulate matter concentration reached 28 µg/m3, which is equivalent to the average PM2.5 value in Kunming for October 2023 (Kunming Ecological and Environmental Protection Bureau, 2023), the exhaust flow was stopped, with a total collection time of approximately 16 min. After the exhaust flow stopped, propylene was injected to adjust the VOC/NOx ratio [32] to 3:1 ppbc, which is considered a typical ratio for urban environments [33,34,35]. Subsequently, the smog chamber was characterized in a dark environment for one hour. After the dark reaction, blacklight lamps were turned on to simulate daily sunlight exposure for four hours of photochemical oxidation in the reactor.

2.3. Instruments

A series of instruments were used to monitor indoor gasses and particulate matter during the experiment. A condensation nucleus particle monitor (SEMTEC, Model 9294-0581, Camarillo, CA, USA) was used to measure particulate matter quantity in real time [36]; a hydrogen flame ionization detector (SEMTEC, Model 9294-062, USA) to monitor hydrocarbon concentrations during the experiment [37]; an NDTR infrared analyzer (SEMTEC, Model E15124605, USA) to conduct real-time measurements of CO and CO2 levels [38]; a high-resolution Palas aerosol particle size analyzer (Model LED2000, Salzbergen, Germany) to measure the mass and concentration of sub-micron aerosol particles [39]; and a Palas 128-channel particle size spectrometer (Model Welas1100, Germany) to measure soot concentrations [40]. The detection equipment was zeroed after each test and calibrated at least once a week.

2.4. Smog Chamber Reactor Operation Process

The reaction process in the smog chamber, depicted in Figure 1, represents a comprehensive experimental framework aimed at simulating and analyzing the chemical transformations of exhaust emissions under controlled conditions. The experiment is methodically divided into three stages, each designed to capture specific aspects of the reaction dynamics.
In the first stage, commencing at t = −1.26 h, exhaust gas is injected into the smog chamber through a thermal flowmeter. This step ensures precise control over the volume and flow rate of the exhaust introduced into the chamber. During this phase, the concentrations of NOx, CO2, and primary aerosols progressively increase, establishing the initial chemical environment for subsequent reactions. The concentrations of these substances during this phase, as detailed in Table 3, provide essential baseline data for tracking the evolution of chemical species.
The second stage begins at t = −1 h, marking the initiation of the dark reaction characterization. This phase focuses on measuring the concentrations of key pollutants, including CO2, CO, BC, NOx, and OA. Additionally, propylene is introduced into the chamber at t = −0.2 h to adjust the VOC-to-NOx ratio to approximately 3:1, a ratio representative of typical atmospheric conditions. This adjustment facilitates a controlled investigation of precursor interactions and provides a foundation for subsequent photochemical reactions.
In the third stage, the photooxidation phase begins at t = 0 with the activation of light sources in the smog chamber. This stage simulates the impact of sunlight on the chemical processes, leading to the formation of significant amounts of SOA. Over the course of four hours of illumination, the generation of SOA and the corresponding changes in the concentrations of other substances, such as BC, are meticulously recorded. This stage is critical for understanding the photochemical mechanisms and the role of SOA in atmospheric pollution and climate effects.

2.5. Data Analysis

The emission factor and SOA production factor are fuel-based (g kg-fuel−1):
E F x   o r   P F x = 10 X / C O 2 3 ω d
where x represents the concentrations of BC, POA, and SOA (µg m−3), CO2 denotes the concentration of carbon dioxide expressed in µgC m−3, and ωd is the carbon mass fraction of biodiesel, which is the carbon mass fraction in diesel. Biodiesels B10, B20, and B30 have carbon mass fractions of 0.834 C kg-fuel−1, 0.8204 C kg-fuel−1, and 0.8086 C kg-fuel−1, respectively. Formula (1) assumes that almost all of the fuel carbon is emitted as CO2, and the contribution of VOCs can be neglected.
To accurately quantify the particulate matter concentration in the smog chamber, it is necessary to correct for the loss of particulate matter and condensable organic vapors on the reactor walls. This study applied the wall-loss correction method for measured aerosols as described in [2]. In brief, the estimation of particulate matter loss is based on the assumption of internally mixed aerosols, meaning that OA and BC have the same wall-loss rate. Two extreme scenarios are considered: (1) ω = 0, indicating no condensation of organic vapors onto particles adhering to the walls; and (2) ω = 1, indicating equilibrium between organic vapors and particles attached to the walls as well as suspended particles. ω is a factor controlling the distribution of organic vapors between the walls of the smog chamber and the suspended particles [21].
When ω = 0, the loss rate of OA to the chamber walls is k. The total concentration of OA at time = t (OAtotal,t) can be calculated using the following formula:
O A t o t a l , t = O A s u s ( t ) + 0 t k · O A s u s ( t ) d t
where OAsus represents the suspended OA measured at time = t, and k is the wall-loss rate constant. When ω = 1, the total concentration of OA at time = t (OAtotal,t) is calculated using the following formula:
O A t o t a l , t = O A s u s ( t ) × [ B C ( t 0 ) / B C t ]
where BC(t0) represents the initial BC concentration measured before the lights are turned on, and BC(t) represents the BC concentration after the lights have been on for a period of time.

3. Results and Discussion

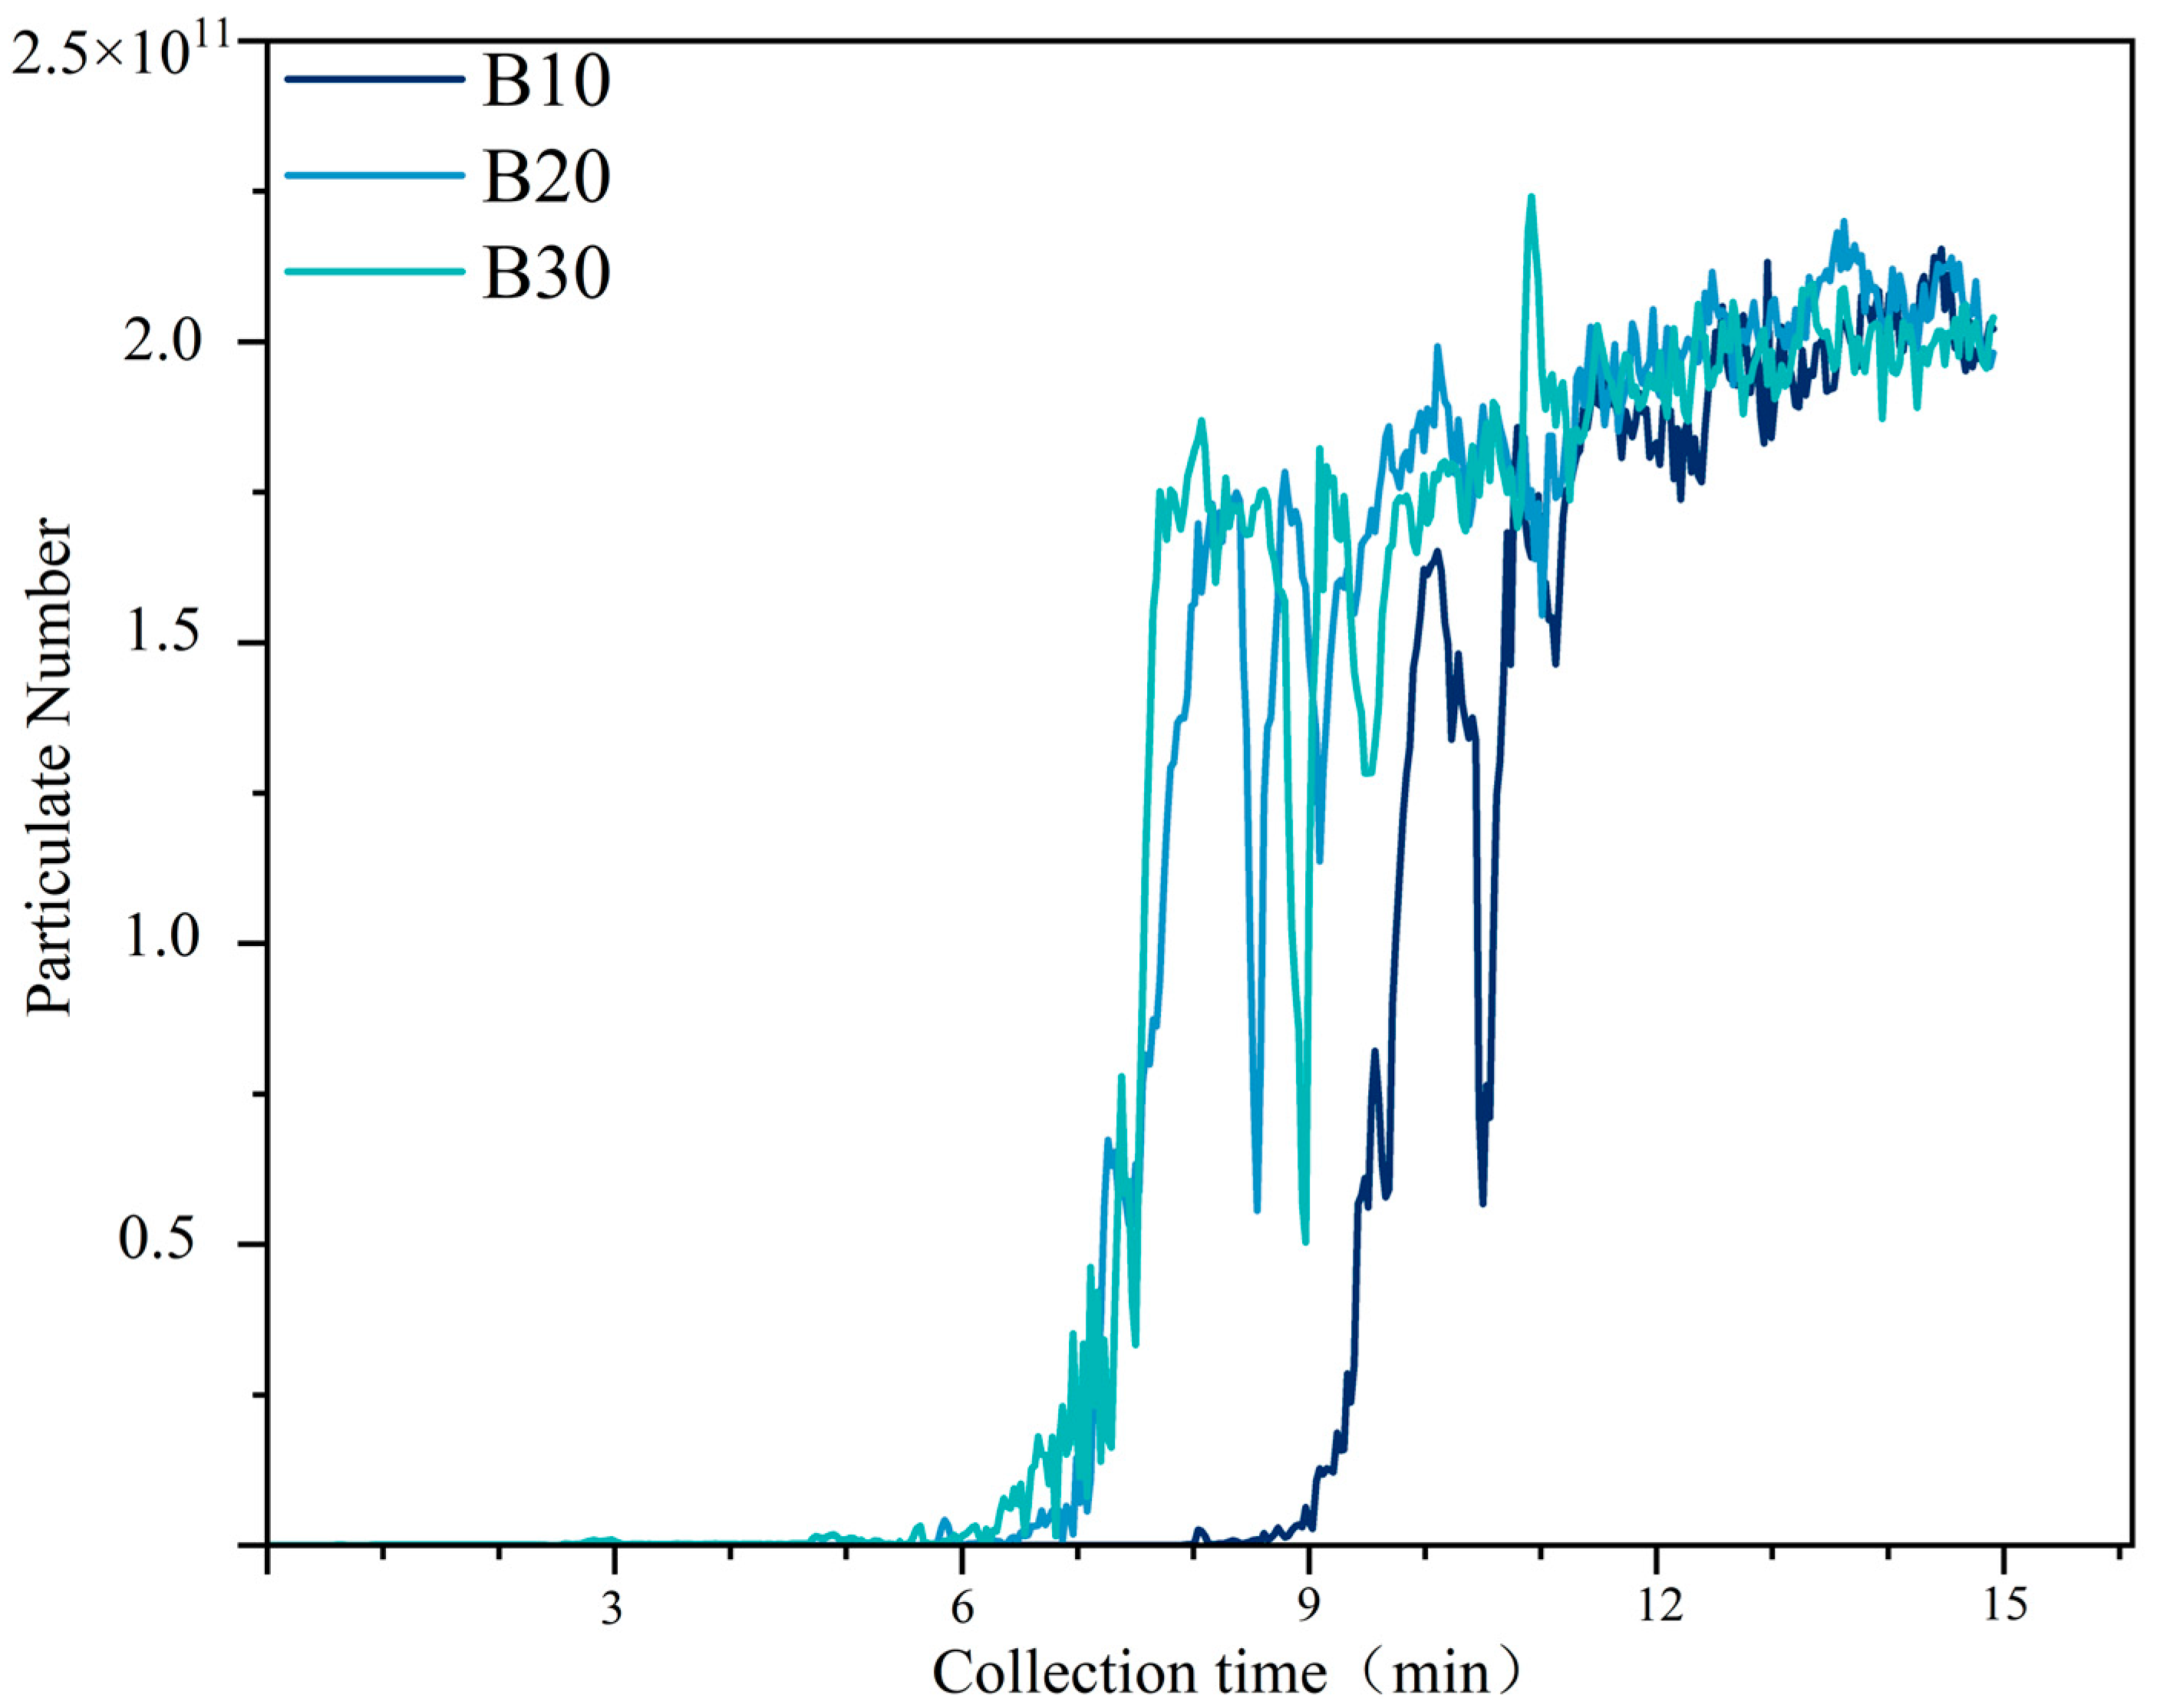
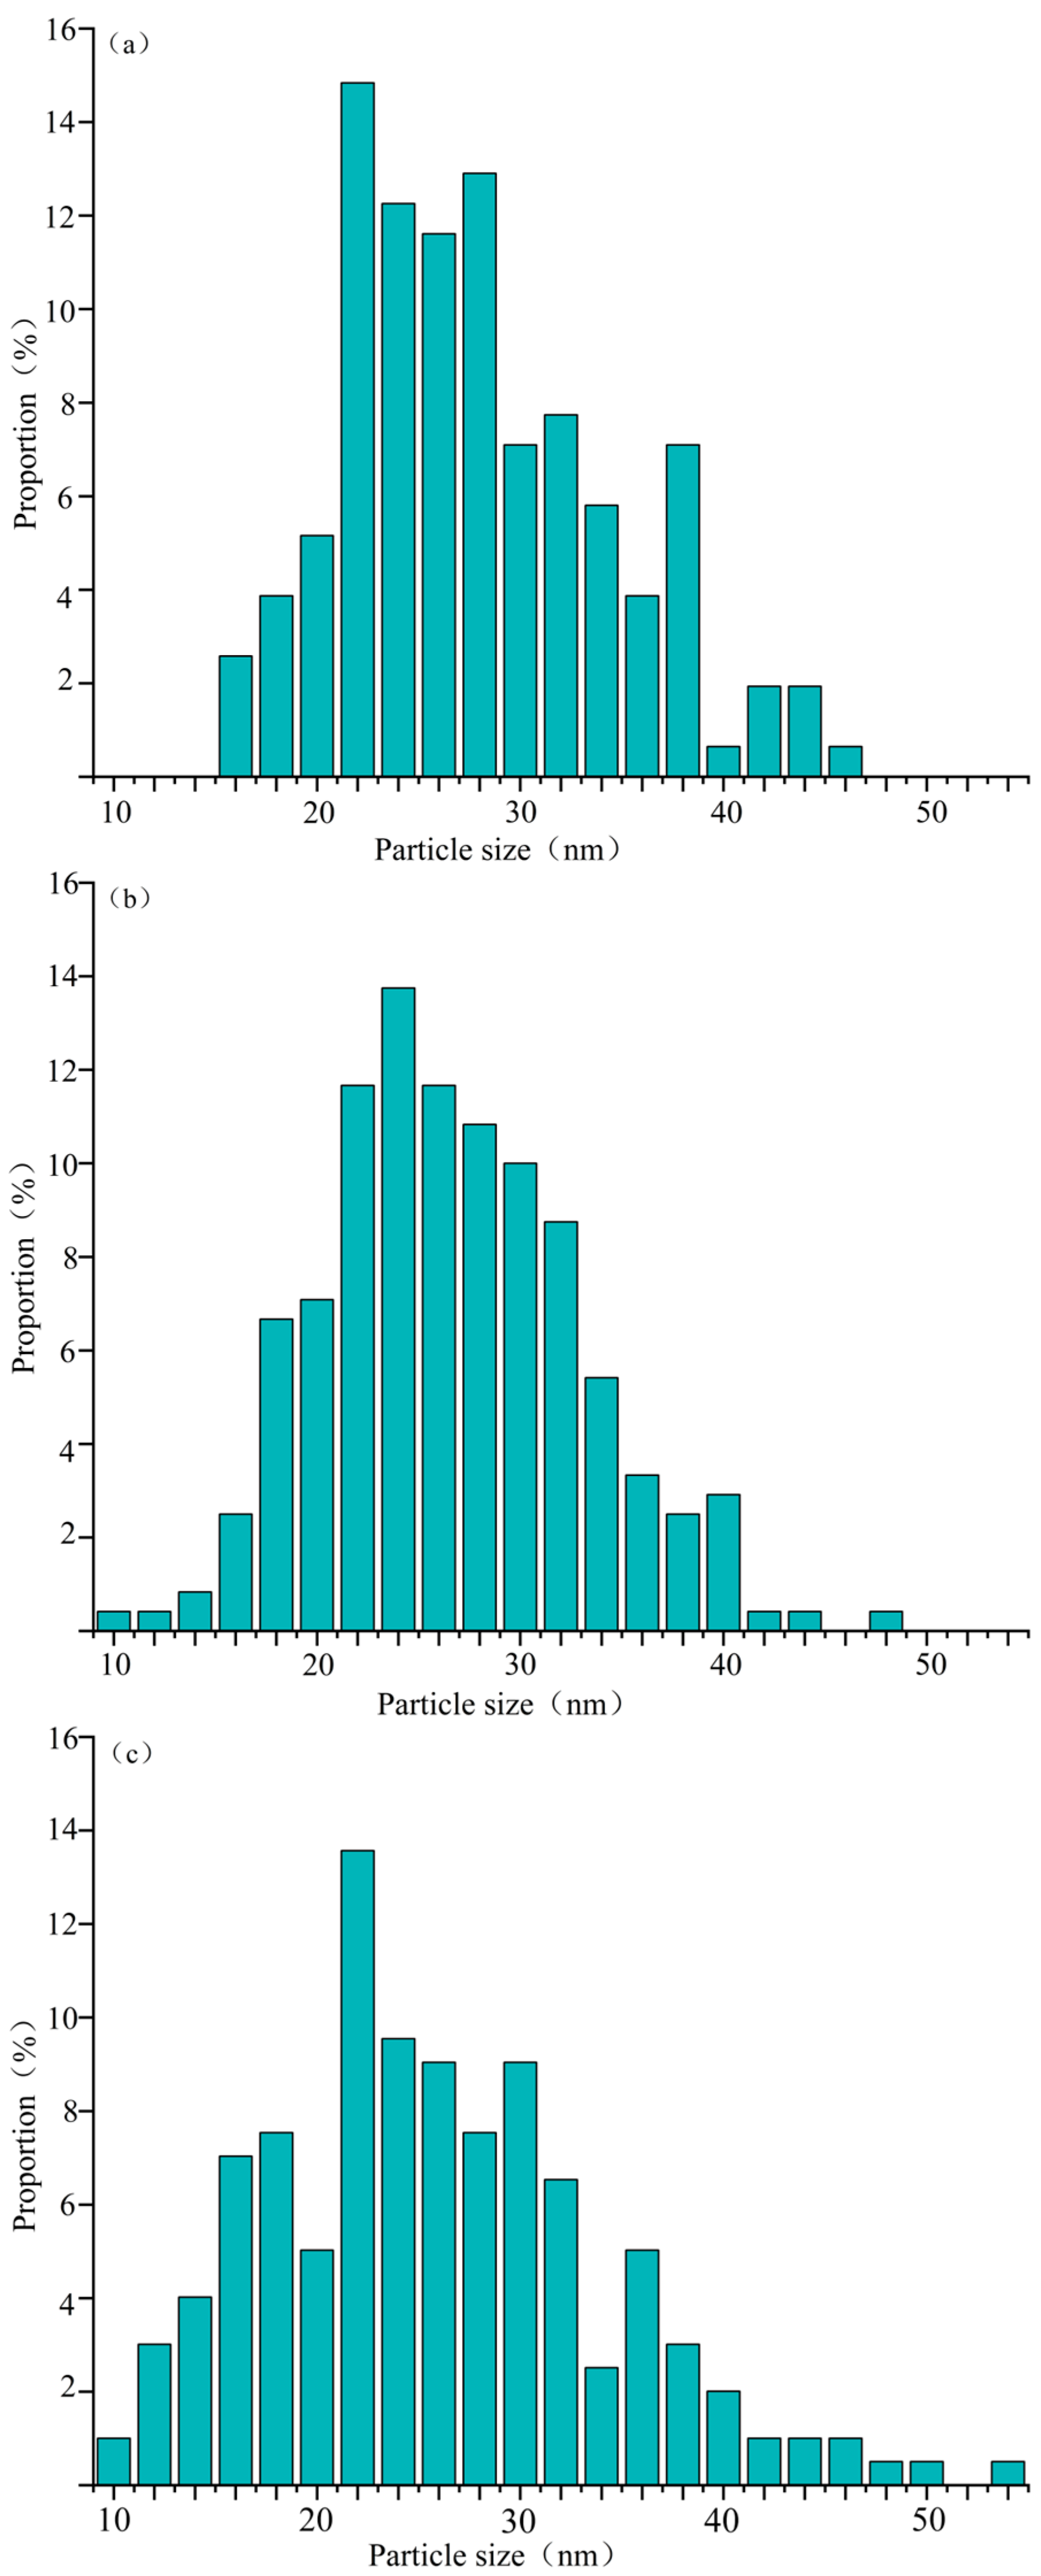
3.1. Primary Emissions of Particulate Matter

Figure 2 shows the emission factors of BC, POA, and two scenarios of wall loss for the three biodiesel blends measured in this study. Table 4 summarizes the emission factors of BC and POA, as well as the production factors of SOA during the experiments. In this study, EFBC ranged from 0.31 to 0.58 g kg−1 fuel, showing a decreasing trend with the increase in biodiesel proportion, but this is based on limited experiments. These values are comparable to the BC emission factor of 0.15 to 0.51 g kg−1 fuel for three Chinese diesel vehicles under idle conditions [22] and to the range of 0.466 to 0.763 g kg−1 fuel found in smog chamber studies on idle diesel vehicles [26]. Additionally, the EFBC values fall within the range of black carbon emission factors measured by PEMS for European on-road diesel vehicles, which range from 0.18 to 0.91 g kg−1 fuel [41]. The EFPOA of 0.99 to 1.06 g kg−1 fuel is comparable to the upper limit of Deng’s 0.18 to 0.98 values but lower than traditional diesel vehicles at the lower limit. This may be due to the higher oxygen content in biodiesel, which could hinder complete combustion during the start-up phase, resulting in lower emissions compared to traditional diesel engines [42]. During this phase, the low air–fuel ratio leads to the formation of soot in the core of the atomized diesel fuel [43]. Organic compounds released from diesel and lubricating oil may adsorb onto soot particles, forming aerosols [44] and thereby promoting POA formation.
In this study, the measured POA concentration ranged from 10.5 to 26 µg/m3, which is only 30% of the POA concentration observed in Deng’s [22] study on fossil diesel vehicles under idle conditions. High POA concentrations can promote the gas-particle partitioning of organic water vapor [45,46]. If we concentrate the exhaust gas to achieve OA concentrations similar to those in Deng’s [22] study, we can estimate that the EFPOA of engine exhaust when using B10, B20, and B30 biodiesel would be 2.97, 3.18, and 3.15 g kg−1 fuel, respectively. In comparison to Deng’s study, these values are still much higher than those for fossil diesel. If the OA concentration in this study were made similar to that in Chirico’s [26] study through dilution, the estimated EFPOA of engine exhaust for B10, B20, and B30 biodiesel would be 1.98, 2.12, and 2.1 g kg−1 fuel, respectively. These values are still higher than those reported by Chirico. Therefore, whether the concentration is increased to match Deng’s OA concentration or diluted to match Chirico’s, the EFPOA emissions from biodiesel in this study are much higher than those in previous studies. Thus, the difference in concentration is not the main reason for the higher total EFPOA observed in this study compared to previous research.
Figure 3 illustrates the temporal evolution of particle number concentrations for three biodiesel blends. The stabilization times for B20 and B30 biodiesel blends, approximately seven minutes, reflect their relatively rapid emission equilibration compared to B10, which lags behind by about four minutes. This delay in stabilization for B10 may be attributed to differences in combustion characteristics or fuel composition, such as a lower oxygen content, which influences the rate of volatile compound condensation and subsequent particle formation. Notably, all three biodiesel blends reach a peak particle number concentration of approximately 2.0 × 10¹¹ at 15 min, demonstrating consistency in maximum particle formation despite variations in stabilization times. This peak represents the culmination of nucleation and accumulation processes driven by the thermal and chemical environment within the combustion chamber. The eventual convergence of particle number concentrations across all biodiesel blends highlights the influence of shared combustion conditions, such as temperature and residence time, in determining the upper limit of particle emissions. The differences in stabilization times and their potential links to biodiesel composition warrant further investigation. For instance, the higher oxygen content in B20 and B30 blends may enhance the oxidation of intermediate compounds, promoting faster stabilization. Additionally, the fuel’s viscosity and volatility could play roles in influencing the atomization process and subsequent particle dynamics.
The size and number distributions of particles, as illustrated in Figure 4a–c, provide detailed insights into the particle formation characteristics of different biodiesel blends. The size and number distribution of the particles are shown in Figure 4a–c. The peak for the nucleation mode particles of B10 appears at around 23 nm, for B20 at 23 nm, and for B30 also at 23 nm. This observation aligns with findings from Rönkkö et al., which emphasized the dominance of nucleation mode particles in biodiesel combustion [47]. However, the results contrast with Deng’s study [22], where pure diesel exhibited particle peaks in the broader range of 20–30 nm.
The predominance of nucleation mode particles in this study can be linked to the condensation of volatile compounds on non-volatile particle cores, as suggested by Rönkkö [48]. The size of these core particles tends to increase with rising fuel sulfur content (FSC). This highlights the critical role of fuel composition in particle formation dynamics. Specifically, gaseous sulfuric acid (GSA) in the exhaust has been identified as a key promoter of nucleation particle formation. However, GSA concentrations in the exhaust decrease as the FSC is reduced, a direct consequence of using biodiesel, which inherently contains lower sulfur levels than conventional diesel [49].
The reduction in sulfur content associated with biodiesel fuels emerges as a significant factor in diminishing particle emissions. This observation aligns with findings from other studies that link lower sulfur levels to a decrease in nucleation mode particle formation. Furthermore, biodiesel’s cleaner combustion characteristics and reduced soot production contribute to this trend, positioning it as a promising alternative for reducing PM emissions.

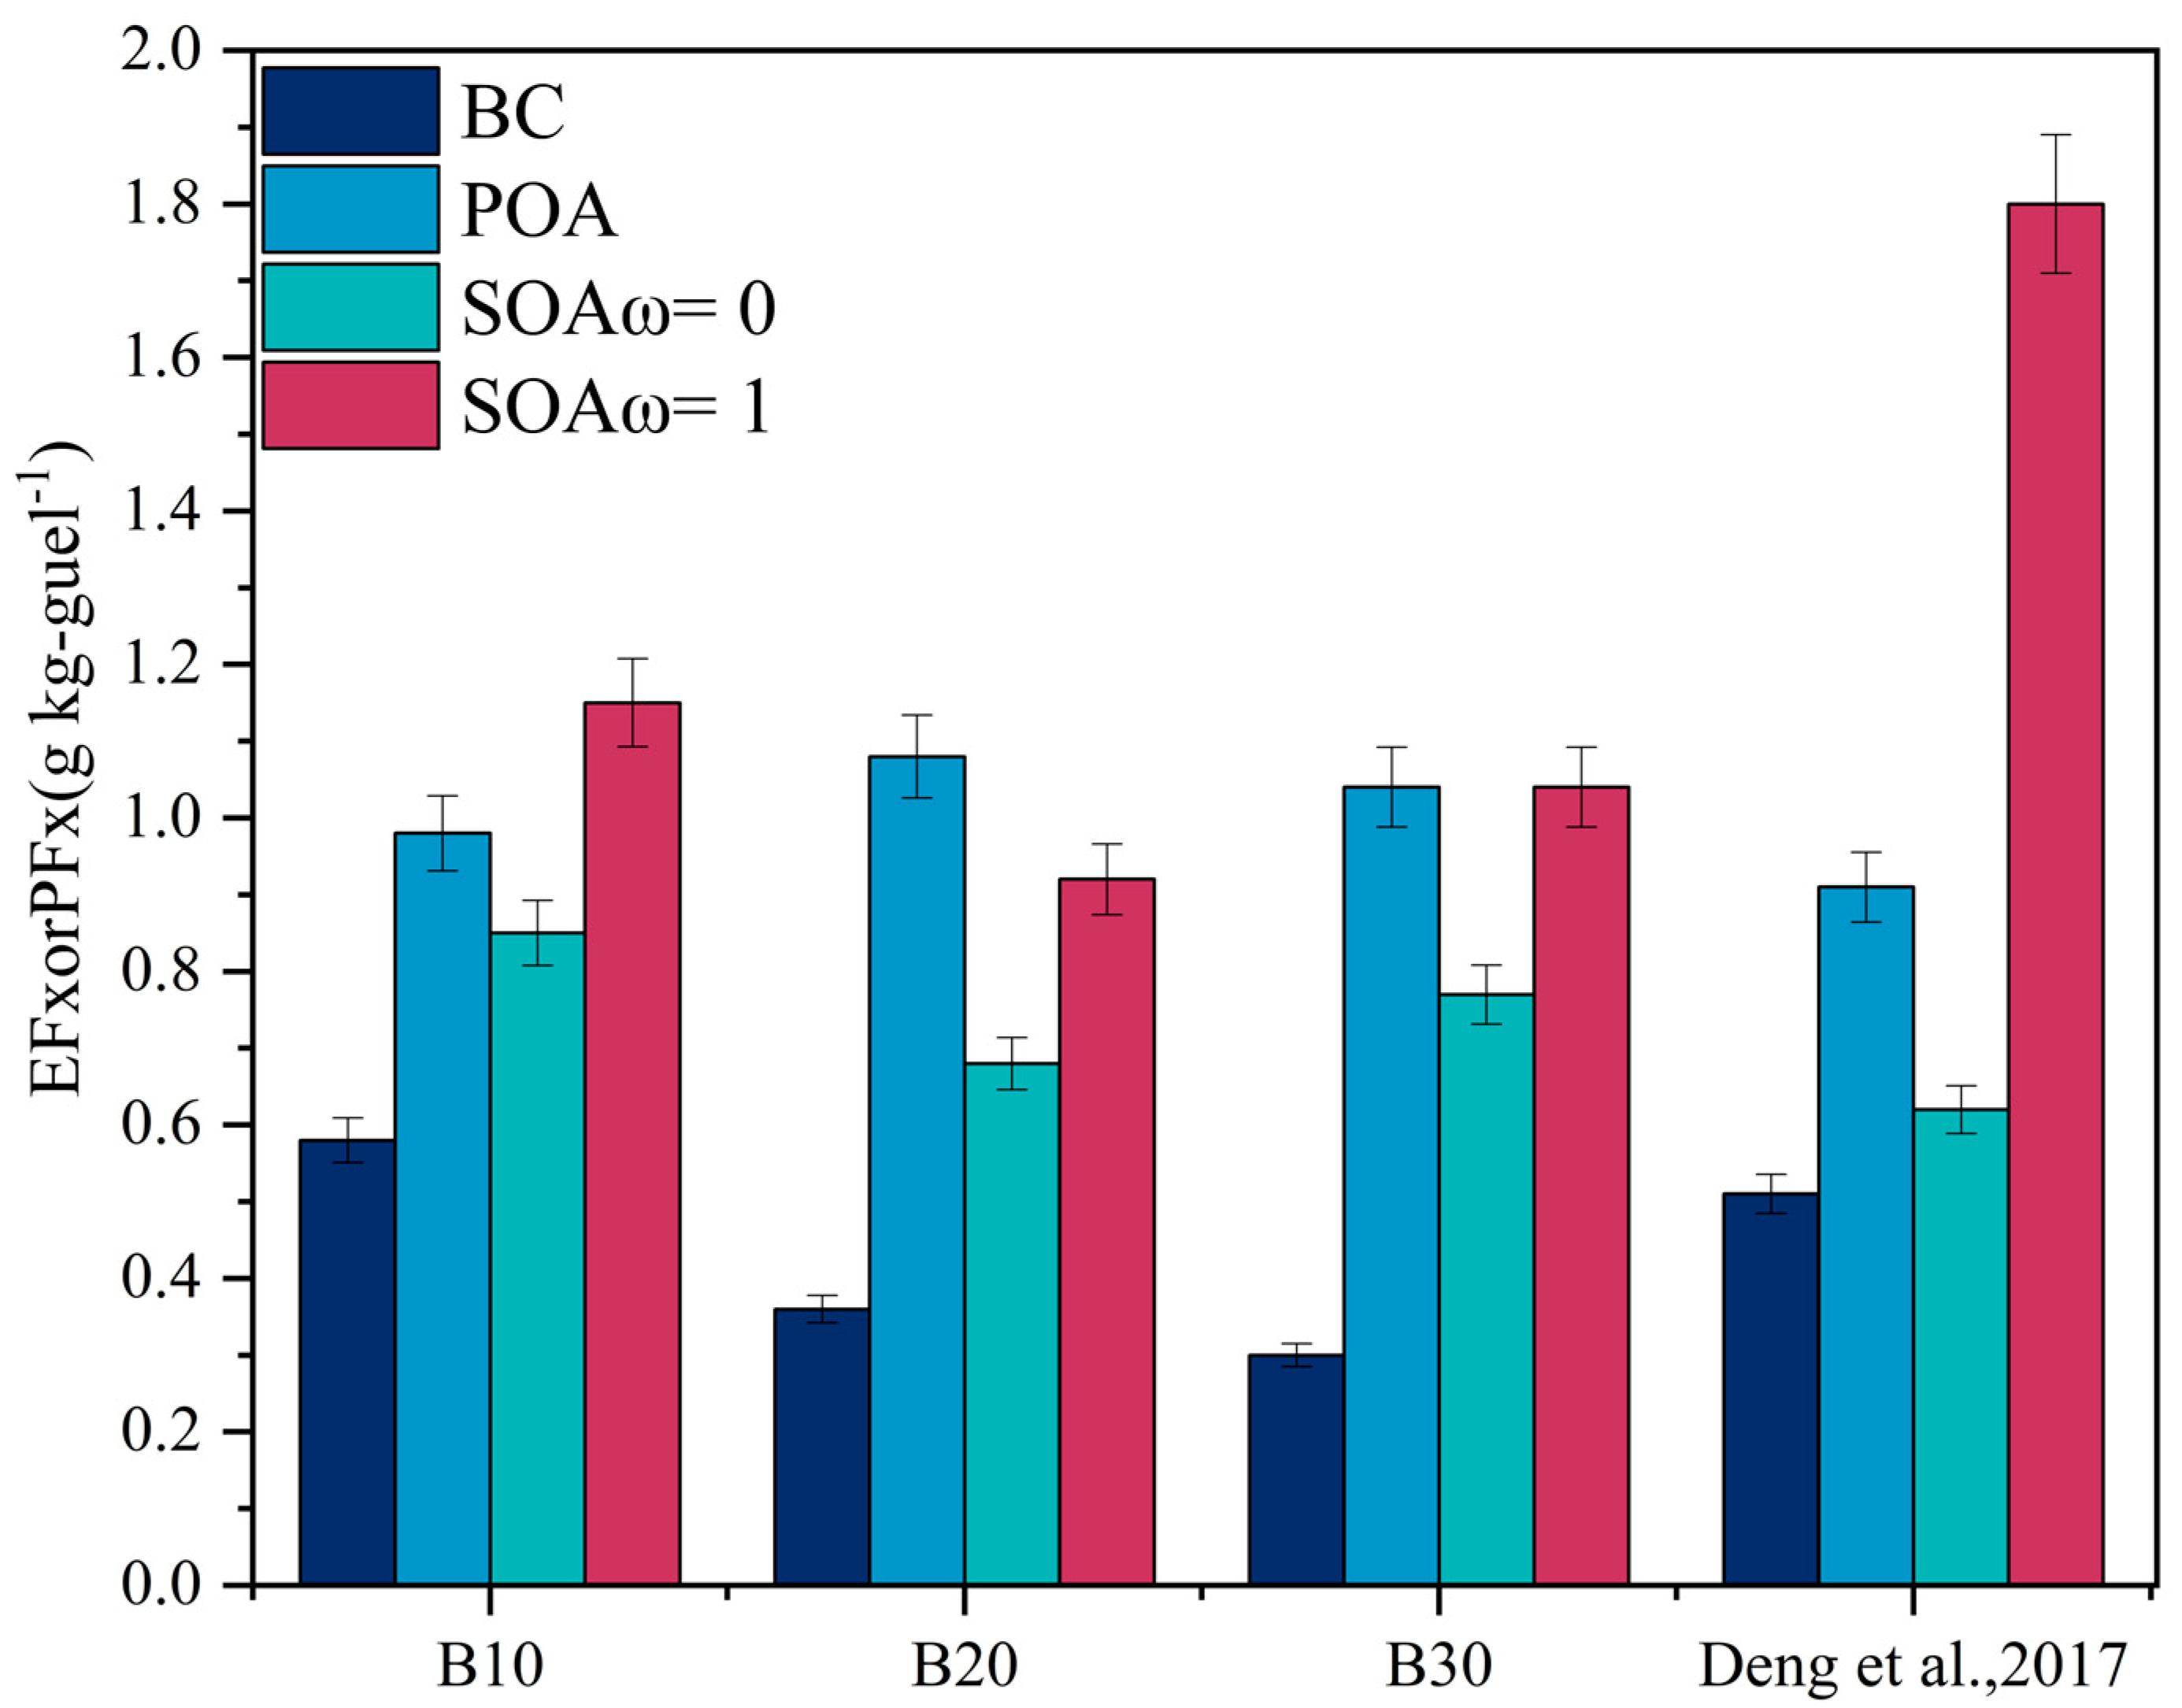
3.2. SOA Formation from Biodiesel Exhaust

In the photochemical oxidation experiments in the smog chamber, a significant amount of SOA was formed after four hours of light oxidation. As shown in Figure 5d, the SOA production factors for the three biodiesel blends under idle conditions ranged from 0.92 to 1.15 g kg−1 fuel (ω = 1). This is a 38% reduction compared to the maximum value of 0.5 to 1.8 g kg−1 fuel reported by Deng for idle diesel vehicles. However, it is approximately twice as high as the values reported by Chirico [26] (0.461 g kg−1 fuel) and Gordon [2] (0.401 g kg−1 fuel). According to Ou [50], the total diesel consumed in road transport in 2007 was 38.53 million tons. Based on the PFSOA average value of 1.15 g kg−1 fuel reported by Deng [22], using B20 biodiesel would reduce SOA emissions by 385.3 million tons. In this study, the POA/SOA ratio for biodiesel exhaust ranged from 1.35 to 2.37, which is similar to the 2.2 value reported by Deng [22] for idle diesel vehicles but significantly lower than the ratio of approximately 10 reported by Gordon for heavy-duty diesel vehicles under “low speed + idling” conditions in the U.S. compared to the values reported in [51], where the highest EFPOA and PFSOA for gasoline engine exhaust were 0.0004 g kg−1 fuel and 0.044 g kg−1 fuel, respectively; biodiesel still results in one to three orders of magnitude higher emissions compared to gasoline.
The experimental conditions set in this study are similar to those in the studies of Chirico and Gordon, but the SOA yield is relatively low. This phenomenon may be related to differences in fuel properties, particularly the higher oxygen content in biodiesel. During combustion, biodiesel has a higher oxidizing ability compared to traditional diesel, meaning it requires more oxygen to achieve complete combustion. However, during the idle stage, the engine operates under low temperature and low load conditions, and the combustion process is usually incomplete, leading to insufficient oxygen supply and incomplete combustion [52]. This incomplete combustion state may cause POA with high oxygen content to be more easily oxidized into SOA after emission. However, due to the inadequate combustion process, this oxidation might not be as complete as under high-load and high-temperature conditions. Additionally, the higher oxygen content in biodiesel may prevent some organic compounds from fully decomposing during combustion, thus reducing SOA formation. Because of the high oxygen content, some organic compounds are partially oxidized during combustion, which reduces their potential to form SOA once released into the atmosphere. Therefore, although the combustion characteristics of biodiesel help reduce certain emissions, the combination of incomplete combustion and insufficient oxygen supply during idle operation may lead to relatively low SOA yields, while the oxidation process of POA does not significantly enhance SOA formation.
This finding suggests that the chemical properties of fuels (such as oxygen content, volatility, etc.) play a significant role in the formation of emissions under different engine operating conditions. During idle operation, despite the higher oxygen content in biodiesel reducing SOA formation to some extent, higher POA emissions may still occur due to incomplete combustion and insufficient oxygen supply. Therefore, optimizing the combustion process of the engine or further adjusting the fuel composition is necessary to improve combustion efficiency and reduce pollutant emissions.
In the three biodiesel blends with different proportions, the PFSOA for B20 decreased by 20% compared to B10 and B30. However, in terms of EFPOA, an opposite trend was observed, with B20 showing a slight increase compared to B10 and B30. This indicates that although B20 reduced PFSOA, it exhibited a different trend in the emission factor for primary organic aerosols compared to other biodiesel proportions. This phenomenon may be related to the chemical composition of biodiesel, its combustion characteristics, and the influence of different blend ratios on emissions. Firstly, biodiesel has a higher oxygen content, which, especially in B20, may improve combustion efficiency to some extent, reducing PFSOA formation. However, in the case of EFPOA, the emission factor for B20 slightly increased, possibly due to a higher amount of organic gaseous components produced during combustion at this blend ratio, leading to higher primary organic aerosol emissions. Although the high oxygen content in biodiesel helps reduce the formation of some harmful substances, the effects of low temperature or incomplete combustion may still lead to some organic compounds remaining unoxidized, thus increasing the EFPOA. Additionally, the differences between B10 and B30 may be closely related to how the biodiesel content in the blend influences the combustion process. In B10, the biodiesel content is lower, and combustion characteristics are closer to those of traditional diesel, possibly leading to higher PFSOA formation. In B30, the increased biodiesel proportion may make the combustion process more complete, resulting in lower primary organic aerosol emissions. However, the trends in PFSOA and EFPOA are not entirely consistent, which may be due to the complex interactions between combustion efficiency and fuel properties.
Since the experiments only used three biodiesel ratios, further investigation is needed to explore the relationship between biodiesel content and EFPOA. Future research could involve setting up more biodiesel blends with varying proportions to analyze the impact of oxygen content, biodiesel ratio, and combustion conditions on primary organic aerosol emission factors. Moreover, integrating engine tuning and combustion optimization measures could help explore how to minimize POA emissions during idle or low-load conditions, while ensuring combustion efficiency and performance, thus providing theoretical support for the widespread use of biodiesel.

4. Conclusions

This study focused on three commonly used biodiesel blends, examining their particulate emissions under idle conditions and investigating SOA formation using a quartz-built smog chamber.
(1) The EFBC for the three biodiesel blends were 0.58, 0.36, and 0.31 g kg−1 fuel, showing a decreasing trend with the increase in the biodiesel proportion. This indicates that as the proportion of biodiesel increases, its contribution to pollutant emissions during combustion decreases. This change may be related to the chemical composition of biodiesel and its combustion characteristics. Compared to conventional diesel, biodiesel typically contains lower levels of sulfur and aromatic hydrocarbons, which helps reduce harmful emissions such as carbon monoxide, nitrogen oxides, and particulate matter. Additionally, the stronger oxidation properties of biodiesel contribute to more complete combustion during the combustion process, further reducing emissions.
(2) For the B10 biodiesel blend, the EFPOA and PFSOA were 0.99 g kg−1 fuel and 1.15 g kg−1 fuel, respectively. For the B20 blend, the EFPOA and PFSOA were 1.06 g kg−1 fuel and 0.92 g kg−1 fuel, respectively. For the B30 blend, the EFPOA and PFSOA were 1.05 g kg−1 fuel and 1.04 g kg−1 fuel, respectively. These values are similar to the EFPOA reported for idle diesel vehicles while showing a 38% reduction in PFSOA at the maximum value. Furthermore, the POA/SOA ratio observed in the smog chamber experiments was comparable to that reported for diesel vehicles. However, the EFPOA and PFSOA values remain one to three orders of magnitude higher than those typically observed for gasoline vehicles.
(3) Biodiesel does not reduce the generation of primary emissions such as BC and POA during idle conditions, but it can effectively reduce the formation of SOA. This result is likely closely related to the combustion characteristics and chemical composition of biodiesel. During idle conditions, the engine typically operates at low temperatures and low loads, which leads to incomplete combustion of the fuel, resulting in higher primary pollutant emissions such as BC and POA. Biodiesel contains a higher oxygen content, which helps improve the combustion process. However, under the low-temperature and low-pressure conditions of idle operation, the advantages of biodiesel may not be fully realized, and as a result, BC and POA emissions may not be effectively reduced.
However, biodiesel can effectively reduce SOA formation, mainly because biodiesel has lower volatility, meaning fewer organic gaseous components produced during combustion enter the atmosphere. These organic gasses may transform into SOA under certain meteorological conditions and atmospheric chemical reactions. The lower volatility of biodiesel and its reduced aromatic hydrocarbon content decrease SOA formation, thereby contributing to reductions in SOA. This phenomenon highlights the differential impact of biodiesel on different types of emissions under various engine operating conditions. In practical applications, although biodiesel is effective in controlling SOA, its ability to suppress BC and POA emissions is limited during idle conditions. Therefore, when optimizing the use of biodiesel and engine calibration, comprehensive control of various emissions needs to be considered, particularly under low-load or idle conditions. It is worth noting that current studies on SOA formation from biodiesel under idle conditions are limited, and further research is needed to explore the formation of POA and SOA under real road conditions.
It is important to note that current research on SOA formation from biodiesel has been conducted under idle conditions. Further investigation is required to better understand the formation of POA and SOA under actual driving conditions.

Author Contributions

Conceptualization, D.X.; methodology, D.X.; software, D.X.; validation, H.Y.; formal analysis, D.X.; investigation, W.C.; resources, J.L.; data curation, D.X.; writing—original draft preparation, D.X.; writing—review and editing, J.X.; visualization, D.X.; supervision, J.L.; project administration, J.L.; funding acquisition, J.L. All authors have read and agreed to the published version of the manuscript.

Funding

This research was funded by the Agricultural Joint Special Program of the Yunnan Provincial Department of Science and Technology, grant number 202301BD070001-077, the National Natural Science Foundation of China, grant number 51968065, and the Yunnan Provincial High-Level Talent Project, grant numbers YNWR-QNBJ-2018-066 and YNQR-CYRC-2019-001.

Institutional Review Board Statement

Not applicable.

Informed Consent Statement

Not applicable.

Data Availability Statement

The original contributions presented in the study are included in the article, further inquiries can be directed to the corresponding author.

Acknowledgments

This research was financially supported by the National Natural Science Foundation of China (Project No.: 51968065). The authors would like to acknowledge the equipment support provided by the Key Laboratory of Environmental Protection and Safety for Motor Vehicles in Plateau and Mountainous Regions of Yunnan Province.

Conflicts of Interest

The authors declare no conflicts of interest.

References

  1. Reff, A.; Bhave, P.V.; Simon, H.; Pace, T.G.; Pouliot, G.A.; Mobley, J.D.; Houyoux, M. Emissions Inventory of PM2.5 Trace Elements across the United States. Environ. Sci. Technol. 2009, 43, 5790–5796. [Google Scholar] [CrossRef] [PubMed]
  2. Gordon, T.D.; Presto, A.A.; May, A.A.; Nguyen, N.T.; Lipsky, E.M.; Donahue, N.M.; Gutierrez, A.; Zhang, M.; Maddox, C.; Rieger, P.; et al. Secondary Organic Aerosol Formation Exceeds Primary Particulate Matter Emissions for Light-Duty Gasoline Vehicles. Atmos. Chem. Phys. 2014, 14, 4661–4678. [Google Scholar] [CrossRef]
  3. Gentner, D.R.; Jathar, S.H.; Gordon, T.D.; Bahreini, R.; Day, D.A.; El Haddad, I.; Hayes, P.L.; Pieber, S.M.; Platt, S.M.; de Gouw, J.; et al. Review of Urban Secondary Organic Aerosol Formation from Gasoline and Diesel Motor Vehicle Emissions. Environ. Sci. Technol. 2017, 51, 1074–1093. [Google Scholar] [CrossRef] [PubMed]
  4. Yang, J.; Lei, G.; Liu, C.; Wu, Y.; Hu, K.; Zhu, J.; Bao, J.; Lin, W.; Jin, J. Characteristics of Particulate-Bound n-Alkanes Indicating Sources of PM2.5 in Beijing, China. Atmos. Chem. Phys. 2023, 23, 3015–3029. [Google Scholar] [CrossRef]
  5. Lv, B.; Liu, Y.; Yu, P.; Zhang, B.; Bai, Y. Characterizations of PM2.5 Pollution Pathways and Sources Analysis in Four Large Cities in China. Aerosol Air Qual. Res. 2015, 15, 1836–1843. [Google Scholar] [CrossRef]
  6. Zhu, S.; Zhou, M.; Qiao, L.; Huang, D.D.; Wang, Q.; Wang, S.; Gao, Y.; Jing, S.; Wang, Q.; Wang, H.; et al. Evolution and Chemical Characteristics of Organic Aerosols during Wintertime PM2.5 Episodes in Shanghai, China: Insights Gained from Online Measurements of Organic Molecular Markers. Atmos. Chem. Phys. 2023, 23, 7551–7568. [Google Scholar] [CrossRef]
  7. Al-Rawi, Y.A.; Imlus, M.H.; Yusup, Y.; Yahya, S.B. Factors Affecting Vehicle Exhaust Emissions, Driver Motivations as a Mediator. Environ. Econ. Policy Stud. 2021, 23, 361–407. [Google Scholar] [CrossRef]
  8. Qiu, Z.; Li, X.; Hao, Y.; Deng, S. Potential of Diesel Emissions Reduction Strategies in Xi’an, China. Clean Technol. Environ. Policy 2016, 18, 2717–2724. [Google Scholar] [CrossRef]
  9. Chacon-Madrid, H.J.; Murphy, B.N.; Pandis, S.N.; Donahue, N.M. Simulations of Smog-Chamber Experiments Using the Two-Dimensional Volatility Basis Set: Linear Oxygenated Precursors. Environ. Sci. Technol. 2012, 46, 11179–11186. [Google Scholar] [CrossRef]
  10. Lelieveld, J.; Evans, J.S.; Fnais, M.; Giannadaki, D.; Pozzer, A. The Contribution of Outdoor Air Pollution Sources to Premature Mortality on a Global Scale. Nature 2015, 525, 367–371. [Google Scholar] [CrossRef] [PubMed]
  11. Brook, R.D.; Rajagopalan, S.; Pope, C.A.; Brook, J.R.; Bhatnagar, A.; Diez-Roux, A.V.; Holguin, F.; Hong, Y.; Luepker, R.V.; Mittleman, M.A.; et al. Particulate Matter Air Pollution and Cardiovascular Disease. Circulation 2010, 121, 2331–2378. [Google Scholar] [CrossRef] [PubMed]
  12. Wu, G.; Ge, J.C.; Choi, N.J. A Comprehensive Review of the Application Characteristics of Biodiesel Blends in Diesel Engines. Appl. Sci. 2020, 10, 8015. [Google Scholar] [CrossRef]
  13. Živković, S.; Veljković, M. Environmental Impacts the of Production and Use of Biodiesel. Environ. Sci. Pollut. Res. 2018, 25, 191–199. [Google Scholar] [CrossRef] [PubMed]
  14. Huang, X.-F.; Yu, J.Z.; He, L.-Y.; Hu, M. Size Distribution Characteristics of Elemental Carbon Emitted from Chinese Vehicles:  Results of a Tunnel Study and Atmospheric Implications. Environ. Sci. Technol. 2006, 40, 5355–5360. [Google Scholar] [CrossRef]
  15. Zhang, Y.; Wang, X.; Wen, S.; Herrmann, H.; Yang, W.; Huang, X.; Zhang, Z.; Huang, Z.; He, Q.; George, C. On-Road Vehicle Emissions of Glyoxal and Methylglyoxal from Tunnel Tests in Urban Guangzhou, China. Atmos. Environ. 2016, 127, 55–60. [Google Scholar] [CrossRef]
  16. Yao, Z.; Shen, X.; Ye, Y.; Cao, X.; Jiang, X.; Zhang, Y.; He, K. On-Road Emission Characteristics of VOCs from Diesel Trucks in Beijing, China. Atmos. Environ. 2015, 103, 87–93. [Google Scholar] [CrossRef]
  17. Wu, B.; Shen, X.; Cao, X.; Zhang, W.; Wu, H.; Yao, Z. Carbonaceous Composition of PM2.5 Emitted from on-Road China III Diesel Trucks in Beijing, China. Atmos. Environ. 2015, 116, 216–224. [Google Scholar] [CrossRef]
  18. Zhang, Y.; Wang, X.; Li, G.; Yang, W.; Huang, Z.; Zhang, Z.; Huang, X.; Deng, W.; Liu, T.; Huang, Z.; et al. Emission Factors of Fine Particles, Carbonaceous Aerosols and Traces Gases from Road Vehicles: Recent Tests in an Urban Tunnel in the Pearl River Delta, China. Atmos. Environ. 2015, 122, 876–884. [Google Scholar] [CrossRef]
  19. Cai, W.; Liu, X.; Chen, Y.; Yang, T.; Qiao, M. The Study on Emission Characteristics of Biodiesel Fuels in Agricultural Tractors. Trans. Chin. Soc. Agric. Eng. 2021, 40, 20. [Google Scholar] [CrossRef]
  20. Veeraraghavan, S.M.; Kaliyaperumal, G.; Dillikannan, D.; Poures, M.V.D. Influence of Hydrogen Induction on Performance and Emission Characteristics of an Agricultural Diesel Engine Fuelled with Cultured Scenedesmus Obliquus from Industrial Waste. Process Saf. Environ. Prot. 2024, 187, 1576–1585. [Google Scholar] [CrossRef]
  21. Weitkamp, E.A.; Sage, A.M.; Pierce, J.R.; Donahue, N.M.; Robinson, A.L. Organic Aerosol Formation from Photochemical Oxidation of Diesel Exhaust in a Smog Chamber. Environ. Sci. Technol. 2007, 41, 6969–6975. [Google Scholar] [CrossRef] [PubMed]
  22. Deng, W.; Hu, Q.; Liu, T.; Wang, X.; Zhang, Y.; Song, W.; Sun, Y.; Bi, X.; Yu, J.; Yang, W.; et al. Primary Particulate Emissions and Secondary Organic Aerosol (SOA) Formation from Idling Diesel Vehicle Exhaust in China. Sci. Total Environ. 2017, 593–594, 462–469. [Google Scholar] [CrossRef] [PubMed]
  23. Deng, W.; Fang, Z.; Wang, Z.; Zhu, M.; Zhang, Y.; Tang, M.; Song, W.; Lowther, S.; Huang, Z.; Jones, K.; et al. Primary Emissions and Secondary Organic Aerosol Formation from In-Use Diesel Vehicle Exhaust: Comparison between Idling and Cruise Mode. Sci. Total Environ. 2020, 699, 134357. [Google Scholar] [CrossRef] [PubMed]
  24. Dunmore, R.E.; Hopkins, J.R.; Lidster, R.T.; Lee, J.D.; Evans, M.J.; Rickard, A.R.; Lewis, A.C.; Hamilton, J.F. Diesel-Related Hydrocarbons Can Dominate Gas Phase Reactive Carbon in Megacities. Atmos. Chem. Phys. 2015, 15, 9983–9996. [Google Scholar] [CrossRef]
  25. Robinson, A.L.; Donahue, N.M.; Shrivastava, M.K.; Weitkamp, E.A.; Sage, A.M.; Grieshop, A.P.; Lane, T.E.; Pierce, J.R.; Pandis, S.N. Rethinking Organic Aerosols: Semivolatile Emissions and Photochemical Aging. Science 2007, 315, 1259–1262. [Google Scholar] [CrossRef]
  26. Chirico, R.; DeCarlo, P.F.; Heringa, M.F.; Tritscher, T.; Richter, R.; Prévôt, A.S.H.; Dommen, J.; Weingartner, E.; Wehrle, G.; Gysel, M.; et al. Impact of Aftertreatment Devices on Primary Emissions and Secondary Organic Aerosol Formation Potential from In-Use Diesel Vehicles: Results from Smog Chamber Experiments. Atmos. Chem. Phys. 2010, 10, 11545–11563. [Google Scholar] [CrossRef]
  27. GB/T 20828-2014; Biodiesel (BD100) for diesel engine fuel blending. Standardization Administration of China: Beijing, China, 2014.
  28. Demirbas, A. Progress and Recent Trends in Biodiesel Fuels. Energy Convers. Manag. 2009, 50, 14–34. [Google Scholar] [CrossRef]
  29. GB 19147-2016; Automotive diesel. Standardization Administration of China: Beijing, China, 2016.
  30. Xu, D.; Yu, H.; Yu, H.; Xu, J.; Wang, Z.; Li, J. Design and Characterization of a New Quartz Smog Chamber System for Studying the Atmospheric Effects of Vehicle Emissions on Plateaus. Atmos. Pollut. Res. 2024, 16, 102361. [Google Scholar] [CrossRef]
  31. Liu, Y.; Li, J.; Ma, Y.; Zhou, M.; Tan, Z.; Zeng, L.; Lu, K.; Zhang, Y. A Review of Gas-Phase Chemical Mechanisms Commonly Used in Atmospheric Chemistry Modelling. J. Environ. Sci. 2023, 123, 522–534. [Google Scholar] [CrossRef]
  32. Presto, A.A.; Gordon, T.D.; Robinson, A.L. Primary to Secondary Organic Aerosol: Evolution of Organic Emissions from Mobile Combustion Sources. Atmos. Chem. Phys. 2014, 14, 5015–5036. [Google Scholar] [CrossRef]
  33. Guo, H.; Ling, Z.H.; Cheung, K.; Jiang, F.; Wang, D.W.; Simpson, I.J.; Barletta, B.; Meinardi, S.; Wang, T.J.; Wang, X.M.; et al. Characterization of Photochemical Pollution at Different Elevations in Mountainous Areas in Hong Kong. Atmos. Chem. Phys. 2013, 13, 3881–3898. [Google Scholar] [CrossRef]
  34. Odum, J.R.; Hoffmann, T.; Bowman, F.; Collins, D.; Flagan, R.C.; Seinfeld, J.H. Gas/Particle Partitioning and Secondary Organic Aerosol Yields. Environ. Sci. Technol. 1996, 30, 2580–2585. [Google Scholar] [CrossRef]
  35. III, D.R.C.; Mader, B.T.; Kalberer, M.; Flagan, R.C.; Seinfeld, J.H. The Effect of Water on Gas–Particle Partitioning of Secondary Organic Aerosol: II. m-Xylene and 1,3,5-Trimethylbenzene Photooxidation Systems. Atmos. Environ. 2001, 35, 6073–6085. [Google Scholar] [CrossRef]
  36. Steinfeld, J.I. Atmospheric Chemistry and Physics: From Air Pollution to Climate Change. Environ. Sci. Policy Sustain. Dev. 1998, 40, 26. [Google Scholar] [CrossRef]
  37. Epping, R.; Koch, M. On-Site Detection of Volatile Organic Compounds (VOCs). Molecules 2023, 28, 1598. [Google Scholar] [CrossRef]
  38. Griffiths, P.R. Recent Applications of Fourier Transform Infrared Spectrometry in Chemical and Environmental Analysis. Appl. Spectrosc. 1977, 31, 497–505. [Google Scholar] [CrossRef]
  39. Väkevä, M.; Hämeri, K.; Puhakka, T.; Nilsson, E.D.; Hohti, H.; Mäkelä, J.M. Effects of Meteorological Processes on Aerosol Particle Size Distribution in an Urban Background Area. J. Geophys. Res. Atmos. 2000, 105, 9807–9821. [Google Scholar] [CrossRef]
  40. Guo, J.; Tsou, C.-H.; Yu, Y.; Wu, C.-S.; Zhang, X.; Chen, Z.; Yang, T.; Ge, F.; Liu, P.; Guzman, M.R.D. Conductivity and Mechanical Properties of Carbon Black-Reinforced Poly(Lactic Acid) (PLA/CB) Composites. Iran. Polym. J. 2021, 30, 1251–1262. [Google Scholar] [CrossRef]
  41. Zheng, X.; Wu, Y.; Jiang, J.; Zhang, S.; Liu, H.; Song, S.; Li, Z.; Fan, X.; Fu, L.; Hao, J. Characteristics of On-Road Diesel Vehicles: Black Carbon Emissions in Chinese Cities Based on Portable Emissions Measurement. Environ. Sci. Technol. 2015, 49, 13492–13500. [Google Scholar] [CrossRef]
  42. Knothe, G. Dependence of Biodiesel Fuel Properties on the Structure of Fatty Acid Alkyl Esters. Fuel Process. Technol. 2005, 86, 1059–1070. [Google Scholar] [CrossRef]
  43. Yanowitz, J.; McCormick, R.L.; Graboski, M.S. In-Use Emissions from Heavy-Duty Diesel Vehicles. Environ. Sci. Technol. 2000, 34, 729–740. [Google Scholar] [CrossRef]
  44. Abdul-Khalek, I.; Kittelson, D.; Brear, F. The Influence of Dilution Conditions on Diesel Exhaust Particle Size Distribution Easurements. SAE Trans. 1999, 108, 563–571. [Google Scholar]
  45. Jeffries, H.; Fox, D.; Kamens, R. Outdoor Smog Chamber Studies: Light Effects Relative to Indoor Chambers. Environ. Sci. Technol. 1976, 10, 1006–1011. [Google Scholar] [CrossRef]
  46. Ye, P.; Ding, X.; Hakala, J.; Hofbauer, V.; Robinson, E.S.; Donahue, N.M. Vapor Wall Loss of Semi-Volatile Organic Compounds in a Teflon Chamber. Aerosol Sci. Technol. 2016, 50, 822–834. [Google Scholar] [CrossRef]
  47. Pirjola, L.; Dittrich, A.; Niemi, J.V.; Saarikoski, S.; Timonen, H.; Kuuluvainen, H.; Järvinen, A.; Kousa, A.; Rönkkö, T.; Hillamo, R. Physical and Chemical Characterization of Real-World Particle Number and Mass Emissions from City Buses in Finland. Environ. Sci. Technol. 2016, 50, 294–304. [Google Scholar] [CrossRef] [PubMed]
  48. Rönkkö, T.; Lähde, T.; Heikkilä, J.; Pirjola, L.; Bauschke, U.; Arnold, F.; Schlager, H.; Rothe, D.; Yli-Ojanperä, J.; Keskinen, J. Effects of Gaseous Sulphuric Acid on Diesel Exhaust Nanoparticle Formation and Characteristics. Environ. Sci. Technol. 2013, 47, 11882–11889. [Google Scholar] [CrossRef]
  49. Arnold, F.; Pirjola, L.; Rönkkö, T.; Reichl, U.; Schlager, H.; Lähde, T.; Heikkilä, J.; Keskinen, J. First Online Measurements of Sulfuric Acid Gas in Modern Heavy-Duty Diesel Engine Exhaust: Implications for Nanoparticle Formation. Environ. Sci. Technol. 2012, 46, 11227–11234. [Google Scholar] [CrossRef]
  50. Ou, X.; Zhang, X.; Chang, S. Scenario Analysis on Alternative Fuel/Vehicle for China’s Future Road Transport: Life-Cycle Energy Demand and GHG Emissions. Energy Policy 2010, 38, 3943–3956. [Google Scholar] [CrossRef]
  51. Liu, T.; Wang, X.; Deng, W.; Hu, Q.; Ding, X.; Zhang, Y.; He, Q.; Zhang, Z.; Lü, S.; Bi, X.; et al. Secondary Organic Aerosol Formation from Photochemical Aging of Light-Duty Gasoline Vehicle Exhausts in a Smog Chamber. Atmos. Chem. Phys. 2015, 15, 9049–9062. [Google Scholar] [CrossRef]
  52. Zhao, F.; Lai, M.-C.; Harrington, D.L. Automotive Spark-Ignited Direct-Injection Gasoline Engines. Prog. Energy Combust. Sci. 1999, 25, 437–562. [Google Scholar] [CrossRef]
Figure 1. Schematic diagram of the experimental process.
Sustainability 17 00976 g001
Figure 2. The emission factors of BC and POA of diesel and gasoline engines at idle speed in this study and previous studies, as well as the production factors of SOA (ω = 0) and SOA (ω = 1). The diesel vehicle used in the study by Deng [22] was a Changan, using 0# diesel and equipped with an aftertreatment device. The SOA emission factor of the gasoline engine comes from the study of Liu, and the average emission factor is shown in this figure.
Sustainability 17 00976 g002
Figure 3. Particle number variation over time before injection into the smog chamber. The stabilization times for B20 and B30 biodiesel blends, approximately seven minutes, B10 lags behind by about four minutes.
Sustainability 17 00976 g003
Figure 4. (ac) show the particle size distribution for B10, B20, and B30, respectively. In the figures, the particle peak in (a,c) is located at 23 nm, while in (b) the particle peak is at 20 nm.
Sustainability 17 00976 g004
Figure 5. Schematic of the evolution of gasses and particles in the biodiesel smog chamber experiment. t = −1 is the start time of the dark reaction (gray area in the figure), and t = 0 is the start time of the light in the experiment (yellow area in the figure). (a) NO concentration change. (b) NO2 concentration change. (c) BC mass concentration change. (d) SOA (ω = 0) and SOA (ω = 1) concentrations during the experiment.
Sustainability 17 00976 g005
Table 1. Diesel engine parameters.
ItemParameter
Engine ModelD19TCI
Engine TypeHigh-Pressure Common Rail Diesel Engine
Inner Diameter of the Hole80 mm
Stroke92 mm
Rated Power (kW)/Speed (r/min)85/3600
Maximum Torque (N·M)/Speed (r/min)225/2300
Compression Ratio18.5:1
Post-Processing DeviceNone
Table 2. Physical and chemical properties of fuel oil.
Fuel NameB00B10B20B30
Physical or
Chemical Property
Cetane Number5050.5450.8351.6
Oxygen Content (%)01.642.243.68
Density (g/mL)0.830.8350.840.845
Low Calorific Value (MJ/kg)42.6841.8741.5941.06
Flash Point60677483
Viscosity (mm2/s)2-43.153.263.41
Table 3. Summary of indoor results from the biodiesel smog chamber study.
Expt.
No
T
(°C)
RH
(%)
NO
(ppbv)
NO2
(ppbv)
BC
(μg/m3)
POA
(μg/m3)
SOAt=4
(μg/m3)
ω = 0ω = 1
1. (B10)25.325.1518.27695.763710.532.23229.835
2. (B20)25.124.3502.13599.5212324.626.54443.91
3. (B30)25.724.8564.82192.87617.5092629.70456.87
Table 4. Emission factors from biodiesel smog chamber experiments.
Expt.
No.
EFBC
(g kg−1 Fuel)
EFPOA
(g kg−1 Fuel)
PFSOA
(g kg−1 Fuel)
ω = 0ω = 1
1. (B10)0.580.990.851.15
2. (B20)0.361.060.680.92
3. (B30)0.311.050.771.04
Disclaimer/Publisher’s Note: The statements, opinions and data contained in all publications are solely those of the individual author(s) and contributor(s) and not of MDPI and/or the editor(s). MDPI and/or the editor(s) disclaim responsibility for any injury to people or property resulting from any ideas, methods, instructions or products referred to in the content.

