
Research on the Dynamic Mechanisms of the Synergetic Development of Construction Industry Clusters


Abstract
1. Introduction
2. Analysis of the Synergistic Development of Construction Industry Clusters from an Ecological Perspective
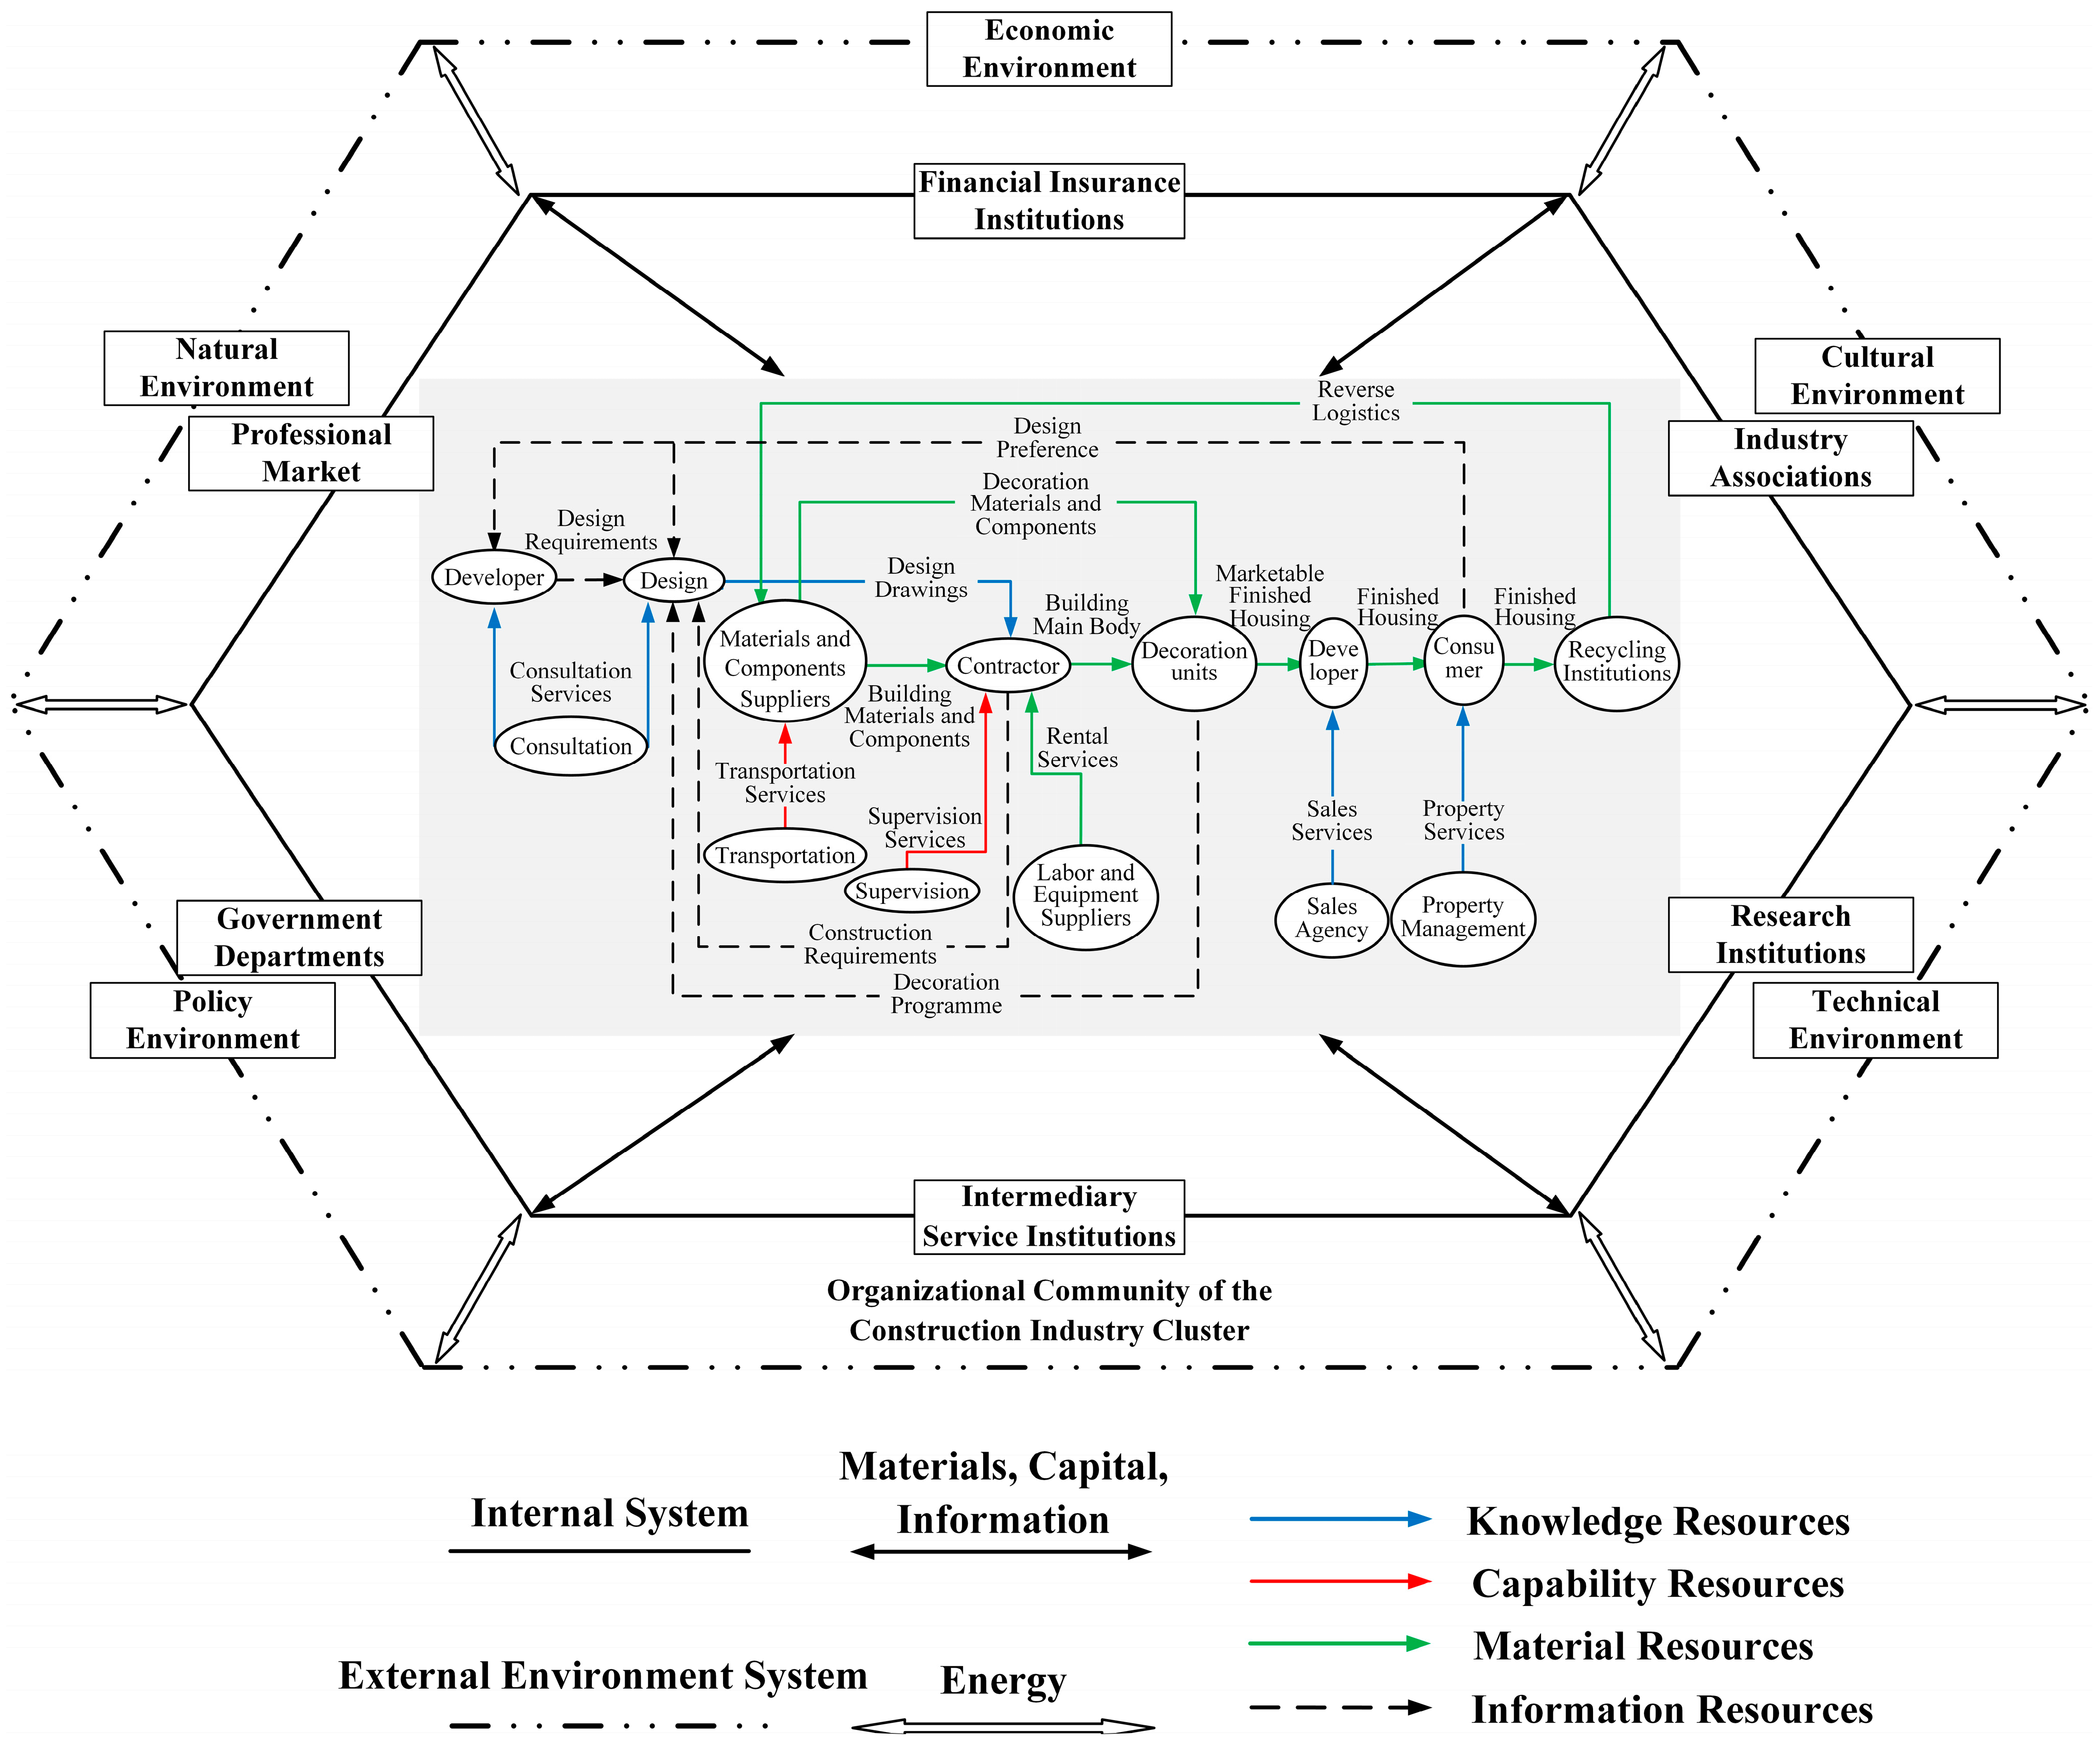
2.1. Composition of the Construction Industry Cluster Ecosystem
- (1)
- Internal System
- (2)
- External System
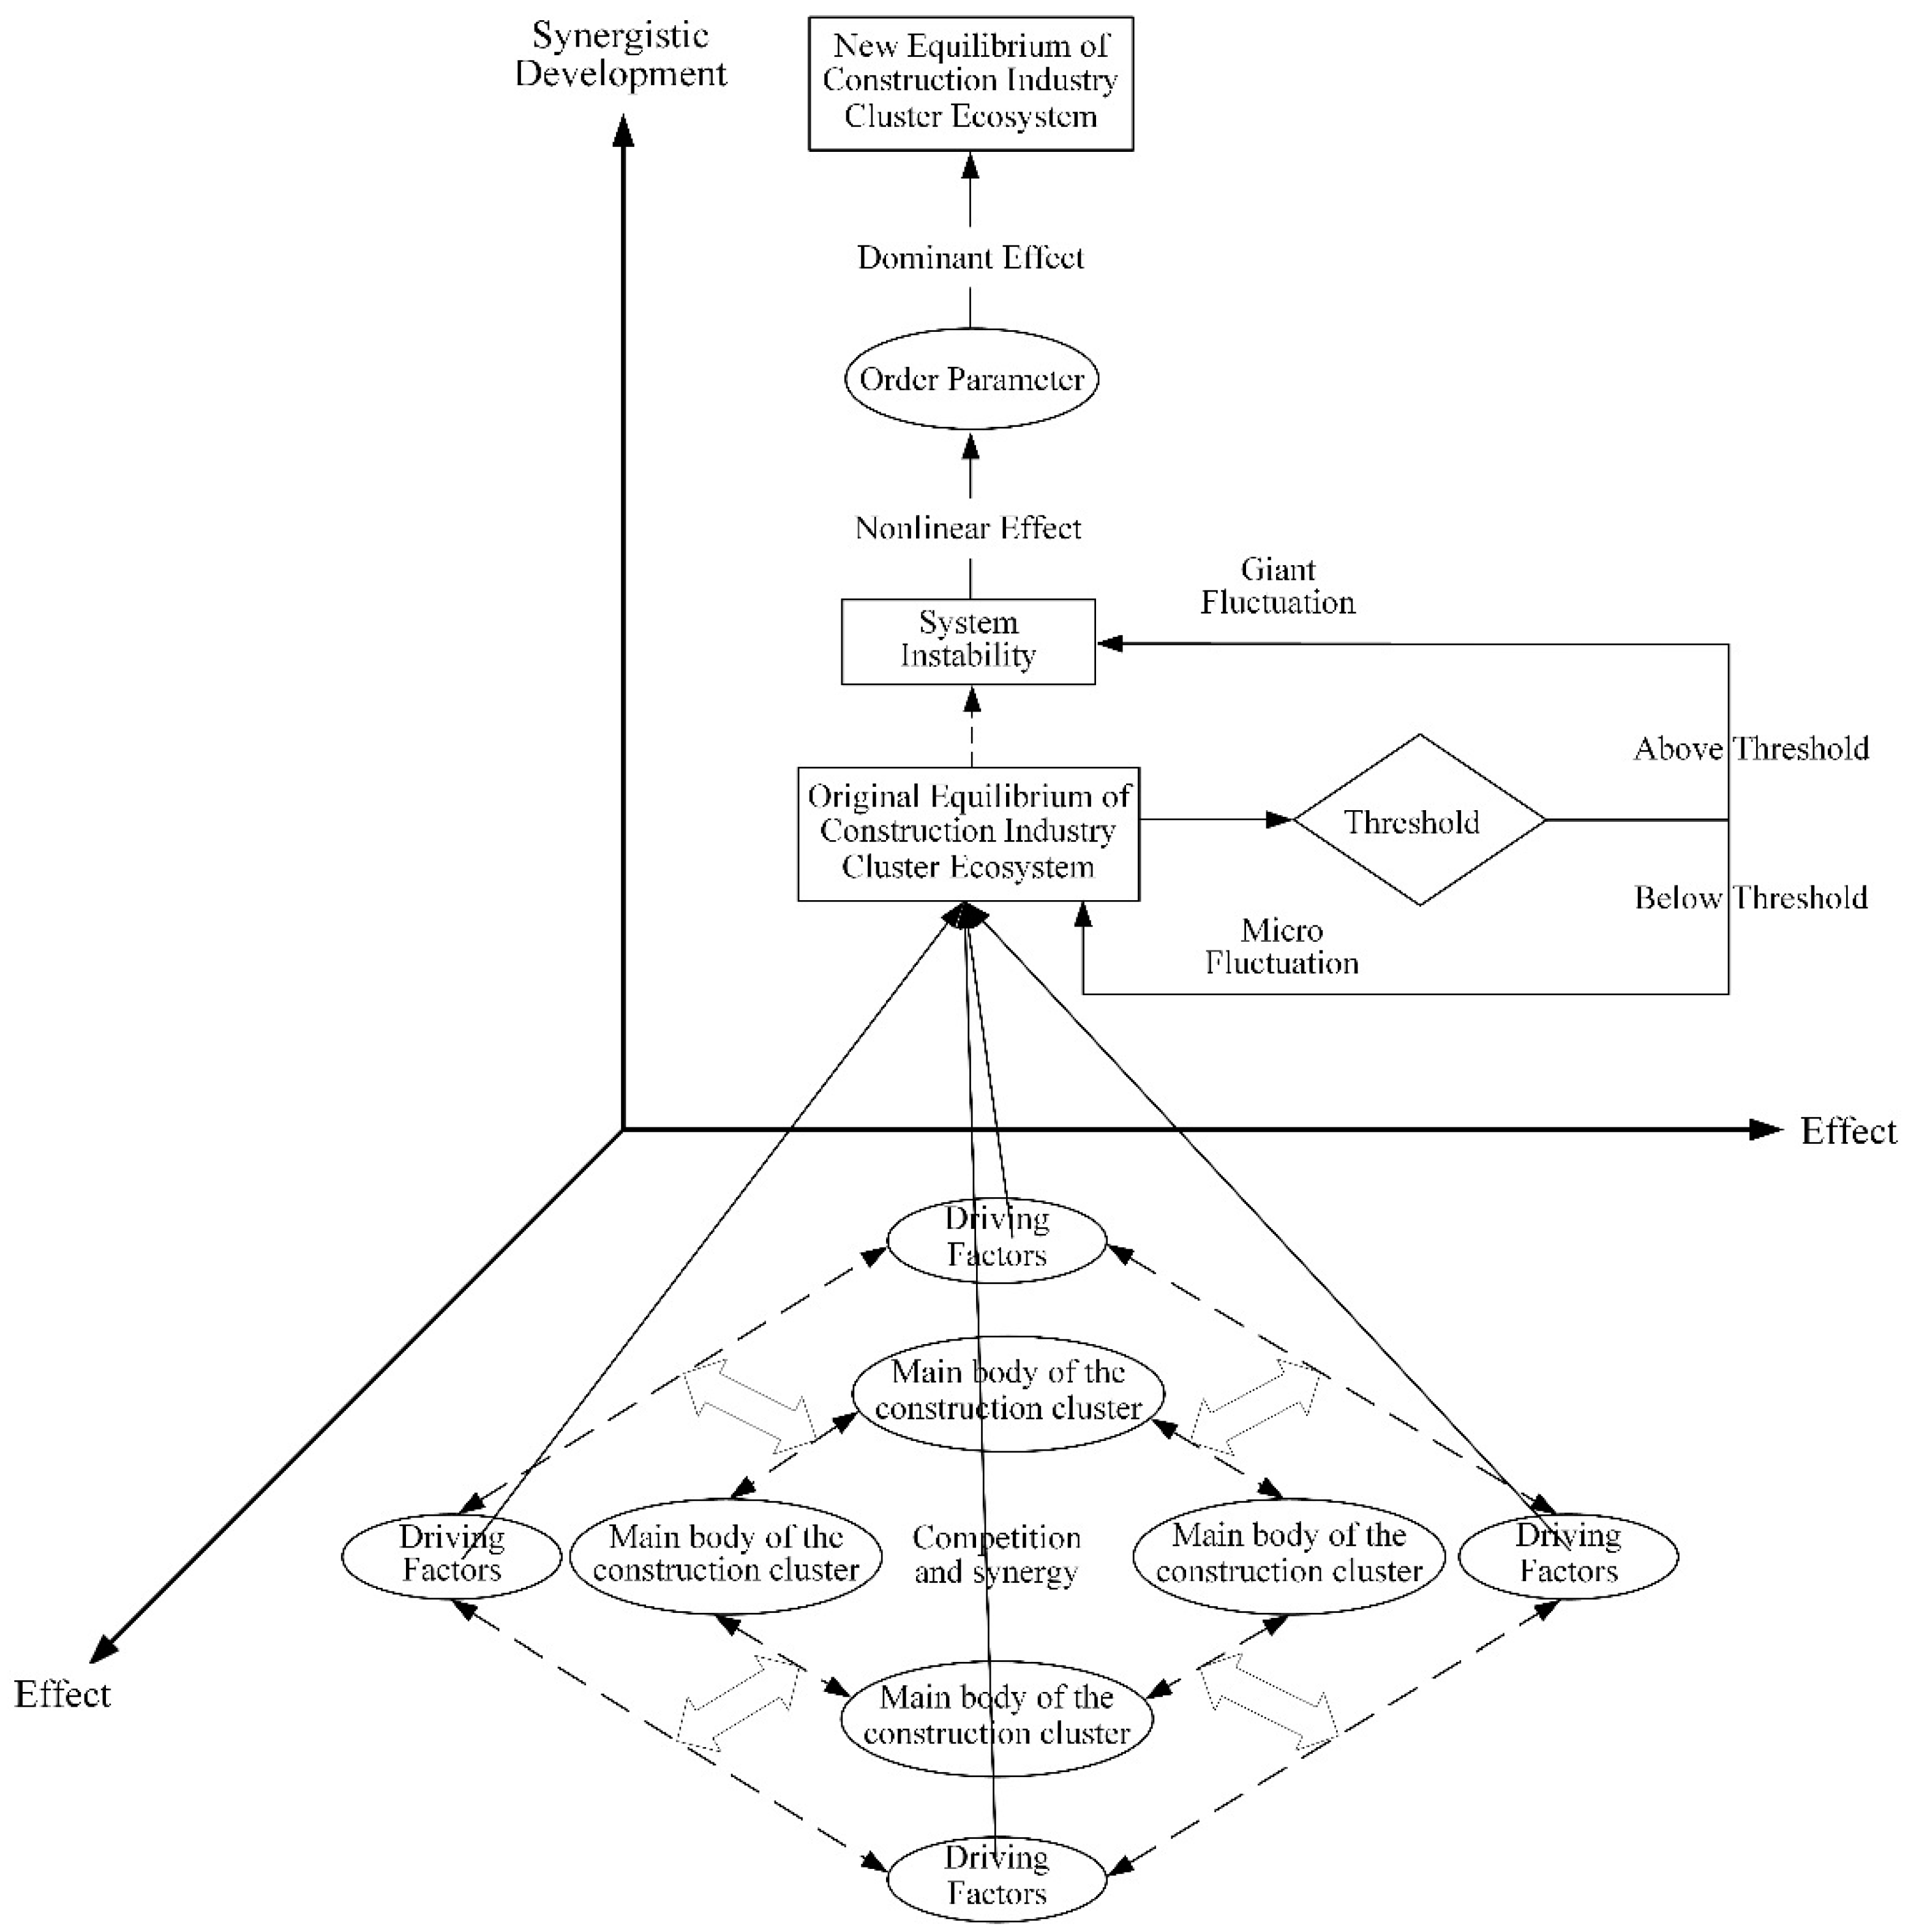
2.2. The Synergistic Development Process of the Construction Industry Cluster Ecosystem
3. Analysis of Synergistic Driving Factors in Construction Industry Clusters
3.1. Construction of the Synergistic Driving Factors Indicator System
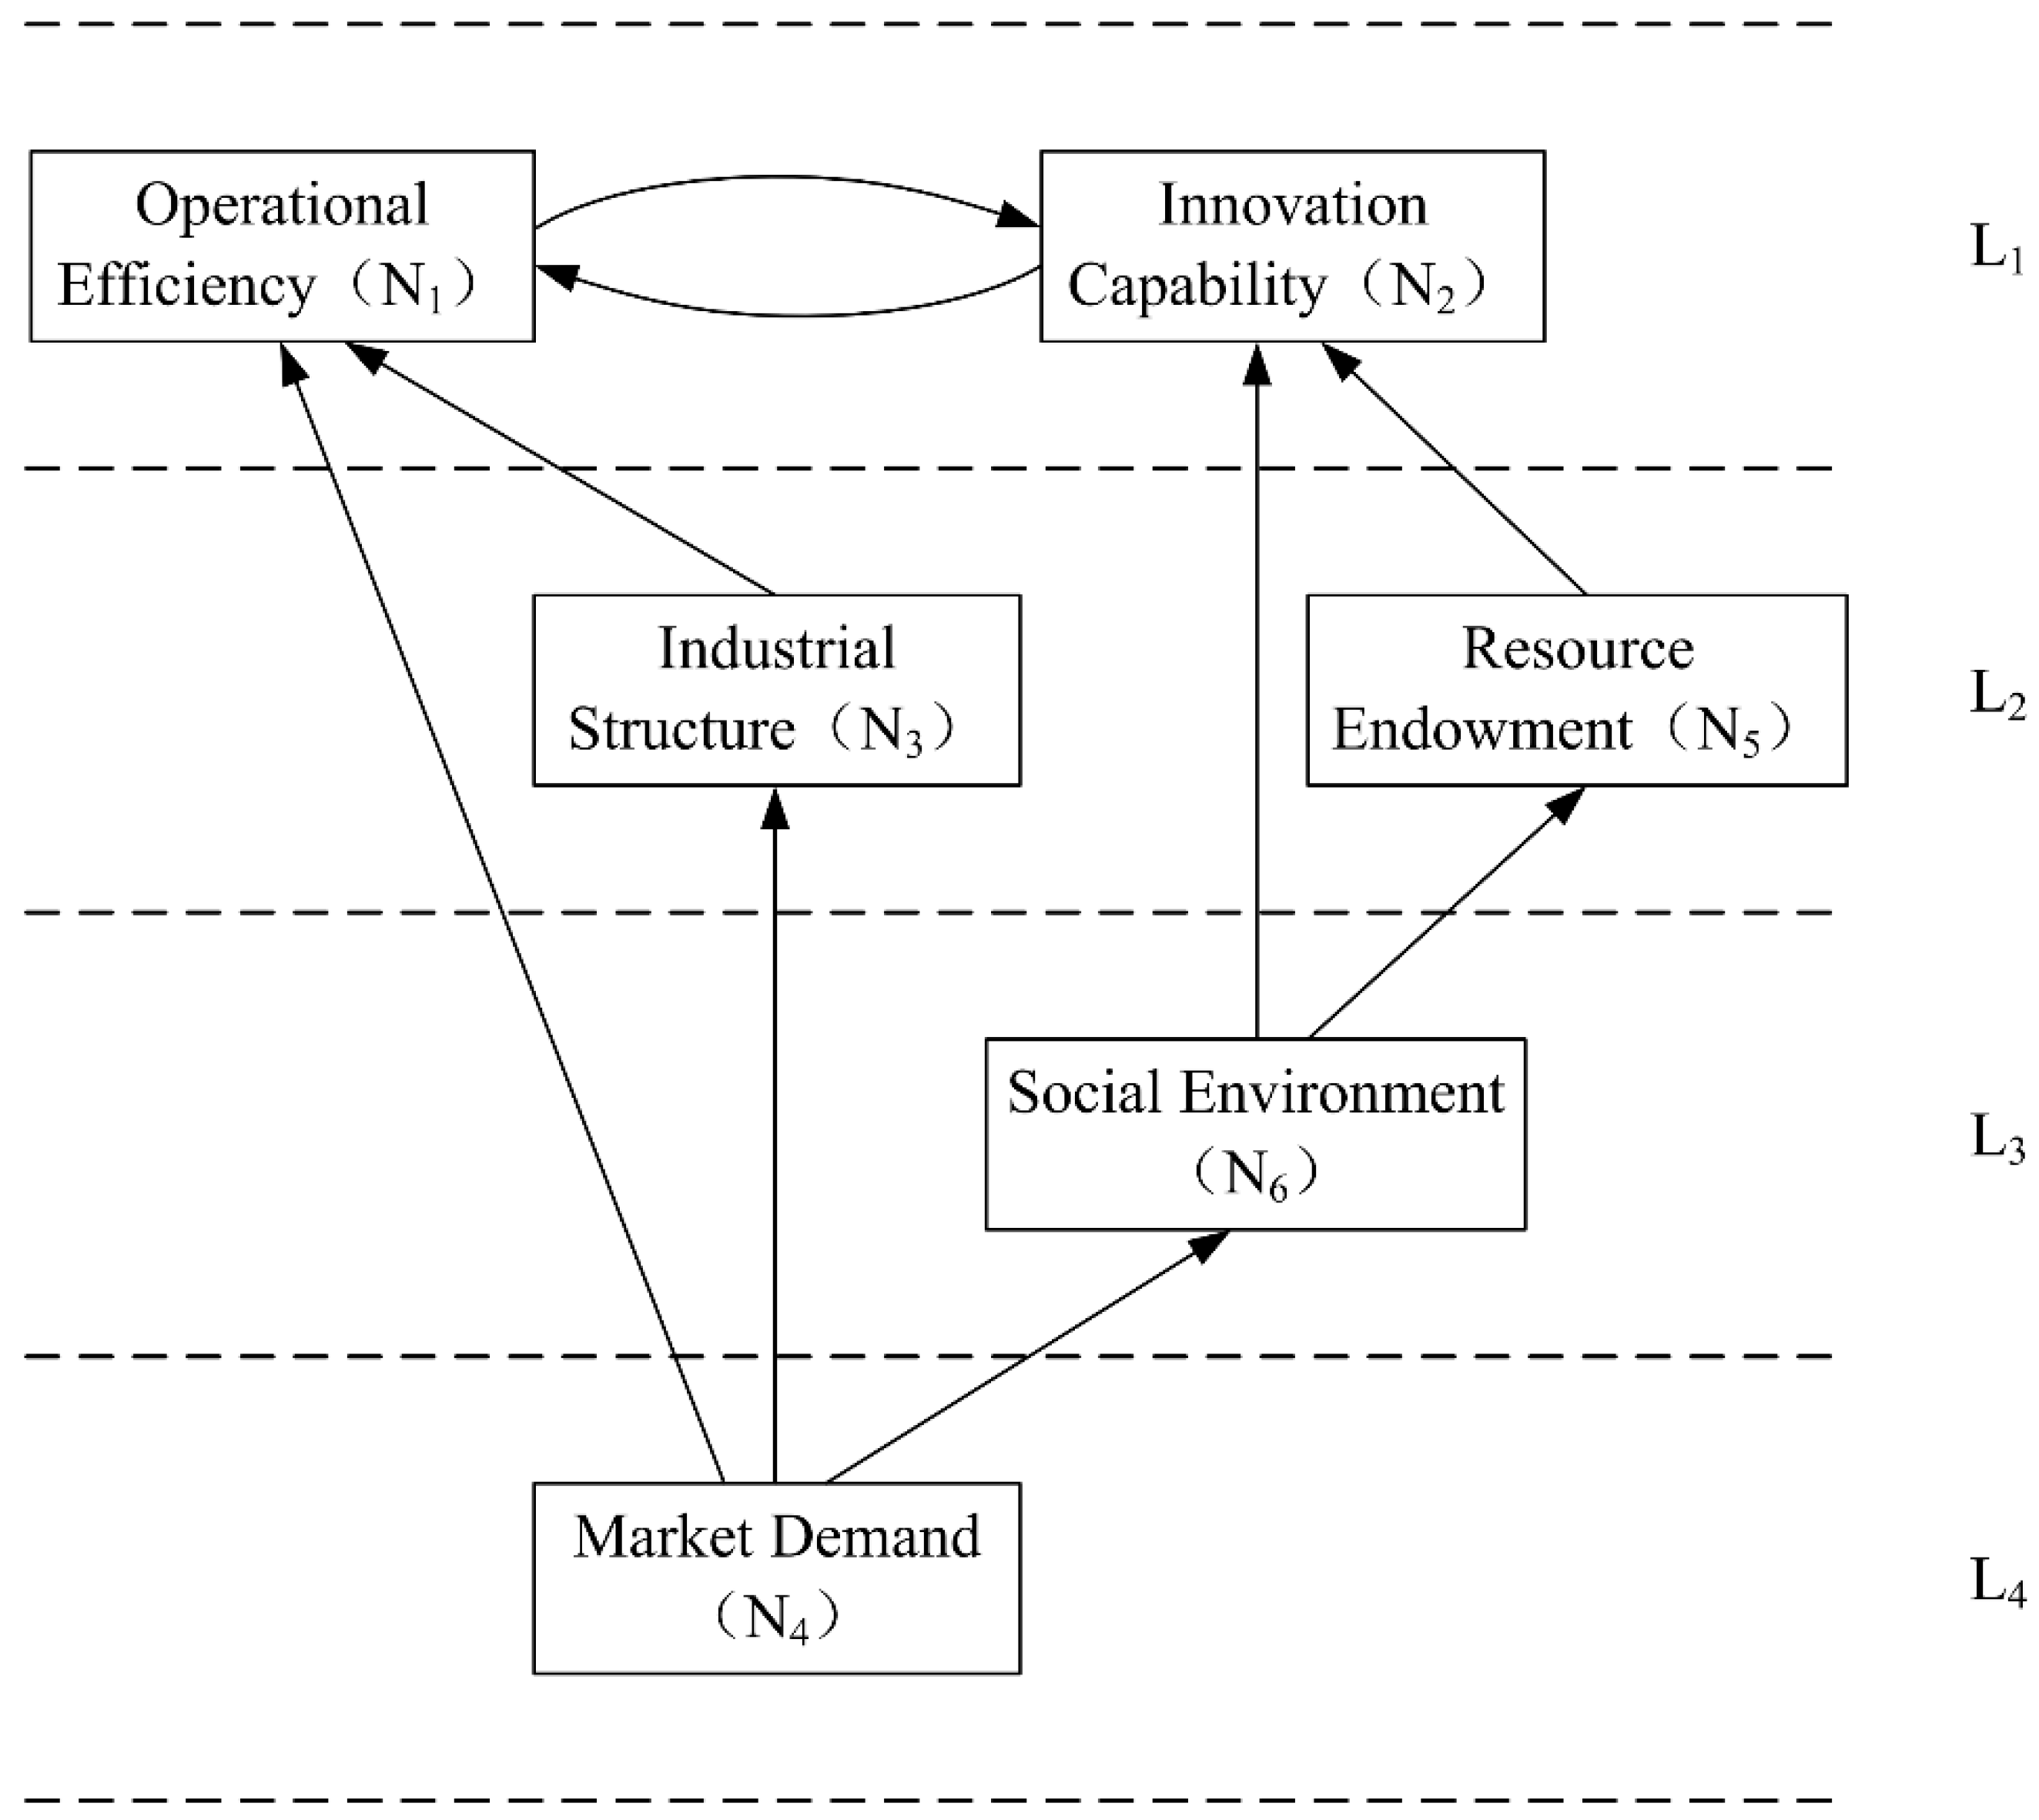
3.2. Hierarchical Effects of Synergistic Driving Factors
4. Analysis of Synergistic Dynamics Mechanism in Construction Industry Clusters Based on the Haken Model
4.1. Haken Model
4.2. Data Sources and Analysis
4.3. Model Calculation and Analysis
- (1)
- Order Parameter Identification
- (2)
- Potential Function Solution
4.4. Design of the Dynamics Mechanism
5. Discussion
5.1. Academic Value and Contribution
5.2. Limitations
- (1)
- The index system for the driving factors of construction industry cluster collaboration needs further refinement. This study identified six types of synergistic driving factors from a macro perspective based on the synergistic development patterns of the construction industry cluster ecosystem and selected measurement indicators through literature research. However, the construction industry cluster is a complex system involving numerous driving factors, and there may still be omitted elements.
- (2)
- The sample data for empirical analysis needs to be further expanded. This study conducted an empirical analysis using data from Shandong Province from 2015 to 2022 as the sample, which has limited coverage and capacity. It does not fully consider the imbalance in development across different regions, making it difficult to fully and accurately reflect the overall situation of synergistic development in China’s construction industry clusters.
6. Conclusions and Suggestions
- (1)
- Enterprises are the main drivers of cluster development, and innovation is the most crucial factor for synergistic development within these clusters. Cluster enterprises should enhance their R&D and innovation awareness, actively introduce scientific research institutions, and build innovation cooperation platforms that are enterprise-led and market-oriented, integrating industry–university–research–innovation. They should fully leverage the driving effect of core enterprises to strengthen the momentum of enterprise aggregation in construction industry clusters. Additionally, they should continuously optimize the internal relationships and production structures of enterprises within construction industry clusters, and promote specialized division of labor and differentiated development among enterprises, thereby expanding effective supply and meeting the demands of the construction economy market.
- (2)
- Construction industry clusters can continuously innovate and upgrade through industrial agglomeration, knowledge spillovers, and collective action, promoting close interaction between related enterprises and institutions to accelerate synergistic development. Clusters need to deploy innovation chains centered on the construction industry chain and cultivate innovative clusters. They should value the role of construction industry associations and jointly build cluster intermediary platforms that serve the synergistic development of the industry. Furthermore, they should break through the geographical constraints of construction industry clusters and develop virtual industry clusters, such as combining Geographic Information System (GIS) technology and Google Earth applications to break the traditional geographical and spatial limitations of construction industry clusters, achieving cross-regional integration of the industry chain.
- (3)
- The government should act as a key facilitator, strengthening the construction of market-oriented systems that benefit both the market and the government, to provide a favorable policy and institutional environment as well as a market supply and demand environment for the synergistic development of construction industry clusters. Government departments should refine the market standards and legal frameworks related to construction industry clusters. They should enhance support and promotion for the development of these clusters, actively support and guide the aggregation of innovative resources towards the clusters, and advance mixed development within the industry.
Author Contributions
Funding
Institutional Review Board Statement
Informed Consent Statement
Data Availability Statement
Acknowledgments
Conflicts of Interest
References
- Tan, Y.; Gu, Z.; Chen, Y.; Li, J. Industry Linkage and Spatial Co-Evolution Characteristics of Industrial Clusters Based on Natural Semantics: Taking the Electronic Information Industry Cluster in the Pearl River Delta as an Example. Sustainability 2022, 14, 14047. [Google Scholar] [CrossRef]
- Dyrdonova, A.N.; Shinkevich, A.I.; Fomin, N.Y.; Andreeva, E.S. Formation and development of industrial clusters in the regional economy. Rev. Espac. 2019, 40, 21–28. Available online: https://api.semanticscholar.org/CorpusID:158668298 (accessed on 28 December 2023).
- Guangdong Provincial People’s Government Office. Notification on the Issuance of Several Measures to Promote High-Quality Development of the Construction Industry in Guangdong: Guangdong Provincial People’s Government Office [2021] No. 11. Available online: https://www.gd.gov.cn/zwgk/gongbao/2021/23/content/post_3496254.html (accessed on 20 April 2024).
- Shandong Provincial Department of Housing and Urban-Rural Development. Opinions on Promoting the Development of the Whole Industry Chain of Modern Industrialization of Architecture: Shandong Provincial Department of Housing and Urban-Rural Development [2022] No. 5. Available online: http://zjt.shandong.gov.cn/art/2023/12/14/art_103756_10337079.html (accessed on 20 April 2024).
- Porter, M.E. Location, competition, and economic development: Local clusters in a global economy. Econ. Dev. Q. 2000, 14, 15–34. [Google Scholar] [CrossRef]
- Adeyemi, O.S.; Adeyemi, O.; Olawale, O. Does indu 124240001400105 strial cluster influence firms’ growth? Evidence from Oluyole industrial estate, Ibadan Oyo State, Nigeria. J. Econ. Allied Res. 2020, 4, 38–49. Available online: https://jearecons.com/index.php/jearecons/article/view/160 (accessed on 20 June 2023).
- Long, C.; Zhang, X. Patterns of China’s industrialization: Concentration, specialization, and clustering. China Econ. Rev. 2012, 23, 593–612. [Google Scholar] [CrossRef]
- Zagidullina, G.; Ivanova, R.; Nugumanova, G.; Sirazetdinov, R.; Zaripova, A. The improvement of construction industry innovative potential through the creation of a cluster. In Proceedings of the International Scientific Conference on Socio-Technical Construction and Civil Engineering (STCCE-2020), Kazan, Russian, 29 April–15 May 2020; Volume 890, p. 012121. [Google Scholar] [CrossRef]
- Zhang, J.; Zhang, Y.; Philbin, S.P.; Ballesteros-Pérez, P.; Ouyan, Y.; Cheng, J. Influence of agglomeration and selection effects on the Chinese construction industry. Eng. Sustain. 2021, 174, 9–22. [Google Scholar] [CrossRef]
- Liu, H.; Chen, J. Elements, driving mechanisms, and competitive advantages: The development logic of industrial clusters. China Soft Sci. 2005, 2, 125–130. [Google Scholar]
- Li, X.; He, J. Research on the circular economy development issues in the Beijing-Tianjin-Hebei region. Public Financ. Econ. Res. 2016, 1, 144–151. [Google Scholar]
- Sun, W. Research on the business model innovation and transformation and upgrading path of SMEs in industrial clusters: From the perspective of collaborative innovation. Contemp. Econ. Manag. 2019, 41, 24. [Google Scholar] [CrossRef]
- Porter, M. On Competition; Harvard Business School Press: Boston, MA, USA, 1998. [Google Scholar]
- Bresnahan, T.; Gambardella, A. Building a High-Tech Cluster: Silicon Valley and Beyond; Cambridge University Press: Cambridge, UK, 2004. [Google Scholar]
- Sun, J. Construction Industry Clusters—Mechanisms, Effects, and Development Strategies; Chemical Industry Press: Beijing, China, 2012; pp. 54–76. [Google Scholar]
- Sun, J.; Li, F. Construction of a competitiveness evaluation index system for construction industry clusters. Stat. Decis. 2017, 21, 57–59. [Google Scholar] [CrossRef]
- Gao, L.; Wang, X. Analysis of the evolution and growth of construction industry clusters in China. Mod. Urban Res. 2012, 12, 1–5. [Google Scholar]
- Zhang, J.; Zhang, P.; Liu, L. The impact of construction industry cluster network evolution on competitiveness: An empirical analysis based on SEM. Sci. Technol. Manag. Res. 2016, 36, 148–156. [Google Scholar]
- Aarikka-Stenroos, L.; Ritala, P. Network management in the era of ecosystems: Systematic review and management framework. Ind. Mark. Manag. 2017, 67, 23–36. [Google Scholar] [CrossRef]
- Meyer, K.E.; Peng, M.W. Theoretical foundations of emerging economy business research. J. Int. Bus. Stud. 2016, 47, 3–22. [Google Scholar] [CrossRef]
- Hu, Y. Industrial cluster ecosystems: Themes, evolution, and methods. Foreign Econ. Manag. 2022, 44, 114–135. [Google Scholar] [CrossRef]
- Adner, R. Ecosystem as structure. J. Manag. 2017, 43, 39–58. [Google Scholar] [CrossRef]
- Thomas, L.D.W.; Autio, E. Oxford Research Encyclopedia of Business and Management; Oxford University Press: Oxford, UK, 2020. [Google Scholar] [CrossRef]
- Ghaffar, S.H.; Burman, M.; Braimah, N. Pathways to circular construction: An integrated management of construction and demolition waste for resource recovery. J. Clean. Prod. 2020, 244, 118710. [Google Scholar] [CrossRef]
- Wijewickrama, M.K.C.S.; Rameezdeen, R.; Chileshe, N. Information brokerage for circular economy in the construction industry: A systematic literature review. J. Clean. Prod. 2021, 313, 127938. [Google Scholar] [CrossRef]
- Madhok, A.; Liu, C. A coevolutionary theory of the multinational firm. J. Int. Manag. 2006, 12, 1–21. [Google Scholar] [CrossRef]
- Okhmatovskiy, I. Performance implications of ties to the government and SOEs: A political embeddedness perspective. J. Manag. Stud. 2010, 47, 1020–1047. [Google Scholar] [CrossRef]
- Liu, T.; Chen, X. Research on the ecological attributes and behavioral characteristics of industrial clusters. Sci. Res. Stud. 2006, 2, 197–201. [Google Scholar] [CrossRef]
- Prigogine, I.; Lefever, R. Theory of Dissipative Structures. In Synergetics; Haken, H., Ed.; Vieweg+ Teubner Verlag: Wiesbaden, Germany, 1973. [Google Scholar] [CrossRef]
- Chen, Z. Study on the Evolution Mechanism of Collaborative Innovation in Trans-Regional Industrial Clusters. Ph.D. Thesis, Capital University of Economics and Business, Beijing, China, 2016. [Google Scholar]
- Fan, J. Research on the Evolution and Evaluation of Urban Logistics Industry Cluster Ecosystems. Ph.D. Thesis, Beijing Jiaotong University, Beijing, China, 2018. [Google Scholar]
- Gao, Y. Driving factors of collaborative innovation in the Pearl River Delta urban agglomeration: A dynamic analysis based on the Haken model. Sci. Technol. Manag. Res. 2020, 40, 85–93. [Google Scholar]
- Janes, F. Interpretive structural modelling: A methodology for structuring complex issues. Trans. Inst. Meas. Contr. 1988, 10, 145–154. [Google Scholar] [CrossRef]
- Jindal, A.; Sangwan, K.S. Development of an Interpretive Structural Model of Barriers to Reverse Logistics Implementation in Indian Industry. In Glocalized Solutions for Sustainability in Manufacturing; Springer: Berlin/Heidelberg, Germany, 2011; pp. 448–453. [Google Scholar]
- Tognoli, E.; Zhang, M.; Fuchs, A.; Beetle, C.; Kelso, J.A.S. Coordination dynamics: A foundation for understanding social behavior. Front. Hum. Neurosci. 2020, 14, 317. [Google Scholar] [CrossRef]
- Zhang, X.; Shen, J.; Sun, F.; Wang, S.; Zhang, S.; Chen, J. Allocation of flood drainage rights in watershed using a hybrid fbwm-grey-topsis method: A case study of the Jiangsu section of the Sunan Canal, China. Int. J. Environ. Res. Public Health 2022, 19, 8180. [Google Scholar] [CrossRef]
- Haken, H. Synergetics: An Introduction; Springer: Berlin/Heidelberg, Germany, 1977. [Google Scholar]
- Chen, X. Modern Statistical Analysis Methods: Theory and Application; National Defense Industry Press: Beijing, China, 2016; pp. 222–223. [Google Scholar]
- Li, Q.; Hu, Y. Study on the Evolution Mechanism of China’s Big Data Industry Based on the Haken Model. Ind. Technol. Econ. 2020, 39, 125–131. [Google Scholar] [CrossRef]
- Zhang, J. Research on the Influencing Factors and Effects of Industrial Collaborative Development in the Yangtze River Delta Region. Ph.D. Thesis, Nanjing University, Nanjing, China, 2021. [Google Scholar] [CrossRef]


| Dimensions | First-Level Indicators | Second-Level Indicators | Units | Attributes |
|---|---|---|---|---|
| Internal System Drive | Operational Efficiency (N1) | Construction asset–liability ratio | % | Quantitative data |
| Total profit and tax of construction enterprises | Billion CNY | Quantitative data | ||
| Main business revenue | Billion CNY | Quantitative data | ||
| Value added to the construction industry | Billion CNY | Quantitative data | ||
| Innovation Capability (N2) | Level of industry–academia–research cooperation | — | Qualitative scoring | |
| Proportion of scientific research investment | % | Quantitative data | ||
| Proportion of professional and technical personnel | % | Quantitative data | ||
| Labor productivity | CNY/person | Quantitative data | ||
| Industrial Structure (N3) | Completeness of industrial chain | — | Qualitative scoring | |
| Rationality of professional division of labor | — | Qualitative scoring | ||
| Proportion of output value of top and first-class general contracting | % | Quantitative data | ||
| Capital–labor ratio | % | Quantitative data | ||
| External System Drive | Market Demand (N4) | Degree of market competition of enterprises | — | Qualitative scoring |
| Demand for product diversity | — | Qualitative scoring | ||
| Output value completed outside the province | Billion CNY | Quantitative data | ||
| Resource Endowment (N5) | Proportion of building area | % | Quantitative data | |
| Number of construction enterprises | Units | Quantitative data | ||
| Total assets | Billion CNY | Quantitative data | ||
| Scale of talent | Ten thousand people | Quantitative data | ||
| Social Environment (N6) | Degree of digital technology application | — | Qualitative scoring | |
| Promotion of industrial clusters | — | Qualitative scoring | ||
| Implementation of government policies | — | Qualitative scoring | ||
| Social capital investment | Billion CNY | Quantitative data |
| Driving Factors | |||
|---|---|---|---|
| N1 | 1, 2 | 1, 2, 3, 4, 5, 6 | 1, 2 |
| N2 | 1, 2 | 1, 2, 3, 4, 5, 6 | 1, 2 |
| N3 | 1, 2, 3 | 3, 4 | 3 |
| N4 | 1, 2, 3, 4, 5, 6 | 4 | 4 |
| N5 | 1, 2, 5 | 4, 5, 6 | 5 |
| N6 | 1, 2, 5, 6 | 4, 6 | 6 |
| Serial Number | Model Hypothesis | Motion Equation | Control Parameter | Conclusion |
|---|---|---|---|---|
| ① | N2 N3 | (***) (***) (***) (*) | The equation is valid; does not satisfy the adiabatic approximation assumption; the model hypothesis is not established. | |
| ② | N3 N2 | (***) (*) (***) (*) | The equation is valid; does not satisfy the adiabatic approximation assumption; the model hypothesis is not established. | |
| ③ | N2 N4 | (***) (**) (***) (*) | The equation is valid; does not satisfy the adiabatic approximation assumption; the model hypothesis is not established. | |
| ④ | N4 N2 | (***) (*) (**) (***) | The equation is valid; satisfies the adiabatic approximation assumption; the model hypothesis is established; and N4 is the order parameter. | |
| ⑤ | N2 N6 | (***) (*) (***) (***) | The equation is valid; does not satisfy the adiabatic approximation assumption; the model hypothesis is not established. | |
| ⑥ | N6 N2 | (***) (***) (***) (***) | The equation is valid; does not satisfy the adiabatic approximation assumption; the model hypothesis is not established. | |
| ⑦ | N3 N4 | (***) (*) (***) (**) | The equation is valid; does not satisfy the adiabatic approximation assumption; the model hypothesis is not established. | |
| ⑧ | N4 N3 | (***) (**) (***) (*) | The equation is valid; does not satisfy the adiabatic approximation assumption; the model hypothesis is not established. | |
| ⑨ | N3 N6 | (***) (*) (***) (***) | The equation is valid; does not satisfy the adiabatic approximation assumption; the model hypothesis is not established. | |
| ⑩ | N6 N3 | (***) (***) (***) (**) | The equation is valid; does not satisfy the adiabatic approximation assumption; the model hypothesis is not established. | |
| ⑪ | N4 N6 | (***) (*) (***) (***) | The equation is valid; does not satisfy the adiabatic approximation assumption; the model hypothesis is not established. | |
| ⑫ | N6 N4 | (***) (***) (***) (*) | The equation is valid; does not satisfy the adiabatic approximation assumption; the model hypothesis is not established. |
| 2015 | 2016 | 2017 | 2018 | 2019 | 2020 | 2021 | 2022 | Average Value | |
|---|---|---|---|---|---|---|---|---|---|
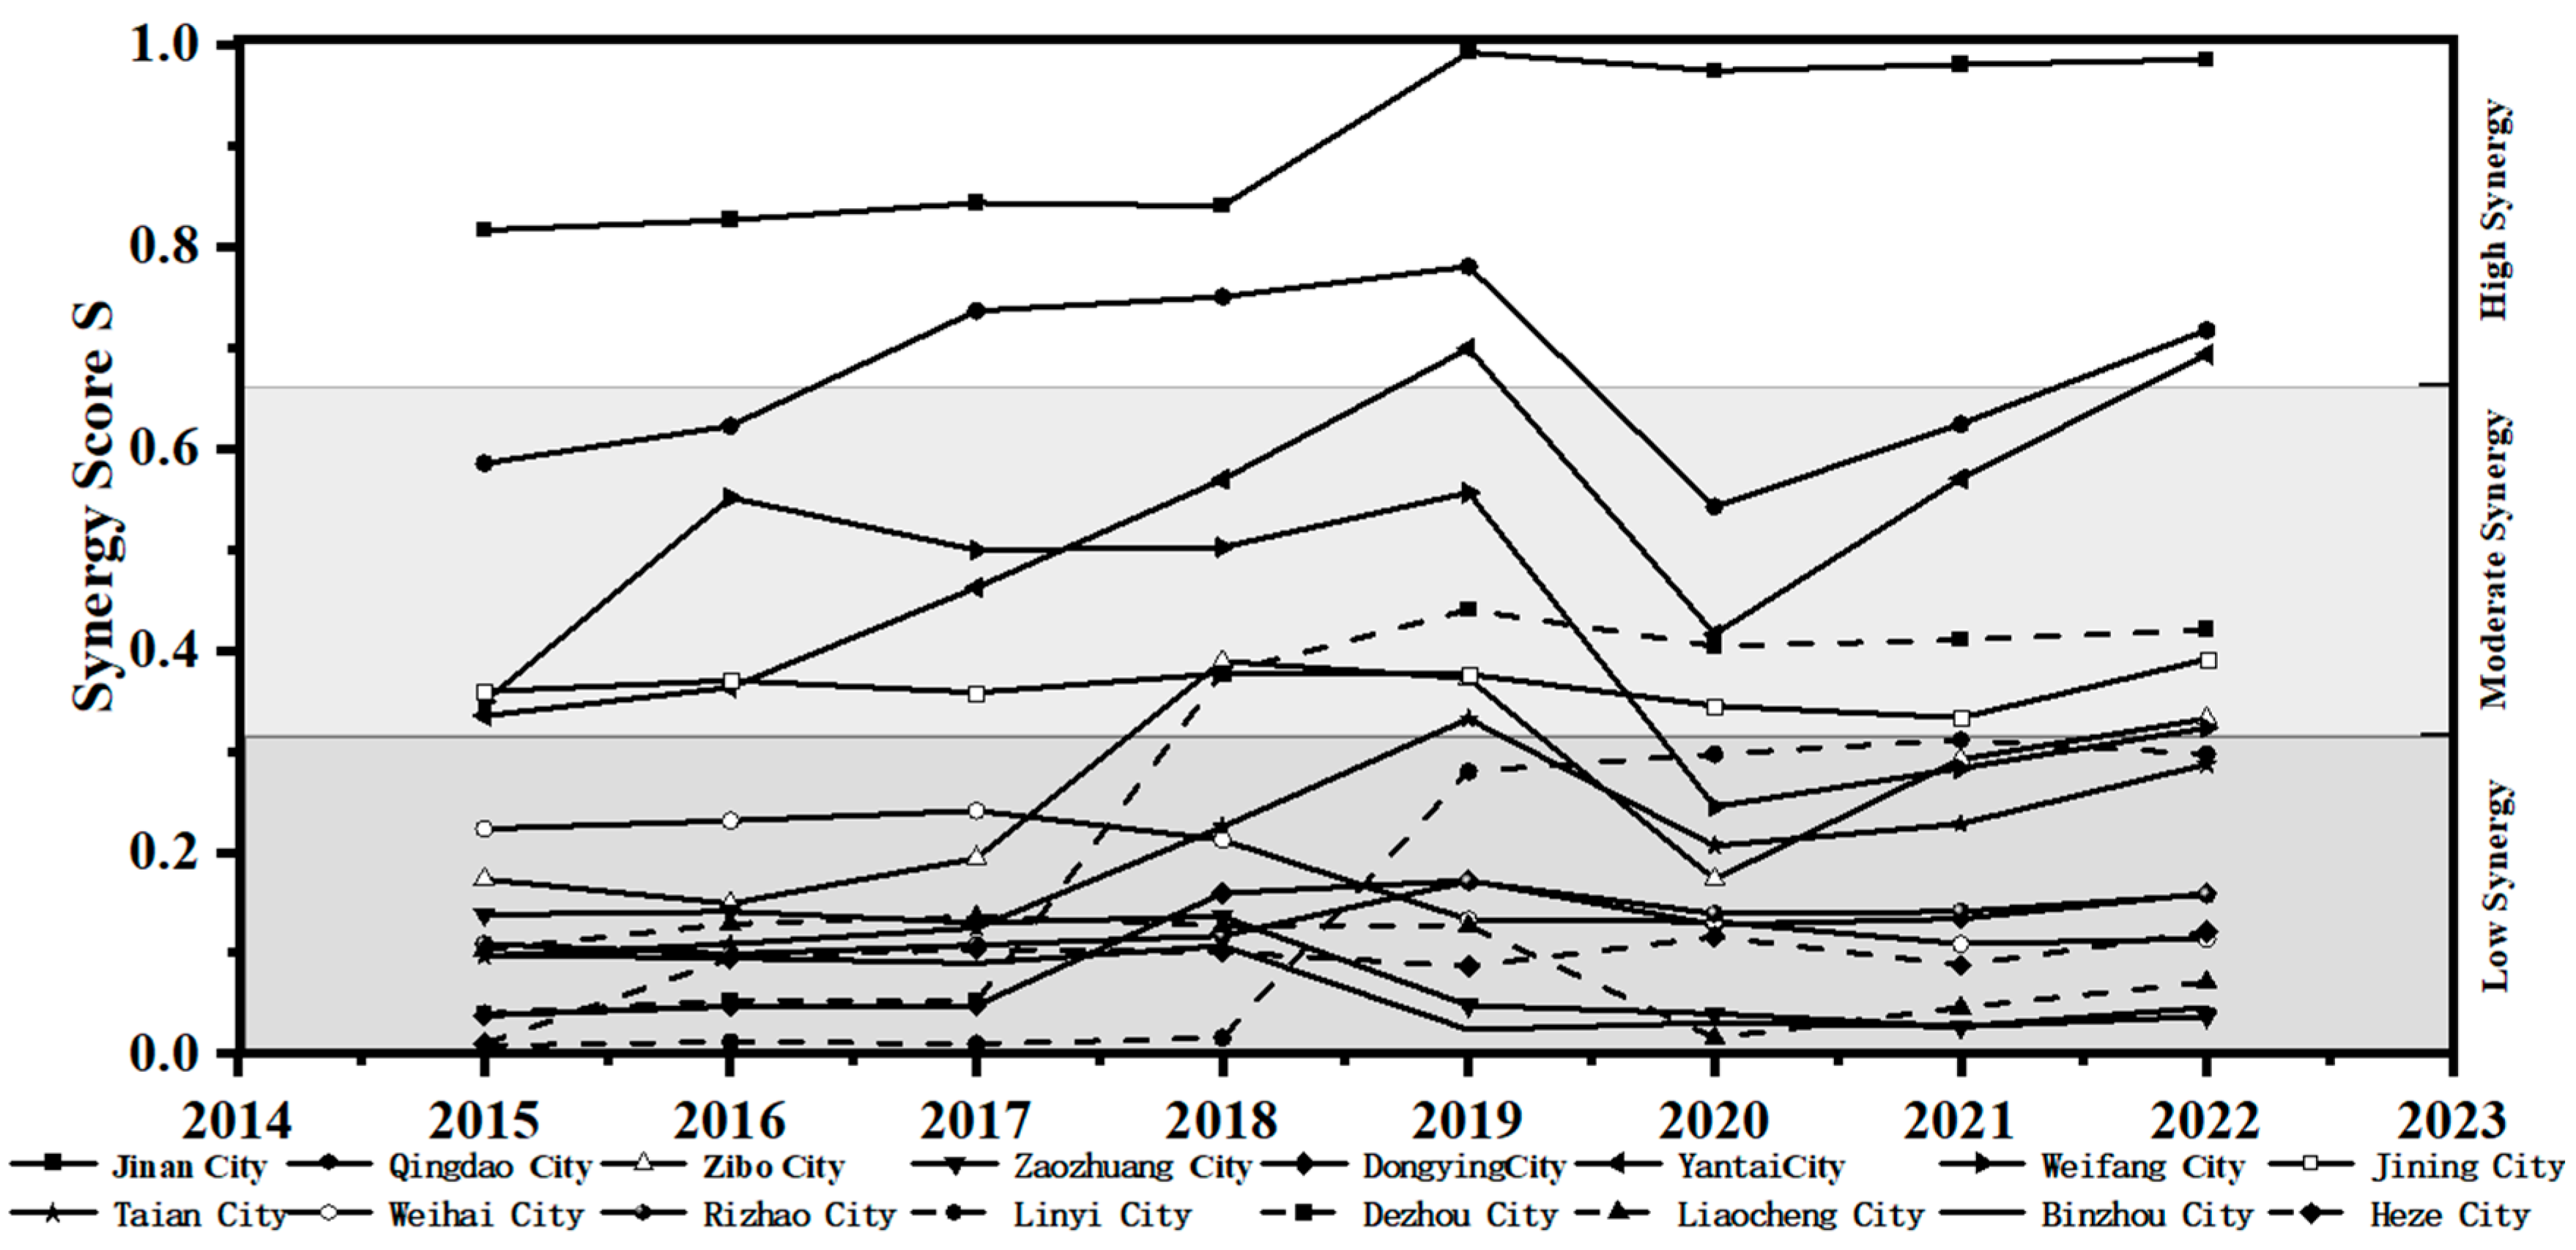
| Jinan City | 0.816 | 0.826 | 0.843 | 0.840 | 0.992 | 0.974 | 0.980 | 0.985 | 0.907 |
| Qingdao City | 0.585 | 0.622 | 0.736 | 0.750 | 0.780 | 0.542 | 0.624 | 0.717 | 0.670 |
| Zibo City | 0.173 | 0.149 | 0.194 | 0.389 | 0.372 | 0.173 | 0.292 | 0.332 | 0.259 |
| Zaozhuang City | 0.138 | 0.141 | 0.130 | 0.136 | 0.048 | 0.040 | 0.027 | 0.037 | 0.087 |
| Dongying City | 0.038 | 0.047 | 0.048 | 0.159 | 0.172 | 0.128 | 0.134 | 0.159 | 0.111 |
| Yantai City | 0.335 | 0.363 | 0.462 | 0.569 | 0.699 | 0.416 | 0.570 | 0.693 | 0.513 |
| Weifang City | 0.349 | 0.551 | 0.499 | 0.502 | 0.556 | 0.245 | 0.283 | 0.323 | 0.414 |
| Jining City | 0.359 | 0.370 | 0.358 | 0.377 | 0.376 | 0.345 | 0.333 | 0.391 | 0.364 |
| Tai’an City | 0.097 | 0.109 | 0.125 | 0.225 | 0.332 | 0.206 | 0.228 | 0.287 | 0.201 |
| Weihai City | 0.223 | 0.231 | 0.241 | 0.212 | 0.133 | 0.131 | 0.109 | 0.114 | 0.174 |
| Rizhao City | 0.109 | 0.099 | 0.108 | 0.117 | 0.171 | 0.139 | 0.141 | 0.158 | 0.130 |
| Linyi City | 0.008 | 0.012 | 0.010 | 0.016 | 0.280 | 0.297 | 0.311 | 0.297 | 0.154 |
| Dezhou City | 0.040 | 0.053 | 0.052 | 0.377 | 0.440 | 0.404 | 0.410 | 0.420 | 0.275 |
| Liaocheng City | 0.103 | 0.129 | 0.136 | 0.127 | 0.127 | 0.016 | 0.046 | 0.071 | 0.094 |
| Binzhou City | 0.098 | 0.095 | 0.090 | 0.107 | 0.024 | 0.031 | 0.027 | 0.046 | 0.065 |
| Heze City | 0.010 | 0.095 | 0.104 | 0.101 | 0.087 | 0.116 | 0.088 | 0.121 | 0.090 |
Disclaimer/Publisher’s Note: The statements, opinions and data contained in all publications are solely those of the individual author(s) and contributor(s) and not of MDPI and/or the editor(s). MDPI and/or the editor(s) disclaim responsibility for any injury to people or property resulting from any ideas, methods, instructions or products referred to in the content. |
© 2025 by the authors. Licensee MDPI, Basel, Switzerland. This article is an open access article distributed under the terms and conditions of the Creative Commons Attribution (CC BY) license (https://creativecommons.org/licenses/by/4.0/).
Share and Cite
Zhao, J.; Zhao, L.; Xu, Y.; Yao, X. Research on the Dynamic Mechanisms of the Synergetic Development of Construction Industry Clusters. Sustainability 2025, 17, 958. https://doi.org/10.3390/su17030958
Zhao J, Zhao L, Xu Y, Yao X. Research on the Dynamic Mechanisms of the Synergetic Development of Construction Industry Clusters. Sustainability. 2025; 17(3):958. https://doi.org/10.3390/su17030958
Chicago/Turabian StyleZhao, Jinyu, Lu Zhao, Yinghui Xu, and Xueqian Yao. 2025. "Research on the Dynamic Mechanisms of the Synergetic Development of Construction Industry Clusters" Sustainability 17, no. 3: 958. https://doi.org/10.3390/su17030958
APA StyleZhao, J., Zhao, L., Xu, Y., & Yao, X. (2025). Research on the Dynamic Mechanisms of the Synergetic Development of Construction Industry Clusters. Sustainability, 17(3), 958. https://doi.org/10.3390/su17030958