
Study on Quantitative Model of Water Resource Ecological Compensation in Yangtze River Basin Based on Water Footprint–Decoupling Analysis Methodology

 , ,
, ,
Abstract
1. Introduction
2. Literature Review
- (1)
- From the dual perspectives of water quantity and water quality, the water footprint ecological load index is incorporated to analyze the water footprint more comprehensively. Since ecological compensation aims to protect the stability of ecosystems, incorporating the water footprint ecological load index is a more reasonable consideration of the pollution affecting the water environment.
- (2)
- In light of the characteristics of ecological compensation in large inter-administrative river basins, a method is proposed to define the subject and object based on the impact of administrative actions on river basin water resources, thereby determining the payers of the compensation standards.
- (3)
- The coordinated relationship between water resource utilization and economic development in different regions is analyzed, and an improved method for establishing compensation standards for large inter-administrative river basins, based on water footprint–decoupling analysis, is proposed to determine scientifically sound compensation standards for large inter-administrative river basins.
3. Materials and Methods
3.1. Research Area
3.2. Measurement Model of the Regional Water Footprint
3.2.1. Calculation Model of the Regional Water Footprint
3.2.2. Water Footprint Ecological Load Index Model
3.3. Measurement of Total Water Availability
3.4. Analysis Model of the Coordination Degree of Water Resource Utilization and Economic Development in River Basins Based on Decoupling Analysis
3.5. Quantitative Modeling of Ecological Compensation for Water Resources
3.5.1. Model for Measuring the Amount of Water Resource Ecological Compensation
3.5.2. Determination of the Subject and Object of Ecological Compensation for Water Resources
3.5.3. Quantitative Standards for Water Resource Ecological Compensation
3.6. Data Sources
4. Results and Discussion
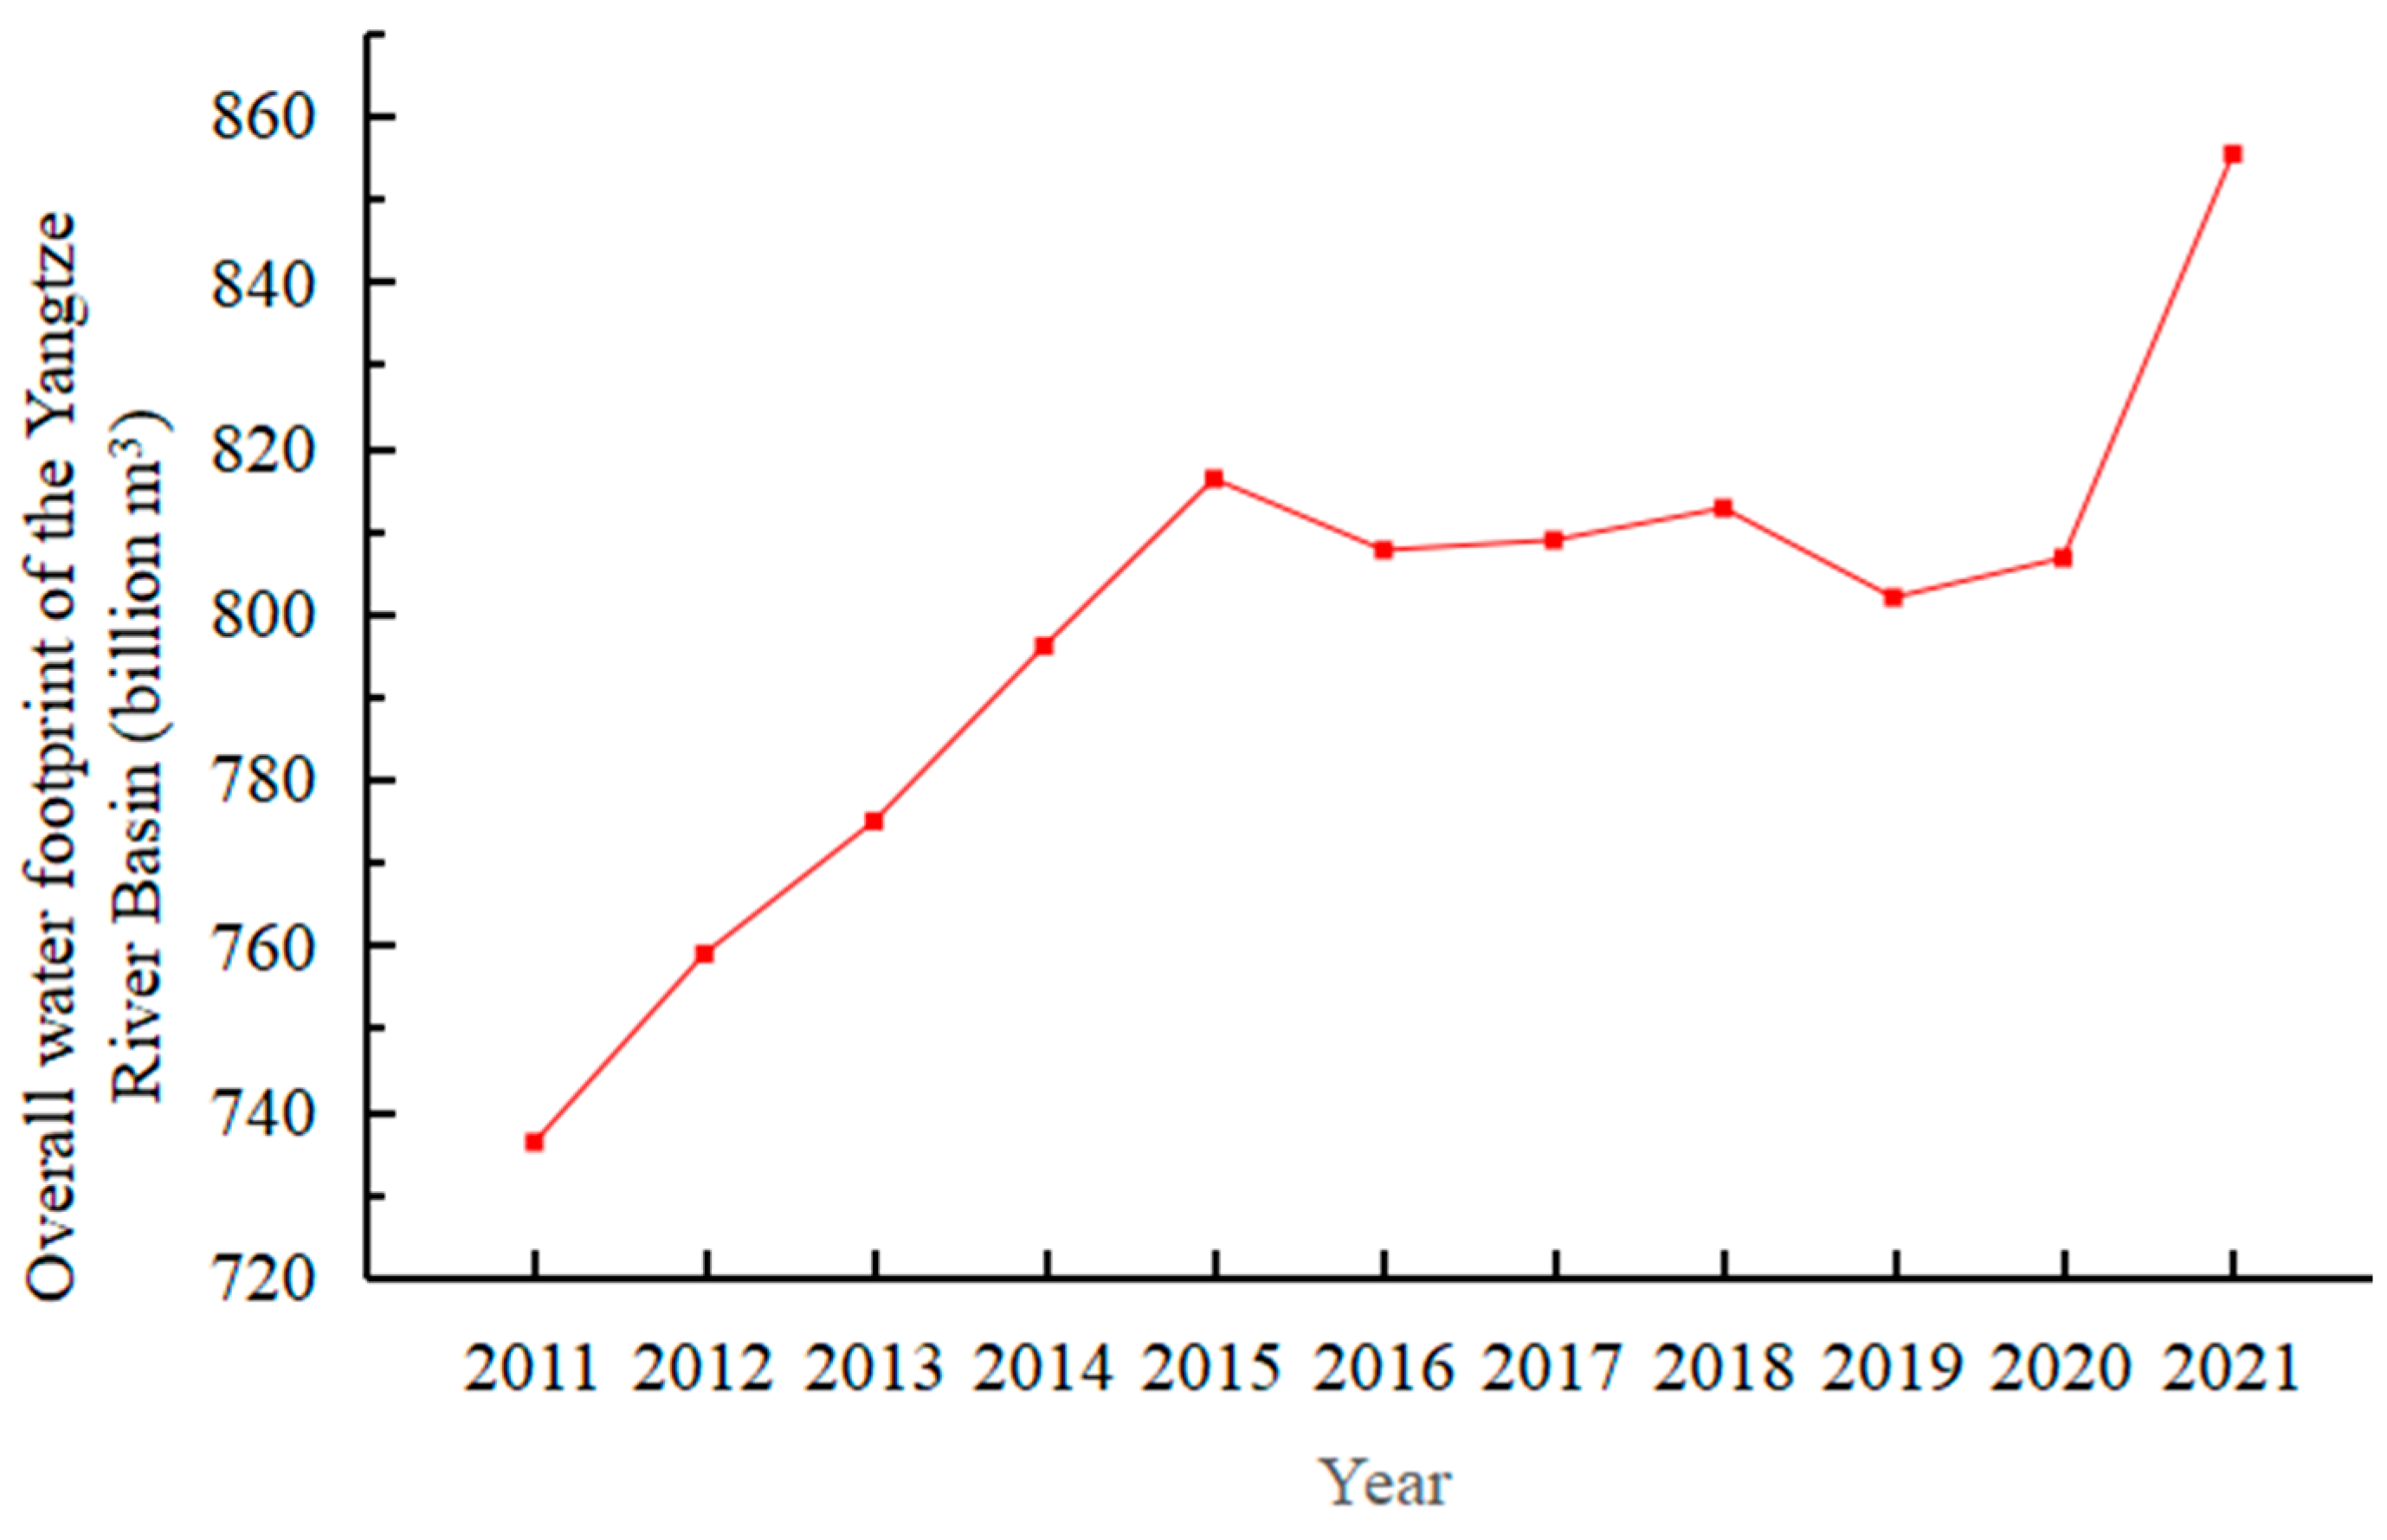
4.1. Calculation Results and Analysis of the Water Footprint of the Yangtze River Basin
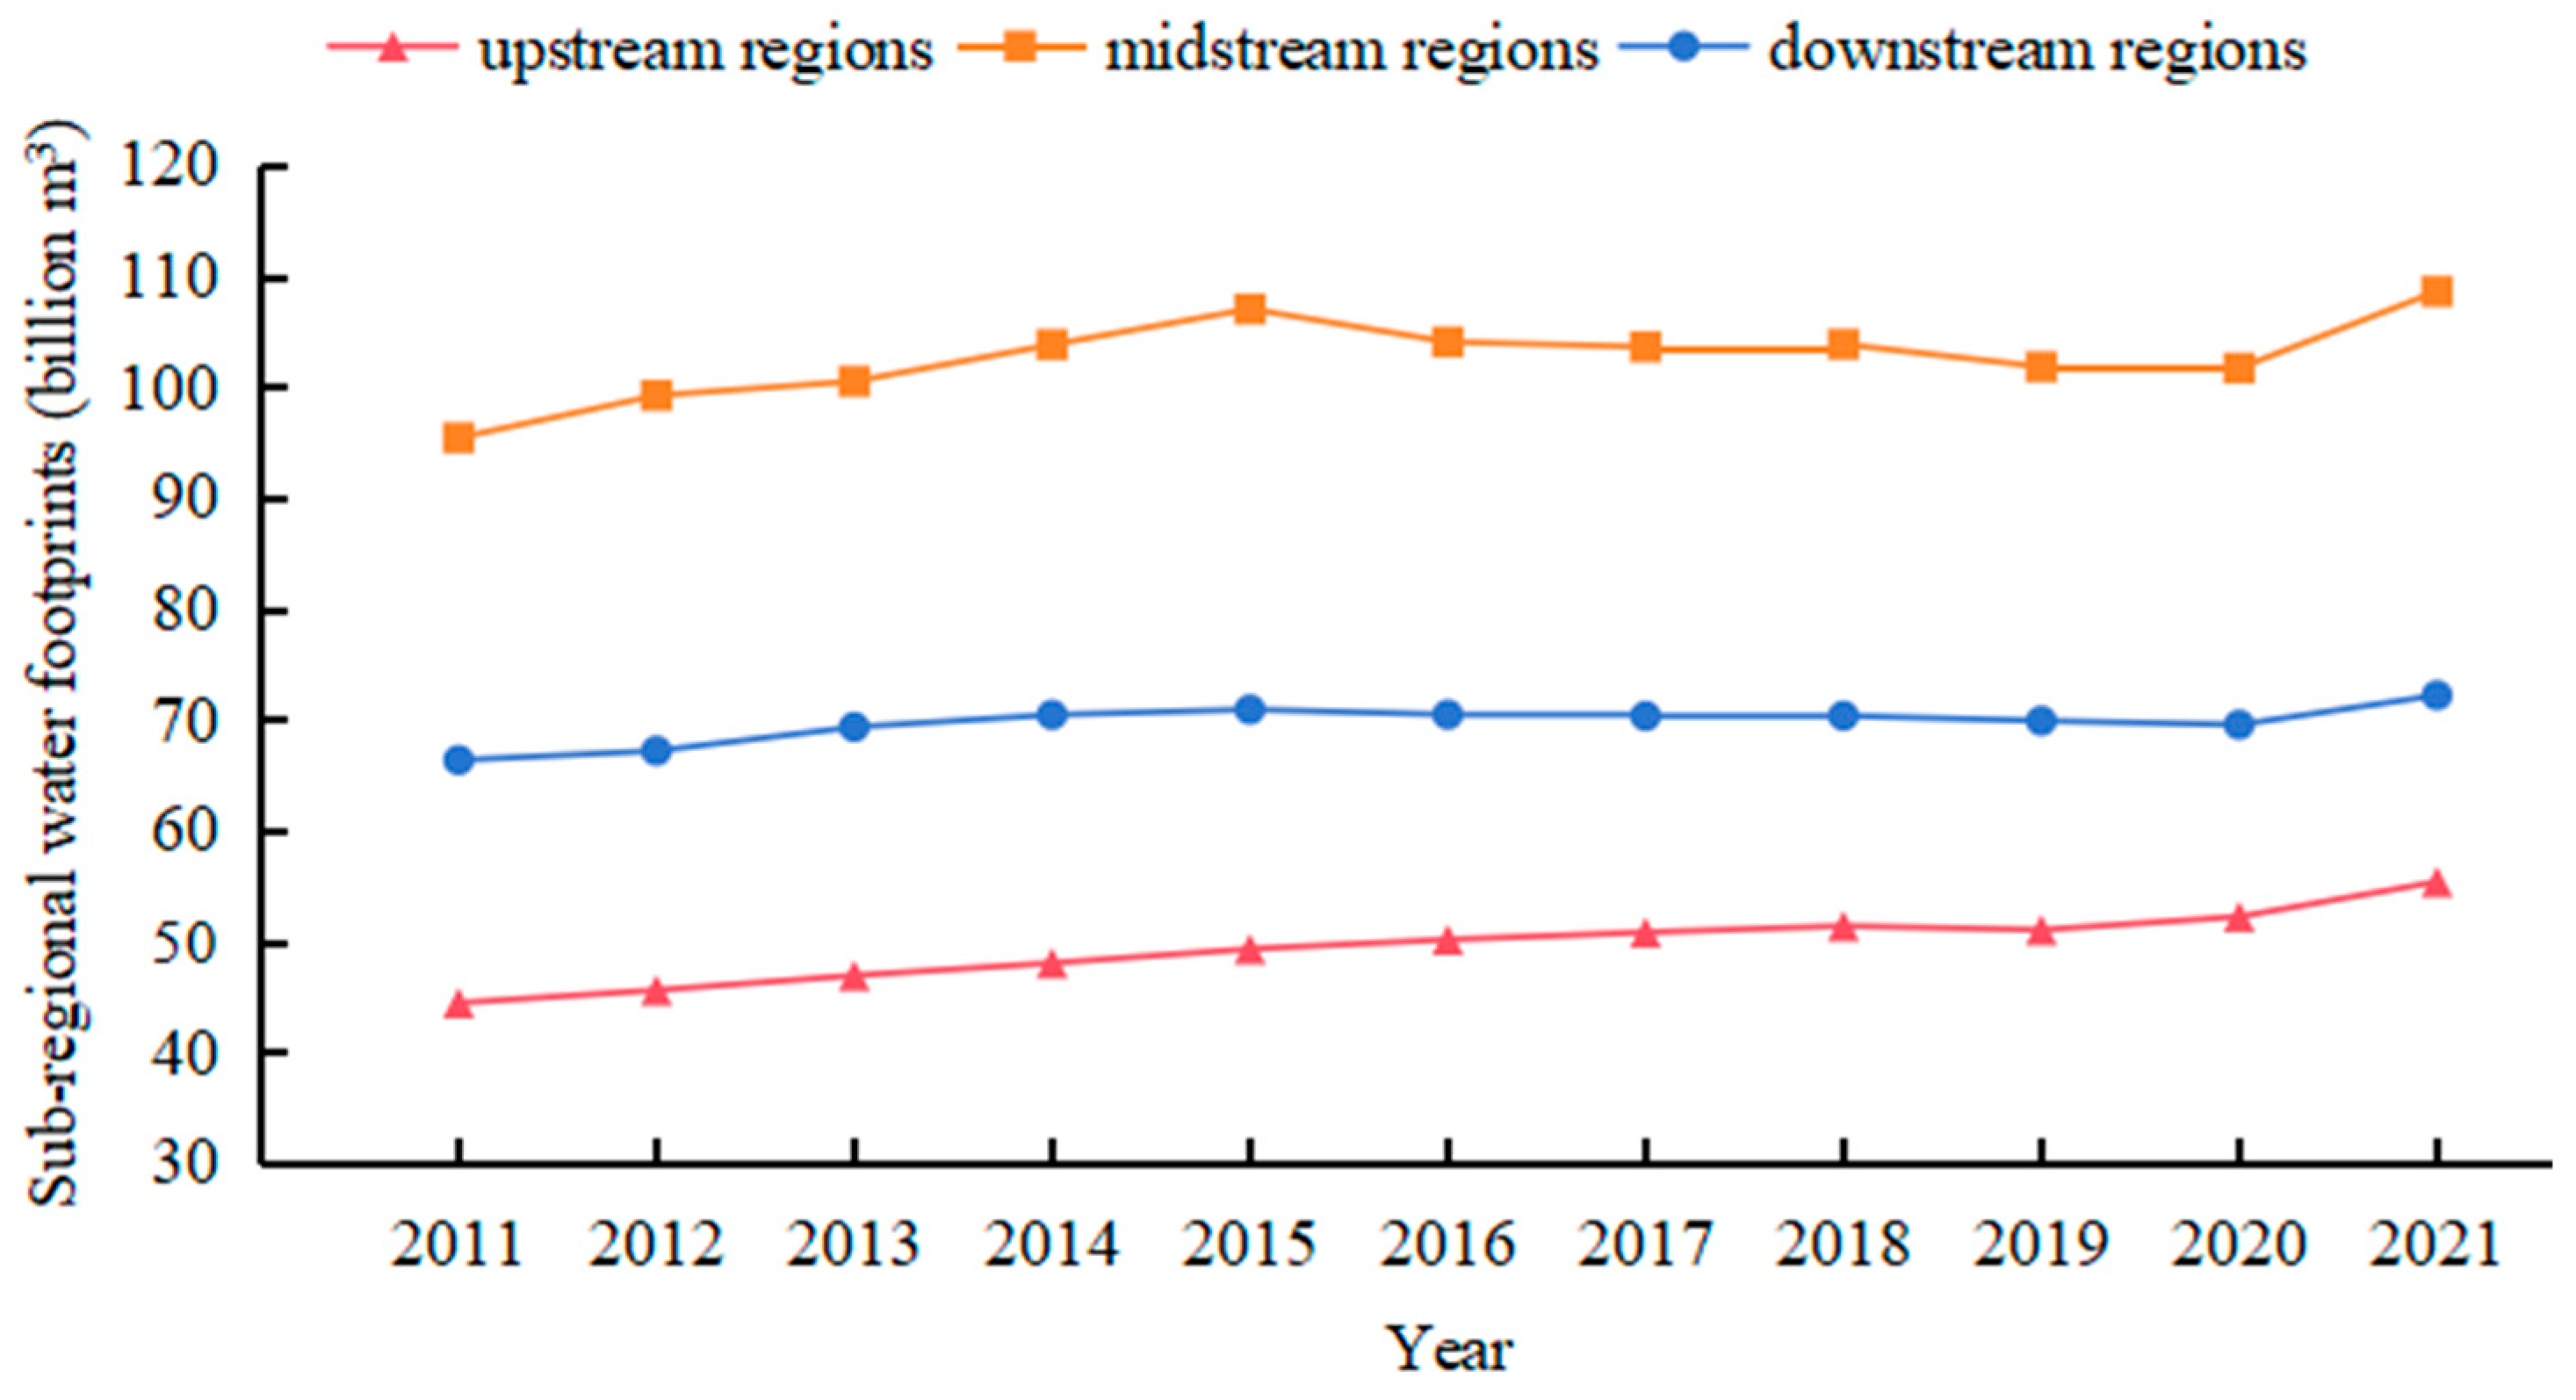
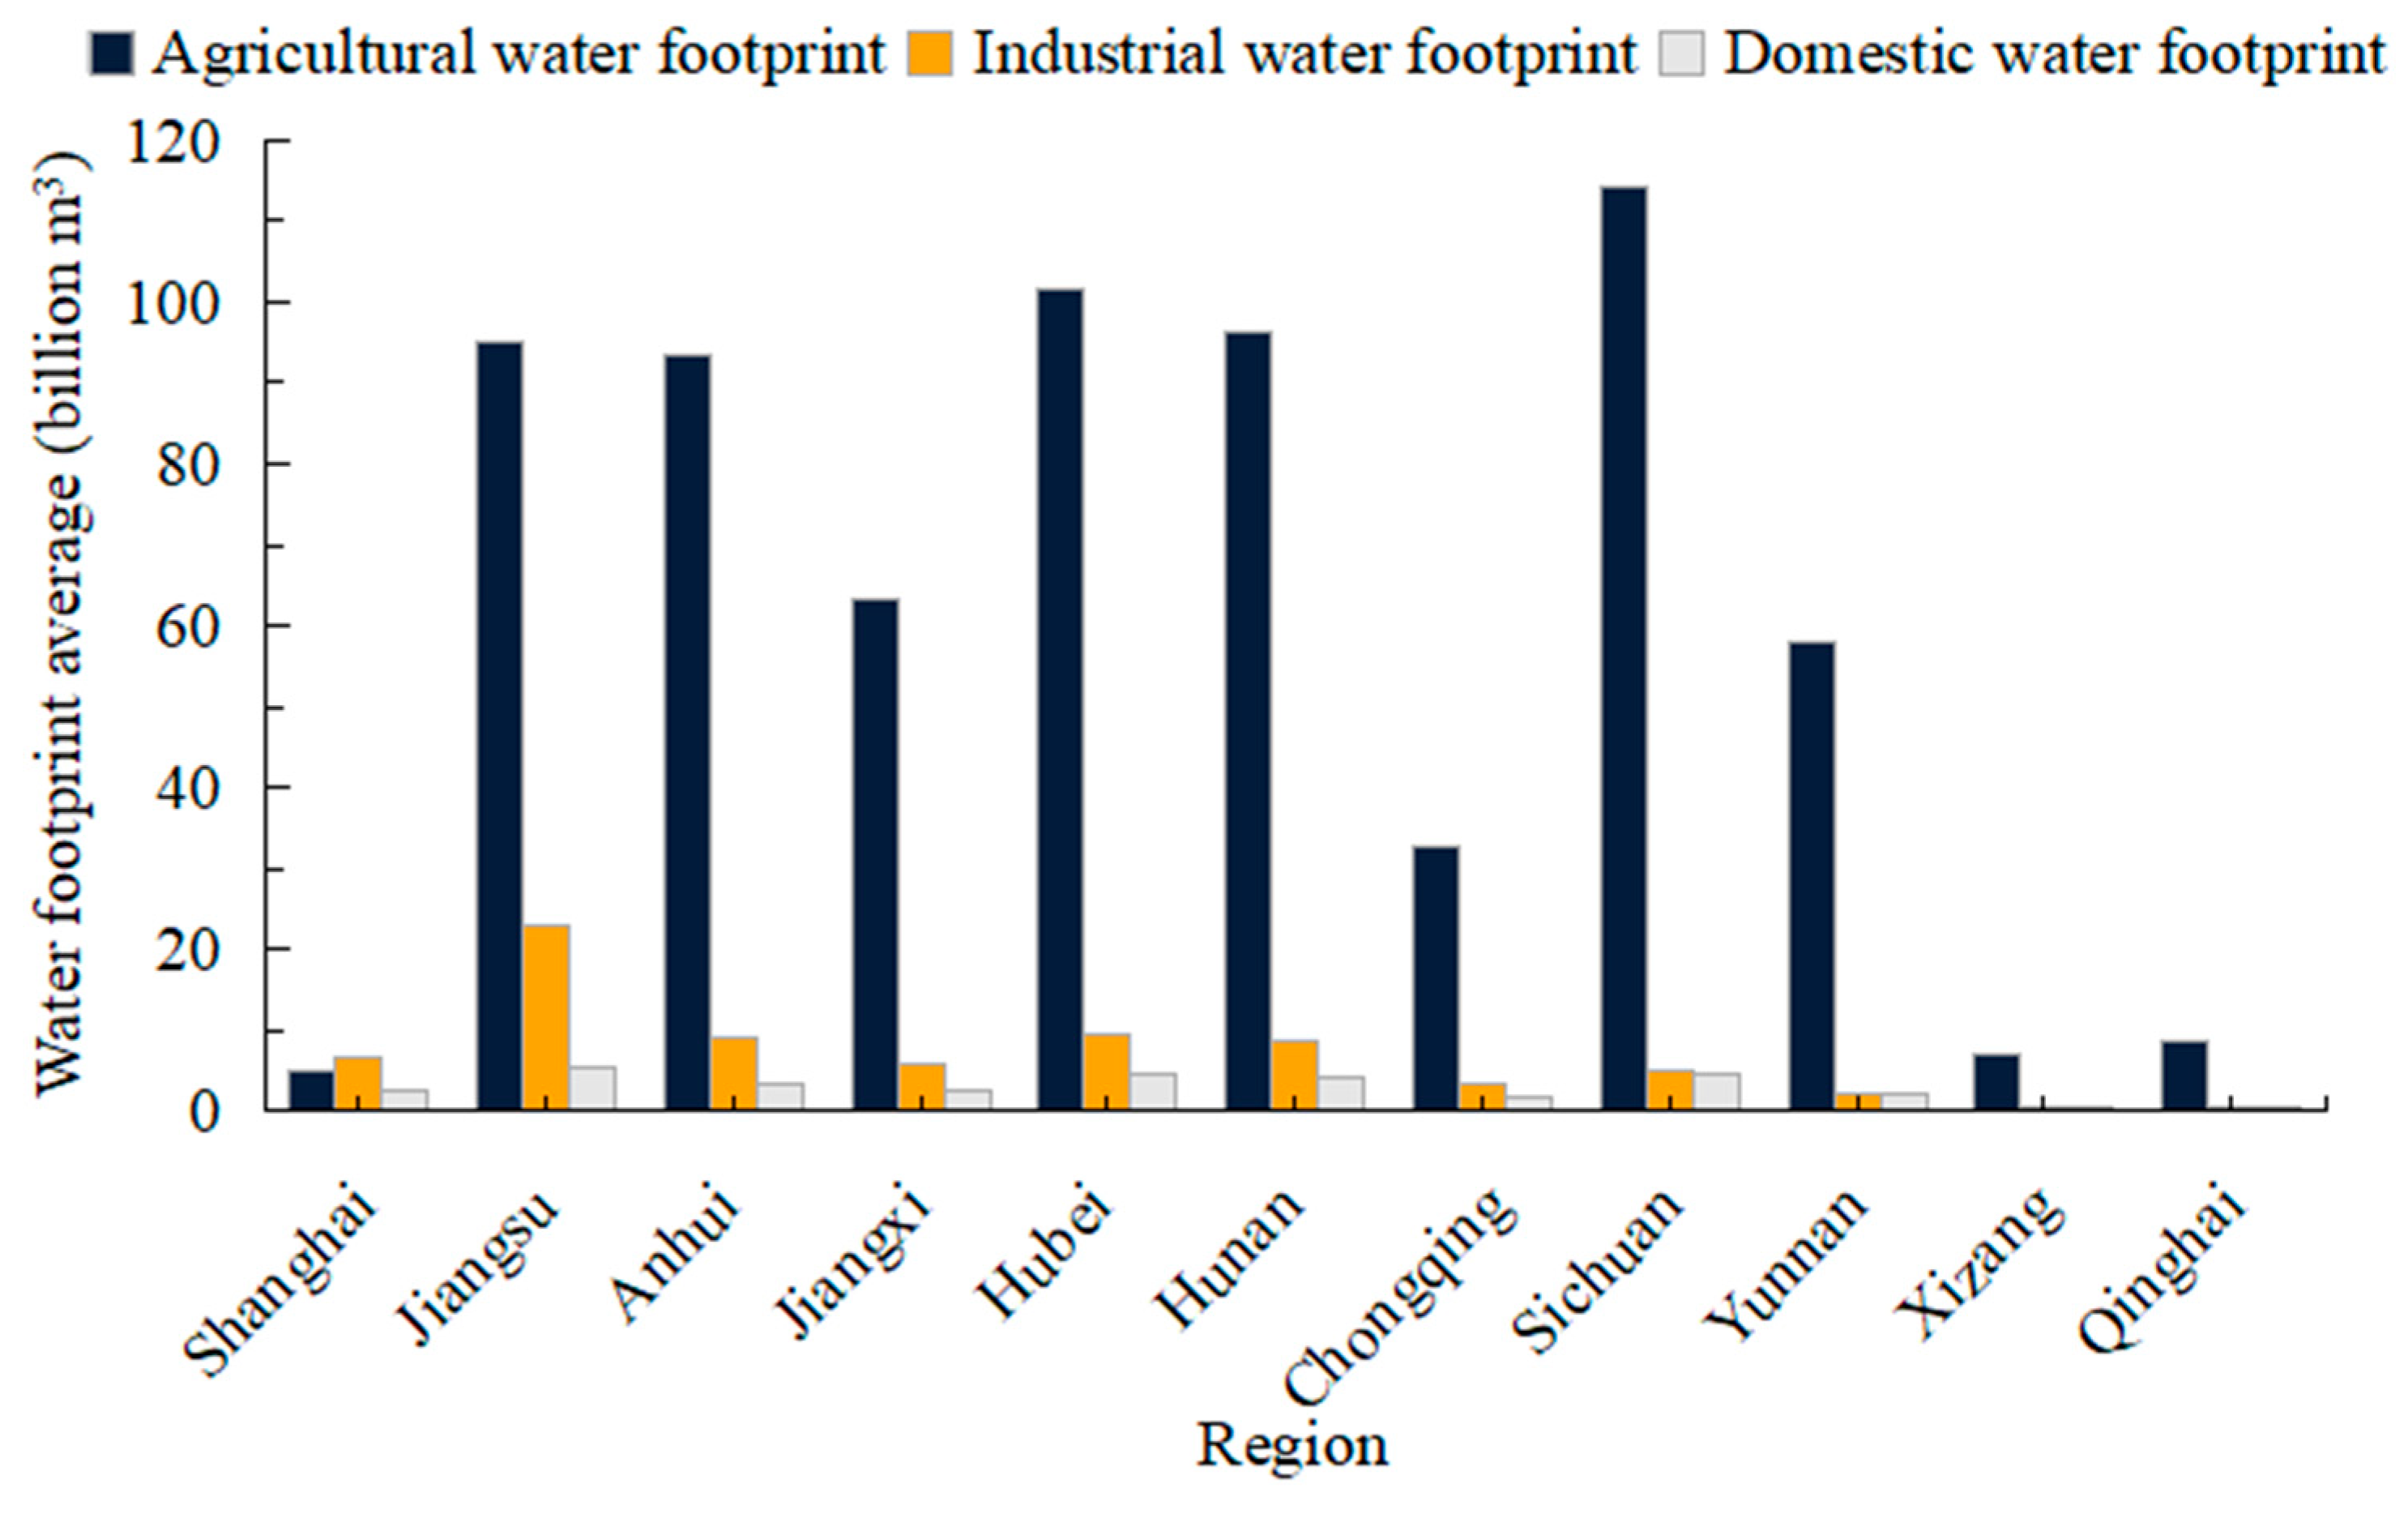
4.1.1. Analysis of Water Footprint Results by Province
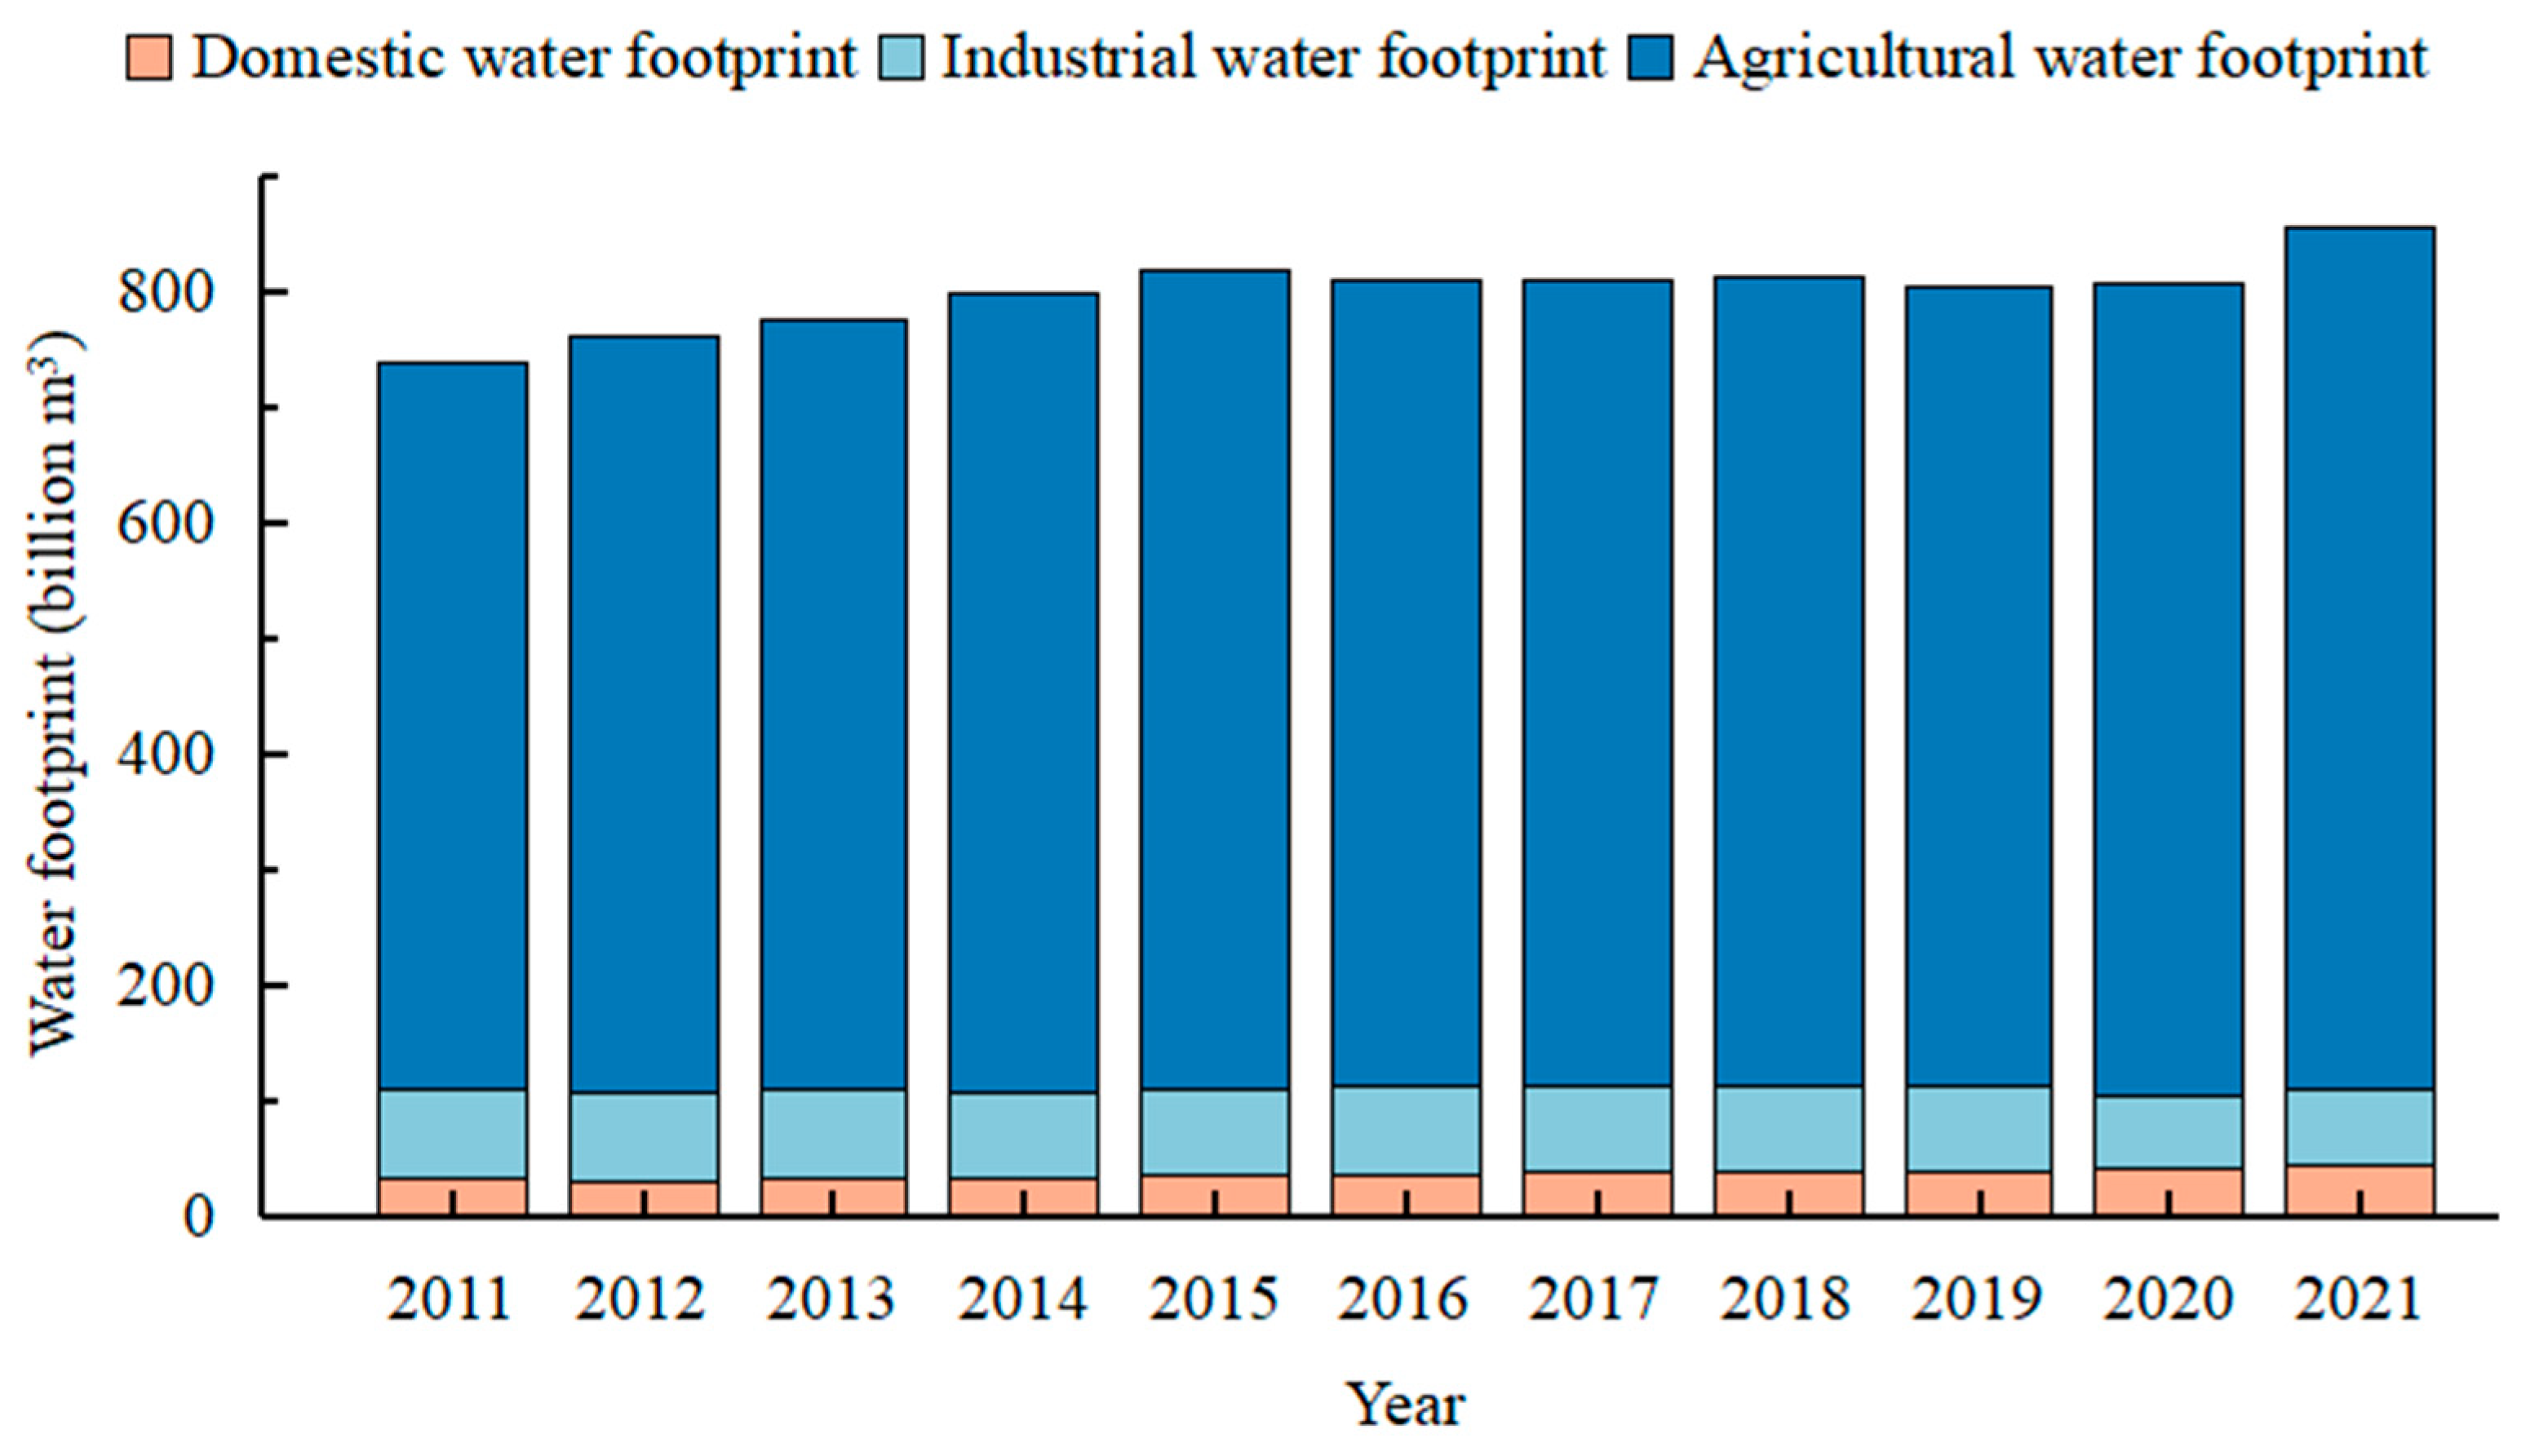
4.1.2. Spatial and Temporal Analysis of Water Footprint Measurement Results by Industry
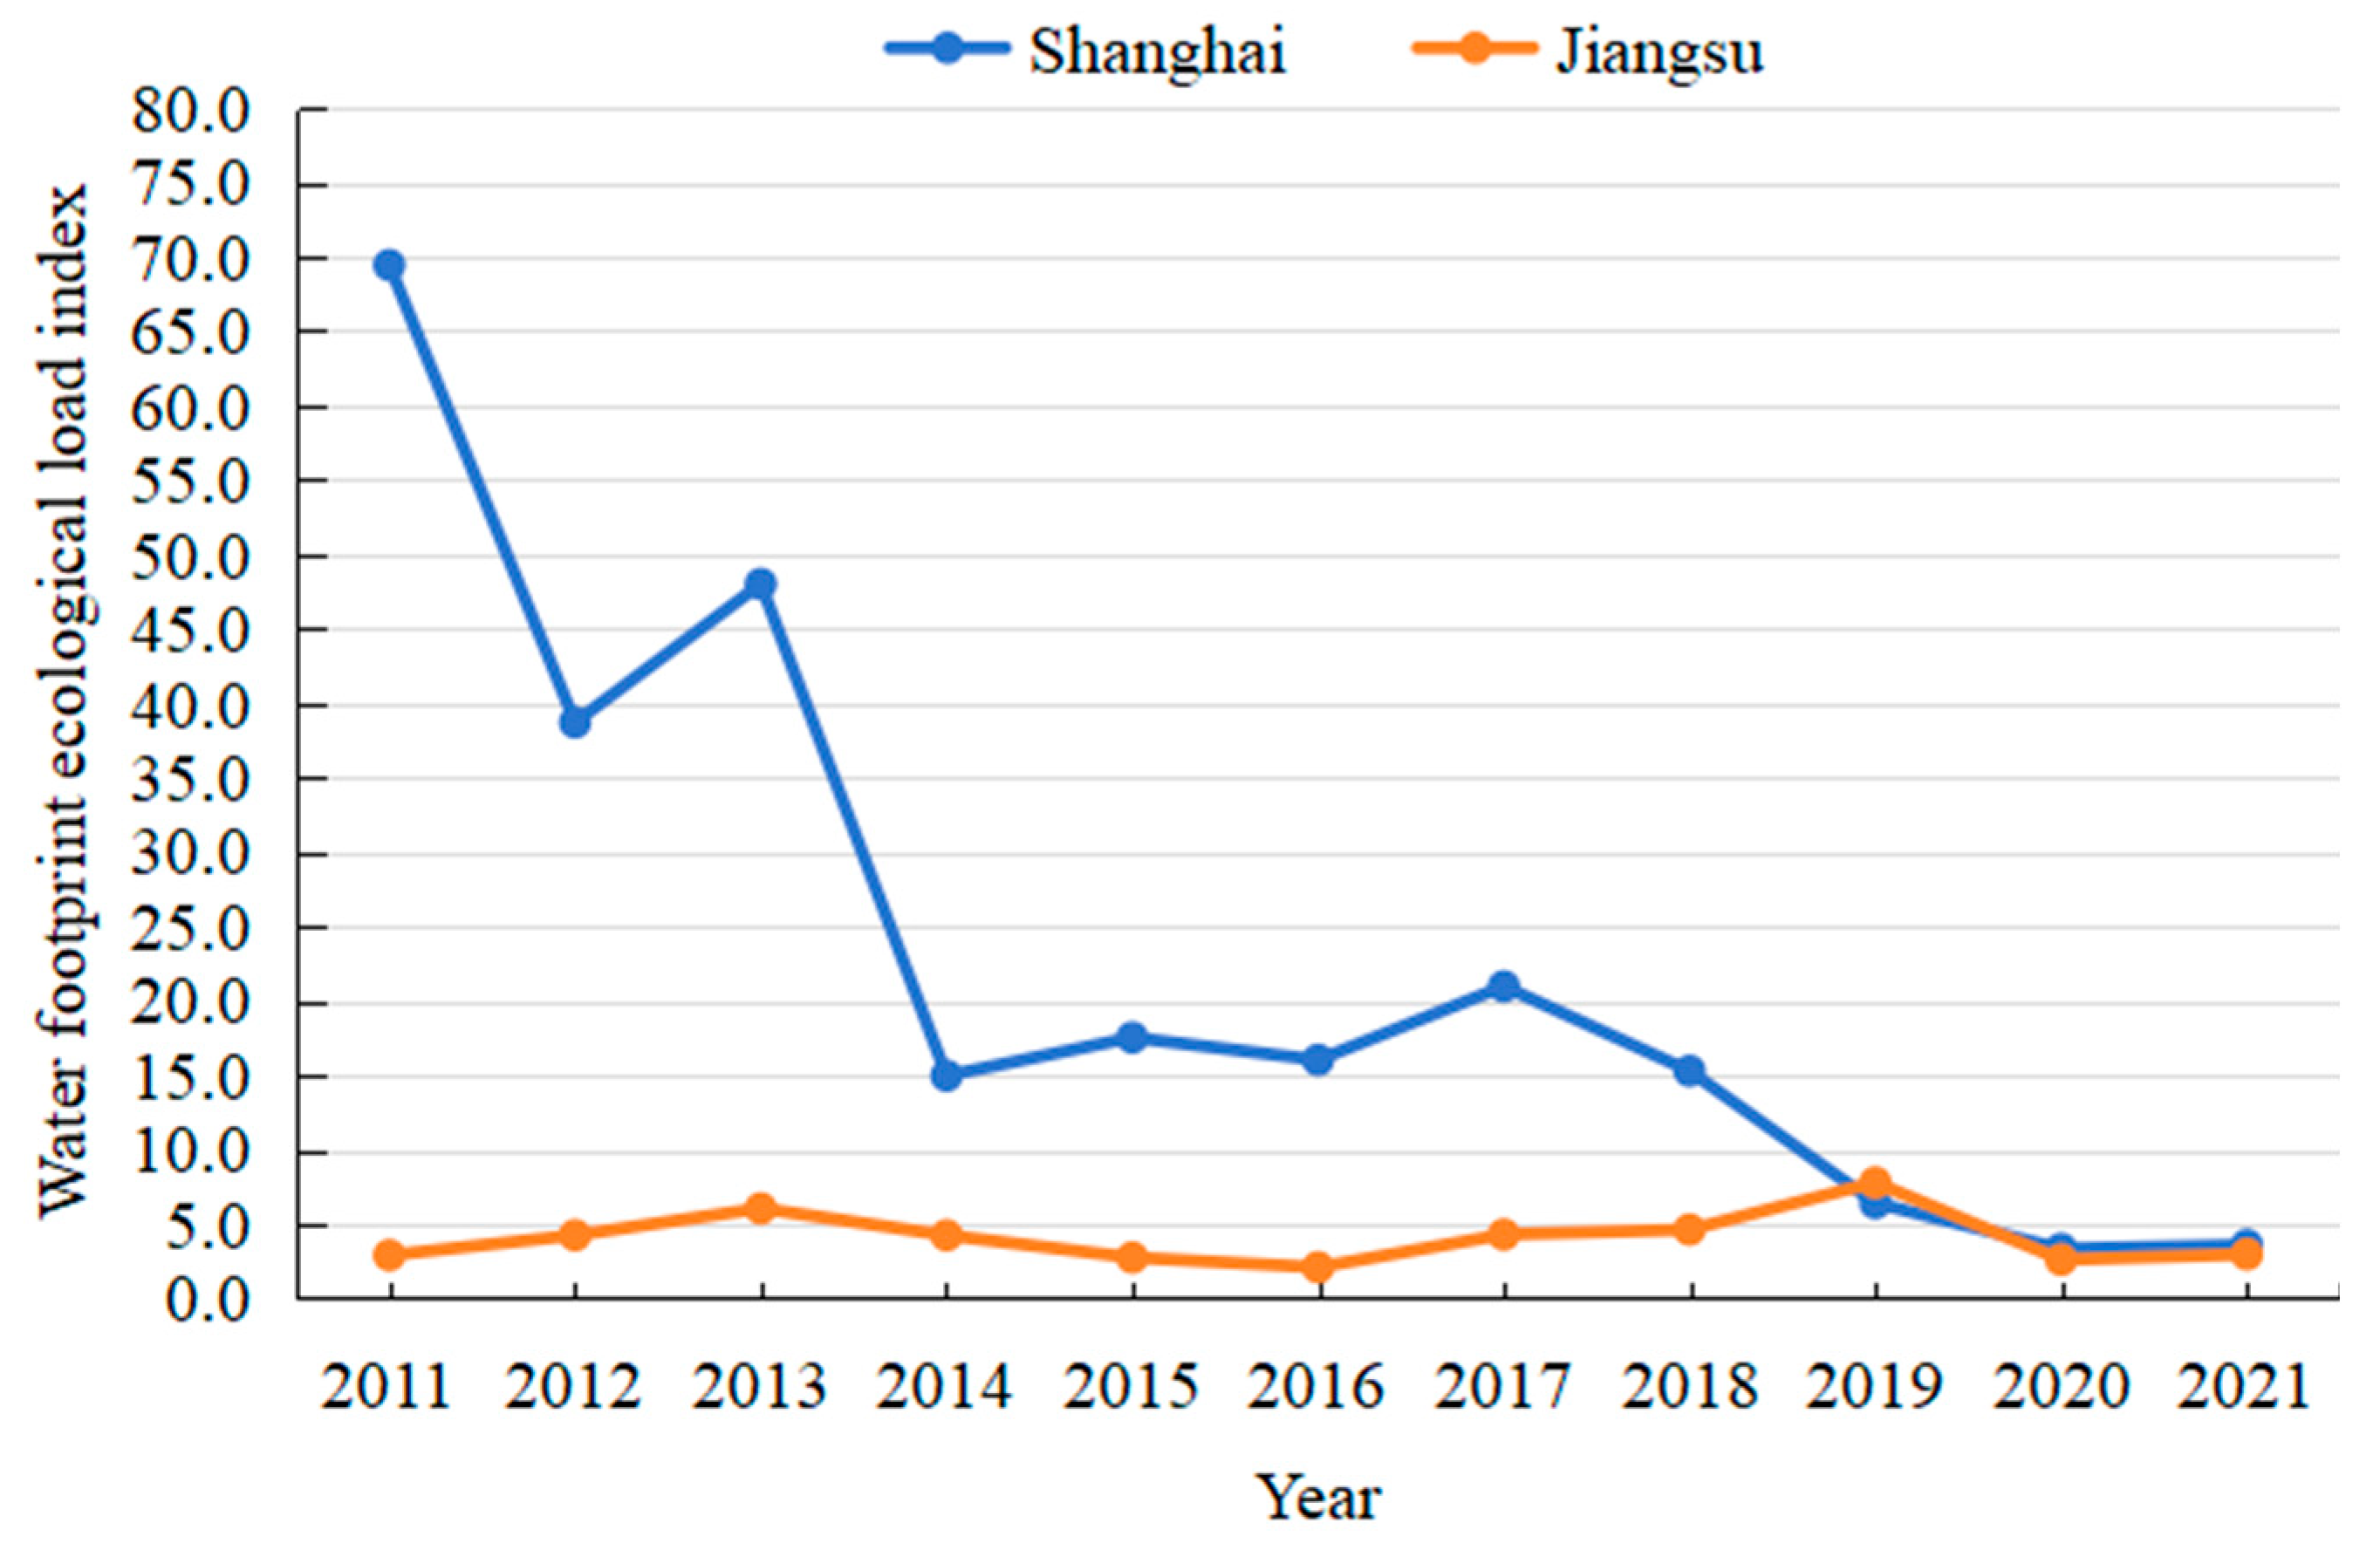
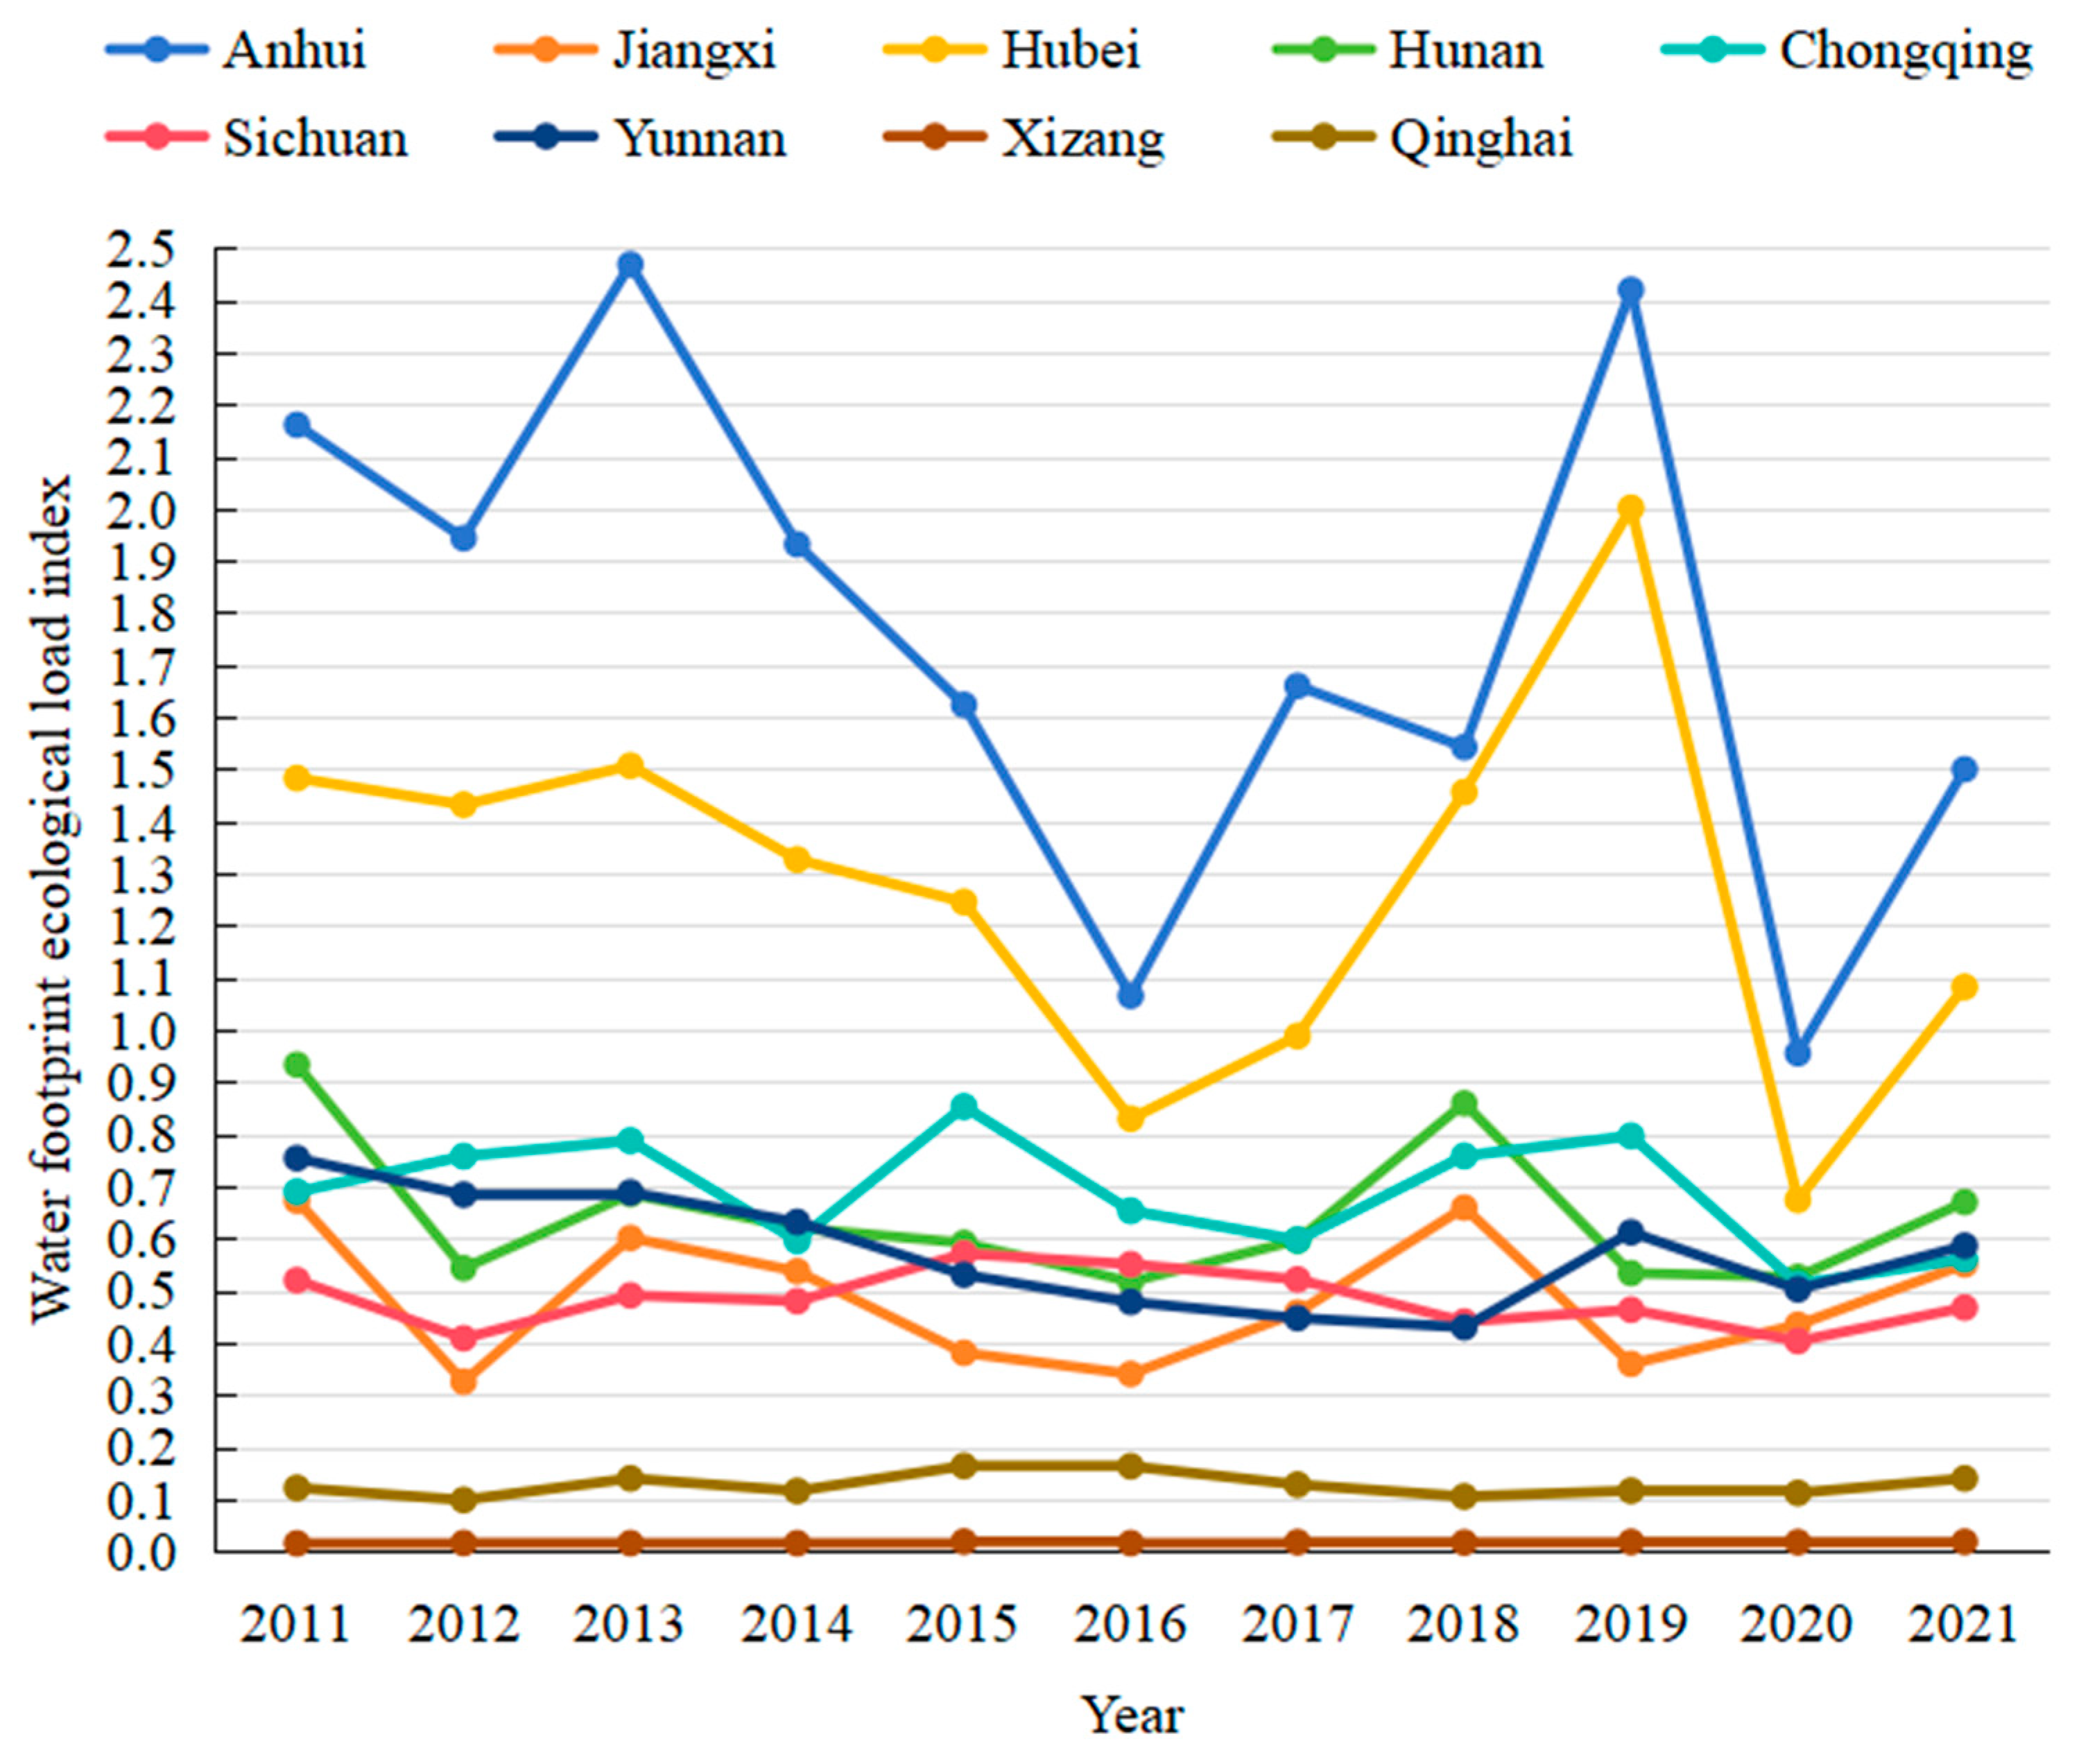
4.2. Calculation Results of Water Footprint Ecological Load Index
4.3. Analysis of the Coordinated Relationship Between Water Resource Utilization and Economic Development in the Yangtze River Basin
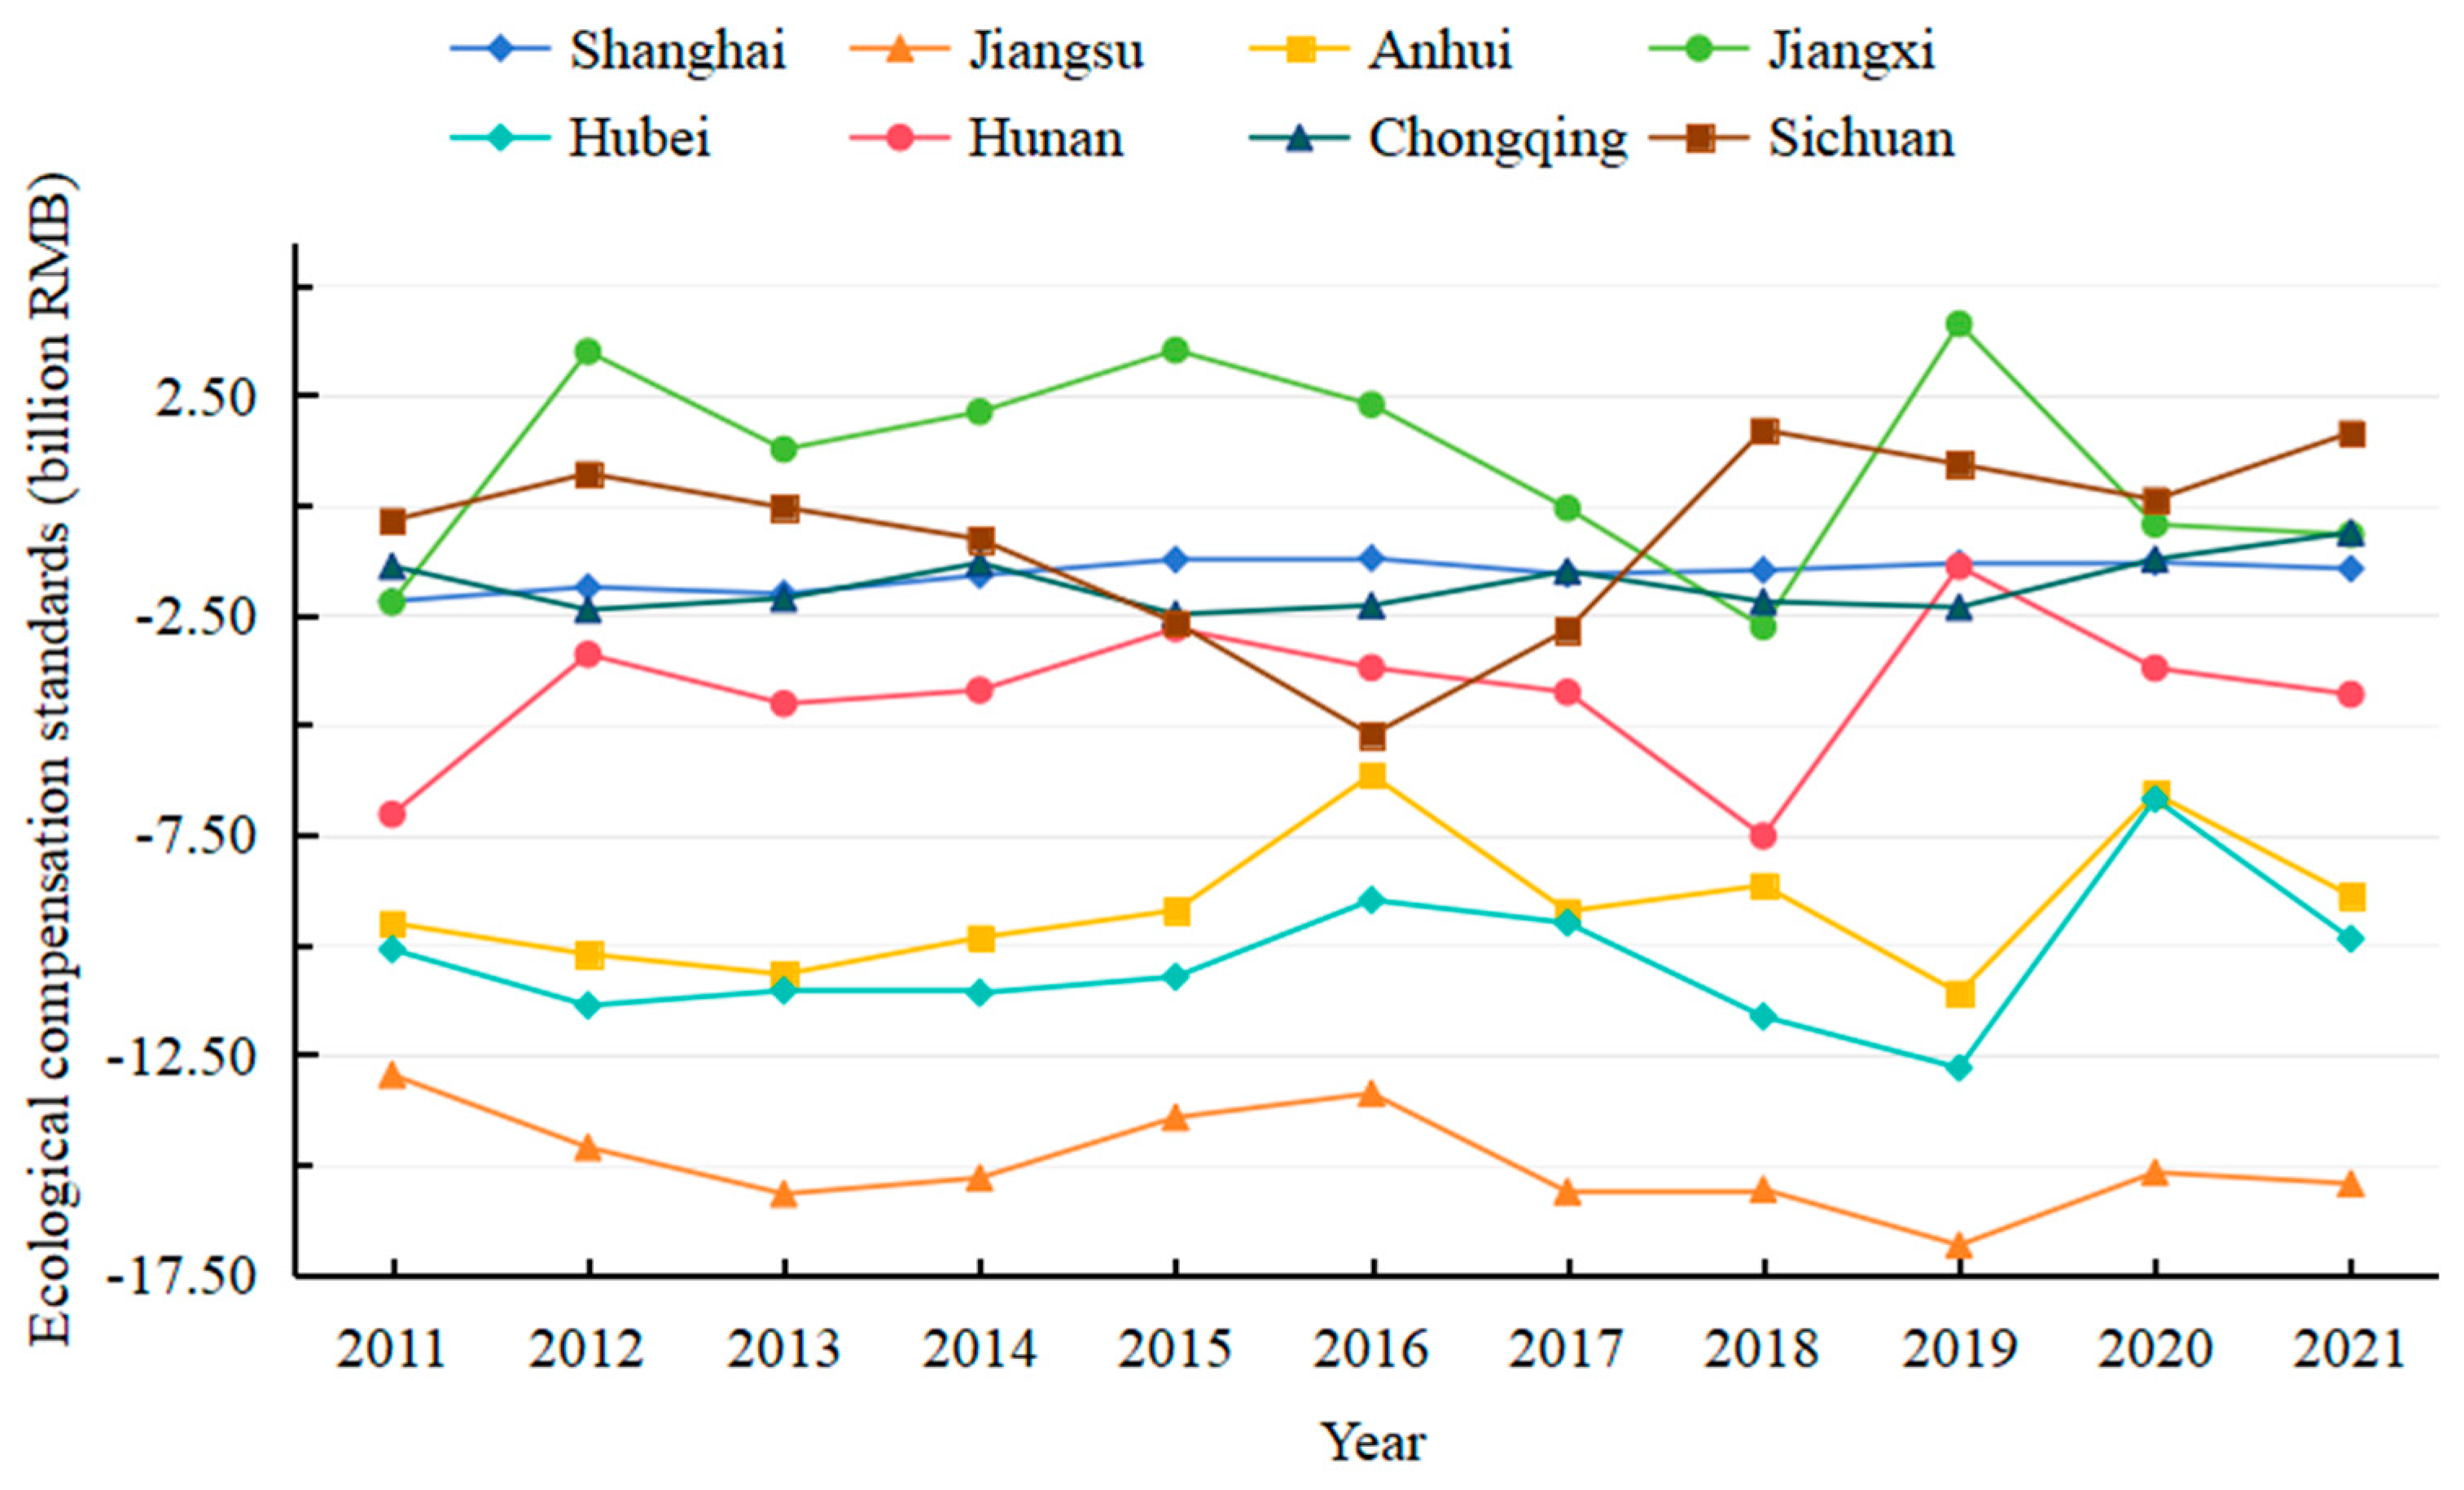
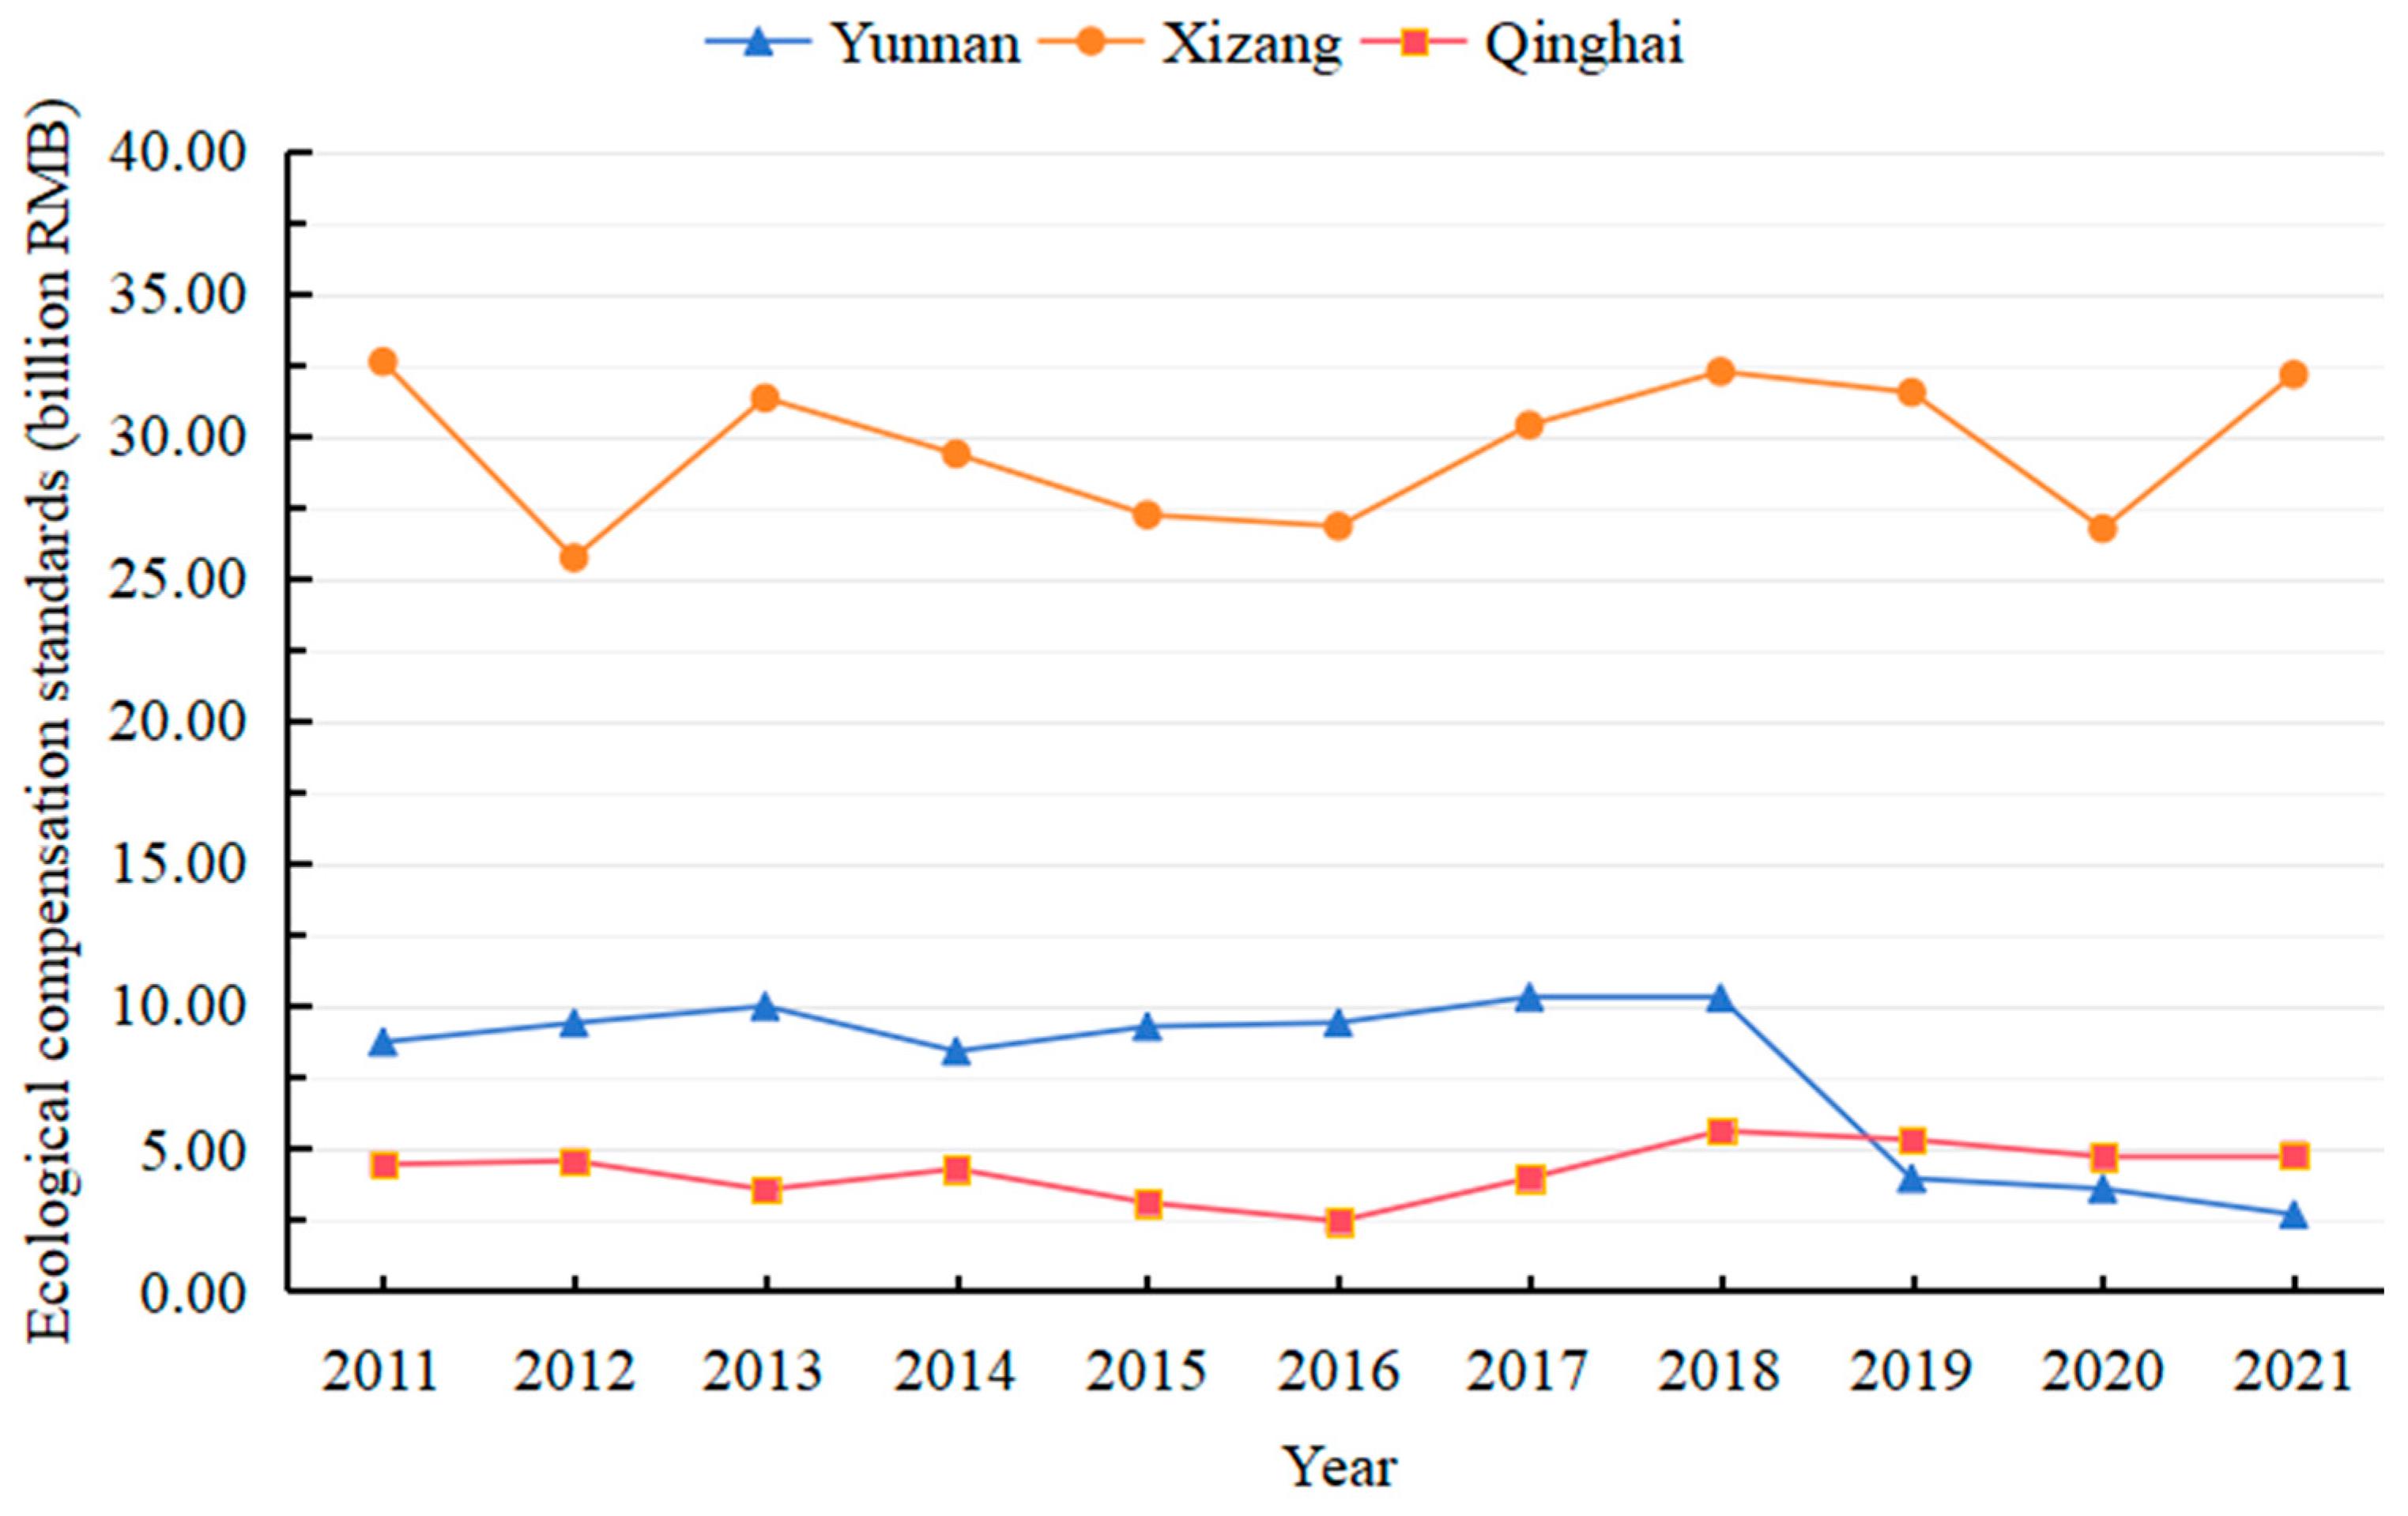
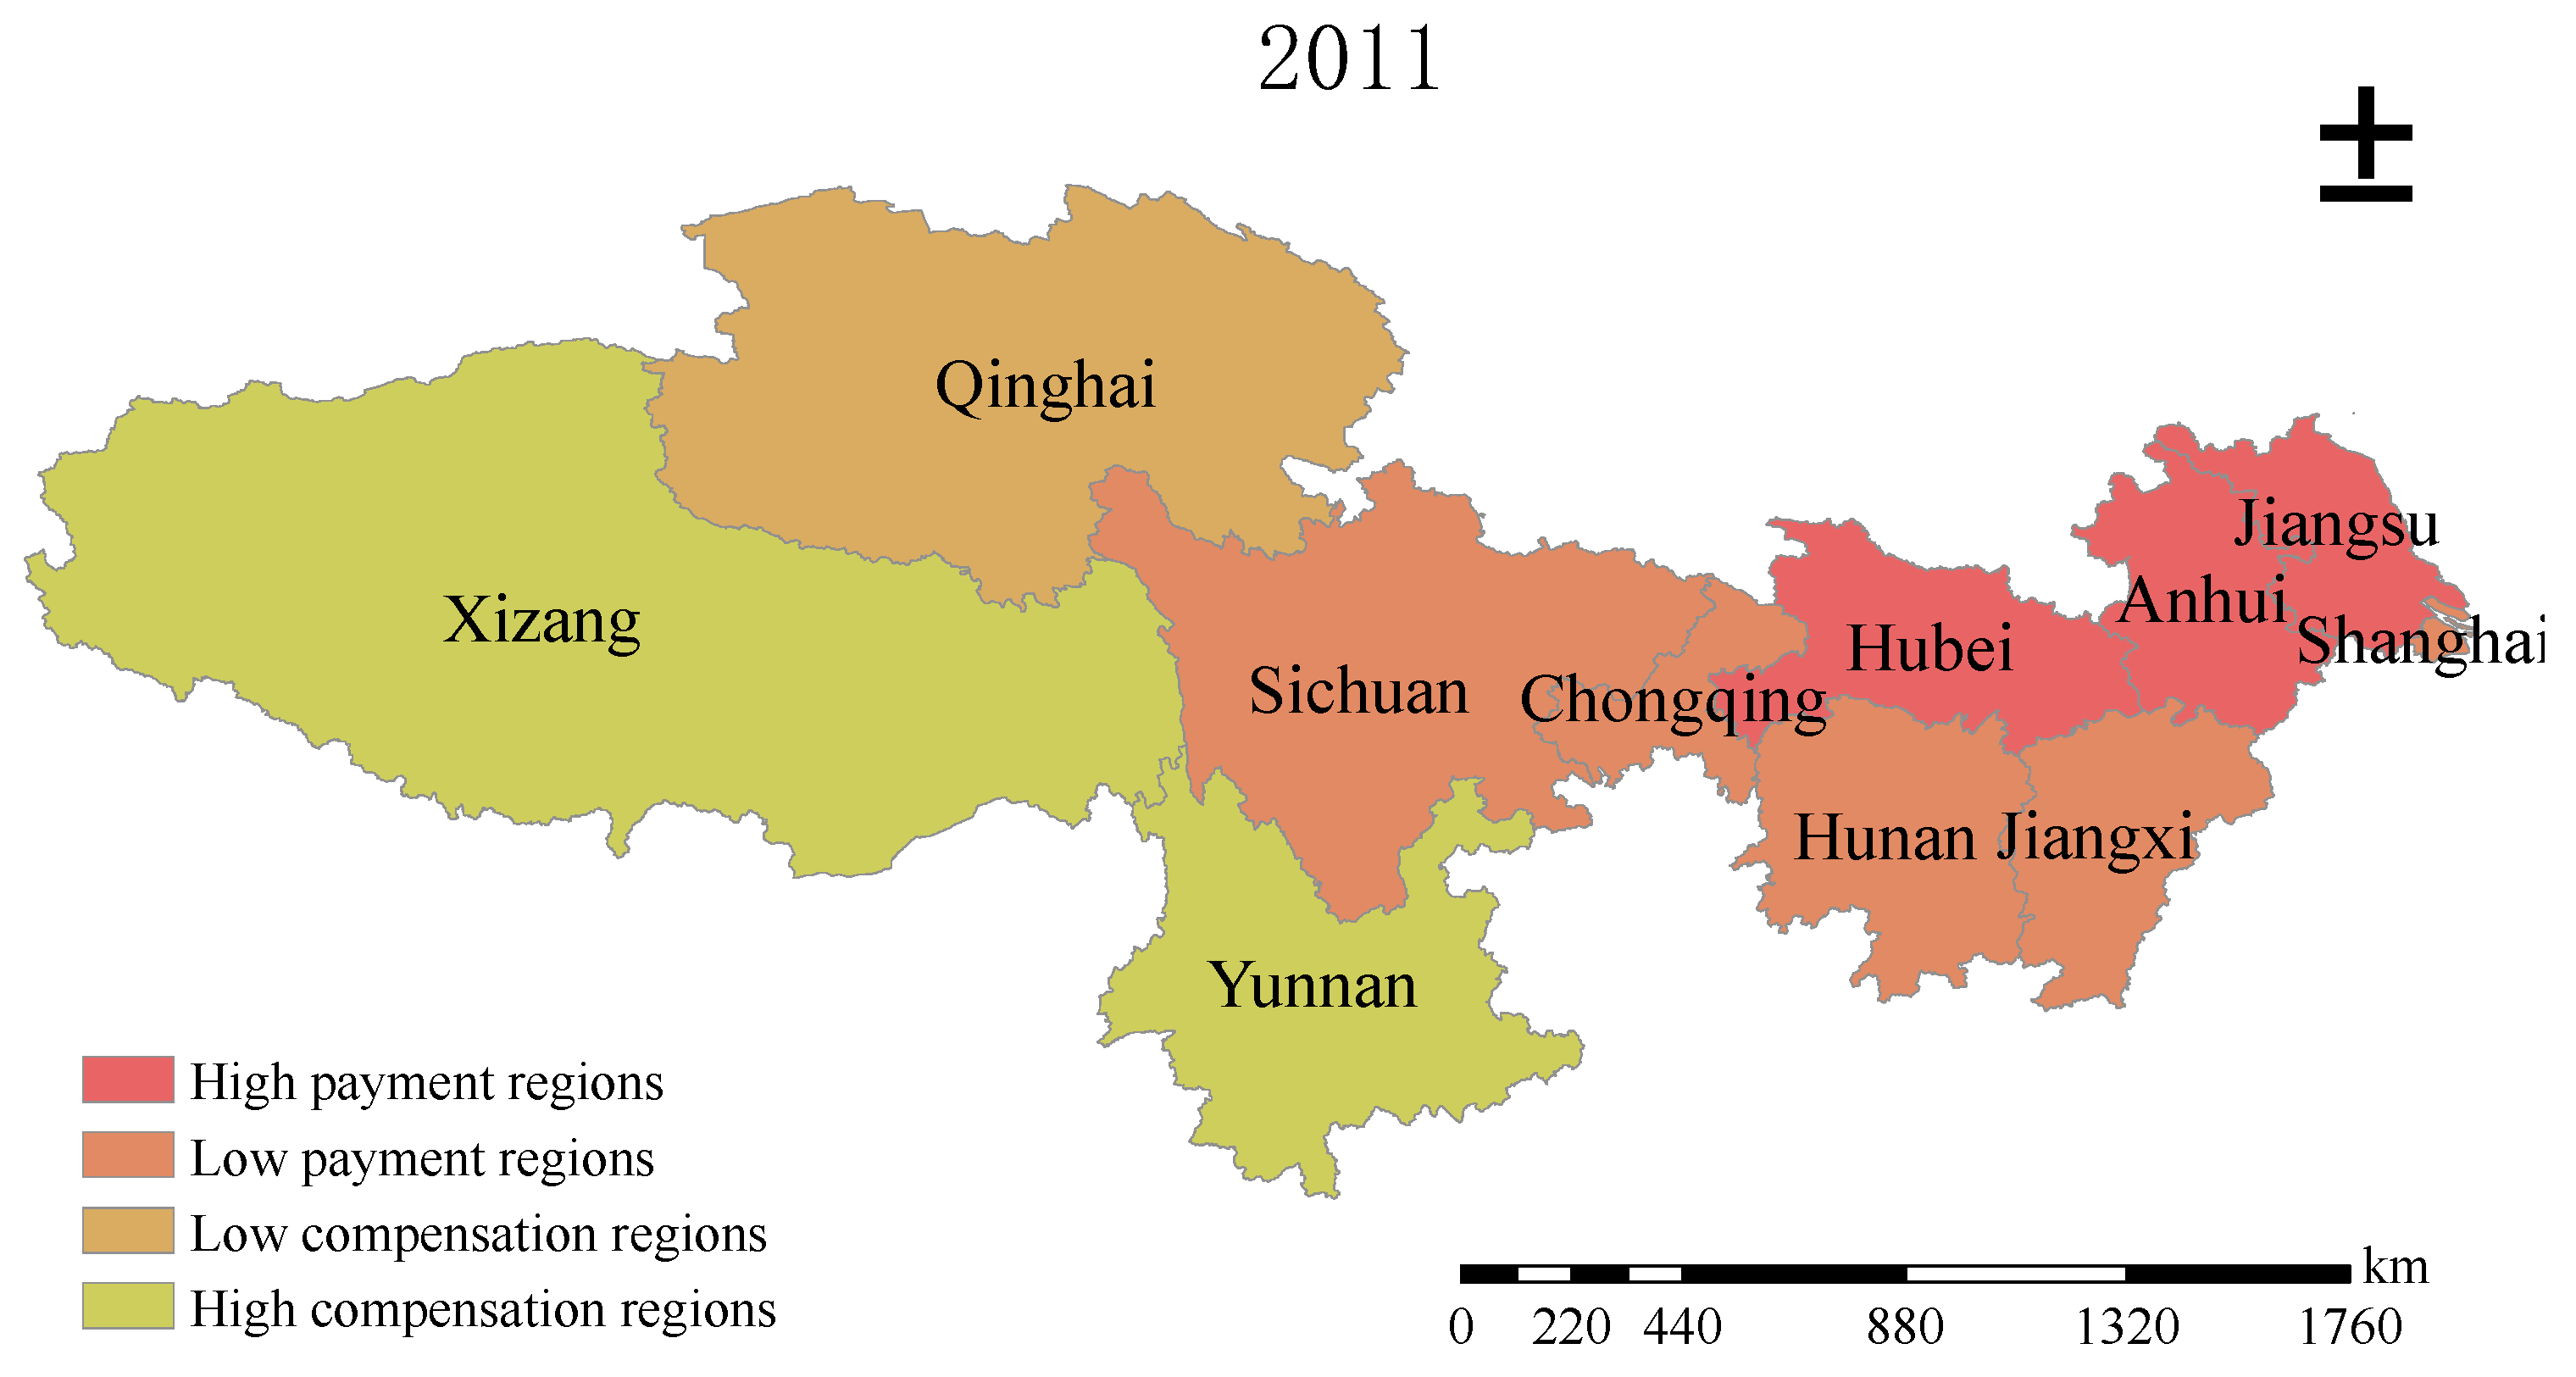
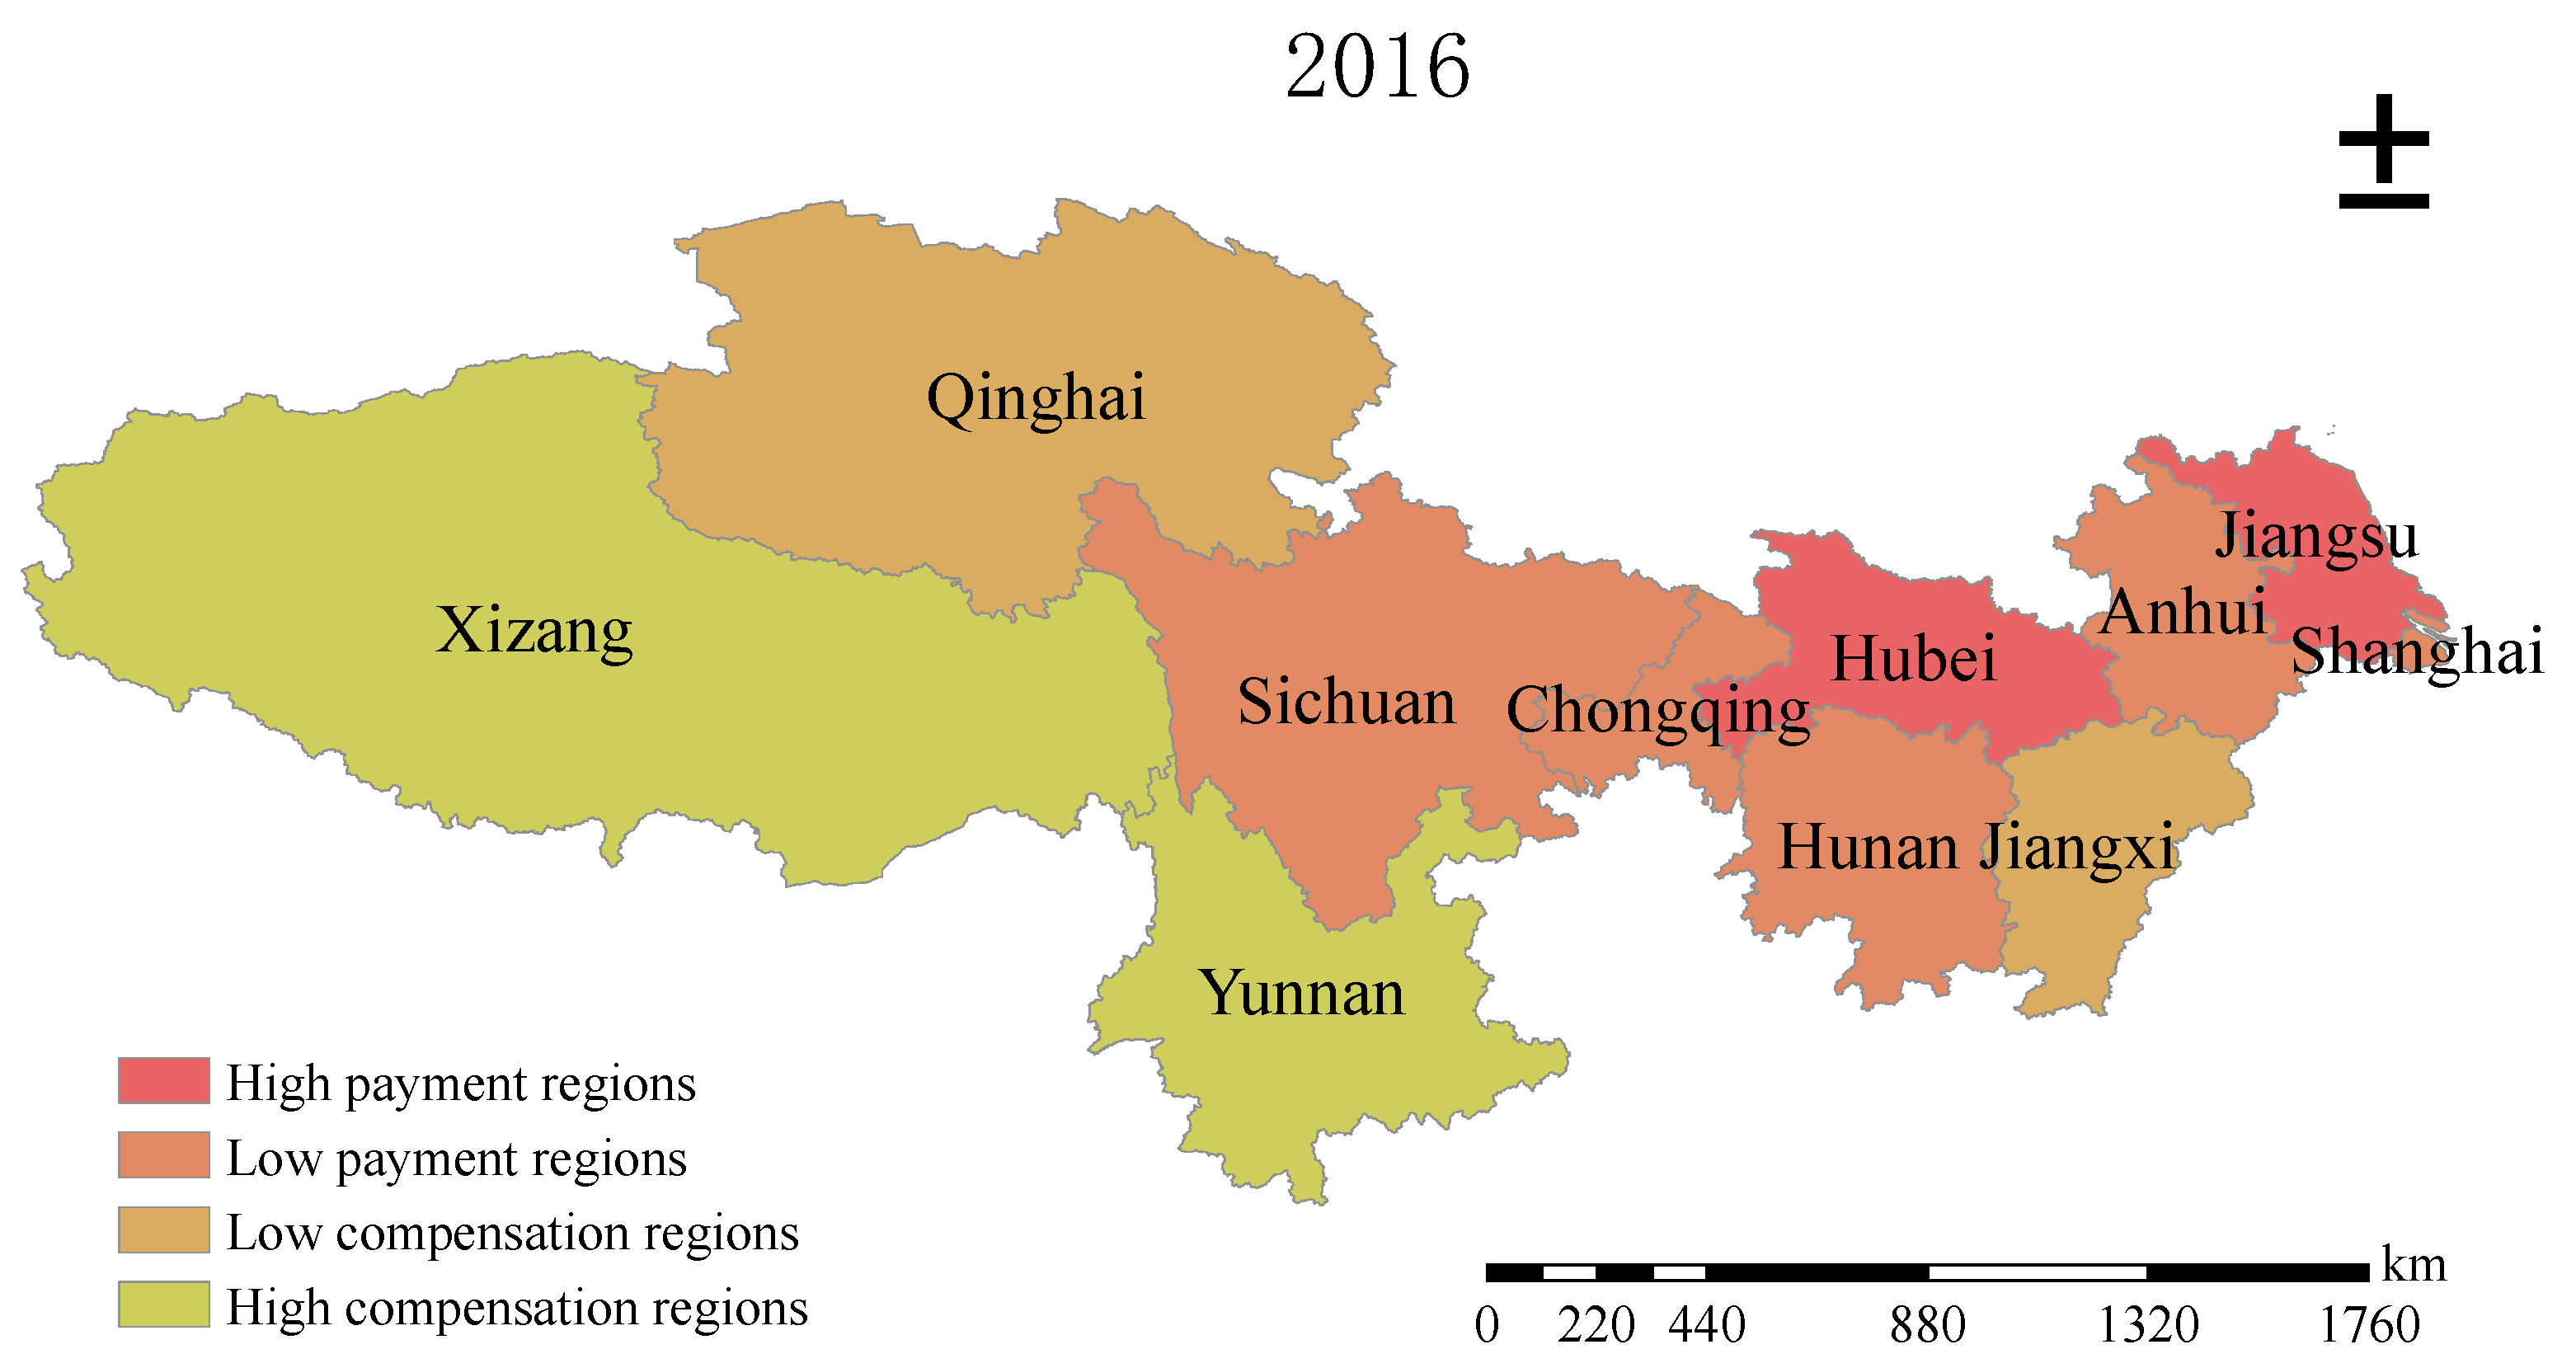
4.4. Ecological Compensation Standards and Spatial Analysis Among Provinces in the Yangtze River Basin
- (1)
- Provinces where the compensation standard has previously shown negative values
- (2)
- Provinces where the compensation standard has consistently been positive over the years
- (3)
- Analysis of ecological compensation type transfer
4.5. Suggestions for the Implementation of Ecological Compensation in River Basins
5. Conclusions and Prospect
5.1. Conclusions
5.2. Limitations
- (1)
- The cultural, social, and other values that may be included in the value of water resources are difficult to quantify accurately.
- (2)
- This paper utilized data from 2011 to 2021, which can be further updated.
- (3)
- The collection of data on water footprints in remote or complex areas poses certain challenges.
5.3. Prospect
Author Contributions
Funding
Institutional Review Board Statement
Informed Consent Statement
Data Availability Statement
Conflicts of Interest
References
- Hoekstra, A.Y. Virtual water trade: Proceedings of the International Expert Meeting on Virtual Water Trade. In Proceedings of the International Expert Meeting on Virtual Water Trade, IHE Delft, The Netherlands, 12–13 December 2002. [Google Scholar]
- Wang, X.; Xu, Z.; Long, A. Preliminary calculation and analysis of China’s water footprint in 2000. J. Glaciol. Geocryol. 2005, 27, 774–780. [Google Scholar]
- Jing, M.; Jian, P. Research progress on water footprint. Acta Ecol. Sin. 2013, 33, 5458–5466. [Google Scholar] [CrossRef]
- He, Z.; Xiang, P. A literature review of water footprint studies. Water Sav. Irrig. 2017, 101–105. [Google Scholar]
- Liu, G.; Wen, Y. The Reform and Innovation Direction of China’s Ecological Compensation Policy in the New Era. Environ. Prot. 2018, 46, 15–19. [Google Scholar] [CrossRef]
- Lin, A.; Shen, L. Effect evaluation of the implementation of eco-compensation mechanism in the Yangtze River Delta. China Popul. Resour. Environ. 2020, 30, 149–156. [Google Scholar]
- Xu, S.; Han, C. Study on Basin Ecological Compensation Mechanism based on Differential Game Theory. Chin. J. Manag. Sci. 2019, 27, 199–207. [Google Scholar] [CrossRef]
- Allan, J.A. ’Virtual Water’: A long-term solution for water-short Middle Eastern economies? In Proceedings of the 1997 British Association Festival of Science, Roger Stevens Lecture Theatre, University of Leeds, Water and Development Session, London, UK, 9 September 1997.
- Hoekstra, A.Y.; Hung, P.Q. Virtual water trade: A quantification of virtual water flows between nations in relation to international crop trade. Water Sci. Technol. 2002, 49, 203–209. [Google Scholar]
- Vanham, D.; Mekonnen, M.M.; Hoekstra, A.Y. The water footprint of the EU for different diets. Ecol. Indic. 2013, 32, 1–8. [Google Scholar] [CrossRef]
- Schyns, J.F.; Hoekstra, A.Y. The added value of water footprint assessment for national water policy: A Case study for Morocco. PLoS ONE 2014, 9, e99705. [Google Scholar] [CrossRef] [PubMed]
- Yin, J.; Wang, H.; Cai, Y. Water footprint calculation on the basis of input-output analysis and a biproportional algorithm: A case study for the Yellow River basin, China. Water 2016, 8, 363. [Google Scholar] [CrossRef]
- Demeke, B.W.; Rathore, L.S.; Mekonnen, M.M.; Liu, W. Spatiotemporal dynamics of the water footprint and virtual water trade in global cotton production and trade. Clean. Prod. Lett. 2024, 7, 100074. [Google Scholar] [CrossRef]
- Chen, X.; Li, S.; Ren, Y. Analysis of the carbon-water footprint of food consumption and its driving effect in urban and rural areas of China from 2000 to 2020. Trans. Chin. Soc. Agric. Eng. 2024, 40, 287–296. [Google Scholar] [CrossRef]
- Guo, Y.; Guo, Y.; Liu, F.; Shen, Y.; Li, K.; Shen, Y. Energy production and water footprint changes in the upper and middle reaches of the Yellow River basin. South--North Water Transf. Water Sci. Technol. 2024, 22, 856–864+908. [Google Scholar] [CrossRef]
- Zhang, X.; Xiao, Y.; Ramsey, T.S.; Li, S.; Peng, Q. Decoupling Agricultural Grey Water Footprint from Economic Growth in the Yellow River Basin. Water 2024, 16, 1129. [Google Scholar] [CrossRef]
- Bazrafshan, O.; Zamani, H.; Etedali, H.R.; Moshizi, Z.G.; Shamili, M.; Ismaelpour, Y.; Gholami, H. Improving water management in date palms using economic value of water footprint and virtual water trade concepts in Iran. Agric. Water Manag. 2020, 229, 105941. [Google Scholar] [CrossRef]
- Fulton, J.; Norton, M.; Shilling, F. Water-indexed benefits and impacts of California almonds. Ecol. Indic. 2019, 96, 711–717. [Google Scholar] [CrossRef]
- Miglietta, P.P.; Morrone, D.; Lamastra, L. Water footprint and economic water productivity of Italian wines with appellation of origin: Managing sustainability through an integrated approach. Sci. Total Environ. 2018, 633, 1280–1286. [Google Scholar] [CrossRef] [PubMed]
- Sun, S.; Wang, Y.; Liu, J.; Wu, P. Quantification and evaluation of water footprint of major grain crops in China. J. Hydraul. Eng. 2016, 47, 1115–1124. [Google Scholar]
- Yu, J.; Long, A.; Deng, X.; He, X.; Zhang, P.; Wang, J.; Hai, Y. Incorporating the red jujube water footprint and economic water productivity into sustainable integrated management policy. J. Environ. Manag. 2020, 269, 110828. [Google Scholar] [CrossRef] [PubMed]
- Nie, H.; Fan, L.; Guo, J.; Zhang, M.; Wang, Z. Spatial and temporal characteristics of crop water footprint and influencing factors in Guanzhong region at the county scale. Arid Zone Res. 2024, 41, 339–352. [Google Scholar] [CrossRef]
- Grimble, R.; Chan, M.K. Stakeholder analysis for natural resource management in developing countries: Some practical guidelines for making management more participatory and effective. Nat. Resour. Forum 1995, 19, 113–124. [Google Scholar] [CrossRef]
- Freeman, A.M.; Herriges, J.A.; Kling, C.L. The Measurement of Environmental and Resource Values: Theory and Methods. Routledge: New York, NY, USA, 2014. [Google Scholar]
- Shu, L. Games between stakeholders and the payment for ecological services: Evidence from the Wuxijiang River reservoir area in China. Peerj 2018, 6, e4475. [Google Scholar] [CrossRef] [PubMed]
- Pagiola, S.; Rios, A.R.; Arcenas, A. Can the poor participate in payments for environmental services? Lessons from the Silvopastoral Project in Nicaragua. Environ. Dev. Econ. 2008, 13, 299–325. [Google Scholar] [CrossRef]
- Engel, S.; Pagiola, S.; Wunder, S. Designing payments for environmental services in theory and practice: An overview of the issues. Ecol. Econ. 2008, 65, 663–674. [Google Scholar] [CrossRef]
- Yuan, G. Quantitative Research of Transboundary Ecological Compensation Standard in Environmental Cost. Account. Res. 2022, 16–31. [Google Scholar]
- Yuan, G.; Zhong, Y.; Du, X. Study on Quantification and Apportionment of Ecological Compensation Standards in Transboundary Basins--Taking the Yangtze River Basin as an Example. Financ. Account. Mon. 2022, 61–72. [Google Scholar] [CrossRef]
- Loomis, J.; Kent, P.; Strange, L.; Fausch, K.; Covich, A. Measuring the total economic value of restoring ecosystem services in an impaired river basin: Results from a contingent valuation survey. Ecol. Econ. 2000, 33, 103–117. [Google Scholar] [CrossRef]
- Clot, S.; Grolleau, G.; Meral, P. Payment Vs. compensation for ecosystem services: Do words have a voice in the design of environmental conservation programs? Ecol. Econ. 2017, 135, 299–303. [Google Scholar] [CrossRef]
- Thu Thuy, P.T.; Campbell, B.M.; Garnett, S.T. Lessons for pro-poor payments for environmental services: An analysis of projects in Vietnam. Asia Pac. J. Public Adm. 2009, 31, 117–133. [Google Scholar] [CrossRef]
- Munoz-Pina, C.; Guevara, A.; Torres, J.M.; Brana, J. Paying for the hydrological services of Mexico’s forests: Analysis, negotiations and results. Ecol. Econ. 2008, 65, 725–736. [Google Scholar] [CrossRef]
- Le Coq, J.-F.; Froger, G.; Pesche, D.; Legrand, T.; Saenz, F. Understanding the governance of the Payment for Environmental Services Programme in Costa Rica: A policy process perspective. Ecosyst. Serv. 2015, 16, 253–265. [Google Scholar] [CrossRef]
- Moran, D.; McVittie, A.; Allcroft, D.J.; Elston, D.A. Quantifying public preferences for agri-environmental policy in Scotland: A comparison of methods. Ecol. Econ. 2007, 63, 42–53. [Google Scholar] [CrossRef]
- Bienabe, E.; Hearne, R.R. Public preferences for biodiversity conservation and scenic beauty within a framework of environmental services payments. For. Policy Econ. 2006, 9, 335–348. [Google Scholar] [CrossRef]
- Arlene, J.; Amponin, R.; Eugenina, M.; Bennagen, C.; Hess, S.; Di, J. Willingness to pay for watershed protection by domestic water users in Tuguegarao city, Philippines. REM Work. Pap. 2007, 14, 73–89. [Google Scholar]
- Xue, J.; Lang, J.; Guan, Y.; Lu, S. Design and measurement of small-scale regional ecological compensation model. Econ. Anal. Policy 2023, 78, 1392–1405. [Google Scholar] [CrossRef]
- Wang, Y.; Yang, R.; Li, X.; Zhang, L.; Liu, W.; Zhang, Y.; Liu, Y.; Liu, Q. Study on trans-boundary water quality and quantity ecological compensation standard: A case of the Bahao Bridge Section in Yongding River, China. Water 2021, 13, 1488. [Google Scholar] [CrossRef]
- Zhang, M.; Hu, P.; Wang, J.; Lall, U. Four-level compensation standards and calculation techniques for water ecological protection in the river source regions in China. Ecohydrology 2022, 15, e2366. [Google Scholar] [CrossRef]
- Liu, Y.; Qu, B.; Jiang, E.; Hao, L.; Zhu, Y.; Jing, Y. Allocating payments for ecosystem services under future multiple scenarios in the Yellow River Basin, China. Ecol. Indic. 2023, 157, 111232. [Google Scholar] [CrossRef]
- Jiao, M.; He, L.; Wang, Y. Regional horizontal ecological compensation and ecosystem service value based on water resources pattern and insurance gain. Ying Yong Sheng Tai Xue Bao=J. Appl. Ecol. 2023, 34, 751–760. [Google Scholar] [CrossRef]
- Chi, C.; Shen, J.; Gao, X.; Hu, P.; Yi, P. Horizontal ecological compensation standards based on ecosystem services flow. Ecol. Indic. 2024, 163, 112081. [Google Scholar] [CrossRef]
- Geng, Y.; Qi, R.; Zhang, P. Study on the standard model of ecological compensation in watershed based on water footprint. China Popul. Resour. Environ. 2009, 19, 11–16. [Google Scholar]
- Su, Y.; Zheng, Q.; Liao, S. Spatio-Temporal characteristics of water ecological footprint and countermeasures for water sustainability in Japan. Int. J. Environ. Res. Public Health 2022, 19, 10380. [Google Scholar] [CrossRef]
- Vliet, M.T.H.; Flörke, M.; Wada, Y. Quality matters for water scarcity. Nat. Geosci. 2017, 10, 800–802. [Google Scholar] [CrossRef]
- GB 3838-2002; Environmental Quality Standards for Surface Water. China Environment Publishing Group: Beijing, China, 2002.
- Shao, S. Study on water resources compensation strategy based on water footprint model. Sci. Technol. Prog. Policy 2013, 30, 116–119. [Google Scholar] [CrossRef]
- OECD. OECD environmental indicators: Development, measurement and use. Sist. Nac. Unidades Conserv. 2003, 25, 37. [Google Scholar] [CrossRef]
- Zhong, T.; Huang, X.; Han, L.; Wang, B. Review on the Research of Decoupling Analysis in the Field of Environments and Resource. J. Nat. Resour. 2010, 25, 1400–1412. [Google Scholar]
- Vehmas, J.; Luukkanen, J.; Kaivo-oja, J. Material Flows and Economic Growth: Linking Analyses and Environmental Kuznets Curves for the EU-15 Member Countries in 1980–2000; Turku School of Economics and Business Administration: Turku, Finland, 2003. [Google Scholar]
- Yang, R.; Wang, T. Decoupling Relationship Analysis of the Coordinated Development Between Water Utilization and the Economy Growth in Jiangxi—Based on Virtual Water Theory. Sci. Technol. Manag. Res. 2015, 35, 95–98+111. [Google Scholar]
- Hu, X.; Fu, C.; Chen, F.; Yang, L. Study on the standard of regional ecological compensation and the spatial temporal pattern based on water footprint. Resour. Environ. Yangtze Basin 2016, 25, 1430–1437. [Google Scholar] [CrossRef]
- Young, R.A. Determining the Economic Value of Water: Concepts And Methods; Resources for the Future: Washington, DC, USA, 2005; pp. 131–132. [Google Scholar]
- Sangal, S. Pricing of irrigation waters in India. Econ. Political Wkly. 1991, 26, 2645–2651. [Google Scholar]
- Feltenstein, A. Money and bond in a social decision-making process. Proc. Water Pricing Conf. Rep. 1984, 13, 59–69. [Google Scholar]
- Zhang, F.; Zhang, Q.; Li, F.; Fu, H.; Yang, X. The spatial correlation pattern of water footprint intensity and its driving factors in China. J. Nat. Resour. 2019, 34, 934–944. [Google Scholar] [CrossRef]


| Products | Grains | Vegetables | Edible Oil | Pork | Beef and Mutton |
|---|---|---|---|---|---|
| Virtual water content | 1.13 | 0.15 | 5.24 | 3.65 | 19.80 |
| Products | Poultry | Eggs | Milk | Fish | Fruits |
| Virtual water content | 3.50 | 3.80 | 1.90 | 5.00 | 1.00 |
| Year | 2011 | 2012 | 2013 | 2014 | 2015 | 2016 | 2017 | 2018 | 2019 | 2020 | 2021 | Average |
|---|---|---|---|---|---|---|---|---|---|---|---|---|
| Shanghai | 16.54 | 15.59 | 16.09 | 14.83 | 14.25 | 13.68 | 13.53 | 13.31 | 12.66 | 12.35 | 13.21 | 14.19 |
| Jiangsu | 116.09 | 118.70 | 122.50 | 125.96 | 127.50 | 127.15 | 127.04 | 127.30 | 127.04 | 126.65 | 131.10 | 125.18 |
| Anhui | 100.75 | 106.67 | 107.50 | 112.07 | 116.36 | 105.93 | 104.97 | 105.59 | 105.55 | 105.95 | 110.96 | 107.48 |
| Jiangxi | 68.55 | 70.23 | 72.43 | 74.31 | 75.57 | 75.02 | 75.04 | 74.53 | 73.18 | 72.49 | 77.13 | 73.50 |
| Hubei | 107.57 | 112.23 | 114.01 | 117.55 | 122.84 | 121.85 | 120.52 | 120.26 | 116.74 | 117.00 | 126.71 | 117.93 |
| Hunan | 104.63 | 107.64 | 107.93 | 111.18 | 113.19 | 113.29 | 113.76 | 114.87 | 111.64 | 111.21 | 119.49 | 111.71 |
| Chongqing | 35.50 | 36.15 | 37.37 | 38.30 | 38.92 | 39.52 | 39.21 | 39.77 | 39.70 | 39.34 | 42.09 | 38.72 |
| Sichuan | 116.47 | 118.26 | 121.30 | 122.76 | 126.76 | 128.93 | 128.68 | 130.14 | 127.42 | 130.64 | 136.77 | 126.19 |
| Yunnan | 54.46 | 57.82 | 59.81 | 62.89 | 64.00 | 64.98 | 67.65 | 68.82 | 69.14 | 71.57 | 78.01 | 65.38 |
| Xizang | 6.92 | 6.91 | 7.14 | 7.10 | 7.38 | 7.53 | 8.55 | 8.11 | 8.28 | 8.30 | 8.26 | 7.68 |
| Qinghai | 8.74 | 8.70 | 8.83 | 9.03 | 9.37 | 9.68 | 9.82 | 9.93 | 10.49 | 11.12 | 11.56 | 9.75 |
| total | 736.21 | 758.92 | 774.90 | 795.98 | 816.14 | 807.55 | 808.76 | 812.62 | 801.85 | 806.61 | 855.31 | 797.71 |
| Year | 2011 | 2012 | 2013 | 2014 | 2015 | 2016 | 2017 | 2018 | 2019 | 2020 | 2021 | Average |
|---|---|---|---|---|---|---|---|---|---|---|---|---|
| Water footprint of agriculturaland livestock product | 626.00 | 651.50 | 665.72 | 688.88 | 705.84 | 695.59 | 697.03 | 699.87 | 690.12 | 704.17 | 746.12 | 688.26 |
| Industrial product water footprint | 78.11 | 76.98 | 77.44 | 74.62 | 75.74 | 75.86 | 74.85 | 74.38 | 72.50 | 62.19 | 65.41 | 73.46 |
| Domestic water footprint | 30.38 | 28.64 | 29.69 | 30.37 | 32.33 | 33.54 | 34.20 | 35.41 | 35.88 | 35.33 | 36.98 | 32.98 |
| Ecological water footprint | 1.72 | 1.80 | 2.05 | 2.11 | 2.23 | 2.56 | 2.68 | 2.96 | 3.35 | 4.92 | 6.80 | 3.02 |
| Total | 736.21 | 758.92 | 774.90 | 795.98 | 816.14 | 807.55 | 808.76 | 812.62 | 801.85 | 806.61 | 855.31 | 797.71 |
| Year | 2011 | 2012 | 2013 | 2014 | 2015 | 2016 | 2017 | 2018 | 2019 | 2020 | 2021 | Average |
|---|---|---|---|---|---|---|---|---|---|---|---|---|
| Shanghai | 69.43 | 38.71 | 48.01 | 14.97 | 17.53 | 16.03 | 20.97 | 15.29 | 6.41 | 3.34 | 3.60 | 23.118 |
| Jiangsu | 2.91 | 4.25 | 6.06 | 4.25 | 2.75 | 2.10 | 4.30 | 4.63 | 7.79 | 2.60 | 2.96 | 4.056 |
| Anhui | 2.16 | 1.94 | 2.47 | 1.93 | 1.62 | 1.07 | 1.66 | 1.54 | 2.42 | 0.96 | 1.50 | 1.752 |
| Jiangxi | 0.67 | 0.33 | 0.60 | 0.54 | 0.38 | 0.34 | 0.46 | 0.66 | 0.36 | 0.43 | 0.55 | 0.484 |
| Hubei | 1.48 | 1.43 | 1.51 | 1.33 | 1.25 | 0.83 | 0.99 | 1.46 | 2.00 | 0.67 | 1.08 | 1.275 |
| Hunan | 0.93 | 0.54 | 0.69 | 0.62 | 0.59 | 0.52 | 0.60 | 0.86 | 0.53 | 0.53 | 0.67 | 0.644 |
| Chongqing | 0.69 | 0.76 | 0.79 | 0.60 | 0.85 | 0.65 | 0.60 | 0.76 | 0.80 | 0.51 | 0.56 | 0.688 |
| Sichuan | 0.52 | 0.41 | 0.49 | 0.48 | 0.57 | 0.55 | 0.52 | 0.44 | 0.46 | 0.40 | 0.47 | 0.484 |
| Yunnan | 0.75 | 0.68 | 0.69 | 0.63 | 0.53 | 0.48 | 0.45 | 0.43 | 0.61 | 0.50 | 0.59 | 0.577 |
| Xizang | 0.02 | 0.02 | 0.02 | 0.02 | 0.02 | 0.02 | 0.02 | 0.02 | 0.02 | 0.02 | 0.02 | 0.017 |
| Qinghai | 0.12 | 0.10 | 0.14 | 0.12 | 0.16 | 0.16 | 0.13 | 0.11 | 0.12 | 0.11 | 0.14 | 0.128 |
| Year | Rate of Change in GDP (%) | Rate of Change in Water Footprint (%) | Decoupling Index | Evaluation Results |
|---|---|---|---|---|
| 2011 | 20.97 | 2.61 | 0.18 | Relative decoupling, primary coordination |
| 2012 | 12.45 | 1.93 | 0.11 | Relative decoupling, primary coordination |
| 2013 | 12.20 | 2.40 | 0.10 | Relative decoupling, primary coordination |
| 2014 | 10.03 | 1.67 | 0.08 | Relative decoupling, primary coordination |
| 2015 | 8.00 | 2.14 | 0.06 | Relative decoupling, primary coordination |
| 2016 | 10.31 | −0.42 | 0.11 | Absolute decoupling, high-quality coordination |
| 2017 | 11.64 | 1.40 | 0.10 | Relative decoupling, primary coordination |
| 2018 | 11.38 | −0.05 | 0.11 | Absolute decoupling, high-quality coordination |
| 2019 | 8.32 | −0.61 | 0.09 | Absolute decoupling, high-quality coordination |
| 2020 | 4.02 | 0.72 | 0.03 | Relative decoupling, primary coordination |
| 2021 | 12.05 | 5.60 | 0.06 | Relative decoupling, primary coordination |
| Year | Shanghai | Jiangsu | Anhui | Jiangxi | Hubei | Hunan | Chongqing | Sichuan | Yunnan | Xizang | Qinghai |
|---|---|---|---|---|---|---|---|---|---|---|---|
| 2011 | −2.19 | −12.96 | −9.51 | −2.21 | −10.11 | −7.04 | −1.39 | −0.35 | 8.72 | 32.61 | 4.42 |
| 2012 | −1.86 | −14.61 | −10.22 | 3.49 | −11.39 | −3.40 | −2.38 | 0.72 | 9.39 | 25.72 | 4.54 |
| 2013 | −2.02 | −15.67 | −10.68 | 1.27 | −11.05 | −4.52 | −2.12 | −0.06 | 9.98 | 31.33 | 3.54 |
| 2014 | −1.60 | −15.31 | −9.84 | 2.12 | −11.10 | −4.21 | −1.32 | −0.78 | 8.40 | 29.37 | 4.26 |
| 2015 | −1.24 | −13.93 | −9.22 | 3.52 | −10.73 | −2.81 | −2.48 | −2.67 | 9.26 | 27.23 | 3.08 |
| 2016 | −1.21 | −13.39 | −6.14 | 2.28 | −8.99 | −3.70 | −2.29 | −5.23 | 9.40 | 26.83 | 2.43 |
| 2017 | −1.57 | −15.62 | −9.24 | −0.07 | −9.51 | −4.26 | −1.51 | −2.84 | 10.30 | 30.38 | 3.94 |
| 2018 | −1.48 | −15.57 | −8.65 | −2.77 | −11.64 | −7.53 | −2.20 | 1.71 | 10.27 | 32.26 | 5.60 |
| 2019 | −1.33 | −16.84 | −11.10 | 4.12 | −12.81 | −1.40 | −2.32 | 0.93 | 3.93 | 31.53 | 5.29 |
| 2020 | −1.30 | −15.18 | −6.57 | −0.44 | −6.69 | −3.71 | −1.23 | 0.13 | 3.57 | 26.75 | 4.69 |
| 2021 | −1.45 | −15.44 | −8.89 | −0.67 | −9.87 | −4.31 | −0.63 | 1.65 | 2.66 | 32.16 | 4.78 |
Disclaimer/Publisher’s Note: The statements, opinions and data contained in all publications are solely those of the individual author(s) and contributor(s) and not of MDPI and/or the editor(s). MDPI and/or the editor(s) disclaim responsibility for any injury to people or property resulting from any ideas, methods, instructions or products referred to in the content. |
© 2025 by the authors. Licensee MDPI, Basel, Switzerland. This article is an open access article distributed under the terms and conditions of the Creative Commons Attribution (CC BY) license (https://creativecommons.org/licenses/by/4.0/).
Share and Cite
Sun, F.; Pan, D.; Zhang, D.; Guo, J.; Guo, P.; Zhang, X.; Chi, C.; Zhang, S. Study on Quantitative Model of Water Resource Ecological Compensation in Yangtze River Basin Based on Water Footprint–Decoupling Analysis Methodology. Sustainability 2025, 17, 923. https://doi.org/10.3390/su17030923
Sun F, Pan D, Zhang D, Guo J, Guo P, Zhang X, Chi C, Zhang S. Study on Quantitative Model of Water Resource Ecological Compensation in Yangtze River Basin Based on Water Footprint–Decoupling Analysis Methodology. Sustainability. 2025; 17(3):923. https://doi.org/10.3390/su17030923
Chicago/Turabian StyleSun, Fuhua, Daoming Pan, Dandan Zhang, Jiayi Guo, Ping Guo, Xiaojie Zhang, Chen Chi, and Shengnan Zhang. 2025. "Study on Quantitative Model of Water Resource Ecological Compensation in Yangtze River Basin Based on Water Footprint–Decoupling Analysis Methodology" Sustainability 17, no. 3: 923. https://doi.org/10.3390/su17030923
APA StyleSun, F., Pan, D., Zhang, D., Guo, J., Guo, P., Zhang, X., Chi, C., & Zhang, S. (2025). Study on Quantitative Model of Water Resource Ecological Compensation in Yangtze River Basin Based on Water Footprint–Decoupling Analysis Methodology. Sustainability, 17(3), 923. https://doi.org/10.3390/su17030923