Abstract
This study aims to provide new evidence linking director tenure to corporate misconduct by analyzing the sample of publicly listed companies in China from 2009 to 2022. The findings reveal a significant positive correlation between director tenure and corporate misconduct, which is negatively moderated by director network position. Further analysis shows that both independent and non-independent directors’ tenure increases the likelihood of corporate misconduct, while the centrality of independent and non-independent director networks negatively moderates these corresponding effects. Moreover, external audit quality plays a mediating role in the relationship between director tenure and corporate misconduct. This study elucidates the boundary conditions and mechanisms of corporate misconduct, supporting the management friendliness hypothesis. It offers practical implications for regulators and policymakers to strengthen board governance and audit oversight, thereby contributing to the research on the prevention of corporate misconduct. The limitations of the study include its geographical focus on the Chinese market, suggesting that future research should explore cross-national differences. These findings provide valuable insights for preventing corporate misconduct and promoting corporate sustainability.
1. Introduction
Corporate misconduct is prevalent globally and has become a significant factor influencing corporate governance and market stability. In recent years, a series of irregularities frequently observed at listed companies—such as fictitious profits, fraudulent listings, the illegal trading of shares, unauthorized guarantees, and market price manipulation—have severely undermined investor interests, and they pose remarkable threats to the health and sustainable development of the securities market. As a result, the governments of various countries are actively seeking effective strategies to prevent and mitigate corporate misconduct. However, according to the U.S. Securities and Exchange Commission (SEC) and other international regulators, the number of corporate misconduct cases investigated and addressed each year continues to grow, and penalties continue to increase. Despite these efforts, corporate misconduct persists, indicating that existing governance and regulatory mechanisms are inadequate in deterring corporate wrongdoing. Therefore, determining how to effectively prevent and respond to corporate misconduct, improve the efficiency of corporate governance, and promote the sustainable development of the economy and capital markets has become a crucial issue.
Given the wide-ranging economic and social impacts of corporate misconduct, substantial research in both academia and practice has explored effective prevention and response strategies for these behaviors. Current research on corporate misconduct primarily focuses on its influencing factors, which can be broadly categorized into two types. The first category examines internal governance mechanisms [1], such as board characteristics [2,3], board diversity [4], board co-option [5,6,7], and the role of independent directors [8]. The second category considers external factors, including local social norms, competition [9], import penetration [10,11], reputation and celebrity [12], government subsidies [13], and independent director networks [14,15]. Among these factors, the role of the board of directors in corporate governance remains a central aspect. As the highest decision-making body in a company, the board’s composition, independence, and operational practices significantly shape management behavior. Understanding the influence of board characteristics, especially director tenure, on corporate misconduct is, therefore, of great theoretical and practical importance. Director tenure, defined as the length of time an individual serves on a company’s board, typically measured in years, reflects the director’s familiarity with the firm’s history, culture, and business. Interest in director tenure and turnover has significantly increased in recent years [16,17]. Current research on director tenure examines its economic impact on internal corporate governance, including dividend policy [18], governance effectiveness [19], director monitoring and advisory effectiveness [20], board task performance [21], and corporate transparency [22]. While many studies highlight the benefits of a longer tenure, such as increased knowledge of corporate information and closer ties with management, there remain inconsistencies in findings regarding its overall impact on corporate governance.
Some studies suggest that extended director tenure leads to better corporate oversight due to increased familiarity with the company (expertise hypothesis), while others believe that it can reduce directors’ independence and weaken their monitoring function, thus increasing the likelihood of misconduct (management friendliness hypothesis). However, a large amount of the existing research focusing on board composition or the role of independent directors insufficiently elaborates on the impact of director tenure on corporate misconduct, especially when this relationship is moderated by factors such as director network positions. The network position of directors is assessed through the centrality measures derived from social network analysis, which quantifies a director’s position within the connections of the director network. Director network positions help us understand how a director is connected to others on the board, which can enhance the director ability to influence corporate governance decisions. Specifically, we adopt the following centrality: Degree centrality indicates the number of connections of a director within the director network. Betweenness centrality identifies the directors acting as bridges between different groups of directors. Closeness centrality reflects the access of a director to all other directors in the network. More importantly, how the director networks influence the effects of director tenure on corporate behavior is worthy of further investigation.
This study addresses the following three important research gaps.
The role of director tenure in corporate misconduct: While the influence of director tenure on corporate governance has been well documented, its direct relationship with corporate misconduct has received limited attention. The existing research mainly focuses on the general impact of director tenure on governance but neglects its specific influence on corporate misconduct [23,24].
The moderating role of the director network position: The influence of director networks on corporate misconduct is recognized, but few studies have explored how the network positions of directors, such as their centrality in the network, moderate the relationship between tenure and corporate misconduct [25]. This study bridges this gap by integrating social network theory with literature regarding corporate governance to understand how directors’ network positions can mitigate the negative impact of extended tenure on corporate oversight.
The mediating role of external audit quality: Previous research highlights the importance of external audits in corporate governance, but their role as a mediator between director tenure and corporate misconduct remains unexplored. This study incorporates external audit quality as a mediating factor to understand how the audit processes alleviate the potential negative effects of extended director tenure on corporate misconduct.
Based on the identified research gaps, the study aims to address the following research questions: (1) Does director tenure have a significant impact on corporate misconduct? (2) How does the network position of directors influence the relationship between director tenure and corporate misconduct? (3) Does external audit quality mediate the effect of director tenure on corporate misconduct?
This study analyzes the impact of director tenure on corporate misconduct using a sample of Chinese A-share listed companies from 2009 to 2022. The results indicate a positive correlation between director tenure and the likelihood of corporate misconduct. Specifically, companies with a longer director tenure exhibit a significantly higher probability of engaging in misconduct compared to those with shorter tenures. Additionally, the network position of directors negatively moderates the relationship between director tenure and the propensity for corporate misconduct. To address endogeneity, this study employs a Heckman two-stage model, an instrumental variables approach, and individual fixed effects. Robustness tests are conducted by varying the measures of director tenure and corporate misconduct, utilizing a manufacturing sample, and excluding the impact of the COVID-19 pandemic. Furthermore, additional analyses reveal that both independent and non-independent directors with longer tenures increase the likelihood of corporate misconduct, while their network positions negatively moderate this relationship. Mechanistic analysis further indicates that external audit quality mediates the impact of director tenure on corporate misconduct.
The main contributions of this study can be summarized as follows.
First, this paper enhances the understanding of the factors influencing corporate misconduct. Unlike previous studies that have examined corporate misconduct through social network theory, agency theory, and internal governance mechanisms—focusing on factors such as director networks, board size, board diversity, and board independence—this paper applies the management friendliness hypothesis and expertise hypothesis to explore the impact of director tenure on corporate misconduct in greater depth. This study extends the theoretical application of board governance in corporate misconduct and corporate sustainability.
Second, this study identifies critical moderating variables and adopts an innovative methodology. While prior studies have primarily focused on the impact of director networks on corporate misconduct [26,27,28], they have not incorporated models that examine the effects of director tenure on corporate misconduct. By integrating social network theory, agency theory, and resource dependence theory, this study reveals, for the first time, the significant moderating role of director network position within this framework. This novel integration provides a robust theoretical foundation to support governments in preventing corporate misconduct and to assist firms in enhancing governance efficiency.
Finally, this study elucidates boundary conditions and mechanisms. It not only clarifies the contextual constraints on the impact of director tenure on corporate misconduct but also, for the first time, reveals a new mechanism through which long-serving directors influence firms’ propensity for misconduct: external audit quality.
2. Theoretical Analysis and Hypothesis
2.1. Director Tenure and Corporate Misconduct
The relationship between director tenure and corporate misconduct has been debated, with two competing hypotheses, comprising the management friendliness hypothesis and the expertise hypothesis. The management friendliness hypothesis suggests that extended director tenure can inhibit directors’ independence. As directors become more familiar with management, their supervision and management abilities are diminished, leading to an increased likelihood of corporate misconduct. On the other hand, the expertise hypothesis indicates that directors accumulate more firm-specific knowledge and improve the supervision and management abilities as directors’ tenure increases. The enriched experience is further believed to reduce the likelihood of corporate misconduct. In this study, we propose two competing hypotheses, comprising Hypothesis H1 and H2.
According to the management friendliness hypothesis, long-serving directors may become more lenient in supervising management, thereby reducing the effectiveness of board oversight and diminishing their willingness to discipline management’s misconduct [29,30]. Directors in their first term at a listed company typically lack strong social or personal ties to the majority shareholder and management, making them more likely to adhere to norms that uphold their independence and enhance their monitoring role. However, long-serving directors often cater to management’s preferences [18]. Vafeas [19] notes that long-serving directors are more inclined to build close relationships with managers, which undermines their monitoring effectiveness—a view supported by Huang and Hilary [31]. Extended board tenure fosters stronger relationships between directors and managers through repeated interactions and social connections, potentially eroding the true independence of independent directors and impairing their monitoring role [32]. The longer a director’s tenure, the more likely they are to be influenced by the CEO [33], who may confer prestige and favors by recommending them for other board positions or praising their contributions within the corporate sector [34]. Consequently, long-serving directors are susceptible to the CEO’s ingratiating efforts [35], reducing their incentive to oversee management violations. Nili [33] refers to long-serving directors as “neo-insider” directors. Additionally, the trench hypothesis suggests that longer tenure negatively impacts monitoring effectiveness. Team members with extended working relationships tend to anticipate each other’s opinions, limit external communication, and narrow their information sources [36]. Beasley [7] argues that long-serving directors may become entrenched in their roles, making them less responsive to external changes and more prone to complacency and inefficiency. In contrast, newer directors often demonstrate greater independence and vigilance. Golden and Zajac [37] suggest that longer tenure may lead to organizational rigidity, fostering over-reliance on established practices and resistance to new ideas or changes. Huang and Hilary [31] further note that long-serving boards exacerbate principal-agent problems. As a result, long-serving directors are more likely to tolerate poor executive behavior, potentially leading to excessive management practices and financial restatements [19]. Based on these analyses, this study posits that a longer director tenure decreases directors’ motivation to monitor management, thereby increasing the likelihood of corporate misconduct. Accordingly, we propose Hypothesis H1:
H1.
Director tenure is positively associated with corporate misconduct, suggesting that a longer director tenure increases the likelihood of corporate misconduct.
The expertise hypothesis posits that long-serving directors possess superior qualifications, enabling them to monitor management more effectively [19]. Newly appointed directors often lack familiarity with a firm’s operations and face challenges in obtaining sufficient information for effective oversight due to limited time and experience. However, as tenure extends and experience accumulates, directors become more knowledgeable about the company’s operations and financial situation, thereby enhancing their monitoring competence [38,39]. From the perspective of internal information acquisition, directors must obtain adequate information to fulfill their monitoring role. Long-serving directors benefit from greater work experience, heightened reputational concerns, and a stronger commitment to their careers. Additionally, the close relationships developed with management over time grant them access to company- and industry-specific information, as well as a deeper understanding of management styles [31]. Well-informed directors are more effective as monitors and advisors [40,41,42]. Dou [38] argues that long-serving directors offer advantages, as they have worked with multiple CEOs, accumulated significant financial stakes, and gained increasing influence over the current CEO, thereby improving their ability to evaluate and oversee management. Consequently, longer-tenured directors possess more information than their newer counterparts, enabling them to better fulfill their monitoring role and reduce corporate misconduct. Research has shown that longer director tenure is associated with better firm performance [43], fewer corporate scandals [43], fewer misleading financial disclosures [44], lower audit fees [45], and higher corporate transparency [22]. Based on these analyses, this study posits that longer director tenure enhances directors’ ability to monitor management, thereby reducing the likelihood of corporate misconduct. Accordingly, we propose Hypothesis H2:
H2.
Director tenure is negatively associated with corporate misconduct, suggesting that longer director tenure decreases the likelihood of corporate misconduct.
2.2. Moderating Role of Directors’ Network Position
Director networks refer to the connections formed between board members of one company and those of other companies. These networks are established when directors serve on multiple corporate boards simultaneously. The inhibitory effect of a director’s network position on corporate misconduct is well documented [27,28]. This study explores its moderating role through two key dimensions.
First, as platforms for information transfer, director networks enhance information channels, improve directors’ regulatory capabilities, and inhibit corporate misconduct. By serving on multiple boards, directors can transfer experiences and best practices across firms [46,47]. This cross-firm learning and experience-sharing enable directors to develop a comprehensive understanding of the challenges firms face and the strategies to address them, thereby strengthening corporate governance. Moreover, director networks play a crucial role in resource allocation [48]. Through these networks, directors gain access to a broader pool of information and resources, enhancing their governance effectiveness. Timely access to corporate information enables directors to proactively reduce the likelihood of non-compliance. Affiliation networks provide directors with robust channels for obtaining critical information, allowing them to exercise timely and effective oversight to prevent misconduct. Although long-serving directors may experience cognitive rigidity, their involvement on other boards mitigates this issue by exposing them to new learning experiences and resources [48]. These external learning opportunities help directors maintain their governance effectiveness over time.
Second, director networks enhance directors’ incentives to monitor corporate behavior by leveraging embedded reputation and social capital. By capitalizing on the monitoring potential of these networks, directors can effectively constrain management’s opportunistic behavior, thereby reducing corporate misconduct. Directors’ monitoring motivations are primarily influenced by their reputations within the director network [49]. Reputation carries significant economic value in the corporate world [50,51,52]. According to social network theory, an actor’s network position directly affects their ability to build and maintain a positive reputation. Through effective oversight, directors can enhance their reputational value in the human capital market, mitigating legal risks and reputational losses associated with corporate malfeasance, which may impact their future career opportunities. Moreover, higher centrality in a director’s network correlates with a greater likelihood of securing additional directorships. This increases their independence in performing oversight duties and reduces concerns about losing board positions due to conflicts with major shareholders or management, thereby promoting more objective and proactive monitoring. Cashman et al. [53] found that higher centrality in director networks significantly enhances the probability of obtaining additional board appointments. Although long-serving directors may lose independence due to excessive familiarity with management and face incentives to maintain their board positions, well-connected directors can leverage their networks to access valuable social capital, including potential board seats at other firms. Consequently, these directors are less concerned about the risk of losing their current positions when opposing major shareholders or management, allowing them to fulfill their supervisory roles more independently and effectively. Based on the above analyses, this study concludes that a director’s network position mitigates the adverse effects of extended director tenure on firms’ propensity to engage in misconduct. Accordingly, Hypothesis H3 is proposed:
H3.
Director network position negatively moderates the relationship between director tenure and corporate misconduct propensity.
In summary, the theoretical model proposed in this study is illustrated in Figure 1.
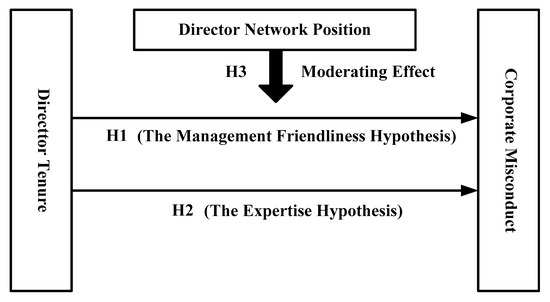
Figure 1.
The conceptual framework of this paper.
3. Data and Methodology
3.1. Data and Sample Selection
Drawing on the work of Xing et al. [27], we selected Chinese A-share listed companies from 2009 to 2022 for the study. The data on corporate misconduct were sourced from the CSMAR breach handling database. Information on director tenure and director network positions was obtained from the listed company profile series in the CSMAR database, as well as from executive profile data in the WIND database. Additional financial data, firm characteristics, and audit-related information for the listed companies were gathered from the CSMAR database.
Preliminary data processing involved several steps: (1) excluding financial and insurance companies; (2) omitting companies with missing data during the sample period; and (3) applying 1% deflation to all continuous variables. Following these procedures, we compiled a sample of 5097 companies, resulting in 43,473 observations in an unbalanced panel dataset. The primary tools used for data processing were Pajek and Stata 17.1.
3.2. Variable Measurement
3.2.1. Dependent Variable
Corporate misconduct is represented as a binary variable, for which a value of 1 indicates that a company engaged in violation activities during a specific year, and a value of 0 signifies no violation. The year of violation is determined by when the violating activity took place, not when it was uncovered. For instances where violating activities occurred over multiple years, the company’s continuous observation results are categorized as violation [27]. Utilizing documents from the listed company fraud database within the CSMAR database, we identified the years of violating activity through regulatory announcements related to violation.
3.2.2. Independent Variable
The explanatory variable in this study is director tenure. To more effectively examine the impact of director tenure on corporate misconduct, we adopted the approach of James et al. [18], who use the average tenure of directors as their measure. The tenure of an individual director is calculated by subtracting the starting year of the director’s tenure from the current year. The tenure of the company’s directors is calculated by taking the logarithm of the average tenure of all directors.
3.2.3. Moderation Variables
This study utilizes the three most frequently used indicators proposed by Freeman [54] to reflect the positional characteristics of the director network from different perspectives: degree centrality, betweenness centrality, and closeness centrality.
Degree centrality: This measures the total number of direct connections a director has with other directors in the network. A director with more direct links is considered to have higher communication activity, broader interaction, and a greater likelihood of occupying a core position in the network.
Mathematically, degree centrality, , for a node, v, is calculated as follows:
where represents the presence of a tie between node v and node i. Nodes with higher degree centrality are more prominent in terms of network connectivity
Betweenness centrality: This indicates the extent to which a director controls the linkage paths between other directors in the network. If a director plays a crucial role in bridging the paths of other directors, they occupy a key node in the network and are relied upon as intermediaries.
The betweenness centrality, , is calculated as follows:
where is the total number of shortest paths between nodes i and j, and is the number of those paths that pass through node v. A higher betweenness centrality indicates greater potential for influence and control in the network.
Closeness centrality: This measures the shortest linkage path between a director and other directors in the network. A director who is closer to others in the network system can exchange information more independently, without relying on intermediaries, thereby facilitating faster and more efficient dissemination of heterogeneous information.
The formula for closeness centrality, , is as follows:
where is the shortest path distance between node v and node i. High closeness centrality indicates that a node can efficiently reach others in the network.
3.2.4. Control Variable
Based on the existing literature [27,28], this study selected specific control variables, including the leverage ratio (Lev), enterprise value (Tobin’s Q), ownership concentration (Top 1), return on net assets (ROE), company size (Size), time to market (Age), board size (Board), state ownership (SOE), institutional investors’ shareholding ratio (Indsh), and CEO duality (Dual). To account for unobservable time and industry-specific effects, year (Year) and industry (Ind) dummy variables are also included. Detailed descriptions of these variables are provided in Table 1.

Table 1.
Definition of variables. The measurement methods for each statistical variable.
3.3. Model Setting
3.3.1. Basic Regression Model
In order to test the effect of director tenure on corporate misconduct, we a logistic model similar to those that were used in previous studies of corporate misconduct [27,28]. This study constructed the basic model 4 to test Hypotheses H1 and H2:
In the equation, the firm is indexed by i, while the year, indexed by t. , is a control variable. and represent year and industry dummy variables. is a random perturbation term. If the coefficient is significantly positive, it indicates that director tenure has a positive effect on corporate misconduct, thus supporting research hypothesis H1 and the management friendliness hypothesis.
3.3.2. Modeling the Moderating Effects of Director Network Position
This study referred to the approach of Dong et al. [55] and established models 5–7 to test the moderating role of director network position on the primacy effect, thus testing Hypothesis H3.
In models 5–7, “ and ” denote the director network position, with all other variables previously described. The coefficient indicates the interaction between director tenure and the director network position. Significantly negative values of indicate that the director network position plays a negative moderating role in the relationship between director tenure and corporate misconduct, thus supporting hypothesis H3.
4. Empirical Analysis
4.1. Descriptive Statistics
From the descriptive statistical analysis of the variables in Table 2, it can be seen that the mean value of the director’s tenure (Tenure) is 4.393, indicating that the average tenure of directors of listed companies is close to four and a half years, but the highest value of Tenure is 13.765, and the lowest value is only 1, indicating that there are large differences in the tenure of different directors (Tenure); in the case of corporate violations, the mean value of corporate violation is 0.235, which indicates that, overall, about 23.5% of the firm-year sample in the sample conducted corporate violations, which is a reasonable distribution of the observed sample. As shown in the last column of Table 2, the variance inflation factors (VIF) of the variables in the model regression are lower than 5, which means that the problem of multicollinearity does not interfere much with the regression results of this paper.
Table 2.
Results of descriptive statistics.
In this paper, the annual samples of listed companies are grouped according to whether corporate misconduct occurred or not, t-tests are conducted on the variable means, and the results are shown in Table 3. The mean director tenure in the corporate misconduct group is higher than that in the non-misconduct group, and the difference between the two is statistically significant. This finding provides preliminary evidence that director tenure has an impact on corporate misconduct. The results for the remaining variables are generally consistent with the existing literature. Compared to non-misconduct companies, companies involved in corporate misconduct exhibit higher mean values for the gearing ratio, listing time, and board size, while the mean values for the shareholding ratio of the largest shareholder, return on net assets, company size, property rights nature, and CEO duality are lower.
Table 3.
Results of t-test for variable means.
4.2. Basic Regression Results
Table 4 presents the regression results of director tenure (Tenure) on corporate misconduct, specifically the results of model 4. Column 1 controls only for year and industry fixed effects, and the coefficient of the explanatory variable director tenure (Tenure) is 0.285, which is significant at the 1 percent level. Column 2, which adds other control variables, has a Tenure coefficient of 0.195, also significant at the 1 percent level. The above results support the management friendliness hypothesis, indicating that a longer director tenure (Tenure) is associated with a higher probability of corporate misconduct. These findings confirm Hypothesis H1. In terms of control variables, the gearing ratio Lev is significantly and positively related to the propensity of corporate misconduct, indicating that the higher the size of the company’s debt, the higher the probability of corporate misconduct occurring. The shareholding ratio Top 1 of the first largest shareholder is significantly negatively correlated with corporate misconduct, indicating that the more concentrated the shareholding structure is, the lower the probability of the existence of corporate misconduct. ROE is significantly negatively correlated with corporate misconduct, indicating that the higher the profitability of the company, the lower the probability of corporate misconduct. Size is significantly negatively correlated with corporate misconduct, indicating that the growth of firm size can reduce the possibility of corporate misconduct.
Table 4.
The regression results for director tenure’s impact on corporate misconduct.
4.3. Moderation Effect Test
Table 5 reports the moderating effect of the systemic director network position on the relationship between director tenure and corporate misconduct. Hypothesis 3 (H3) is tested in columns 1–3, which predicts that director network position negatively moderates the effect of director tenure on corporate misconduct. As shown in columns 1–3 of Table 5, the interaction terms of all three measures of director network position and director tenure are negatively associated with corporate misconduct and are significant at the 1% level. The results of models 5–7, therefore, support the prediction of H3, indicating that director network position mitigates the impact of director tenure on corporate misconduct.
Table 5.
The moderating effect results of director network position.
4.4. Endogeneity Test
4.4.1. Director Tenure and Corporate Misconduct
Endogeneity is a crucial issue when considering the impact of director tenure on corporate misconduct. In this section, the instrumental variables (IVs) approach, Heckman two-stage, one-period lag, and firm fixed effects are used to mitigate endogeneity issues such as omitted variables bias (OVB), reverse causation (RC), measurement error (ME), and sample selection bias. The specific strategies are as follows.
(1) In this section, two instrumental variables are utilized for the analysis, and a weak instrument test is conducted to ensure methodological validity. The first instrumental variable is the mean value of director tenure for companies in the same industry and year (IV1), the results of which are shown in columns 1–2 of Table 6. The second instrumental variable is the mean value of director tenure of companies in the same industry and the same city (IV2), and its results are shown in columns 3–4. As shown in Table 6, the effect of director tenure on corporate misconduct is positive, which is consistent with the results of the basic regression.
Table 6.
Endogeneity test results: Using the instrumental variable approach.
(2) In this section, the Heckman two-stage approach is applied to address the endogeneity problem arising from sample selection bias. In the first stage, the dependent variable is a dummy variable, Tenure_dum, which takes the value of 1 if director tenure (Tenure) is greater than the annual median for this indicator and 0 otherwise. A Probit model is used for the regression analysis to compute the inverse Mills ratio (IMR). In the second stage, the IMR is included as a control variable in the regression analysis. As shown in column 1 of Table 7, the coefficient of the IMR is significant at the 1% level, indicating the presence of selection bias in the sample. Additionally, as shown in column 2 of Table 7, Tenure is significantly and positively associated with corporate misconduct at the 1% level. These results suggest that, even after addressing the endogeneity issue, director tenure still significantly promotes the occurrence of corporate misconduct in listed firms.
Table 7.
Endogeneity test results.
(3) Considering the possible endogeneity problem of mutual causality between the explanatory variable (Tenure) and the explained variable (Violation), this study adopted the lagged effect regression method by lagging Tenure in model 1 by one period. As shown in column 3 of Table 7, director tenure exhibits a significant positive correlation at the 10 percent level after lagging one period. The regression results confirm that the original empirical results remain unchanged even after considering the lagged effect of director tenure on the impact of corporate misconduct.
(4) This paper adopts firm-level fixed effects regressions to control for possible variable omissions. As shown in column 4 of Table 7, the regression coefficient of director tenure after controlling for individual fixed effects is 0.072, which is significant at the 1% level. This indicates that, after controlling for individual fixed effects, the effect of director tenure on corporate misconduct remains significant, supporting Hypothesis H1.
4.4.2. Director Network Position and Corporate Misconduct
Endogeneity is a critical part in this study, particularly in the relationship between director network position and corporate misconduct. Its contemporaneity could arise due to reverse causality (e.g., firms engaged in misconduct might influence director network position) or omitted variables (e.g., firm culture or industry-specific dynamics affects both director network positions and corporate misconduct). To address potential endogeneity issues, we employed the following strategies.
(1) We used instrumental variables for the test and conducted weak instrumental variable tests for methodological verification. The mean value of the director network position of companies in the same industry and the same year was employed as an instrumental variable (IV3–IV5). As shown in Table 8, the director network position is significantly negatively correlated with Violation, which is consistent with the results of Zeng et al. [28].
Table 8.
Endogeneity test results: using the instrumental variable approach.
(2) This study adopts the lagged effect regression method by lagging the director network position by one period. As shown in Table 9, the director network position is significantly negatively correlated with Violation, which is consistent with the results of Zeng et al. [28].
Table 9.
Endogeneity test results: using the lag phase approach.
4.5. Robustness Test
To further validate the results, we employed an additional robustness test, including substitute measures for the dependent variable, independent variable, and moderating variable. We also controlled for industry-specific factors and excluded the potential impacts of the COVID-19 pandemic to ensure the robustness of the results in this study.
(1) Substitution of measurement for dependent variable: This study re-measured corporate misconduct using the logarithm of the number of corporate misconduct incidents (Violation event). The regression results are presented in Table 10, where the coefficient for director tenure in column 1 is 0.01, which is significant at the 1% level, verifying Hypothesis H1. The regression coefficients for the interaction terms (Interaction) between the director network position and director tenure in columns 2–4 are all significantly positive, confirming the test of Hypothesis H3.
Table 10.
Robustness test results: alternative measurement of the dependent variable.
(2) Substitution of independent variable measurement: This study replaced the mean value of director tenure with the median value of director tenure (Tenure_med) at listed companies as a substitute independent variable. The regression results are presented in Table 11, where the coefficient for director tenure in column 1 is 0.228, which is significant at the 10% level and verifies Hypothesis H1. The regression coefficients for the interaction terms between the director network position and director tenure in columns 2–4 are all significantly negative, confirming the test of Hypothesis H3.
Table 11.
Robustness test results: alternative measurement of the independent variable and the moderating variable.
(3) Substitution of the moderating variable measurement: Based on the methodology of Hu et al. [56], this study conducted principal component analysis (PCA) on three indicators of the director network position. The PCA results show that the first principal component provides a robust explanation of the variance across all explanatory variables, with an eigenvalue of 2.123, accounting for 70.79% of the total variance. This section extracts the first principal component and uses it as a substitute variable (Centrality) for the director network position. The regression results are presented in Table 11, where the coefficients for the interaction terms between the director network position and director tenure in column 5 are significantly negative, confirming the test of Hypothesis H3.
(4) In this section, to further control for the influence of industry factors on the regression results, we retain only the annual samples of manufacturing listed companies and re-examine the model. The test results are presented in columns 1–4 of Table 12, and they are largely consistent with the previous conclusions. The regression results confirm that the original empirical findings remain unchanged, even when considering only manufacturing listed companies.
Table 12.
Robustness test results: based on listed manufacturing firms.
(5) In order to exclude the impact of the COVID-19 pandemic on this study, we excluded the annual sample data of listed companies from 2020 to 2022, adjusted the sample period to 2009–2019, and re-examined the model. The regression results in Table 13 are largely consistent with the previous results, and both Hypotheses 1 and 3 are verified.
Table 13.
Robustness test results: exclude the impact of the COVID-19 pandemic.
5. Further Analysis
5.1. Effect of Type of Director
The previous study explored the impact of director tenure on corporate misconduct and the moderating effect of overall director network position without distinguishing between types of directors. Consider that the directors of listed companies include both non-independent and independent directors. Non-independent directors are mainly composed of company managers, who meet more frequently, interact more frequently, and form strong intra-company relationships with each other. On the contrary, independent directors generally originate from universities, accounting and legal intermediaries, industry associations, etc., and they meet relatively less often and interact relatively less frequently, while the relationships between inside directors and independent directors and among independent directors are usually weakly associative [57]. Therefore, whether differences in director types have an impact on the research in this paper is a question worth exploring.
Drawing on the studies by Zeng et al. [28] and Liao Hui et al. [58], this section categorizes the directors of listed companies into independent and non-independent directors. Based on the overall director networks, it constructs separate independent and non-independent director networks. The analysis examines the effects of independent director tenure on corporate misconduct and the moderating role of their network positions, as well as the corresponding effects for non-independent directors. Table 14 presents the regression results for independent director tenure and corporate misconduct. Column 1 shows that the coefficient of independent director tenure is 0.328, which is significant at the 1% level, indicating that independent director tenure significantly contributes to corporate misconduct. Columns 2–4 display the moderating effect of independent director network positions, with the interaction term between independent director tenure and network position showing a significant negative correlation at the 1% level. This suggests that independent director network positions negatively moderate the relationship between independent director tenure and corporate misconduct.
Table 14.
Basic and moderated effects regression results for independent directors.
Table 15 presents the regression results for non-independent directors’ tenure and corporate misconduct. Column 1 shows that the coefficient of non-independent director tenure is 0.148, which is significant at the 1% level, indicating that a longer tenure of non-independent directors significantly contributes to corporate misconduct. Columns 2–4 display the moderating effect of non-independent director network positions. The interaction term between non-independent director tenure and network position is significantly negatively correlated, suggesting that non-independent director network positions negatively moderate the relationship between non-independent director tenure and corporate misconduct. These results indicate that director type does not alter the core finding of the benchmark regression: a longer tenure for both independent and non-independent directors weakens regulatory effectiveness, thereby increasing the likelihood of corporate misconduct. Furthermore, the network positions of both types of directors mitigate the decline in regulatory effectiveness caused by extended tenure, reducing the risk of corporate misconduct.
Table 15.
Basic and moderated effects’ regression results for non-independent directors.
5.2. Modeling and Results of the Mediating Effect of External Audit Quality
External audit quality is widely recognized as a critical component of corporate governance, providing independent oversight that can prevent corporate misconduct [28]. By ensuring that financial reporting adheres to regulatory standards and ethical guidelines, high-quality external audits play a key role in mitigating the risk of misconduct. In this context, the relationship between director tenure and corporate misconduct becomes particularly relevant. Previous research has shown that a longer director tenure may reduce oversight and increase corporate misconduct due to the management friendliness hypothesis. However, we propose that external audit quality may serve as a mitigating factor in this relationship, potentially reducing the likelihood of misconduct even as director tenure increases.
This study investigates the mediating effect of external audit quality on the relationship between director tenure and corporate misconduct. By incorporating external audit quality as a mediating variable, we aim to better understand how high-quality audits influence the governance effects of director tenure, thereby providing new insights into the interaction between corporate governance mechanisms in preventing misconduct.
To test the mediating effect of external audit quality, this section measures external audit quality based on whether listed companies employ international Big4 accounting firms (Big4). Drawing on the research by Zeng et al. [28], we examine the specific pathway through which director tenure influences corporate misconduct. Accordingly, model 8 and model 9 are constructed based on model 4, where Big4 serves as the mediating variable, while all other variables remain consistent with those previously specified.
Table 16 presents the results of the mechanistic analyses. Column 1 shows that the regression coefficient of director tenure on external audit quality is −0.107, significant at the 5% level. This suggests that long-serving directors reduce external audit quality and discourage firms from hiring Big 4 accounting firms. In Column 2, the coefficient of director tenure on corporate misconduct, after introducing the Big4 variable, is 0.161, significant at the 1% level. This indicates that director tenure promotes corporate misconduct. These findings demonstrate that external audit quality mediates the relationship between director tenure and corporate misconduct at listed companies.
Table 16.
Results of the mediation effect test for external audit quality.
6. Conclusions
Preventing corporate misconduct is essential for the sustainable development of listed companies. As a crucial component of corporate governance, the board of directors serves both supervisory and advisory functions. Using data from Chinese A-share listed companies from 2009 to 2022, this study has examined the impact of director tenure on corporate misconduct, along with the moderating effect of director networks on this relationship.
This study draws the following conclusions. First, a longer director tenure significantly increases the probability of corporate misconduct, confirming the management friendliness hypothesis and suggesting that a longer tenure reduces director independence and monitoring efficiency. Second, the moderating effect test indicates that the director network position negatively moderates the relationship between director tenure and corporate misconduct, suggesting that a stronger director network position mitigates the impact of long tenure on corporate misconduct. Furthermore, the analysis reveals that a longer tenure increases the likelihood of corporate misconduct across different types of directors, whether independent or non-independent. Notably, both independent and non-independent director network positions play a negative moderating role in this context. Finally, the results of the mechanism analysis suggest that external audit quality mediates the effect of director tenure on corporate misconduct.
7. Contributions
This research makes several significant contributions to the literature: First, this paper advances corporate governance literature by integrating social network theory and agency theory to address the unexplored relationship between director tenure and corporate misconduct. Second, by investigating the moderating role of the director network position, this study provides a specific understanding of how directors’ social capital influences their governance effectiveness. Finally, the mediating role of external audit quality was examined by introducing a critical governance mechanism that bridges the gap between director tenure and corporate misconduct.
8. Implications
From a micro-level perspective, this paper examines the impact of director tenure on corporate misconduct, aiming to provide government regulators with the following practical policy recommendations.
First, listed companies and regulators should limit director tenure to reduce its adverse effects and improve board governance quality. Regulators can achieve this by implementing rules on director re-election that prevent “cronyism” and the “reverse elimination” phenomenon among board members, thus enhancing the board’s supervisory function. Companies should also establish a regular assessment mechanism for director tenure, reviewing director performance periodically to ensure sustained professionalism and independence. This approach can prevent the erosion of oversight quality that may result from extended tenure.
Secondly, listed companies and regulators should recognize the value of director networks and leverage their positive role to enhance corporate governance efficiency. Listed companies can increase network centrality by recommending their directors to serve on other boards or by hiring directors with multiple board appointments. This approach promotes active exchanges among directors, capitalizing on the “branding effect” and “imitation effect” generated via concurrent directorships to strengthen corporate governance. Regulators should encourage companies to prioritize candidates with high social network centrality, further refine the board system, and foster connections between directors to maximize the governance benefits of director networks and prevent corporate misconduct.
Finally, listed companies and regulators should emphasize the positive role of external auditing in preventing corporate misconduct. To ensure effective monitoring, regulators should strengthen oversight of audit quality by implementing stricter standards across the industry. Additionally, companies are encouraged to enhance the independence and professionalism of their boards and audit committees by increasing the number of independent directors and experts in finance and auditing. These professionals can provide objective supervision of the audit process and help ensure high-quality external audits.
9. Limitations and Future Research
This paper involves several limitations that future research could address. First, due to data collection limitations, this study was restricted to the Chinese market. Future research should expand beyond China to examine whether the impact of director tenure on corporate misconduct varies across countries, providing a broader perspective. Second, board governance is influenced by various sub-committees, such as the audit, strategy, and compensation committees. Future studies could investigate whether the effect of director tenure on corporate misconduct differs across these sub-committees to produce more detailed results.
Author Contributions
Conceptualization, S.Z., Y.L. and C.Y.; methodology, S.Z. and L.X.; software, S.Z. and L.X.; validation, Y.H.; formal analysis, S.Z. and Y.H.; resources, S.Z.; data curation, L.X.; writing—original draft preparation, S.Z., X.J. and Y.L.; writing—review and editing, C.Y.; supervision, X.J. All authors have read and agreed to the published version of the manuscript.
Funding
The authors are grateful for the financial support provided by the Social Science Foundation of Hubei Province of China (22ZD097) and the China University Industry Research Innovation Fund (2019ITA03044).
Institutional Review Board Statement
Not applicable.
Informed Consent Statement
Not applicable.
Data Availability Statement
The data used in this article are mainly from public databases such as CSMAR and WIND.
Conflicts of Interest
The authors declare no conflicts of interest.
References
- Eugster, N.; Kowalewski, O.; Śpiewanowski, P. Internal governance mechanisms and corporate misconduct. Int. Rev. Financ. Anal. 2024, 92, 103109. [Google Scholar] [CrossRef]
- Uzun, H.; Szewczyk, S.H.; Varma, R. Board composition and corporate fraud. Financ. Anal. J. 2004, 60, 33–43. [Google Scholar] [CrossRef]
- Cai, Z.; Wu, S. An empirical study on the influence of board characteristics on listed companies’ irregularities. Nankai Bus. Rev. 2007, 10, 62–68. [Google Scholar]
- Ely, R.J.; Thomas, D.A. Getting serious about diversity. Harv. Bus. Rev. 2020, 98, 114–122. [Google Scholar]
- Bai, M.; Yu, C.F.J. Rookie directors and corporate fraud. Rev. Corp. Financ. 2020, 2, 99–150. [Google Scholar] [CrossRef]
- Zaman, R.; Atawnah, N.; Baghdadi, G.A.; Liu, J. Fiduciary duty or loyalty? Evidence from co-opted boards and corporate misconduct. J. Corp. Financ. 2021, 70, 102066. [Google Scholar] [CrossRef]
- Beasley, M.S. An empirical analysis of the relation between the board of director composition and financial statement fraud. Account. Rev. 1996, 71, 443–465. [Google Scholar]
- Du, X.; Zhang, Y. Rehired Independent Directors and Corporate Misconduct: Learning Effect or Relationship Effect? Financ. Res. 2021, 490, 150–168. [Google Scholar]
- Cao, C.; Chen, L.; Zhang, T. “The Name of the Law”: Judicial Independence Promote and Corporate Violations. Financ. Res. 2017, 443, 191–206. [Google Scholar]
- Kedia, S.; Rajgopal, S. Do the SEC’s enforcement preferences affect corporate misconduct? J. Account. Econ. 2011, 51, 259–278. [Google Scholar] [CrossRef]
- Dupuis, C.; Zheng, Y. Import Penetration and Corporate Misconduct: A Natural Experiment. J. Bus. Ethics 2024, 195, 475–506. [Google Scholar] [CrossRef]
- Han, J.H.; Pollock, T.G.; Paruchuri, S. Public enemies? The differential effects of reputation and celebrity on corporate misconduct scandalization. Strateg. Manag. J. 2024, 45, 2727–2762. [Google Scholar] [CrossRef]
- Raghunandan, A. Government subsidies and corporate misconduct. J. Account. Res. 2024, 62, 1449–1496. [Google Scholar] [CrossRef]
- Wan, L.; Deng, L.; Zheng, X. Network position, governance role of independent directors and corporate violation of rules: Using a Bivariate Probit model with partial observability. Syst. Eng.-Theory Pract. 2014, 34, 3091–3102. [Google Scholar]
- Wang, Z.; Yao, S.; Sensoy, A.; Goodell, J.W.; Cheng, F. Learning from failures: Director interlocks and corporate misconduct. Int. Rev. Financ. Anal. 2022, 84, 102406. [Google Scholar] [CrossRef]
- Sun, X.S.; Bhuiyan, M.B.U. Board tenure: A review. J. Corp. Account. Financ. 2020, 31, 178–196. [Google Scholar] [CrossRef]
- Hoang, C.; Tygesson, G.; Ibok, I. Board Refreshment: Investors Respond to Trends in Mandatory Retirement Age and Tenure with More Stringent Voting Policies. 2016. Available online: https://www.dorsey.com/newsresources/publications/client-alerts/2016/04/investors-mandatory-retirement-age-and-tenure (accessed on 3 December 2024).
- James, H.L.; Wang, H. Independent director tenure and dividends. J. Bus. Financ. Account. 2021, 48, 1057–1091. [Google Scholar] [CrossRef]
- Vafeas, N. Length of board tenure and outside director independence. J. Bus. Financ. Account. 2003, 30, 1043–1064. [Google Scholar] [CrossRef]
- Mooney, A.; Brown, J.; Ward, A. The effects of director tenure on monitoring and advising: New insights from behavioral governance and learning theories. Corp. Gov. Int. Rev. 2021, 29, 479–495. [Google Scholar] [CrossRef]
- Elms, N.; Pugliese, A. Director tenure and contribution to board task performance: A time and contingency perspective. Long Range Plan. 2023, 56, 102217. [Google Scholar] [CrossRef]
- James, H.L.; Ngo, T.; Wang, H. Independent director tenure and corporate transparency. N. Am. J. Econ. Financ. 2021, 57, 101413. [Google Scholar] [CrossRef]
- Singhvi, M.; Munsif, V.; Singhvi, A. CHARACTERISTICS OF DIRECTORS SERVING ON MULTIPLE AUDIT COMMITTEES. Pan-Pac. J. Bus. Res. 2020, 11, 69–82. [Google Scholar]
- Gull, A.A.; Abid, A.; Latief, R.; Usman, M. Women on board and auditors’ assessment of the risk of material misstatement. Eurasian Bus. Rev. 2021, 11, 679–708. [Google Scholar] [CrossRef]
- Wang, Z. The Role of the Director Social Networks in Spreading Misconduct: The Case of Reverse Mergers. SSRN Electron. J. 2015. [Google Scholar] [CrossRef]
- Kuang, Y.F.; Lee, G. Corporate fraud and external social connectedness of independent directors. J. Corp. Financ. 2017, 45, 401–427. [Google Scholar] [CrossRef]
- Xing, J.; Zhang, Y.; Xiong, X.; Li, G. Covering or monitoring? Independent director connectedness and corporate fraud in China. China J. Account. Res. 2022, 15, 100273. [Google Scholar] [CrossRef]
- Zeng, S.; Xiao, L.; Jiang, X.; Huang, Y.; Li, Y.; Yuan, C. Do Directors’ Network Positions Affect Corporate Fraud? Sustainability 2024, 16, 6675. [Google Scholar] [CrossRef]
- Bebchuk, L.A.; Fried, J.M. Executive compensation as an agency problem. J. Econ. Perspect. 2003, 17, 71–92. [Google Scholar] [CrossRef]
- Bebchuk, L.A.; Fried, J.; Walker, D. Managerial power and rent extraction in the design of executive compensation. Univ. Chic. Law Rev. 2002, 69, 751–846. [Google Scholar] [CrossRef]
- Huang, S.; Hilary, G. Zombie board: Board tenure and firm performance. J. Account. Res. 2018, 56, 1285–1329. [Google Scholar] [CrossRef]
- Nili, A.; Tate, M.; Johnstone, D. A framework and approach for analysis of focus group data in information systems research. Commun. Assoc. Inf. Syst. 2017, 40, 11–21. [Google Scholar] [CrossRef]
- Nili, Y. The new insiders: Rethinking independent directors’ tenure. Hastings LJ 2016, 68, 97–158. [Google Scholar]
- Shivdasani, A.; Yermack, D. CEO involvement in the selection of new board members: An empirical analysis. J. Financ. 1999, 54, 1829–1853. [Google Scholar] [CrossRef]
- Westphal, J.D. Board games: How CEOs adapt to increases in structural board independence from management. Adm. Sci. Q. 1998, 43, 511–537. [Google Scholar] [CrossRef]
- Katz, R. The effects of group longevity on project communication and performance. Adm. Sci. Q. 1982, 27, 81–104. [Google Scholar] [CrossRef]
- Golden, B.R.; Zajac, E.J. When will boards influence strategy? Inclination× power= strategic change. Strateg. Manag. J. 2001, 22, 1087–1111. [Google Scholar] [CrossRef]
- Dou, Y.; Sahgal, S.; Zhang, E.J. Should independent directors have term limits? The role of experience in corporate governance. Financ. Manag. 2015, 44, 583–621. [Google Scholar] [CrossRef]
- Chen, D.; Xiang, J. Is it reasonable that independent directors can only be re-elected for 6 years? Empirical research based on China ’s A-share listed companies. Manag. World 2017, 5, 144–157. [Google Scholar]
- Adams, R.B.; Ferreira, D. A theory of friendly boards. J. Financ. 2007, 62, 217–250. [Google Scholar] [CrossRef]
- Duchin, R.; Matsusaka, J.G.; Ozbas, O. When are outside directors effective? Financ. Econ. 2010, 96, 195–214. [Google Scholar] [CrossRef]
- Harris, M.; Raviv, A. A theory of board control and size. Rev. Financ. Stud. 2008, 21, 1797–1832. [Google Scholar] [CrossRef]
- Bonini, S.; Deng, J.; Ferrari, M.; John, K. On Long-Tenured Independent Directors. 2017. Available online: https://xueshu.baidu.com/usercenter/paper/show?paperid=72aaf6353e6480a3ea45877abaeab6e1 (accessed on 3 December 2024).
- Donoher, W.J.; Reed, R.; Storrud-Barnes, S.F. Incentive alignment, control, and the issue of misleading financial disclosures. J. Manag. 2007, 33, 547–569. [Google Scholar] [CrossRef]
- Chan, A.M.Y.; Liu, G.; Sun, J. Independent audit committee members’ board tenure and audit fees. Account. Financ. 2013, 53, 1129–1147. [Google Scholar] [CrossRef]
- Kroll, M.; Walters, B.A.; Wright, P. Board vigilance, director experience, and corporate outcomes. Strateg. Manag. J. 2008, 29, 363–382. [Google Scholar] [CrossRef]
- Rao, H.; Davis, G.F.; Ward, A. Embeddedness, social identity and mobility: Why firms leave the NASDAQ and join the New York Stock Exchange. Adm. Sci. Q. 2000, 45, 268–292. [Google Scholar] [CrossRef]
- Hillman, A.J.; Nicholson, G.; Shropshire, C. Directors’ multiple identities, identification, and board monitoring and resource provision. Organ. Sci. 2008, 19, 441–456. [Google Scholar] [CrossRef]
- Fama, E.F. Agency Problems and the Theory of the Firm. Political Econ. 1980, 88, 288–307. [Google Scholar] [CrossRef]
- Fombrun, C.J.; Rindova, V. Reputation management in global 1000 firms: A benchmarking study. Corp. Reput. Rev. 1998, 1, 205–212. [Google Scholar] [CrossRef]
- Greyser, S.A. Advancing and enhancing corporate reputation. Corp. Commun. Int. J. 1999, 4, 177–181. [Google Scholar] [CrossRef]
- Shane, S.; Cable, D. Network ties, reputation, and the financing of new ventures. Manag. Sci. 2002, 48, 364–381. [Google Scholar] [CrossRef]
- Cashman, G.D.; Gillan, S.L.; Jun, C. Going overboard? On busy directors and firm value. J. Bank. Financ. 2012, 36, 3248–3259. [Google Scholar] [CrossRef]
- Freeman, L.C. Centrality in social networks: Conceptual clarification. Soc. Netw. Crit. Concepts Sociol. 2002, 1, 238–263. [Google Scholar] [CrossRef]
- Dong, F.; Wang, X.; Chen, J. Family ownership and cooperative R&D: The moderating effect of political ties. J. Knowl. Manag. 2021, 26, 403–422. [Google Scholar]
- Hu, H.; Guo, S.; Dou, B.; Wang, A. Chain director network and Chinese listed company violations. Econ. Manag. Stud. 2022, 43, 62–88. [Google Scholar]
- Mizruchi, M.S.; Stearns, L.B. A longitudinal study of the formation of interlocking directorates. Adm. Sci. Q. 1988, 33, 194–210. [Google Scholar] [CrossRef]
- Liao, H.; Meng, X.; Gong, S. Chain director network and enterprise performance: Current situation, mechanism and heterogeneity analysis. Syst. Eng.-Theory Pract. 2024, 44, 2978–2992. [Google Scholar] [CrossRef]
Disclaimer/Publisher’s Note: The statements, opinions and data contained in all publications are solely those of the individual author(s) and contributor(s) and not of MDPI and/or the editor(s). MDPI and/or the editor(s) disclaim responsibility for any injury to people or property resulting from any ideas, methods, instructions or products referred to in the content. |
© 2025 by the authors. Licensee MDPI, Basel, Switzerland. This article is an open access article distributed under the terms and conditions of the Creative Commons Attribution (CC BY) license (https://creativecommons.org/licenses/by/4.0/).