1. Introduction
With expeditious growth in mileage, highway asset management encounters pressure with various types and quantities of infrastructure and long life-cycles. Assets consist of physical infrastructure, human resources, equipment and materials, rights of way, computer systems, methods, technologies, etc. [
1], and this paper mainly focuses on physical infrastructure. By 2023, China’s highway mileage had reached 5.43 million kilometers, comprising 183.6 thousand kilometers of expressways, more than 1.07 million bridges, and 27.2 thousand tunnels [
2], ranking first in the world. Meanwhile, a variety of facilities are equipped on the roadside to improve traffic safety and management efficiency, such as perception sensors, traffic control devices, positioning and communication devices, etc. Several hundred types of highway infrastructure have increased the management difficulty, owing to their long life-cycles across construction, maintenance, and operation. Traditional infrastructure management aims at special application scenarios and naturally causes information fragmentation. Due to the lack of coordination between whole-life-cycle application scenarios, infrastructure data suffer from missing values, inconsistency, varying granularity, etc., resulting in lower utilization efficiency in other scenario applications and a high cost of repeated data collection.
Sustainable transport is central to sustainable development for universal access, enhanced safety, reduced environmental and climate impact, improved resilience, and greater efficiency [
3]. Infrastructure, as a crucial asset in society, influences 72% of the targets of the Sustainable Development Goals (SDGs). Reducing life-cycle costs of transport infrastructure is an effective way to achieve green and low-carbon transport [
4,
5]. There are also some state-of-the-art methods and solutions in traffic and transportation engineering for energy saving [
6]. Infrastructure digitalization, as an innovation driving transport sustainability, has transformed domains from data acquisition to whole-life-cycle data government and analysis, supporting the decision-making process of highway asset management.
The purpose of this paper is to develop a framework and approach to improve data interoperability between life-cycle application scenarios. Therefore, the life-cycle asset management framework and data integration method for master data and element identification both need to be addressed for infrastructure data recycling across different scenarios. Note that master data are the common infrastructure data that exist across critical application scenarios; for the underlying information objects, refer to [
7].
A variety of asset management frameworks have been proposed by international technical societies for investment appraisal, strategy setting, program definition, evaluation and forecasting benefits, and improved performance, including The Institute of Asset Management (IAM) [
8], World Road Association (PIARC) [
9], Global Forum on Maintenance and Asset Management (GFMAM) [
10], etc. In 2024, the IAM’s 10-box capabilities model [
8] was proposed, with a whole-life/whole-cost perspective involving information management, life-cycle delivery, asset management decision making, values and outcomes, etc. These frameworks have also been applied in power systems [
11,
12], railways [
13], etc. Some standards [
14,
15,
16] have been released to regulate the requirements for the establishment, implementation, operation, maintenance, and improvement of asset management systems. Abu-Samra et al. [
17] presented an asset management framework including data collection and invention, intervention quantification modeling, and an optimization model to ensure proper expenditure utilization and maintain performance in municipal infrastructure coordination. To find barriers to road infrastructure, Cruz and Sarmento [
18] discussed the impact of technologies on existing management, including infrastructure-related and service-related innovations. Petchrompo et al. [
19] proposed the two multi-asset categories of fleet and portfolio, and potential multi-component dependencies (performance, stochastic, and resource) were selected to apply in multi-asset systems. Transportation asset management was proposed to describe the strategic and systematic process of operating, maintaining, upgrading, and expanding physical assets effectively throughout their life-cycles [
20]. O’Brien et al. [
21] developed a guide for integrated civil management to assess the use of digital information in project delivery and subsequent asset management, improve project quality, and more effectively control costs. To achieve sustainability perspectives, Hanski et al. [
22] conducted a systematic literature review of strategic asset management frameworks including data collection, descriptive analysis, category selection, and data evaluation.
Highway asset management has also paid increasing attention to risk evaluation [
23], impact indicators [
24], decision support [
25], sustainability, etc. The impact of connected and automated vehicles has also been discussed in asset management [
26]. A value-based method was proposed to map stakeholder requirements for effective decisions on infrastructure asset management and was demonstrated in a case study of transportation tunnels [
27]. Asres et al. [
28] conducted a meta-analysis with preferred reporting items for systematic reviews and meta-analyses (PRISMA) principles to develop a single sustainable flexible pavement design framework for highway agencies to effectively quantify the lifetime sustainability performance of flexible pavement in the design phase. Hakimi et al. [
29] designed a digital twin-based life-cycle management framework based on data fusion and the integration of open building information modeling (openBIM) and geographic information systems (GISs). Wang et al. [
30] proposed a technical framework for highway construction, including perception acquisition, integrated processing, business application, etc., and summarized the developmental status of key technologies. Peraka et al. [
31] collected and reported current state-of-the-art developments of pavement asset management systems, summarizing information on data collection methods, data analysis, decision-making tools, and processing methods. Adey et al. [
32] used a high-level process of the entire road infrastructure management process to increase efficiency and effectiveness. Recent studies have mainly focused on a single phase but lacked a life-cycle framework for highway infrastructure in asset management.
To capture the effects of digitalization, digital infrastructure was defined as a socially embedded mechanical system with feedback loops and self-reinforcing, including technological and human components, network, systems, and processes [
33]. Digital technologies have been applied in various fields to improve efficiency, such as construction [
34,
35,
36], freight transport [
37], urban green economic transformation [
38], urban water systems [
39], entrepreneurial ecosystems [
40], municipalities [
41], etc. Lafioune et al. [
41] conducted a study on the barriers and issues of urban infrastructure from a systematic literature review, like the lack of organizational change management, absence of data management, etc.
In highway infrastructure, some methods have been proposed to increase data interoperation, such as artificial intelligence (AI) of data analysis, GIS, BIM, and digital twin. The interstate highway system [
42] incorporated risks of system failure and performance measures in an asset management framework with asset data inventory. Piryonesi et al. [
43] applied decision trees to the analysis of long-term pavement performance database to predict the deterioration of the pavement condition index. Gao et al. [
44] conducted a bibliometric analysis of BIM and digital twin technologies on transportation and discussed the goals of the entire life-cycle management. Current studies on road infrastructure data management mainly focus on data inventory and the proposed concept of life-cycle delivery, but lack the detailed method to guide data integration.
Highway traditional information systems are designed for business applications with vertical resources, resulting in the islands of information coherence. To enhance data recycling, master data management (MDM) was recommended to capture, integrate and subsequently share the master data, achieving accurate, timely, consistent and complete data quality [
7,
45,
46]. Then, multi-domain master data management was presented to build a more cohesive multi-domain MDM plan with a series of strategies [
47,
48], including master data definition, data integration, data government, data stewardship, quality management, etc. These strategies are also applied in this paper to guide the data integration on highway infrastructure management, but do not provide specific approaches for identifying master data and determining the element.
Highway infrastructure digitalization captures, governs, integrates and analyzes digital data of physical infrastructure across design and construction, maintenance, operation and highway administration to maximize long-term data sustainability and minimize the life-cycle cost; also, refer to [
49]. This paper proposes the life-cycle framework for highway asset management to support the recycling of infrastructure data and achieve the delivery from construction to maintenance, operation, and highway administration in multi-users. Then, an integration approach is developed to identify master data and determine elements for infrastructure data interoperation. The main contributions of this paper are given as follows:
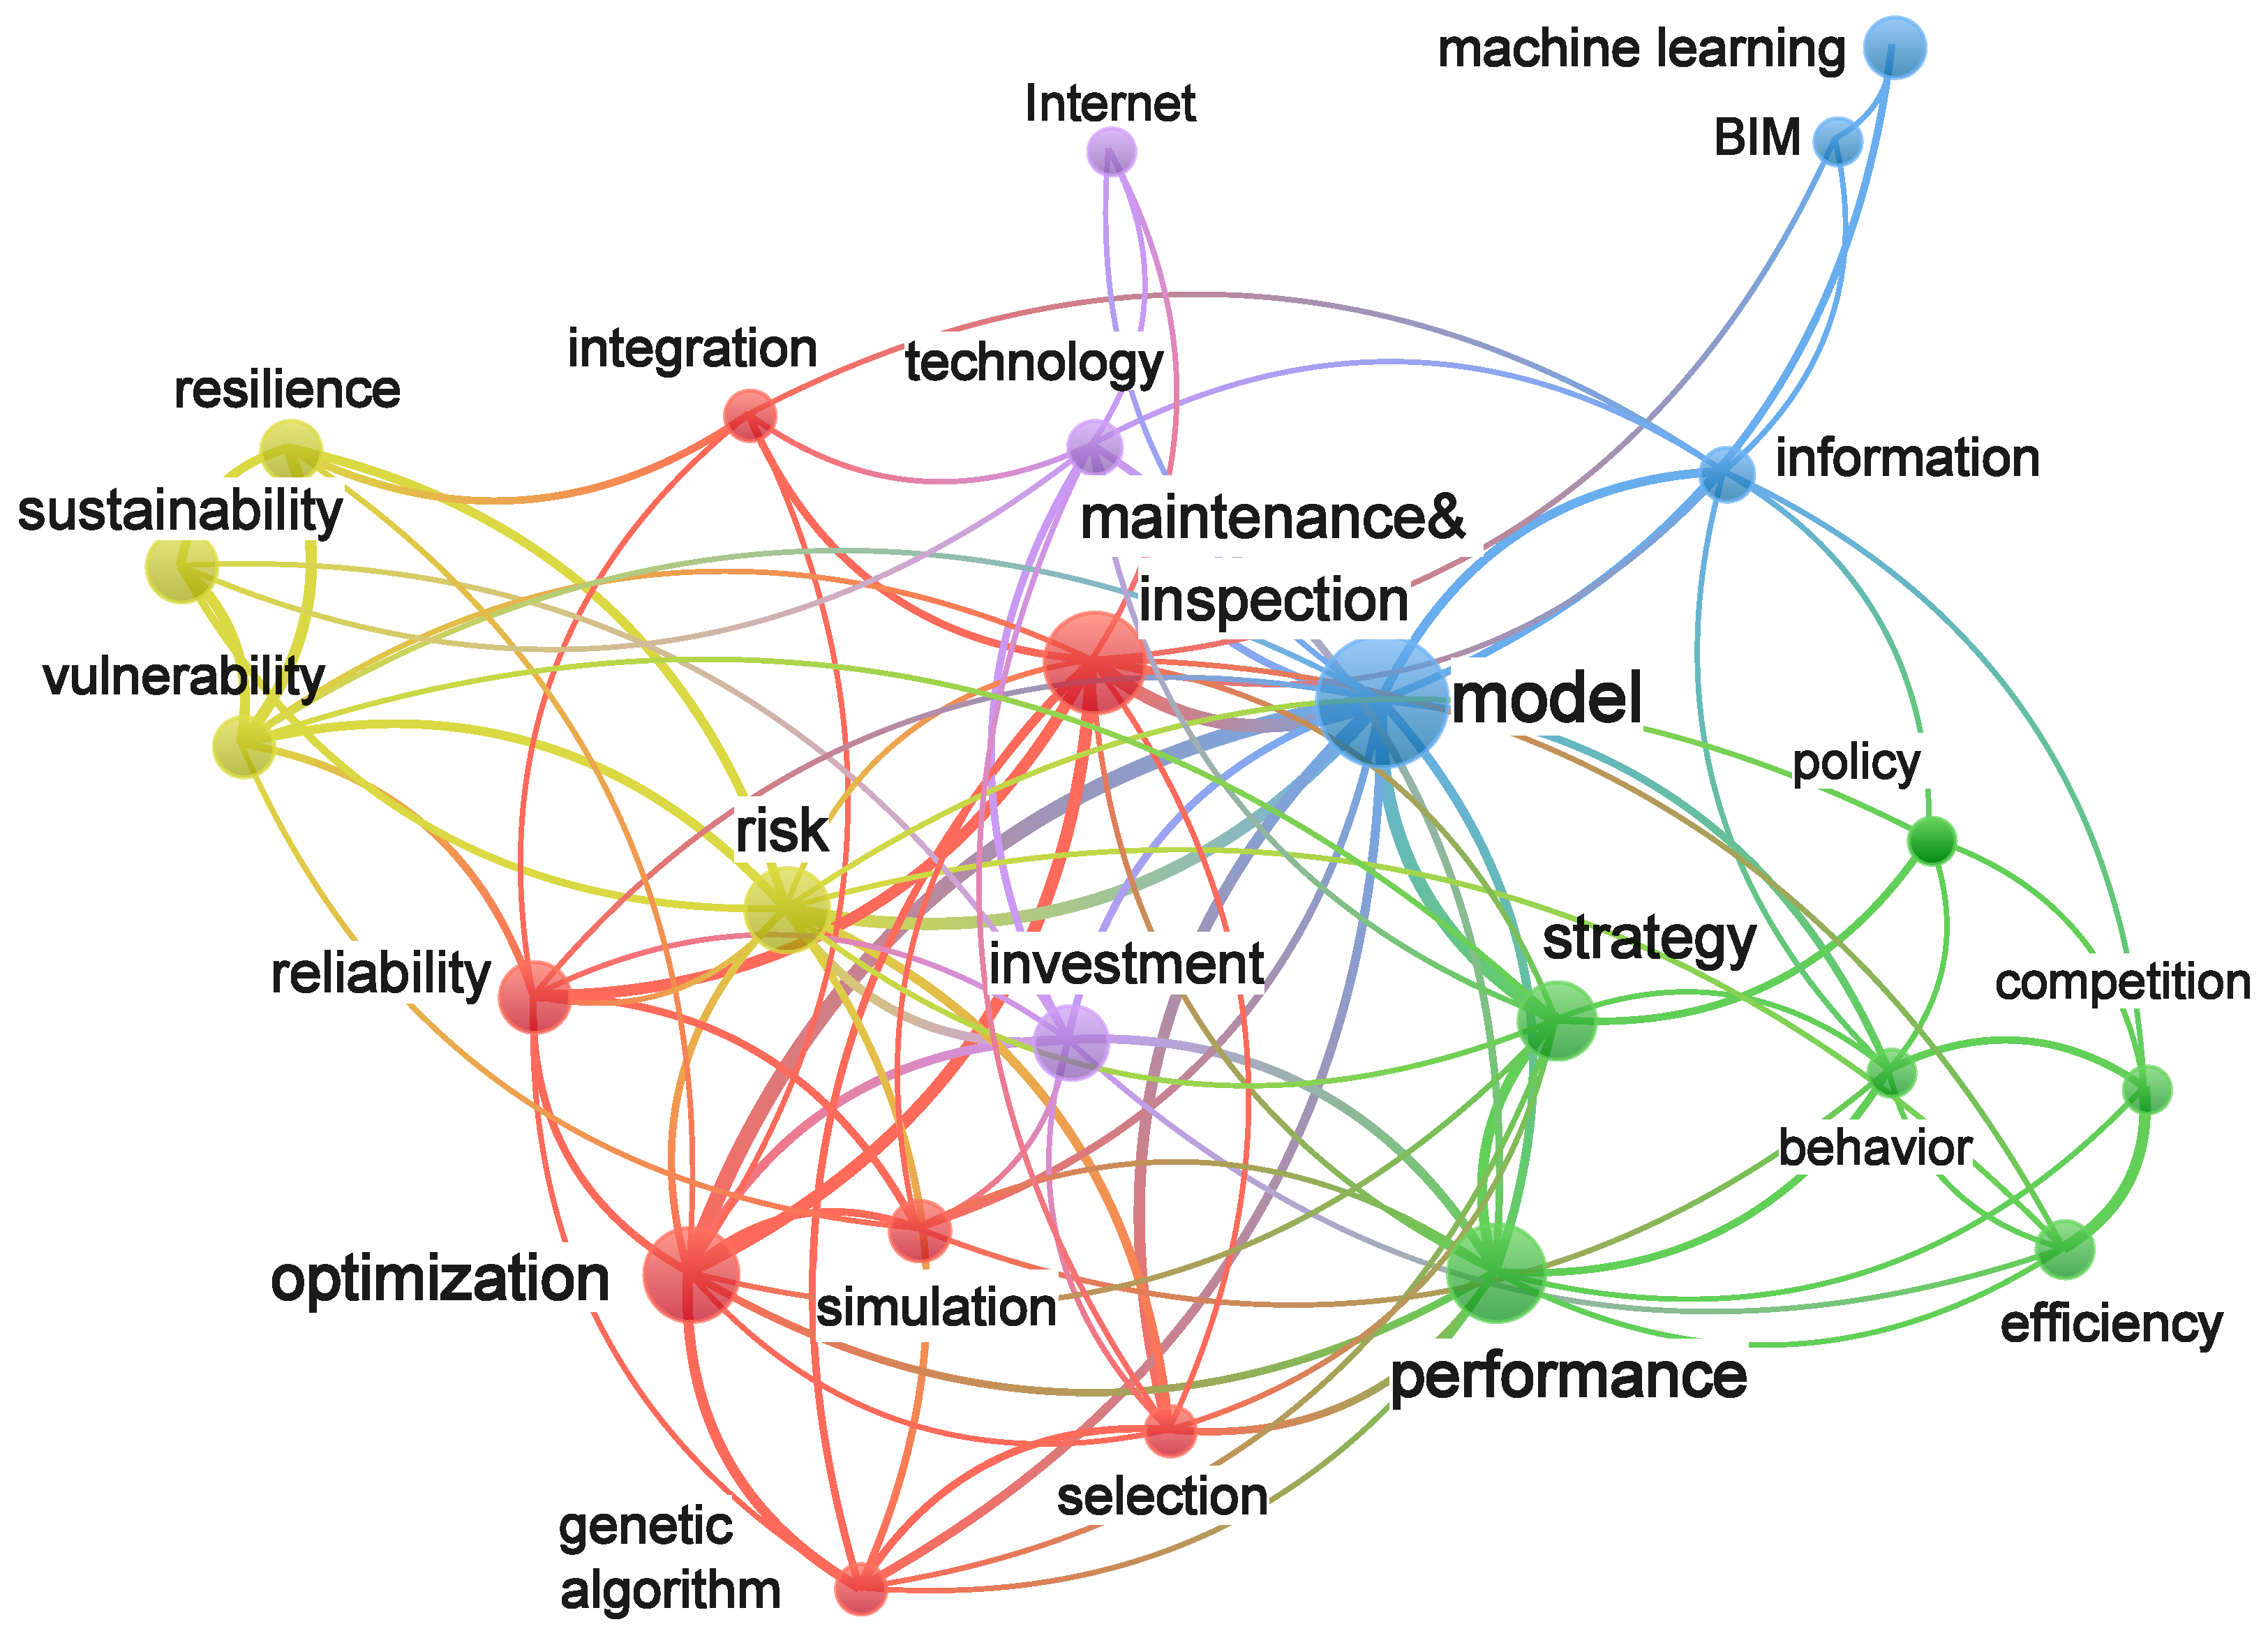
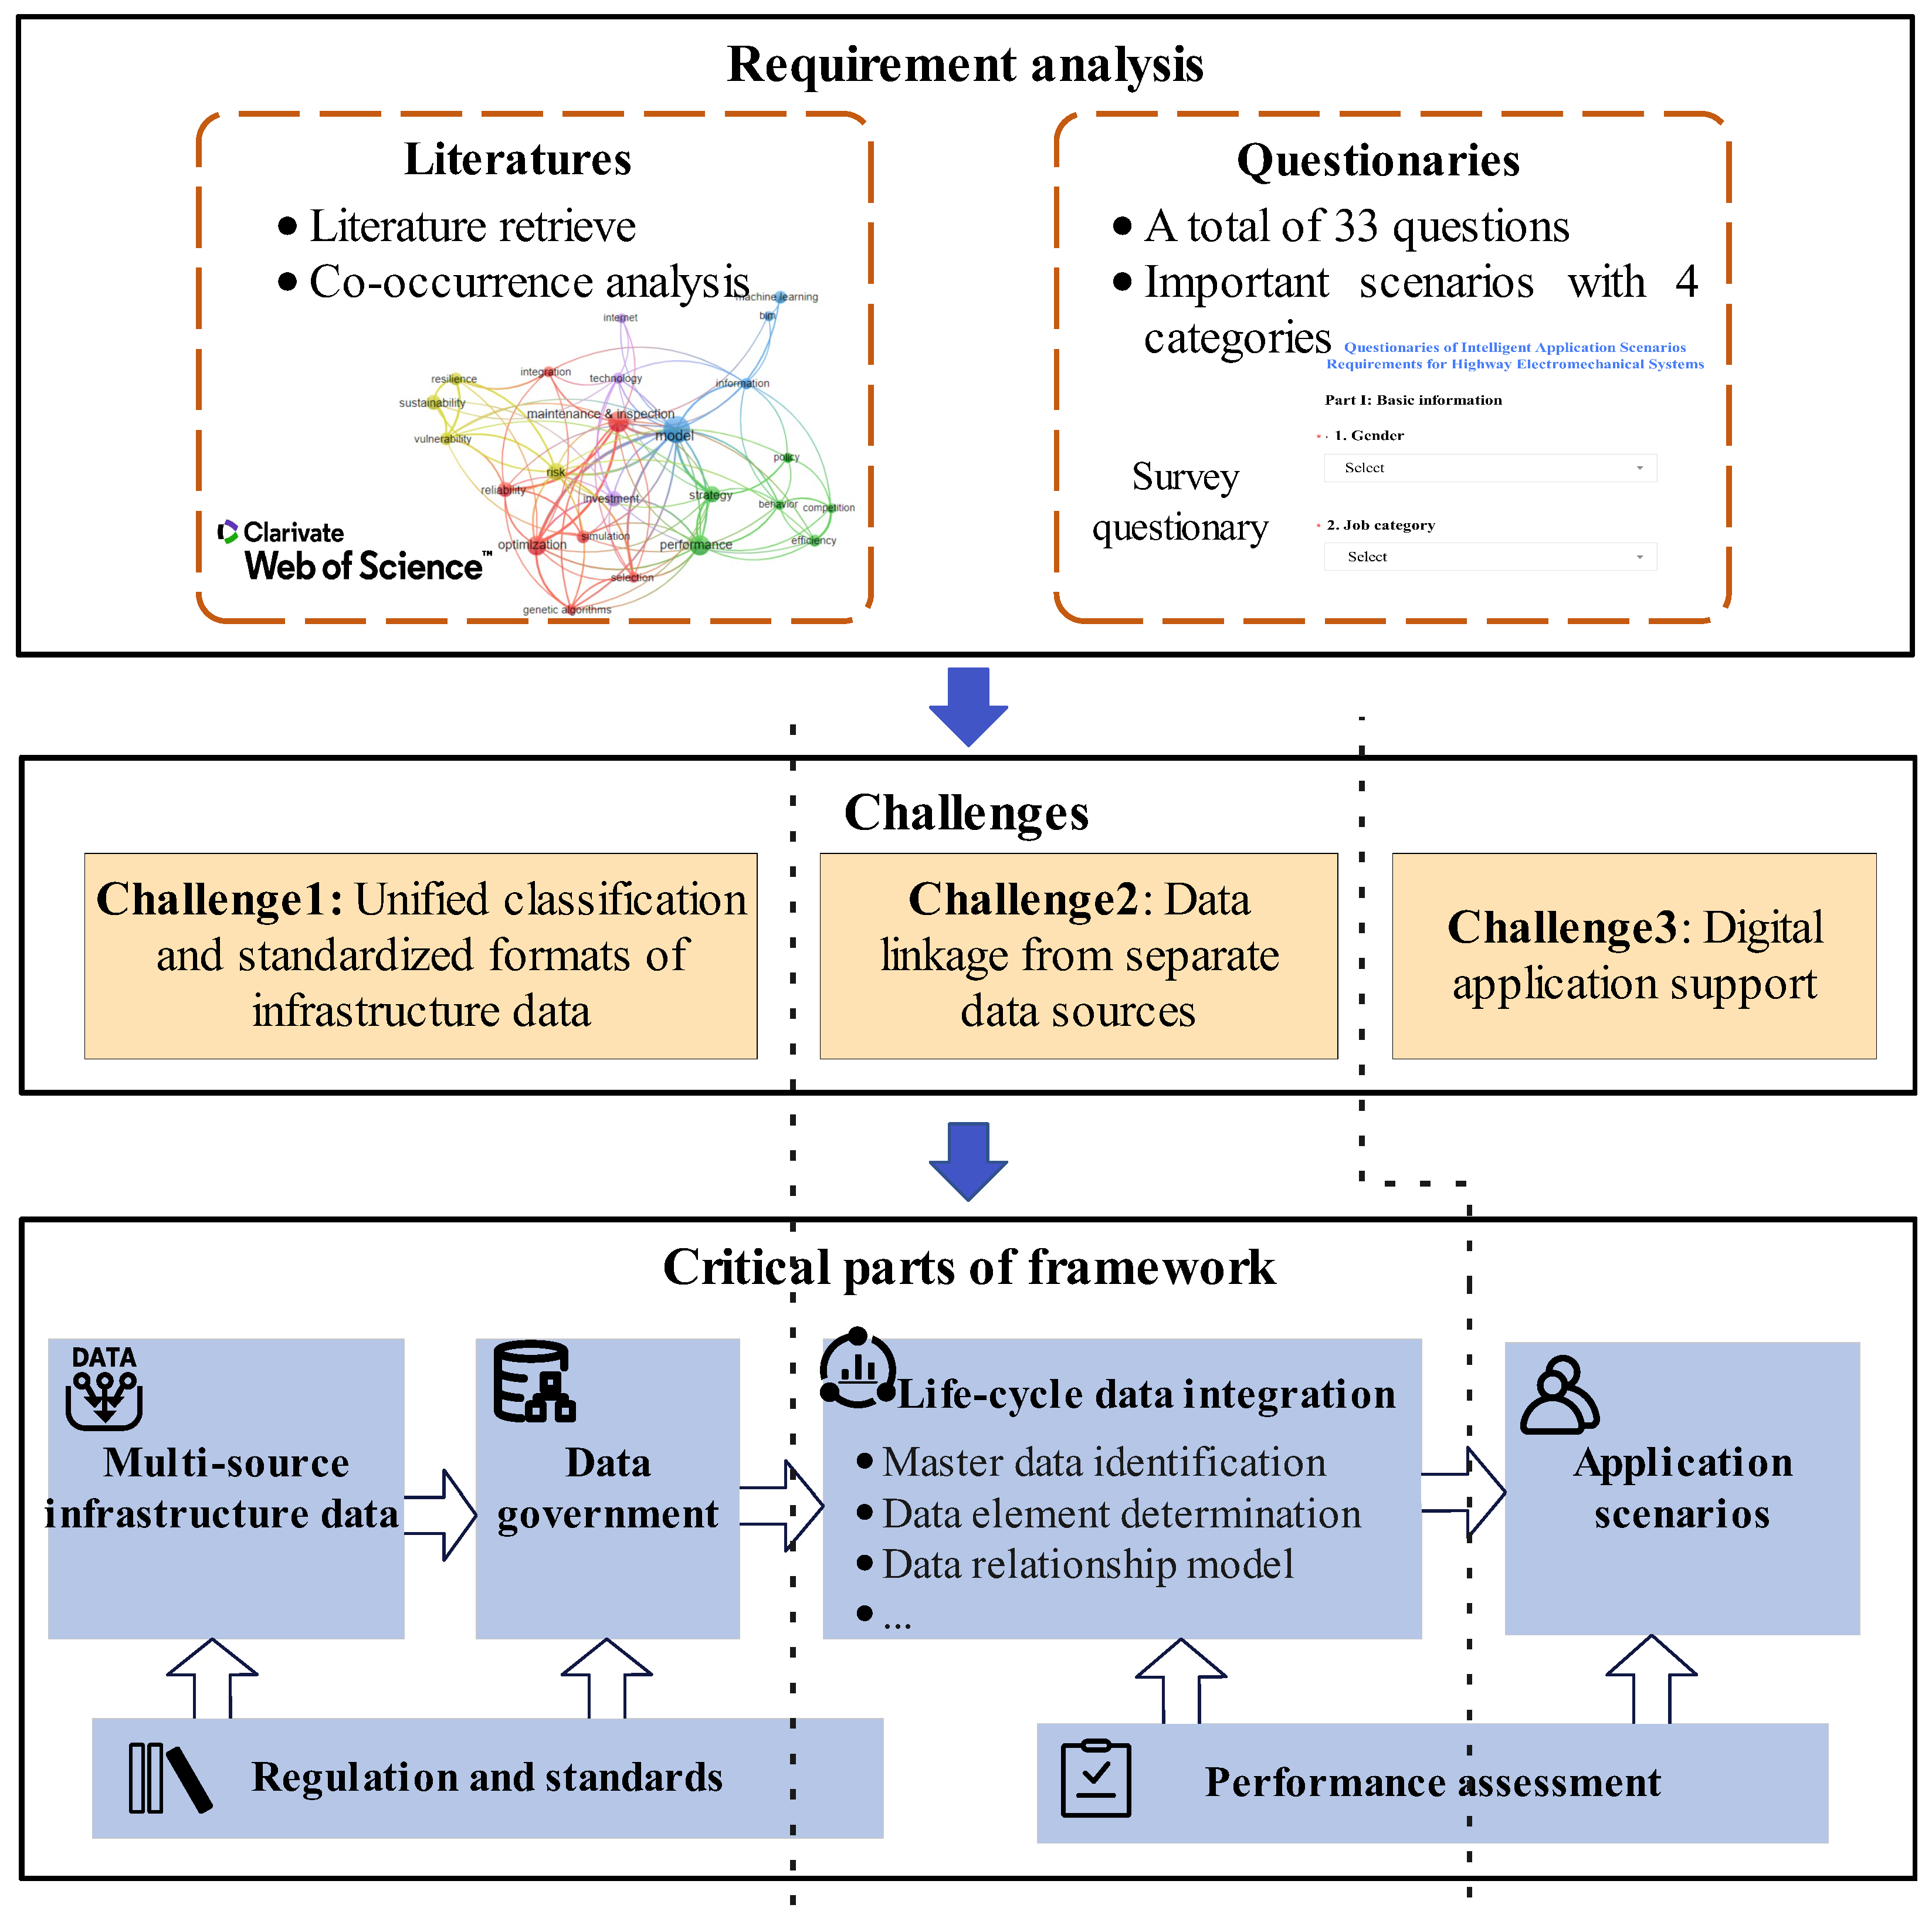
A conceptual framework of infrastructure digitalization is proposed with four layers and two support systems to facilitate the life-cycle highway asset management, and a 6-step procedure is presented to guide the framework development. The digital requirements are analyzed through a literature review and survey questionnaires, such as islands of information coherence.
A modified data–process matrix with service duration is first developed to characterize the data interoperation across life-cycle scenarios, then identifies master data with evaluation factors.
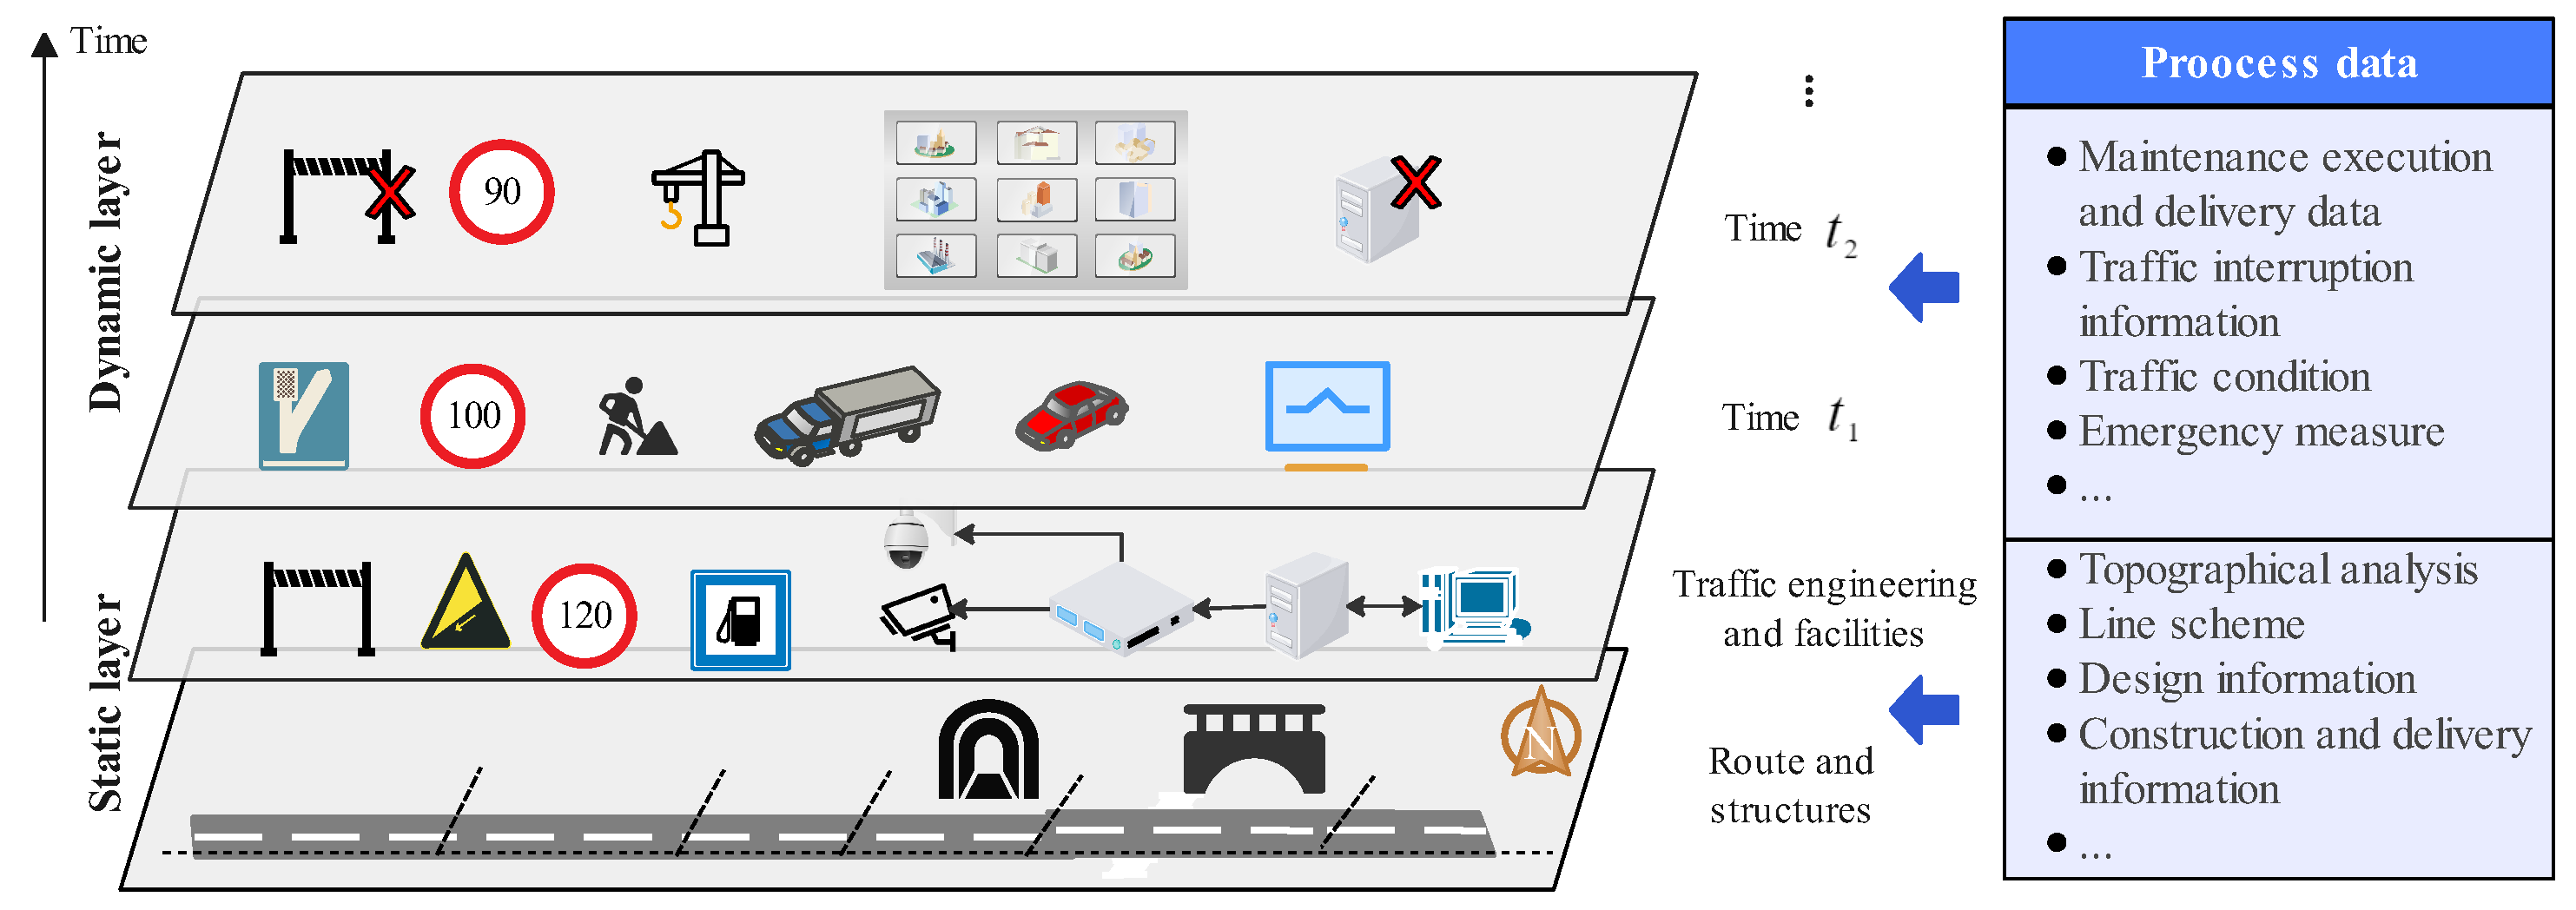
The correlation matrix is adapted to depict the relationship between infrastructure data and different scenarios, and then it determines data elements with the selected assessment factors. A data relationship model is also proposed to describe static and dynamic data correlation from multiple sources.
For comparison, some related studies with the objective, framework, and data acquisition are presented in
Table 1.
The rest of this paper is structured as follows. The digital transformation and the research methodology are introduced in
Section 2.
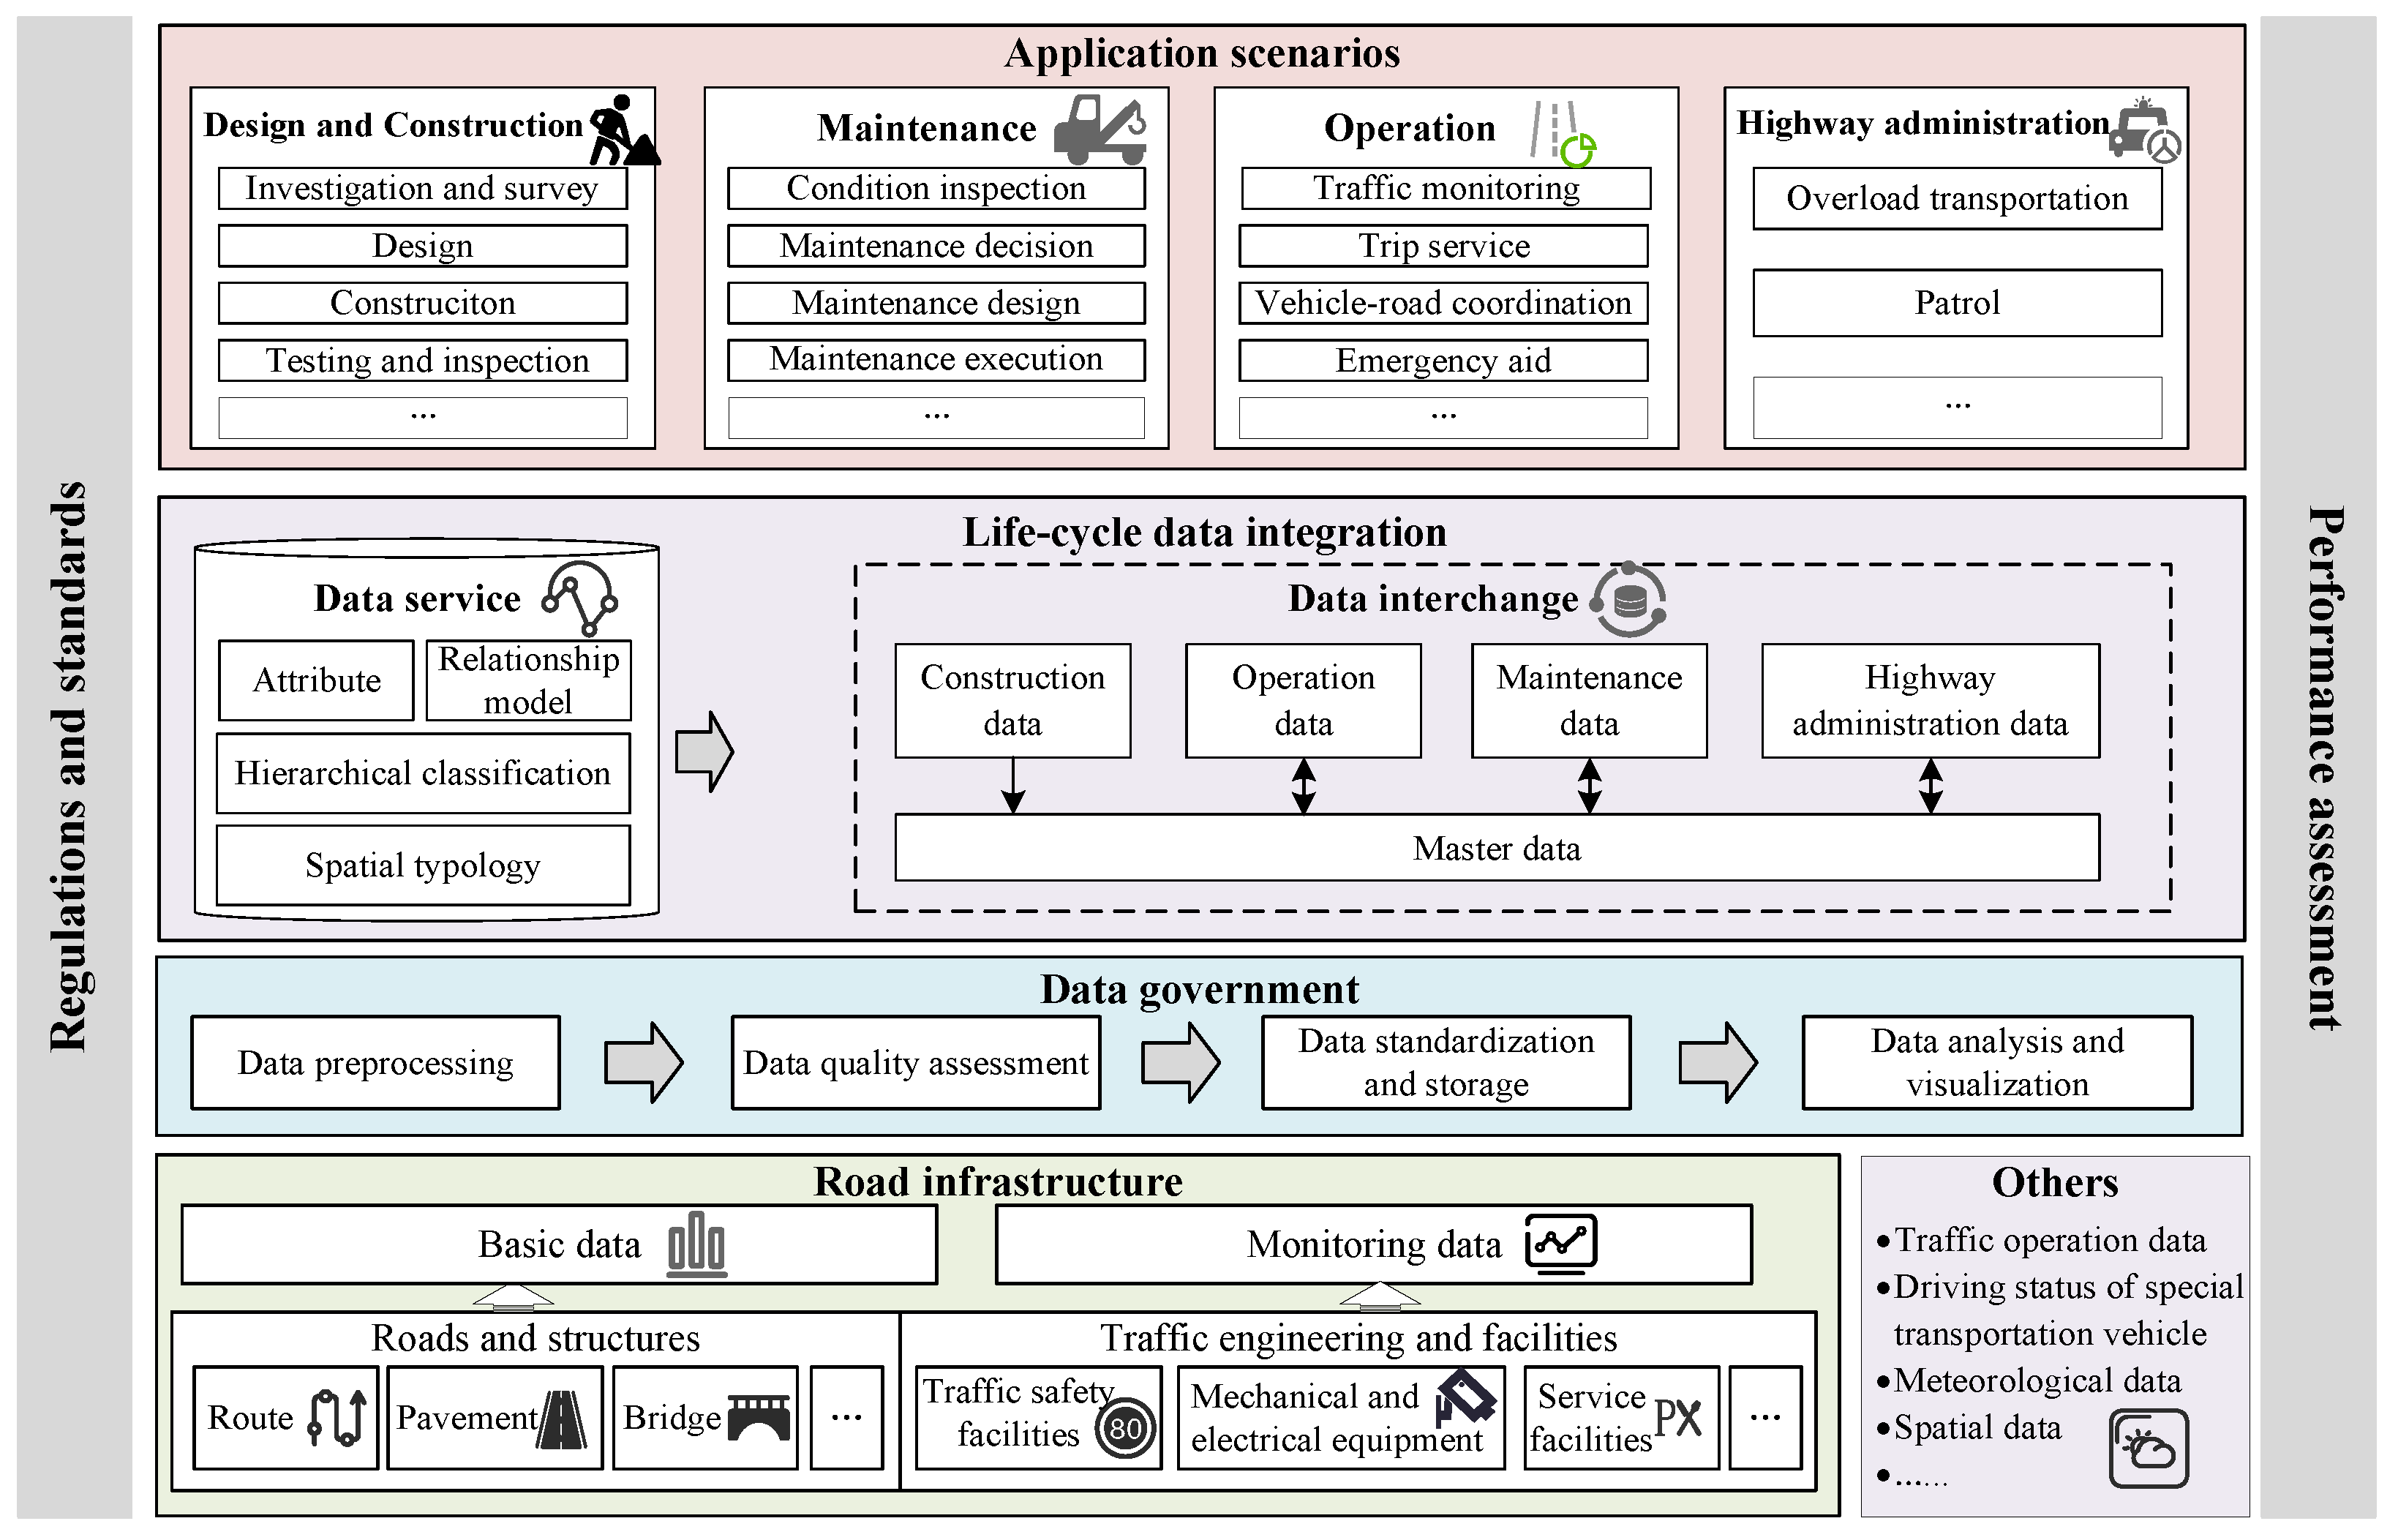
Section 3 describes the life-cycle infrastructure digitalization framework with four layers and two support systems. In
Section 4, a life-cycle data integration approach is proposed to determine master data and elements. The experiments with practical data are implemented in
Section 5, and conclusions are presented in
Section 6.
5. Results and Discussion
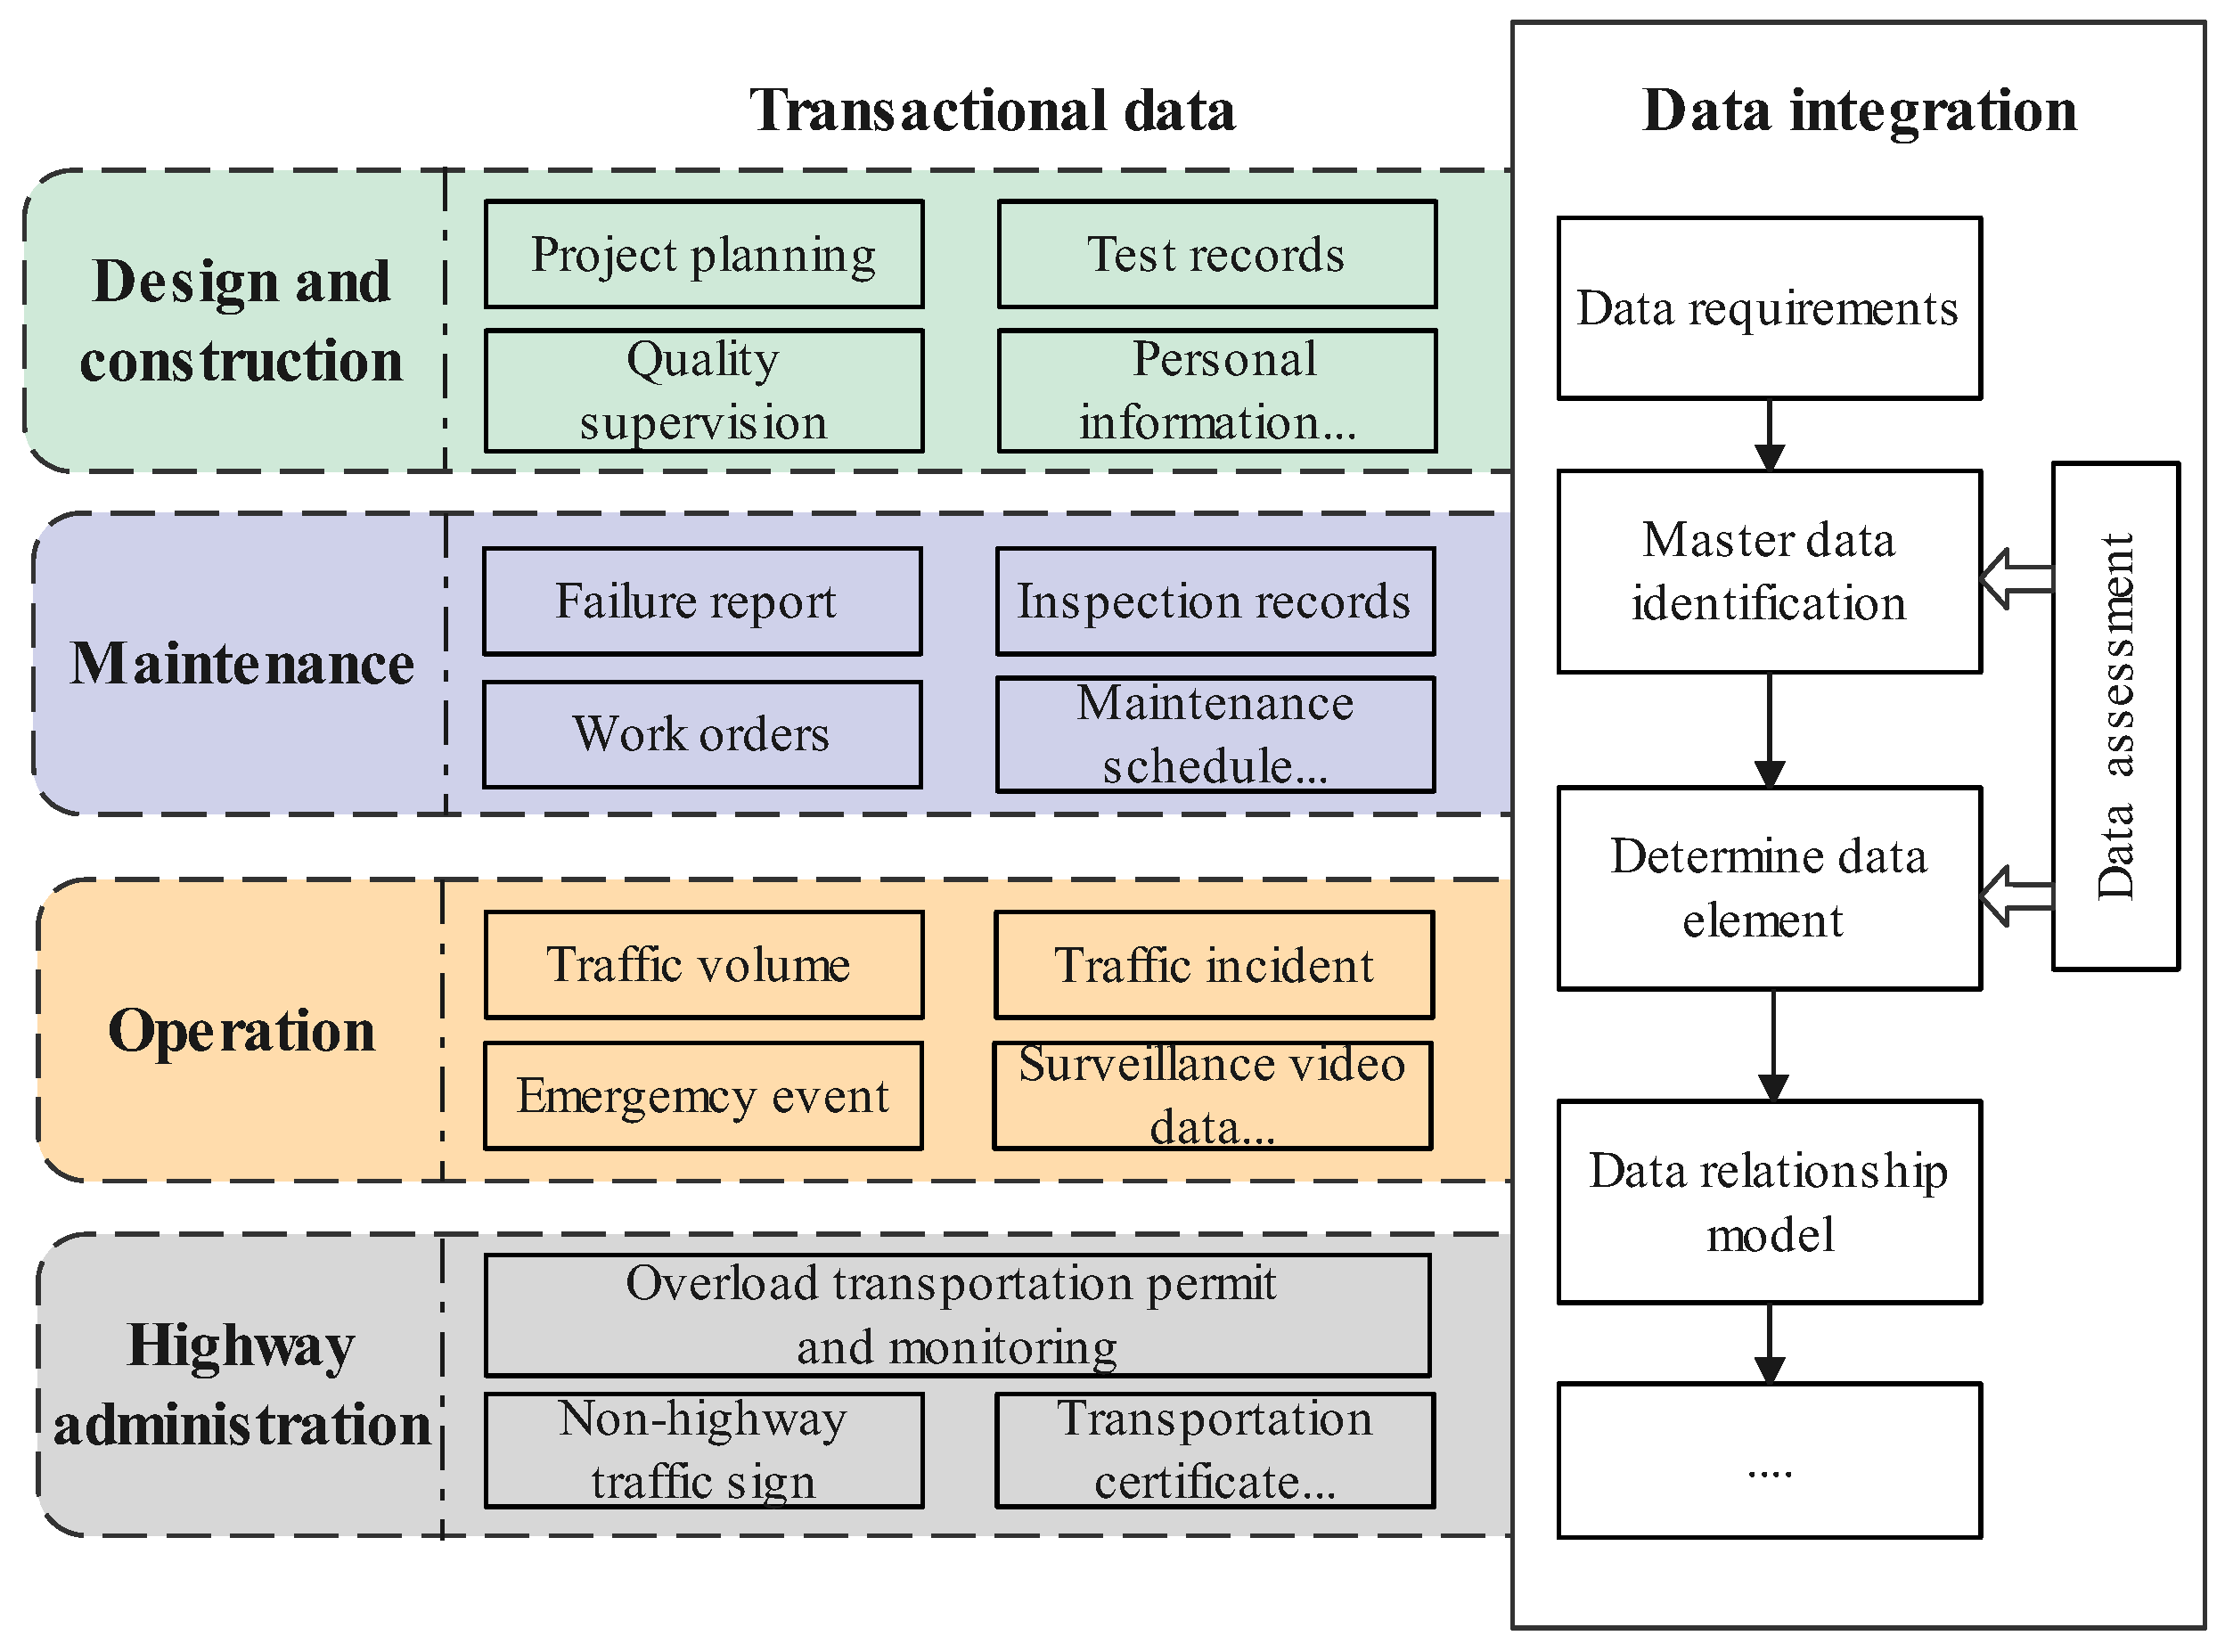
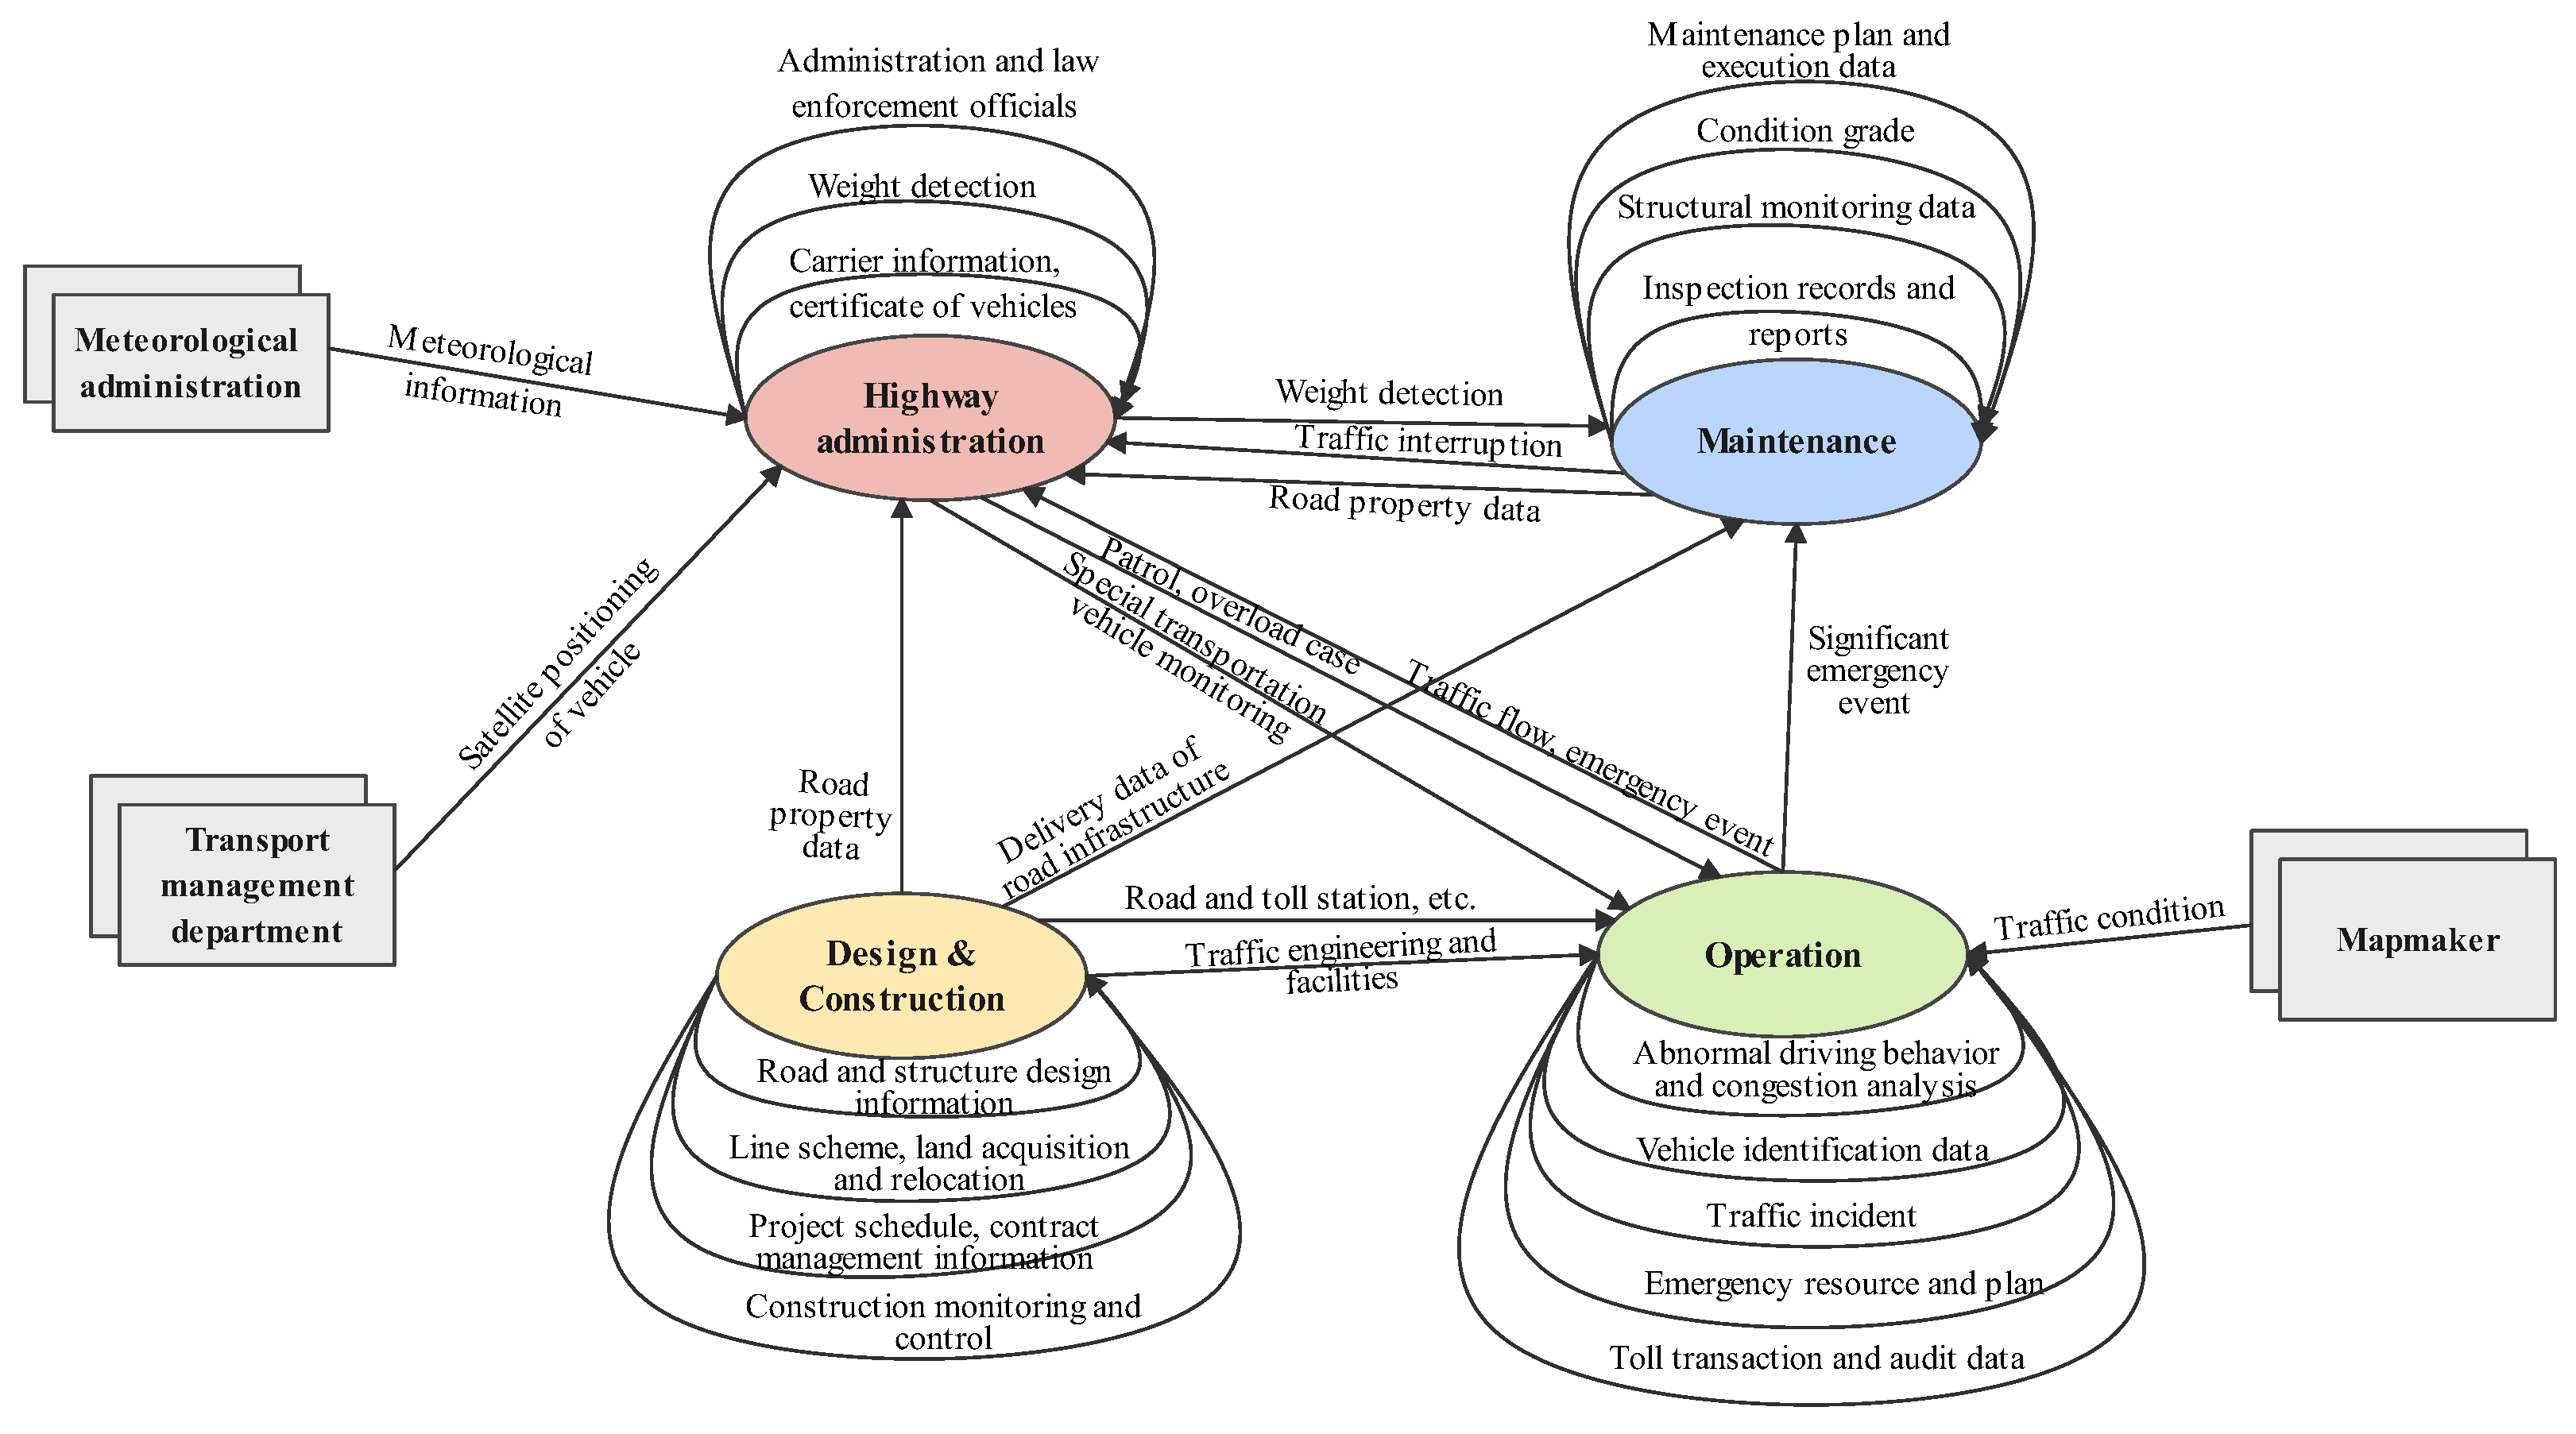
In this section, numerical experiments of the master data calculation process are presented to explicit the data interoperation between highway administration and maintenance, operation, etc. The effectiveness of the life-cycle data integration approach is verified through two methods: master data identification and data element determination. Master data are the core part of data interchange between different scenarios on the life-cycle data integration layer of the infrastructure digitalization framework (see
Figure 3).
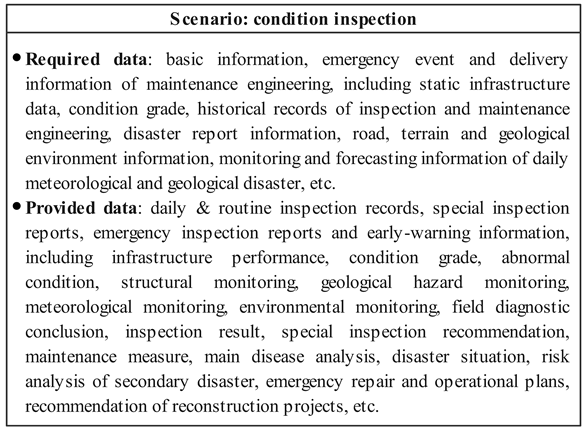
Two practical highway administration and maintenance systems are adopted for these instances. Accordingly, the required and provided data are summarized via maintenance and highway administration systems; see
Appendix A. Then, master data and data elements are determined as follows.
5.1. Master Data Identification Results
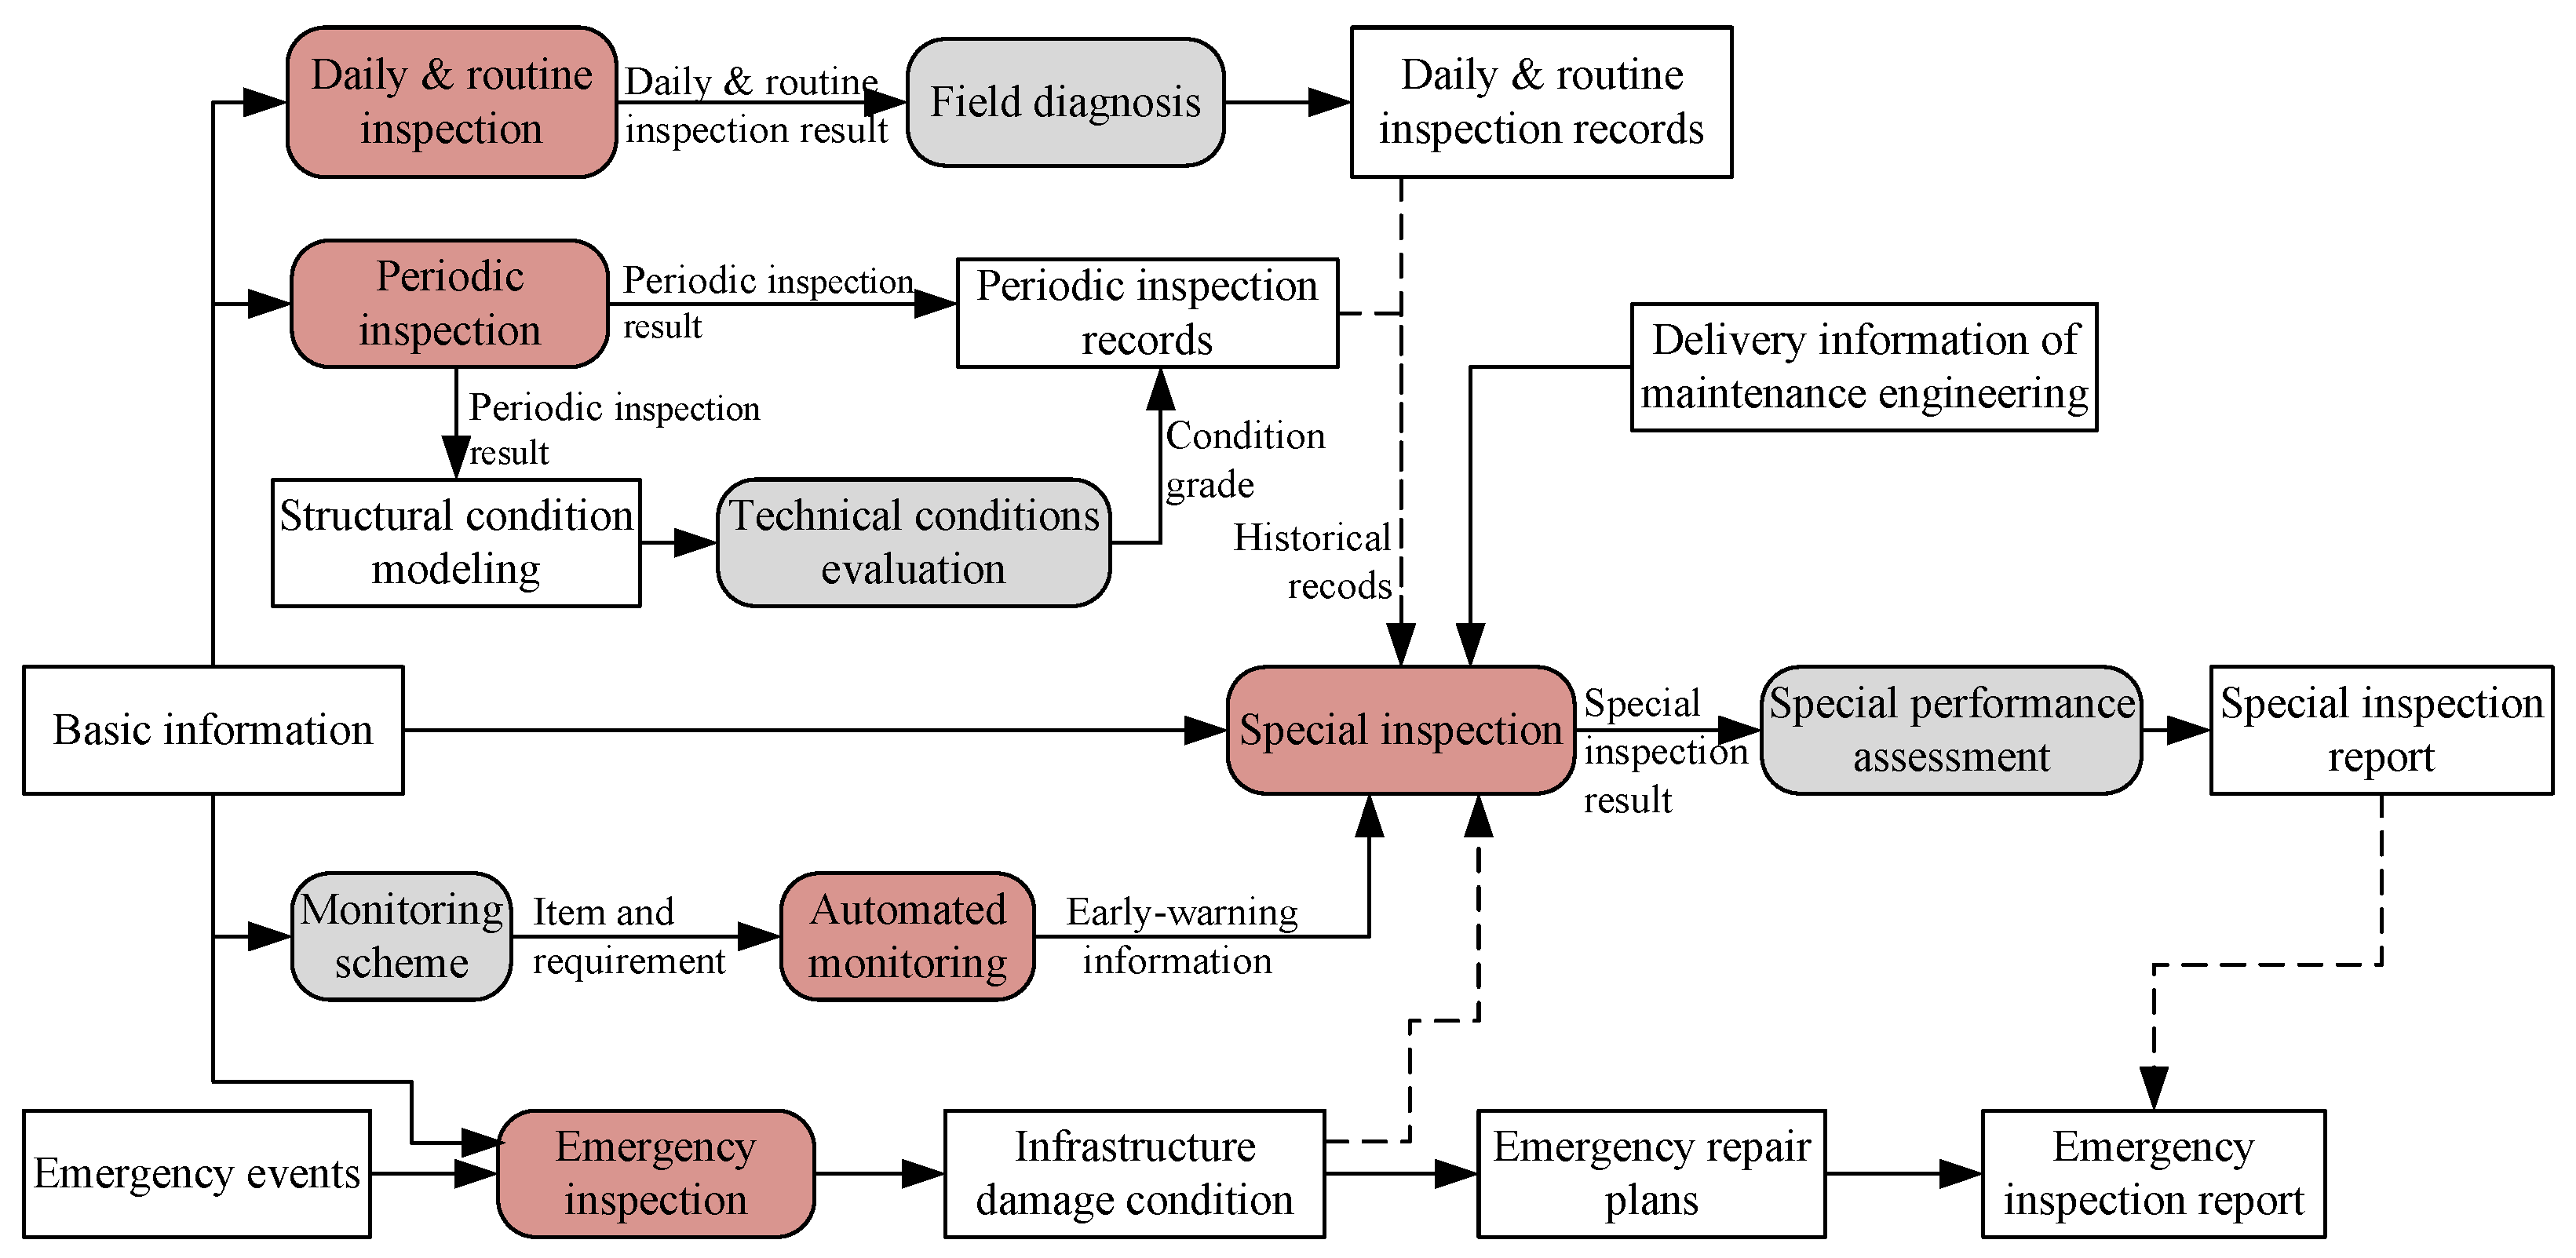
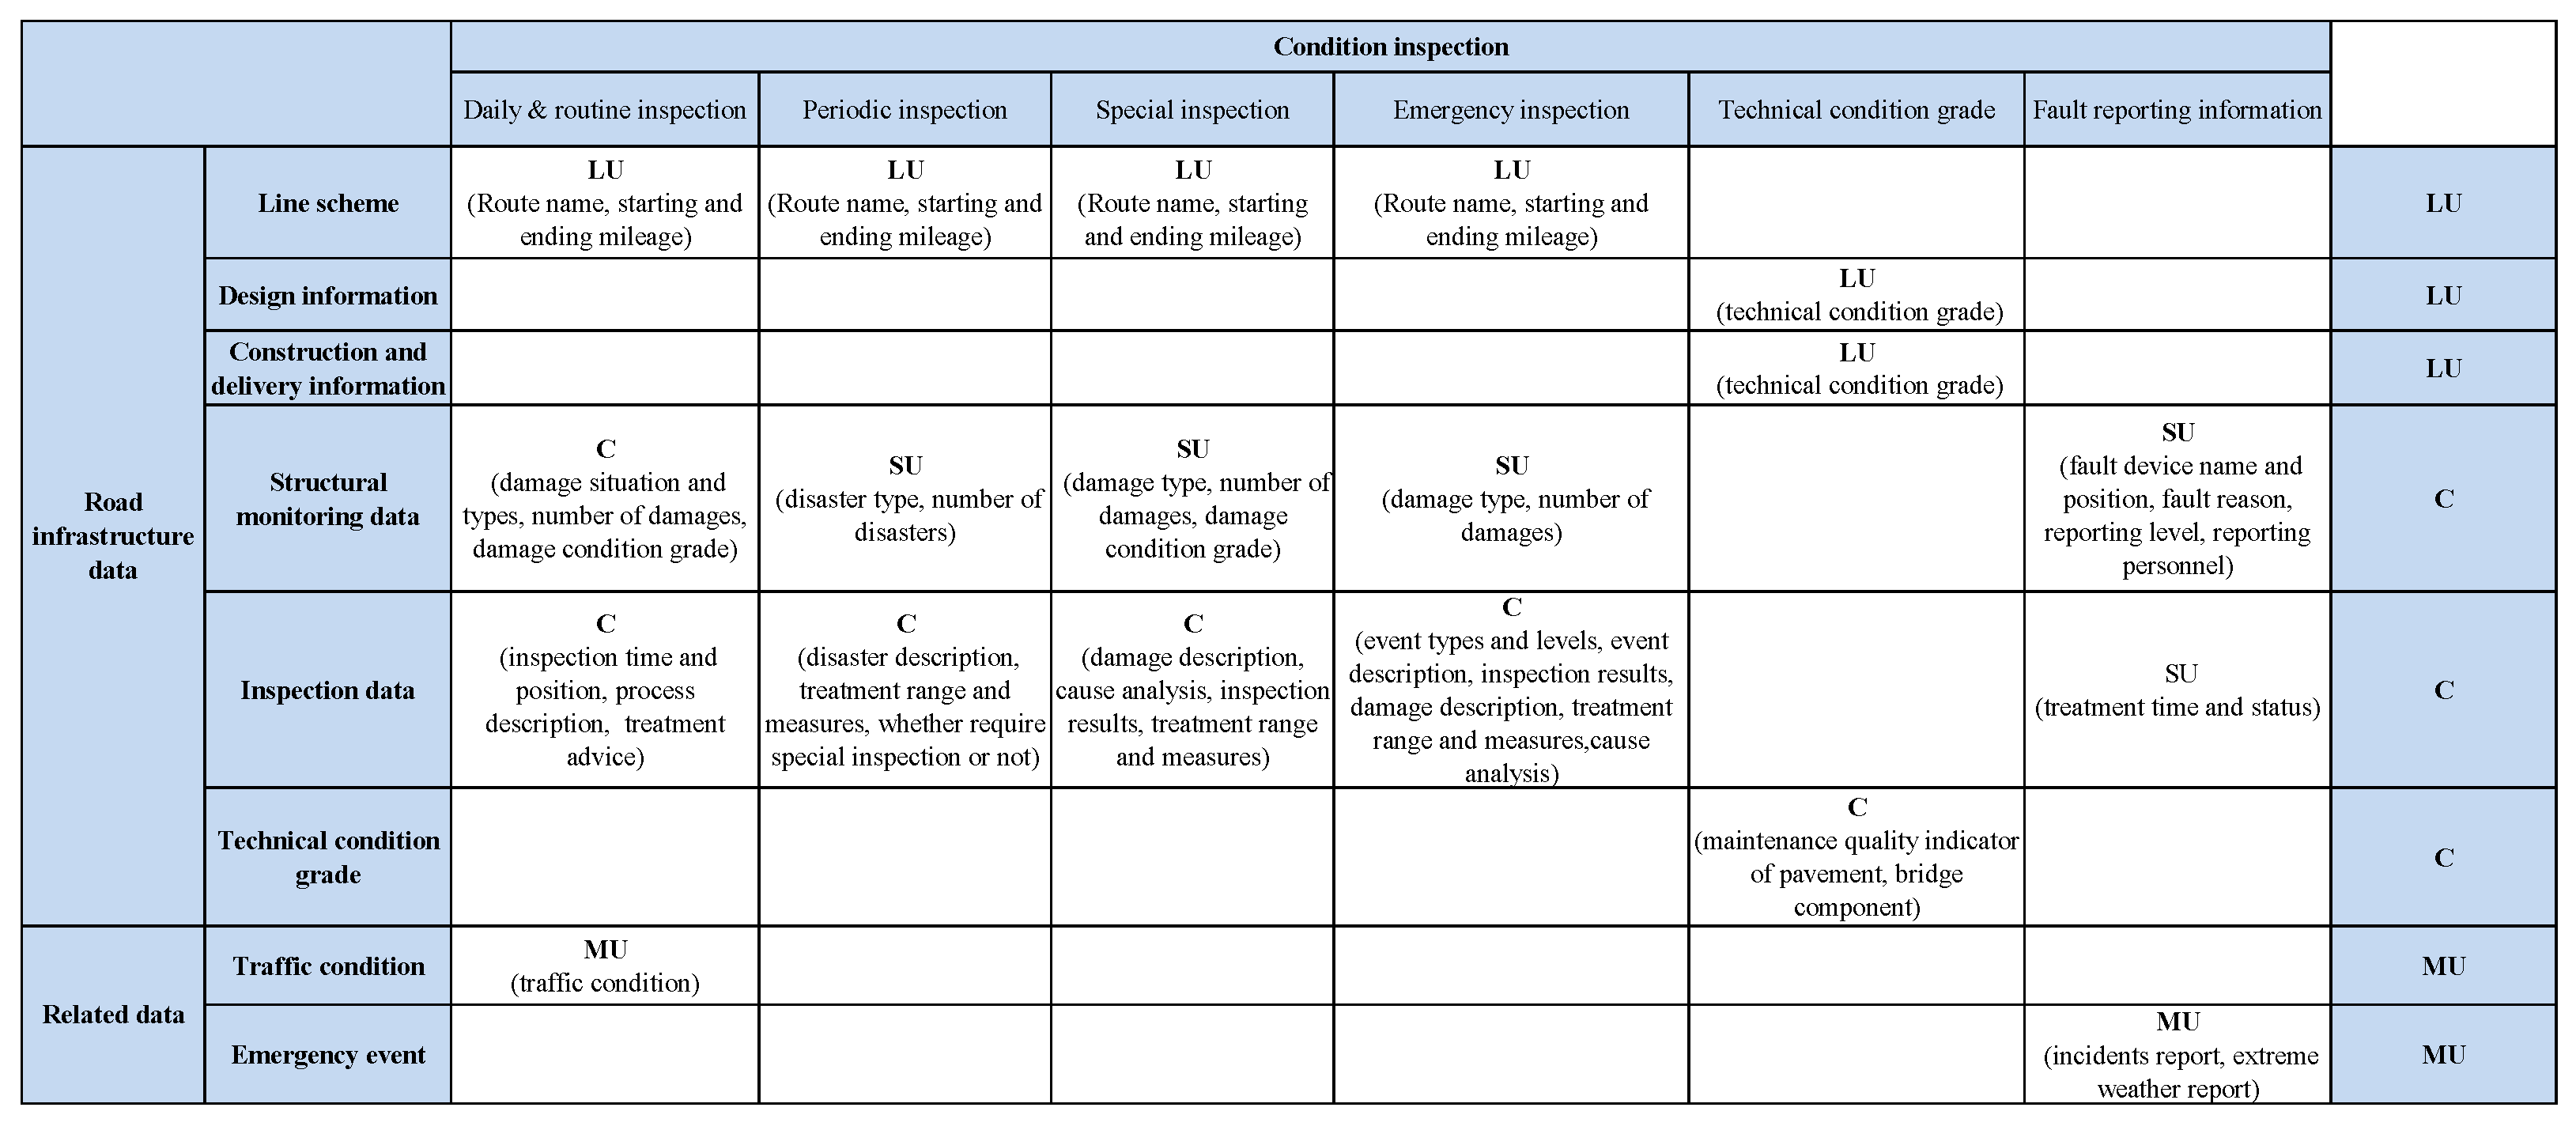
In accordance with the provided and required data, condition inspection with six sub-scenarios to create/use process data are visualized in
Figure 12. The creator, shorter user, medium user, and longer user are denoted by the notations “C”, “SU”, “MU”, and “LU”. Road infrastructure and related data consist of line scheme, design information, construction and delivery information, structural monitoring data, inspection data, technical condition grade, traffic condition, and emergency event. In the column, six sub-scenarios contain daily and routine inspection, periodic inspection, special inspection, emergency inspection, technical condition grade, and fault reporting information. Combined with the sub-scenario status, the creator/user status of condition inspection is presented in the last column. There are some rules for the combination: when the sub-scenario has creator “C”, set the status of condition inspection as “C”; otherwise, the status follows the priority of “LU” > “MU” > “SU”. For instance, “Structural monitoring data” is created by daily and routine inspection, and is shortly used by other sub-scenarios, so the status of condition inspection on “Structural monitoring data” is set as “C”.
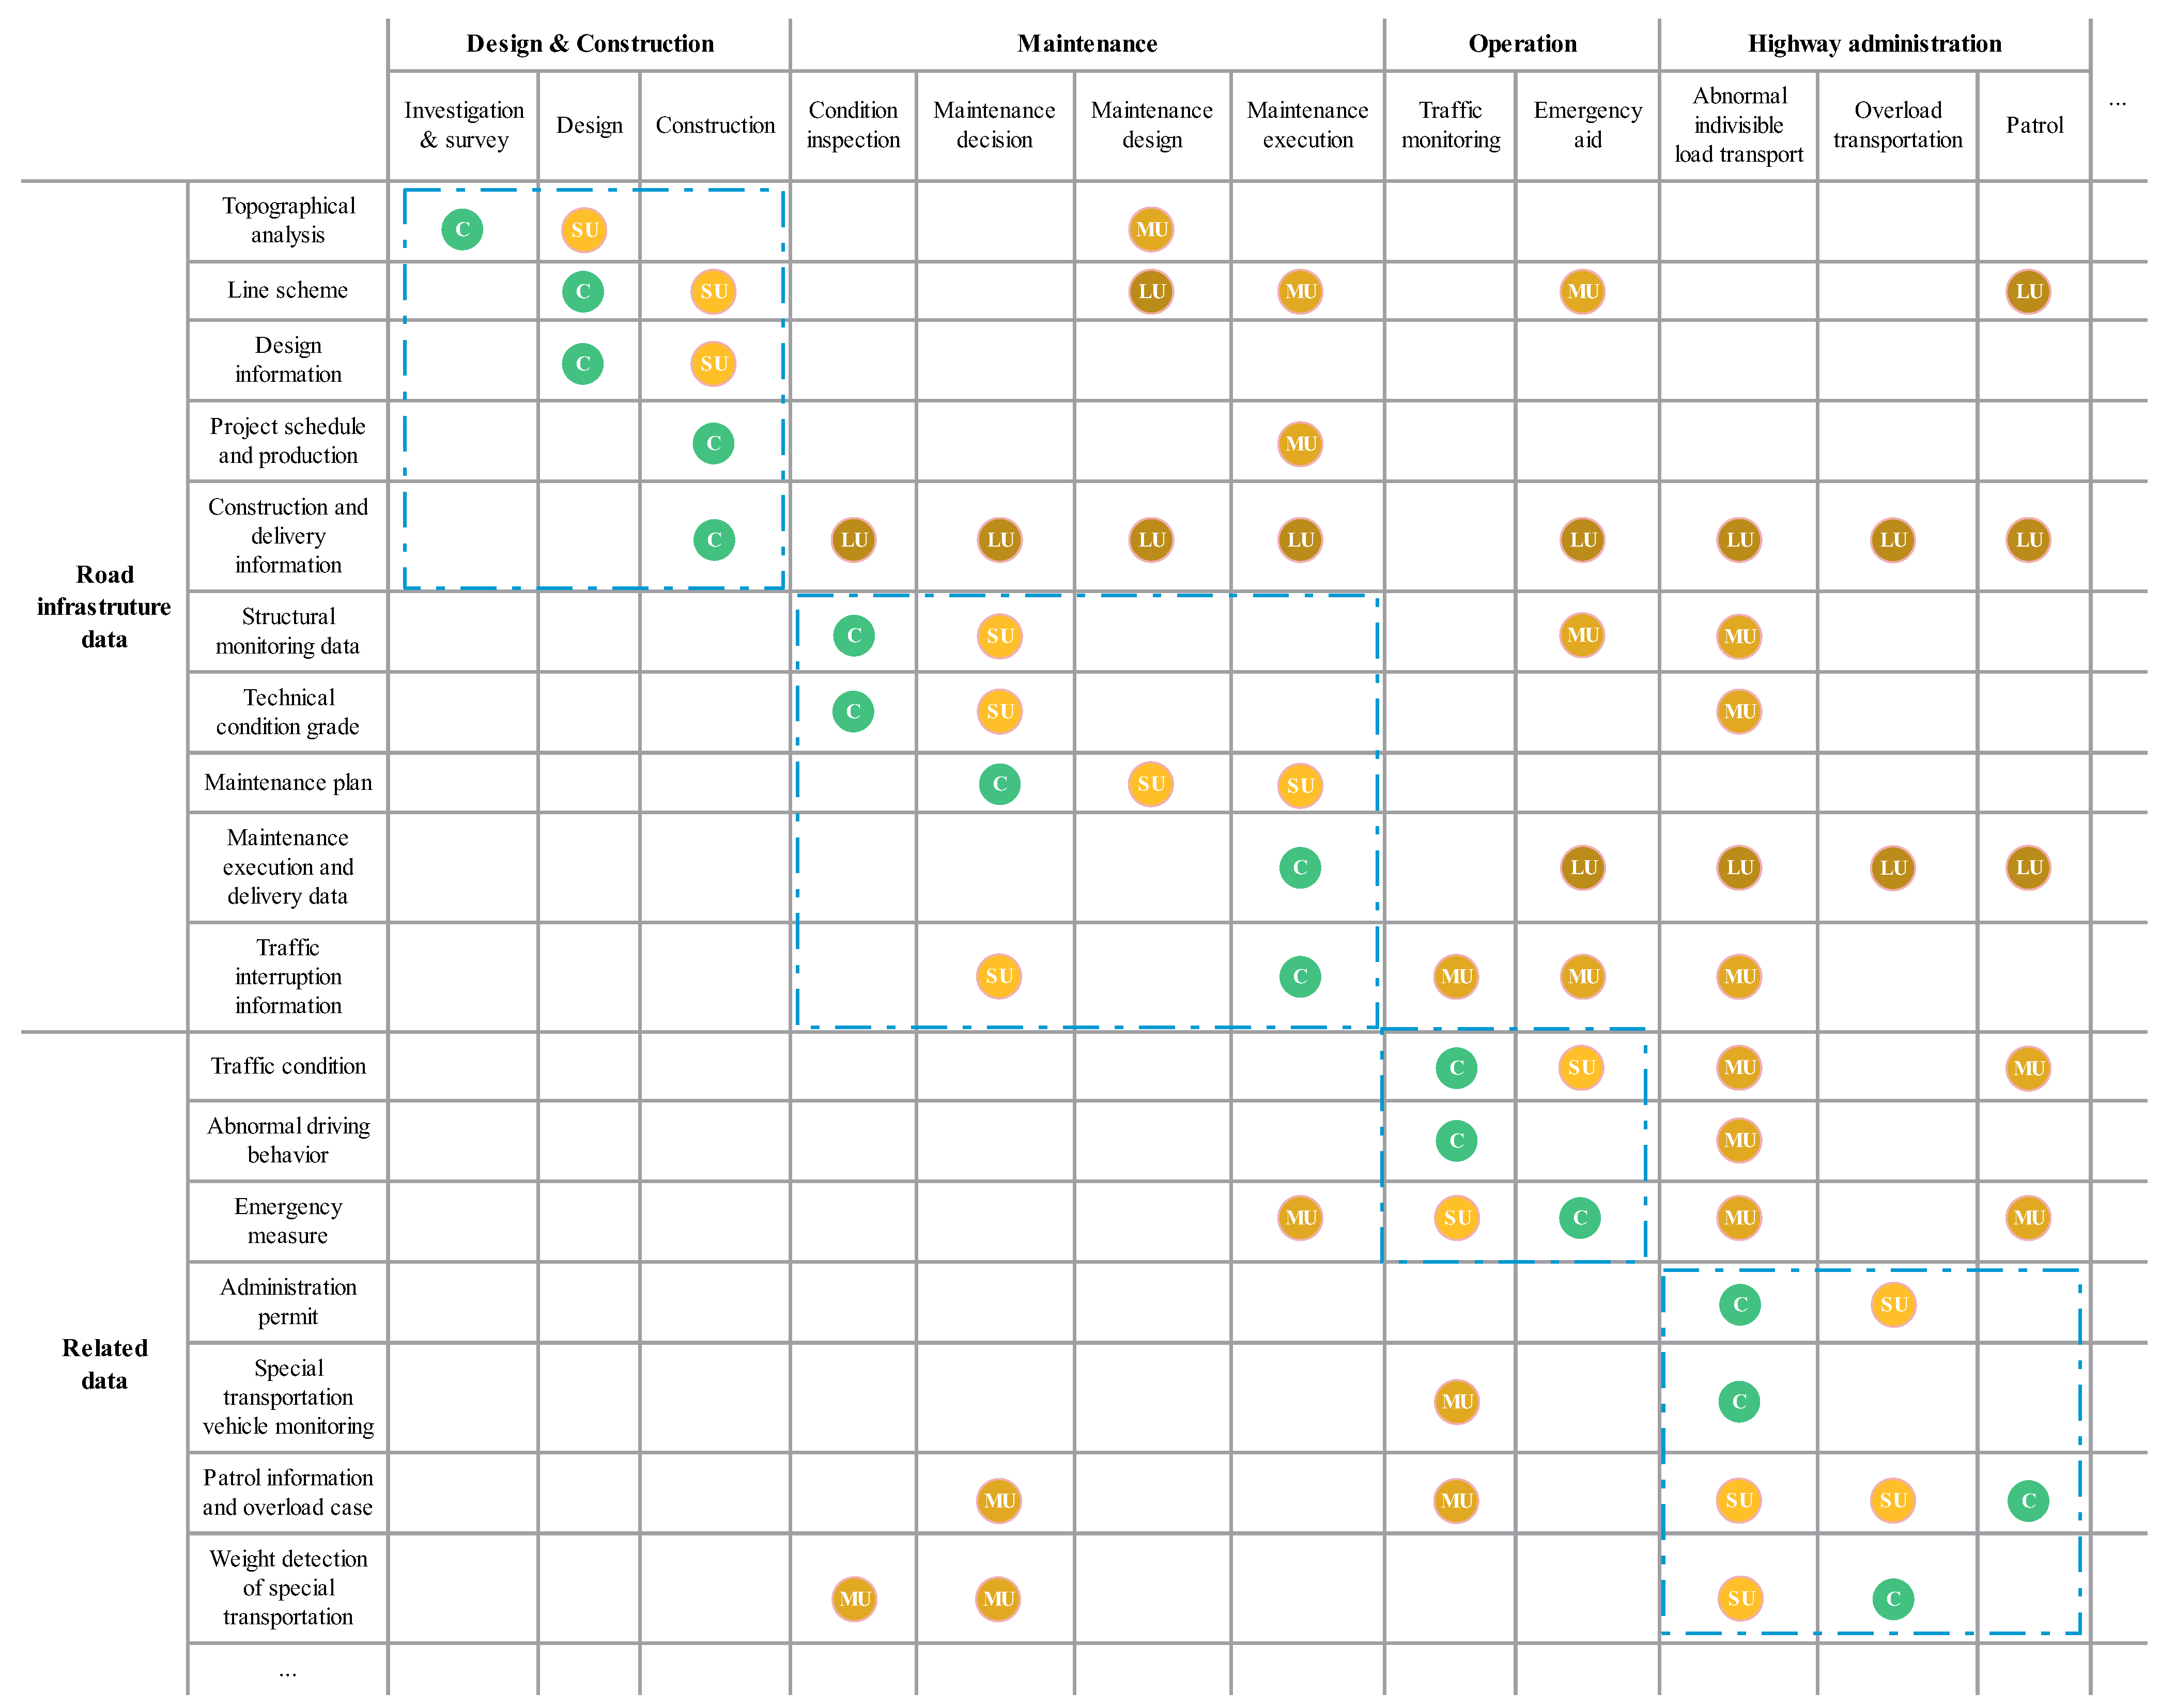
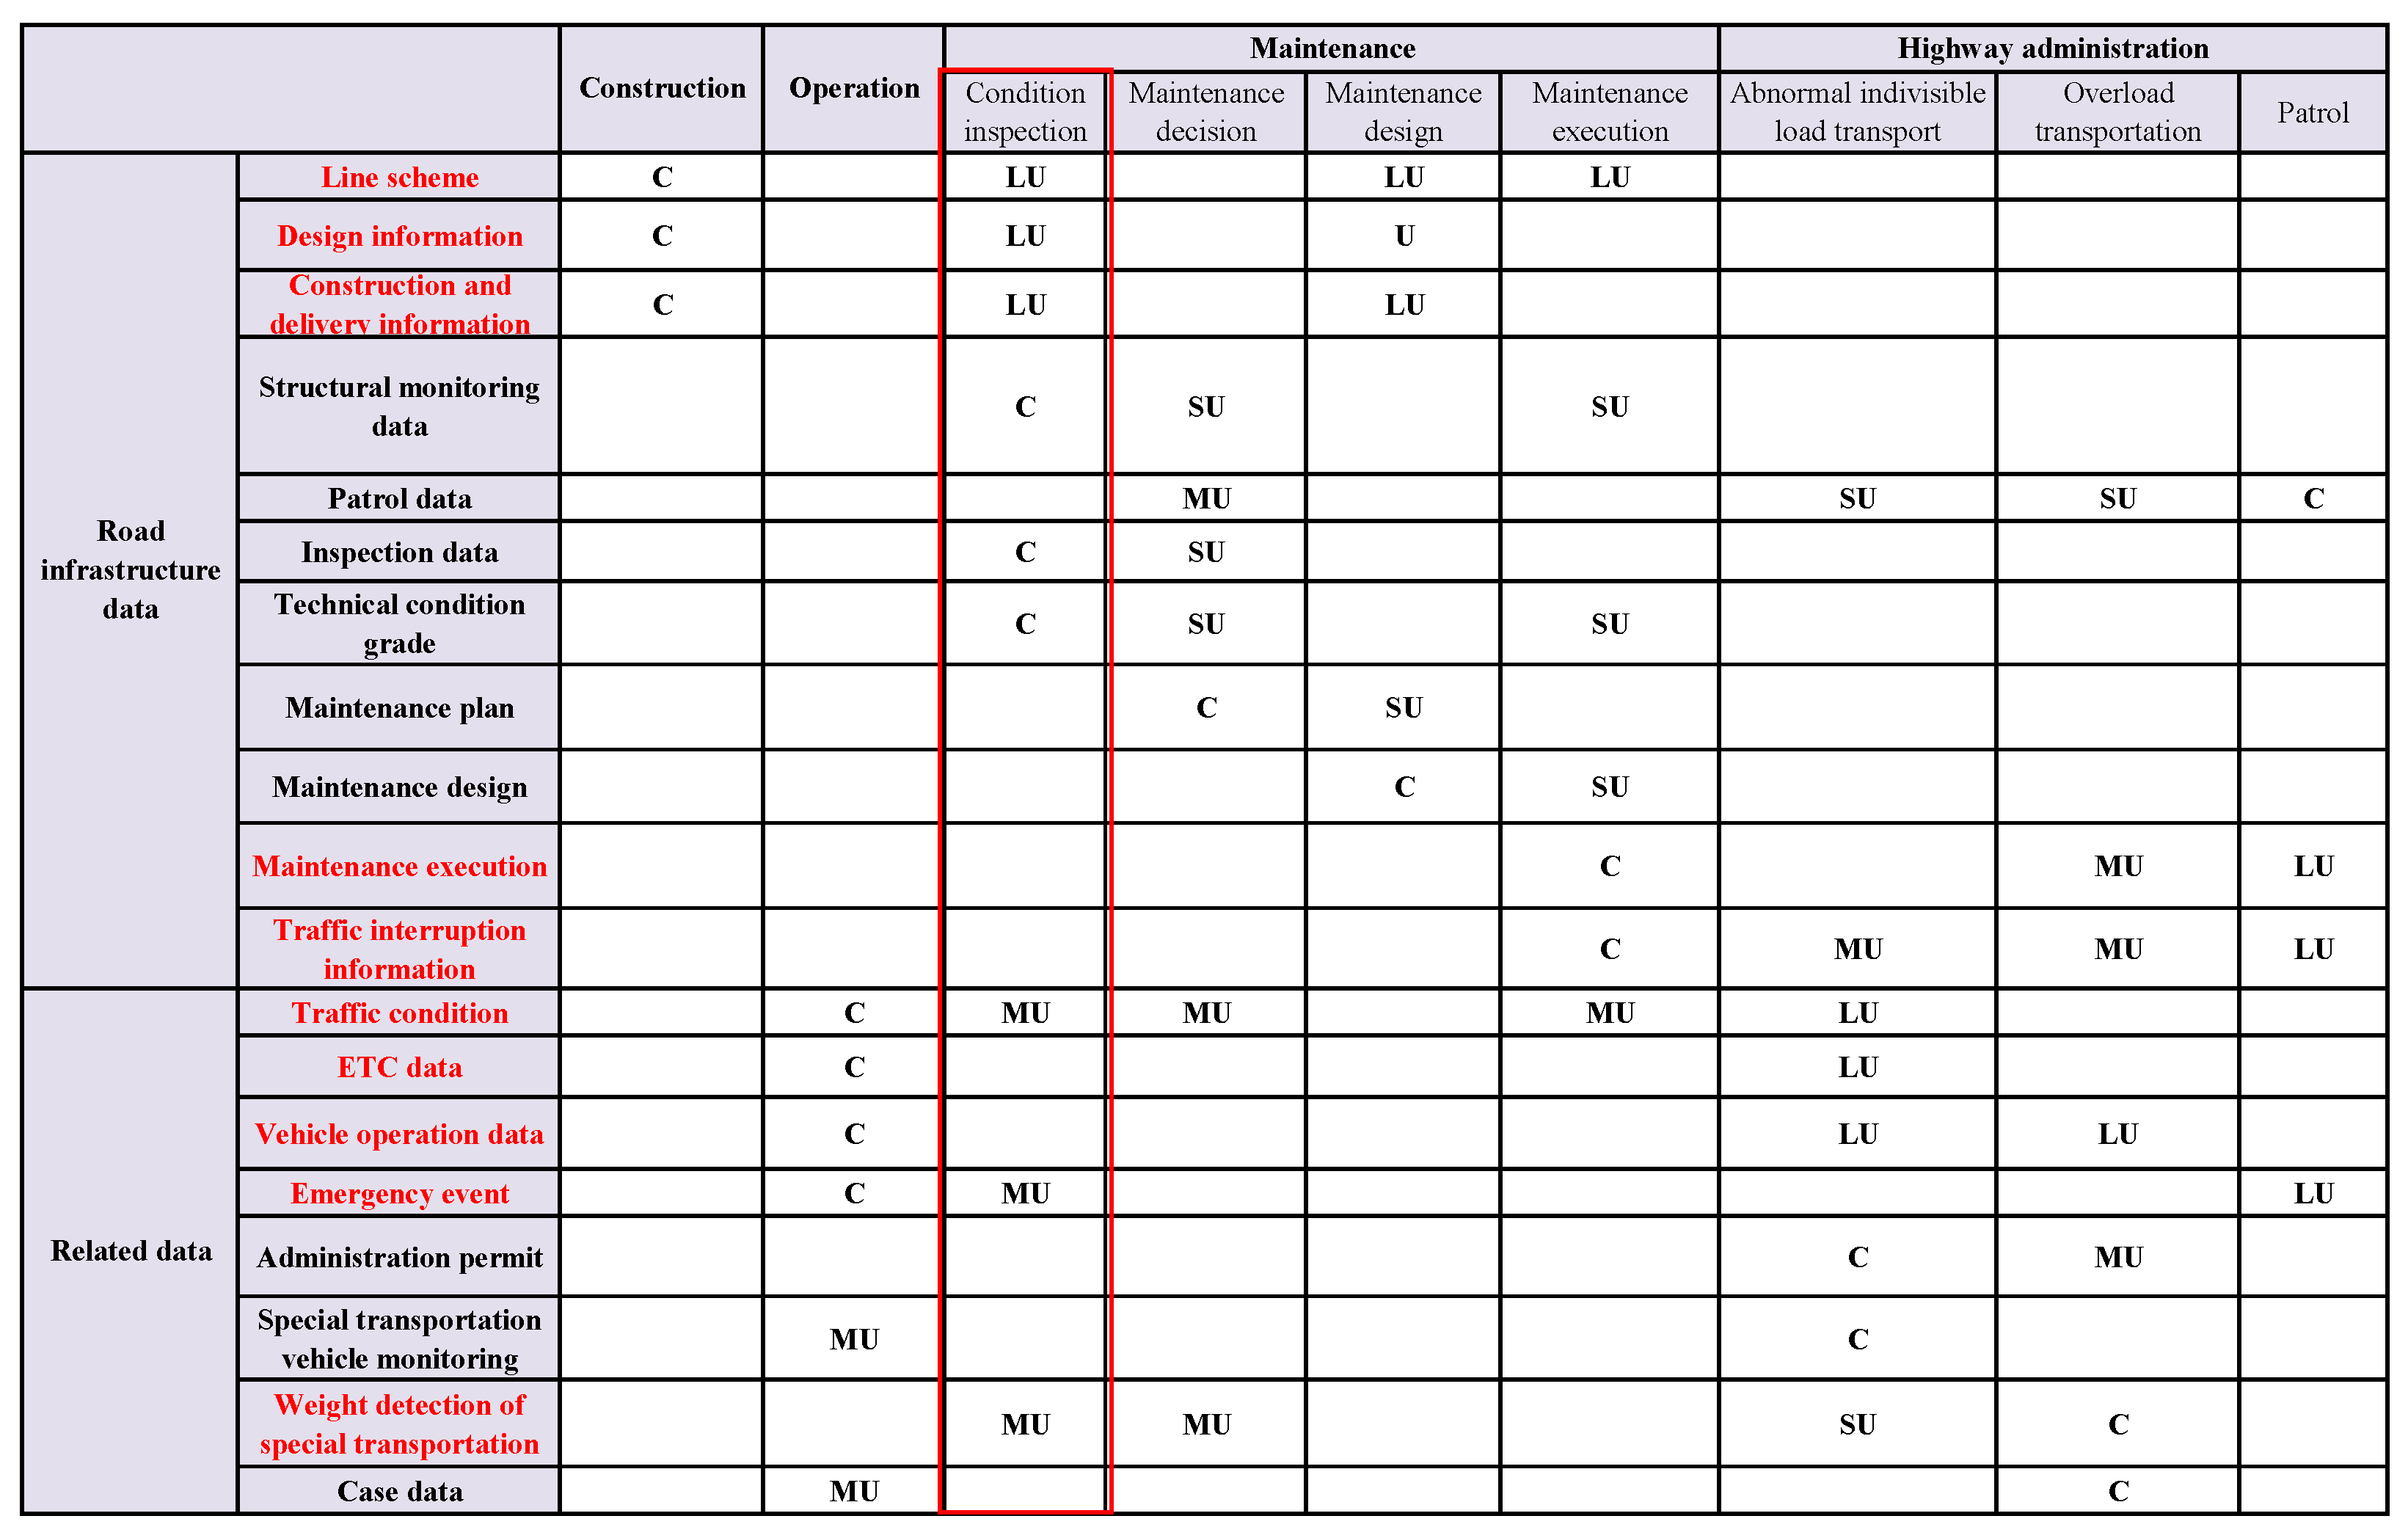
Then, the life-cycle data–process matrix involves 22 sub-scenarios—maintenance and highway administration, construction and operation, etc., as illustrated in
Figure 13. The abbreviation of electronic toll collection data is ETC data. Other scenarios are incorporated with a similar analysis of condition inspection as mentioned above (i.e., the red rectangle in the figure). Each column has one creator and three multi-users (composed of shorter, medium, and longer users) denoted by “C”, “SU”, “MU”, and “LU”. Note that the user is set as the shorter user when the user and creator belong to the same category. When the use frequency is greater than 5 times/day, it is set as the longer user; otherwise, it is set as the medium user.
The principles of source uniqueness and high utilization are chosen to select the master data. When the data have one creator, no less than two medium users, or one longer user (i.e., the data in line contain one “C”, “MU” , or “LU” ), the data have high utilization and are set as the master data. Consequently, the master data set is selected as {Line scheme, Design information, Construction and delivery information, Maintenance execution, Traffic interruption information, Traffic condition, ETC data, Vehicle operation data, Emergency event, Weight detection of special transportation}, i.e., the red color in the figure.
5.2. Data Element Determination Results
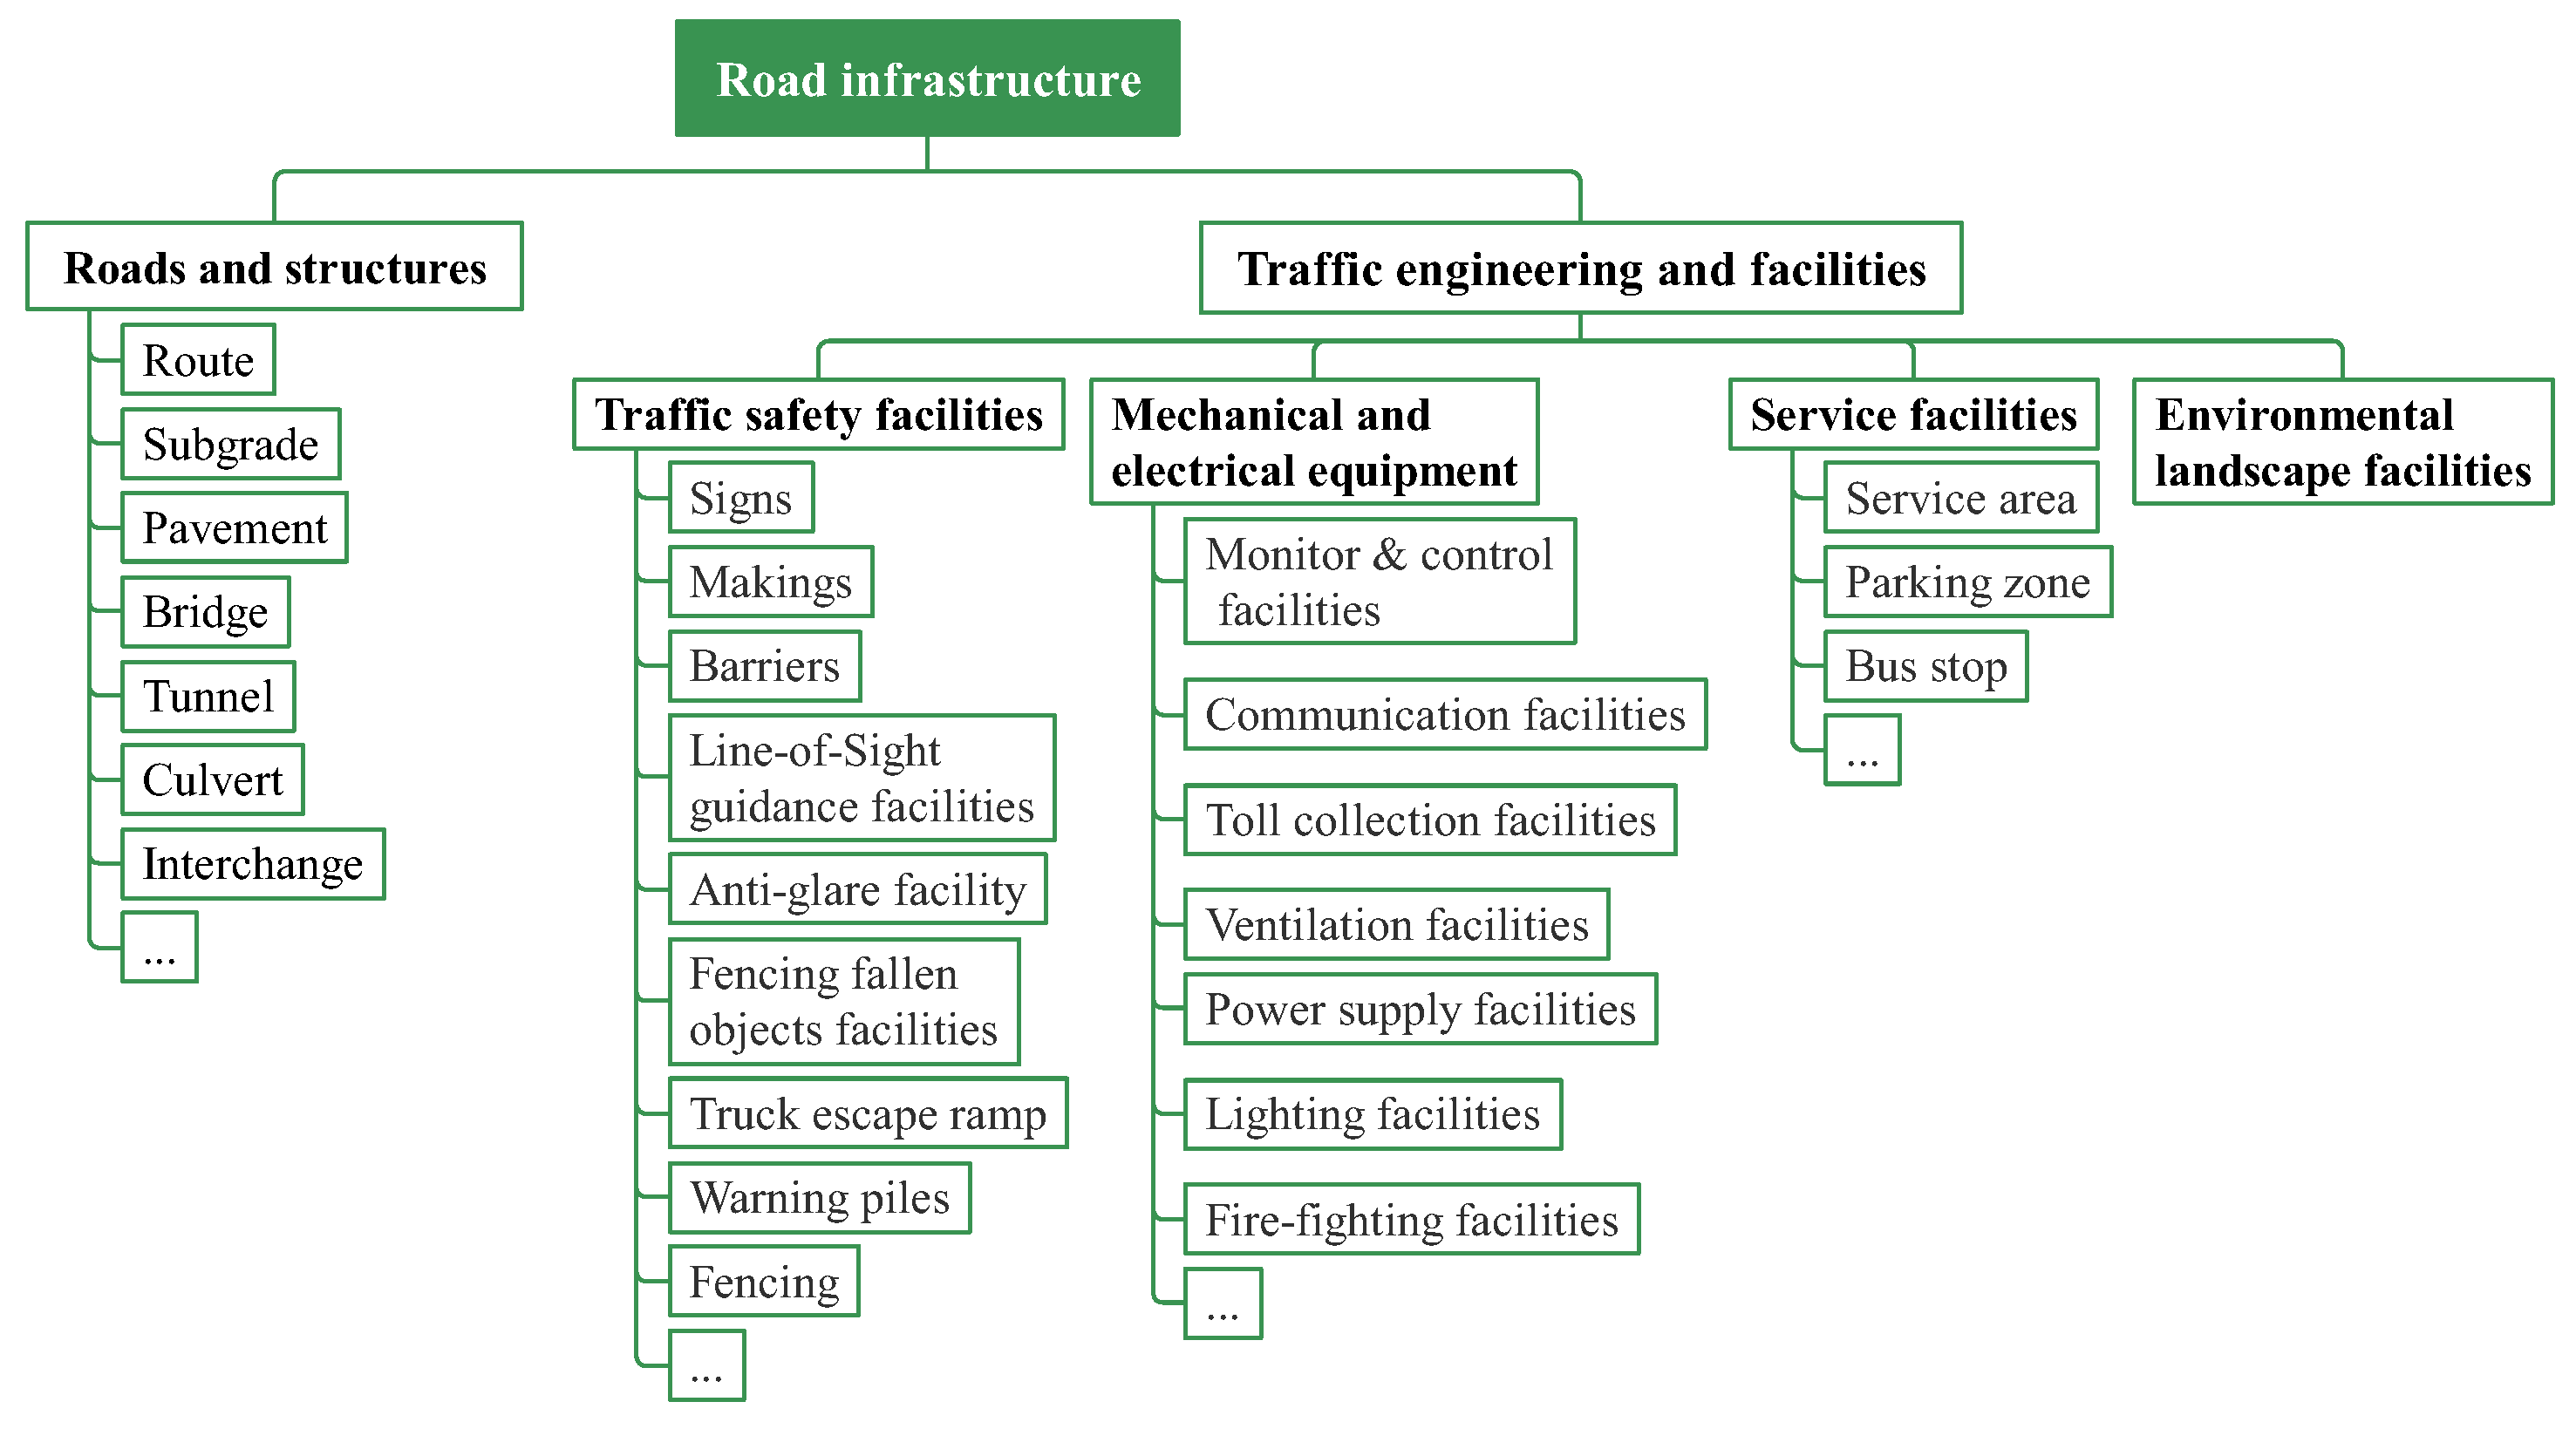
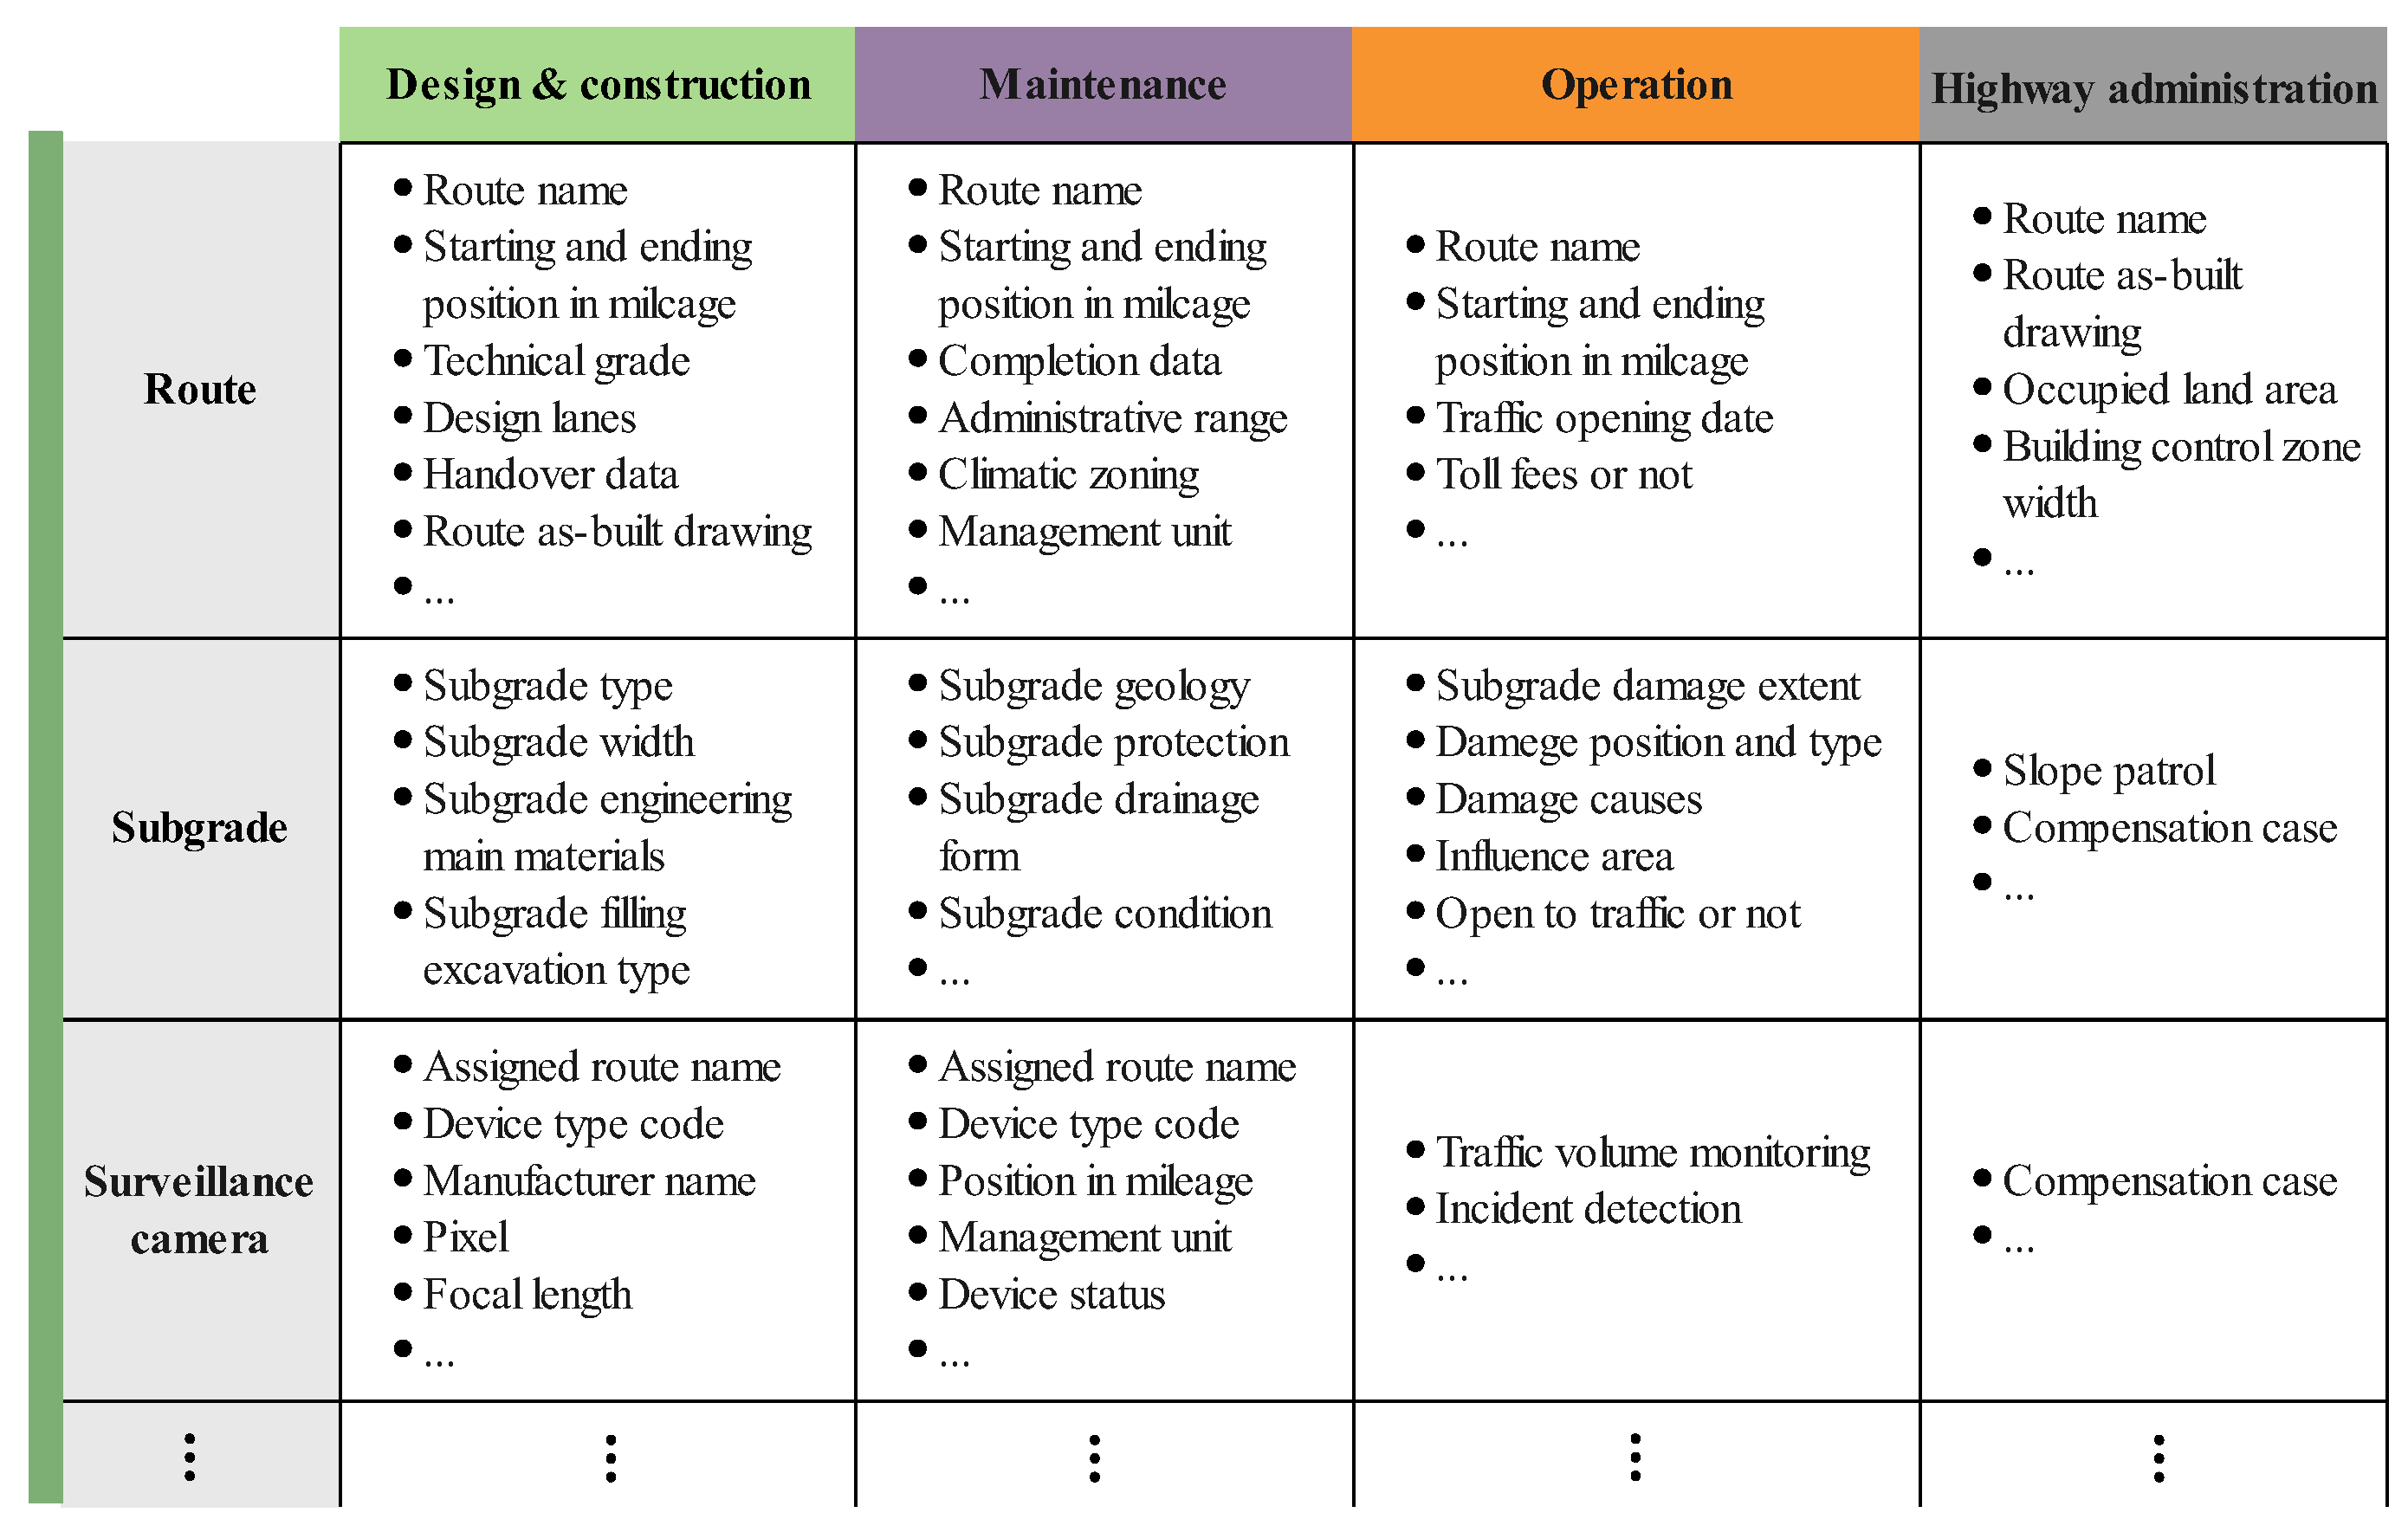
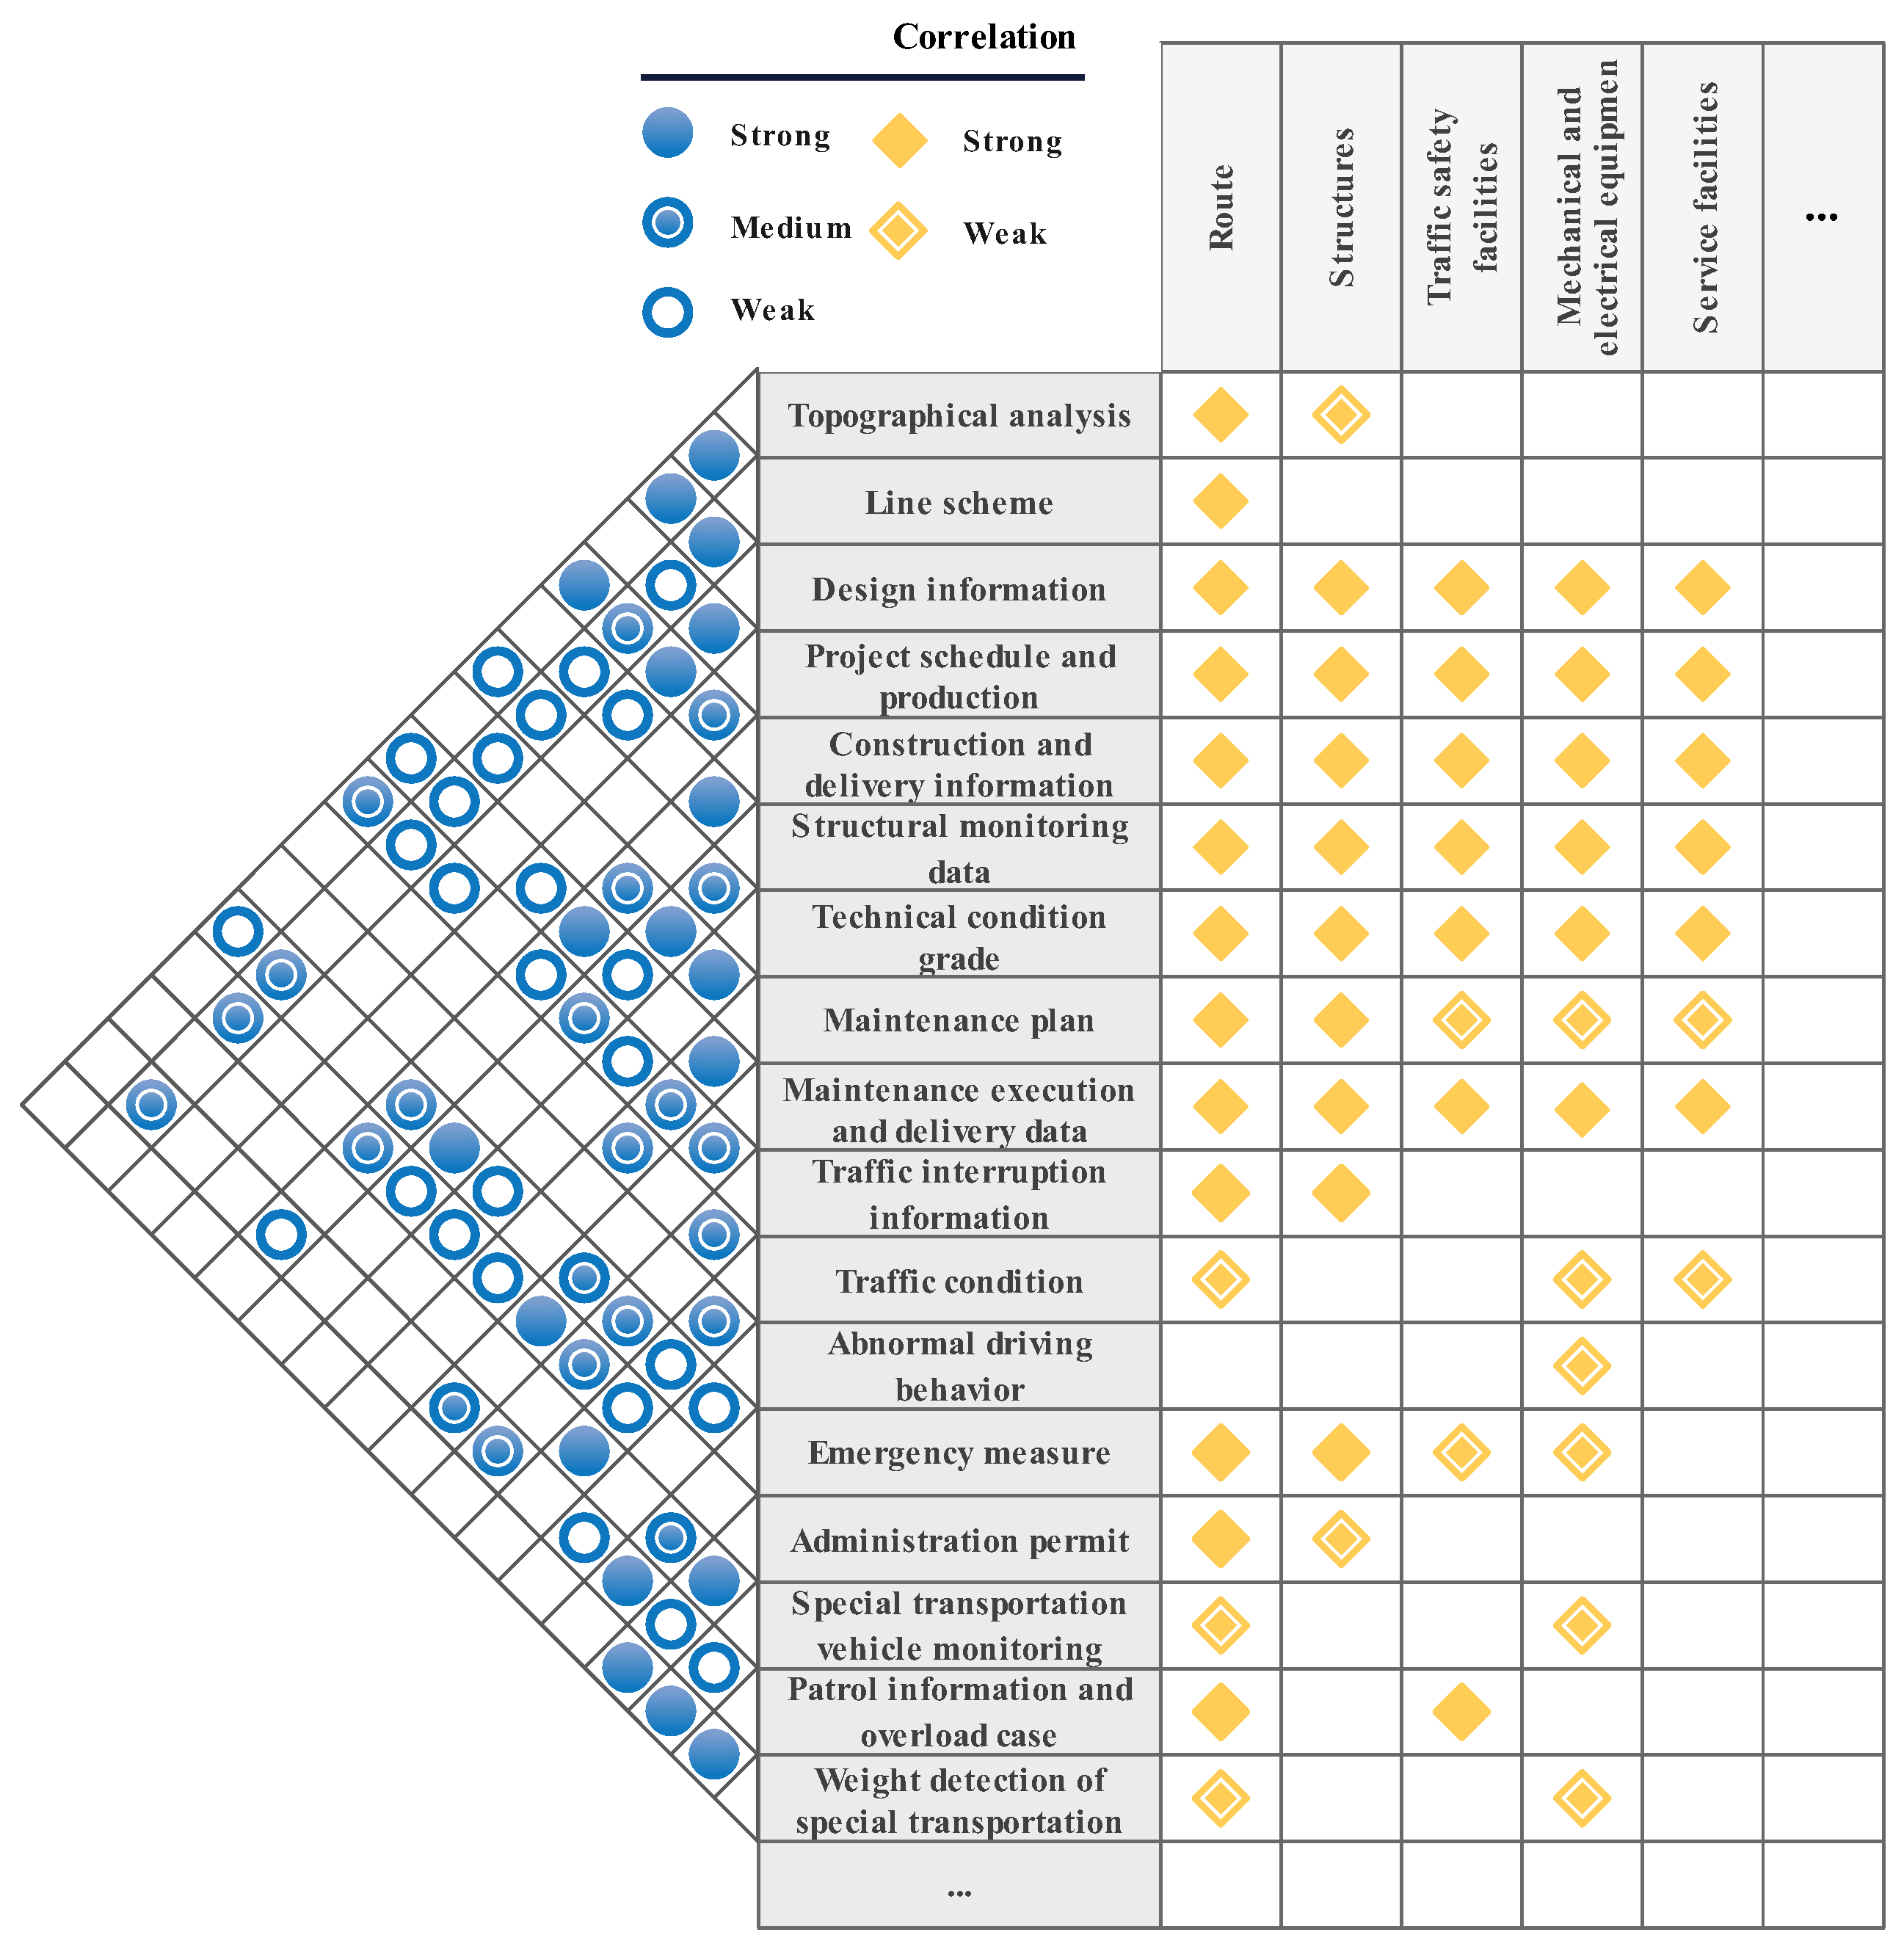
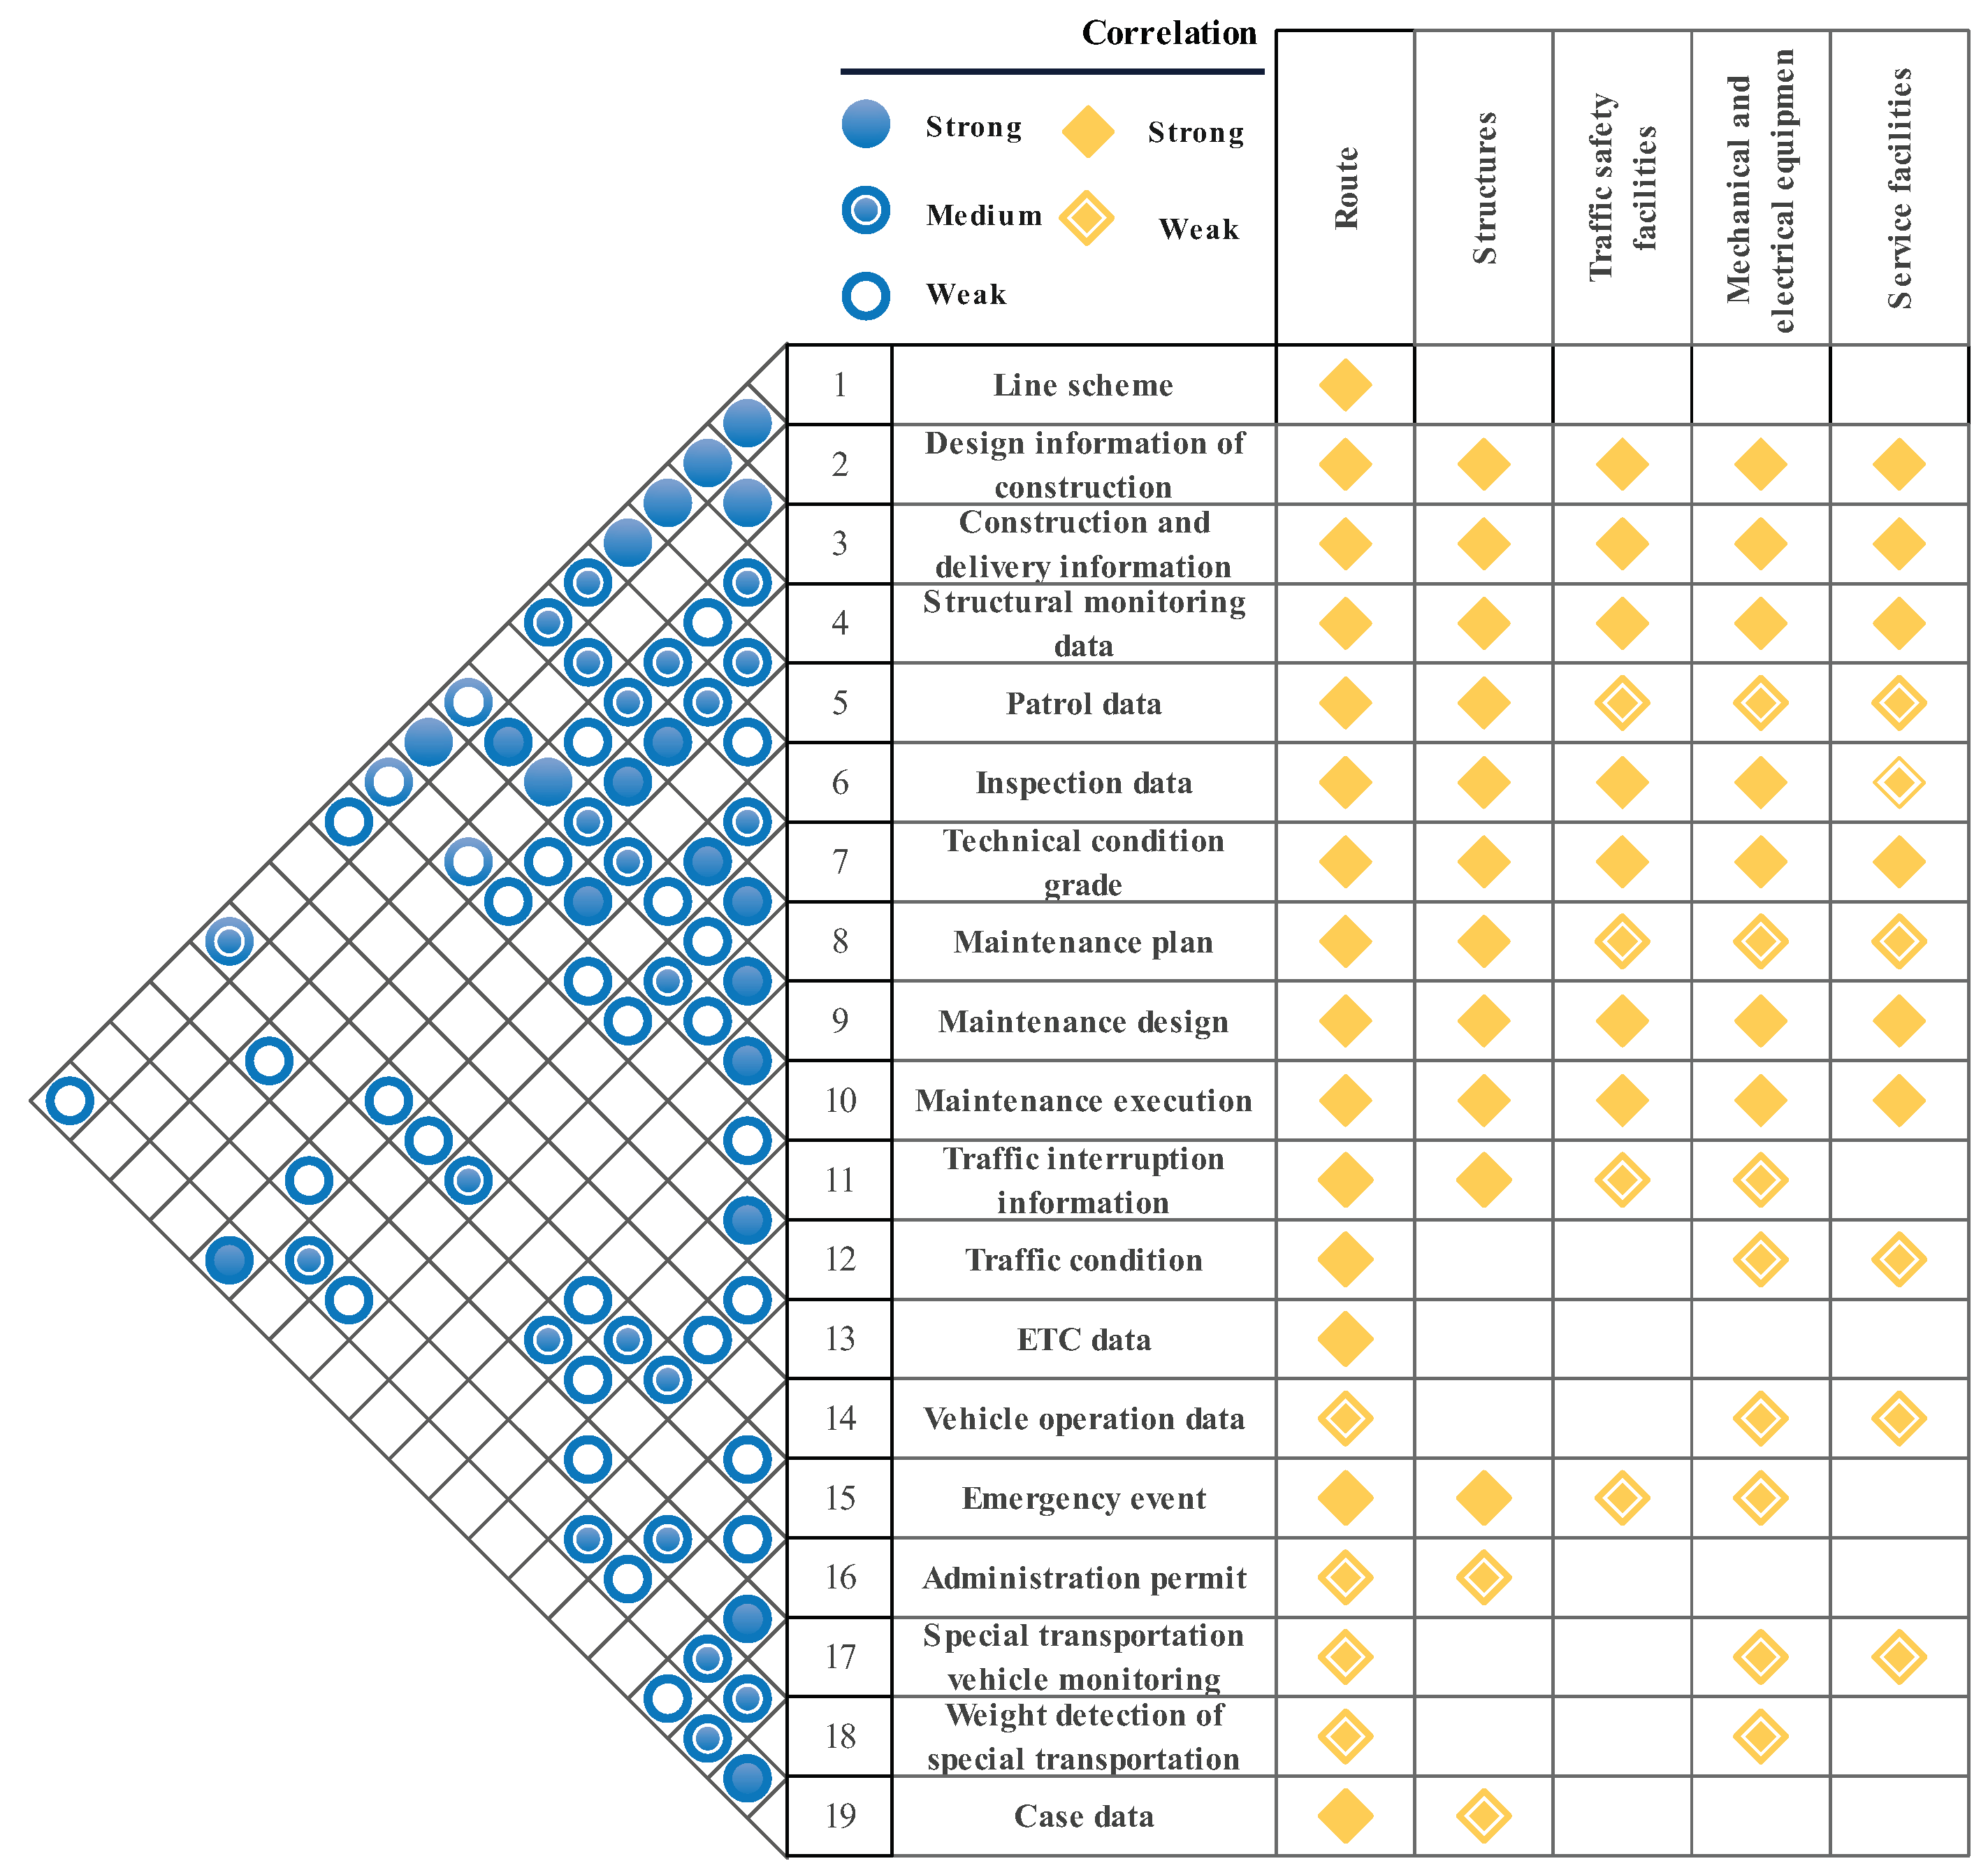
Next, the correlation matrix is formulated to depict the correlation between the process data and infrastructure data as illustrated in
Figure 14. Note that this correlation between process data and infrastructure data mainly depends on standards and workflow regulations. We recommend survey questionnaires to obtain an accurate value of this correlation. The process data in line are obtained in maintenance and highway administration, and infrastructure data in the column consist of route, structures, traffic safety facilities, mechanical and electrical equipment, and service facilities. On the left side, the correlation between different process data is classified into three levels of strong, medium, and weak. For instance, “Construction and delivery information” has a strong influence on “Maintenance design”; there is a medium effect on “Structural monitoring data”, “Inspection data”, “Technical condition grade”, etc., but a weak effect on “Patrol data”, “Maintenance plan”, etc.
In the figure, strong and weak correlations between each process datum and infrastructure datum are denoted by solid and hollow orange diamonds, respectively. The process data of “Design information”, “Construction and delivery information”, and “Structural monitoring data” strongly correlate with all infrastructure, and other data only have a strong or weak correlation with parts of infrastructure data. “ETC data” only have a weak correlation with route data, while “Case data” have strong and weak correlations with route data and structure data.
The data element
of process data
and infrastructure data
is summarized. For instance, data element
of “Line scheme” and route, and
of “Structural monitoring data” and structure are presented below:
Then, according to the correlation matrix (see
Figure 14), the principle of consistency (i.e., same metadata attribute) is selected to determine the master data element. Set threshold value
C as 2 and the modified data element set with medium and strong correlations is selected when correlation coefficient
is not less than 2. The threshold value
A is set as 2, i.e., only the strong correlation between process data and infrastructure data is selected. The master data of the “Weight detection of special transportation” (i.e.,
) are given below to illustrate the calculation process.
The master data
are dependent on the original data element
and have medium correlations with “Inspection data”
, “ETC data”
, “Administration permit”
, and “Special transportation vehicle monitoring”
, as well as a strong correlation with “Case data”
. With principles of consistency and value (denoted by
), the master data of “Weight detection of special transportation” can be obtained when those data elements have the same metadata attribute. Note that
and
are empty sets because these two process data cannot contain the strong correlation with infrastructure data (because the threshold value
A is 2). Thus, we have
where
Table 7 shows the original data element of “Inspection data”
, “ETC data”
, “Weight detection of special transportation”
, and “Case data”
for the master data
calculation. Index is the number index
u of process data in
Figure 14. Note that the original data of
, respectively, denote the data element of route, structure, traffic safety facility, and mechanical and electric equipment. For instance,
contains equipment ID, operational status, fault cause, etc., to describe the inspection of mechanical and electric equipment.
For consistency and value, the same and valuable metadata attributes are selected from
,
, and
, and then the original data
are extended to obtain the master data. Hence,
contains two parts: the route, and mechanical and electrical equipment. They are given below:
where
and
correspond to
and
, and
and
. So, we have the following:
{route ID, route name, overload station ID, station name, mileage of station, detection direction, entrance and exit toll gate, entrance and exit time, vehicle trajectory, vehicle license number, carrying capacity, cargo type, violate time, punishment type, cargo source company}.
{lane ID, equipment ID, operational status, operating environment, detected vehicle type, detection time, detected vehicle speed, total weight of cargo, detected number of axles}.
6. Conclusions
Highway asset management encounters difficulty with the hundreds of types of infrastructure. To achieve maximal data sustainability and minimal cost, infrastructure digitalization is the main method used to integrate information resources and support life-cycle application scenarios. In this paper, the digital requirements are analyzed from the literature and through survey questionnaires, and a research methodology with a six-step procedure is proposed to guide the development of the life-cycle framework. The infrastructure digitalization framework is designed with four layers and two support systems, i.e., road infrastructure and other data, data governance, life-cycle data integration, application scenarios, regulations and standards, and performance assessment. Focused on data integration, an approach with the modified data–process matrix, correlation matrix, and selected factors is first developed to identify master data and the elements. Static and dynamic data are connected in the data relationship model from multi-source infrastructure data. Finally, we verify the effectiveness of the life-cycle data integration approach in numerical experiments to guide the data interoperation between highway administration and maintenance, operation, etc.
Faced with transportation digitalization and transformation, some potential future developments can also be considered in highway asset management. First, a performance assessment system is required to establish a set of detailed evaluation indicators to guide the highway digital transformation in terms of economic and social benefits, like sustainability, values, and outcomes. Second, highway digital transformation involves not only physical infrastructure but also organizational transformation, such as approval process simplification, people’s digital ability, compatible regulation, etc. Third, highway digitalization is a new high-quality means of productivity that promotes society’s economic growth and infrastructure, and other data that act as a digital asset will serve in the integration of transportation with tourism, logistics, commercial business, etc.
