Article

A Framework of Life-Cycle Infrastructure Digitalization for Highway Asset Management

1
Research Institute of Highway Ministry of Transport, Beijing 100088, China
2
State Key Lab of Intelligent Transportation System, Beijing 100088, China
*
Author to whom correspondence should be addressed.
Sustainability 2025, 17(3), 907; https://doi.org/10.3390/su17030907
Submission received: 25 November 2024 / Revised: 13 January 2025 / Accepted: 13 January 2025 / Published: 23 January 2025
(This article belongs to the Section Sustainable Transportation)

Abstract

:
With increased highway mileage, various types and quantities of infrastructure are equipped on the roadside to improve traffic safety and efficiency but also encounter difficulty in asset management. The collected data are separately stored with diverse formats, granularity and quality, causing repeated acquisitions and islands of information coherence. The life-cycle interoperability of infrastructure data are required to support life-cycle application scenarios in sustainable development. This paper analyzes 459 papers and 538 survey questionnaires to obtain the literature and practical digital requirements, including unified classification and standardized formats, linkage from separated data sources, support for data analysis across different scenarios, etc. To satisfy these requirements, an infrastructure digitalization framework is proposed, including road infrastructure and other data, data governance, life-cycle data integration, application scenarios, regulations and standards, and performance assessment. The application scenarios involve four categories—design and construction, maintenance, operation, and highway administration—each of which contains four or five scenarios. Then, the data integration approach is first developed with master data identification and determination of data elements for data interoperation between different application scenarios, using a modified data–process matrix, correlation matrix, and evaluation factors. A data relationship model is adopted to present static and dynamic correlations from the multi-source data. Numerical experiments are implemented with two practical highway administration and maintenance systems to demonstrate the effectiveness of the data integration approach. Master data identification and data element determination are applied to guide life-cycle data interoperation.

1. Introduction

With expeditious growth in mileage, highway asset management encounters pressure with various types and quantities of infrastructure and long life-cycles. Assets consist of physical infrastructure, human resources, equipment and materials, rights of way, computer systems, methods, technologies, etc. [1], and this paper mainly focuses on physical infrastructure. By 2023, China’s highway mileage had reached 5.43 million kilometers, comprising 183.6 thousand kilometers of expressways, more than 1.07 million bridges, and 27.2 thousand tunnels [2], ranking first in the world. Meanwhile, a variety of facilities are equipped on the roadside to improve traffic safety and management efficiency, such as perception sensors, traffic control devices, positioning and communication devices, etc. Several hundred types of highway infrastructure have increased the management difficulty, owing to their long life-cycles across construction, maintenance, and operation. Traditional infrastructure management aims at special application scenarios and naturally causes information fragmentation. Due to the lack of coordination between whole-life-cycle application scenarios, infrastructure data suffer from missing values, inconsistency, varying granularity, etc., resulting in lower utilization efficiency in other scenario applications and a high cost of repeated data collection.
Sustainable transport is central to sustainable development for universal access, enhanced safety, reduced environmental and climate impact, improved resilience, and greater efficiency [3]. Infrastructure, as a crucial asset in society, influences 72% of the targets of the Sustainable Development Goals (SDGs). Reducing life-cycle costs of transport infrastructure is an effective way to achieve green and low-carbon transport [4,5]. There are also some state-of-the-art methods and solutions in traffic and transportation engineering for energy saving [6]. Infrastructure digitalization, as an innovation driving transport sustainability, has transformed domains from data acquisition to whole-life-cycle data government and analysis, supporting the decision-making process of highway asset management.
The purpose of this paper is to develop a framework and approach to improve data interoperability between life-cycle application scenarios. Therefore, the life-cycle asset management framework and data integration method for master data and element identification both need to be addressed for infrastructure data recycling across different scenarios. Note that master data are the common infrastructure data that exist across critical application scenarios; for the underlying information objects, refer to [7].
A variety of asset management frameworks have been proposed by international technical societies for investment appraisal, strategy setting, program definition, evaluation and forecasting benefits, and improved performance, including The Institute of Asset Management (IAM) [8], World Road Association (PIARC) [9], Global Forum on Maintenance and Asset Management (GFMAM) [10], etc. In 2024, the IAM’s 10-box capabilities model [8] was proposed, with a whole-life/whole-cost perspective involving information management, life-cycle delivery, asset management decision making, values and outcomes, etc. These frameworks have also been applied in power systems [11,12], railways [13], etc. Some standards [14,15,16] have been released to regulate the requirements for the establishment, implementation, operation, maintenance, and improvement of asset management systems. Abu-Samra et al. [17] presented an asset management framework including data collection and invention, intervention quantification modeling, and an optimization model to ensure proper expenditure utilization and maintain performance in municipal infrastructure coordination. To find barriers to road infrastructure, Cruz and Sarmento [18] discussed the impact of technologies on existing management, including infrastructure-related and service-related innovations. Petchrompo et al. [19] proposed the two multi-asset categories of fleet and portfolio, and potential multi-component dependencies (performance, stochastic, and resource) were selected to apply in multi-asset systems. Transportation asset management was proposed to describe the strategic and systematic process of operating, maintaining, upgrading, and expanding physical assets effectively throughout their life-cycles [20]. O’Brien et al. [21] developed a guide for integrated civil management to assess the use of digital information in project delivery and subsequent asset management, improve project quality, and more effectively control costs. To achieve sustainability perspectives, Hanski et al. [22] conducted a systematic literature review of strategic asset management frameworks including data collection, descriptive analysis, category selection, and data evaluation.
Highway asset management has also paid increasing attention to risk evaluation [23], impact indicators [24], decision support [25], sustainability, etc. The impact of connected and automated vehicles has also been discussed in asset management [26]. A value-based method was proposed to map stakeholder requirements for effective decisions on infrastructure asset management and was demonstrated in a case study of transportation tunnels [27]. Asres et al. [28] conducted a meta-analysis with preferred reporting items for systematic reviews and meta-analyses (PRISMA) principles to develop a single sustainable flexible pavement design framework for highway agencies to effectively quantify the lifetime sustainability performance of flexible pavement in the design phase. Hakimi et al. [29] designed a digital twin-based life-cycle management framework based on data fusion and the integration of open building information modeling (openBIM) and geographic information systems (GISs). Wang et al. [30] proposed a technical framework for highway construction, including perception acquisition, integrated processing, business application, etc., and summarized the developmental status of key technologies. Peraka et al. [31] collected and reported current state-of-the-art developments of pavement asset management systems, summarizing information on data collection methods, data analysis, decision-making tools, and processing methods. Adey et al. [32] used a high-level process of the entire road infrastructure management process to increase efficiency and effectiveness. Recent studies have mainly focused on a single phase but lacked a life-cycle framework for highway infrastructure in asset management.
To capture the effects of digitalization, digital infrastructure was defined as a socially embedded mechanical system with feedback loops and self-reinforcing, including technological and human components, network, systems, and processes [33]. Digital technologies have been applied in various fields to improve efficiency, such as construction [34,35,36], freight transport [37], urban green economic transformation [38], urban water systems [39], entrepreneurial ecosystems [40], municipalities [41], etc. Lafioune et al. [41] conducted a study on the barriers and issues of urban infrastructure from a systematic literature review, like the lack of organizational change management, absence of data management, etc.
In highway infrastructure, some methods have been proposed to increase data interoperation, such as artificial intelligence (AI) of data analysis, GIS, BIM, and digital twin. The interstate highway system [42] incorporated risks of system failure and performance measures in an asset management framework with asset data inventory. Piryonesi et al. [43] applied decision trees to the analysis of long-term pavement performance database to predict the deterioration of the pavement condition index. Gao et al. [44] conducted a bibliometric analysis of BIM and digital twin technologies on transportation and discussed the goals of the entire life-cycle management. Current studies on road infrastructure data management mainly focus on data inventory and the proposed concept of life-cycle delivery, but lack the detailed method to guide data integration.
Highway traditional information systems are designed for business applications with vertical resources, resulting in the islands of information coherence. To enhance data recycling, master data management (MDM) was recommended to capture, integrate and subsequently share the master data, achieving accurate, timely, consistent and complete data quality [7,45,46]. Then, multi-domain master data management was presented to build a more cohesive multi-domain MDM plan with a series of strategies [47,48], including master data definition, data integration, data government, data stewardship, quality management, etc. These strategies are also applied in this paper to guide the data integration on highway infrastructure management, but do not provide specific approaches for identifying master data and determining the element.
Highway infrastructure digitalization captures, governs, integrates and analyzes digital data of physical infrastructure across design and construction, maintenance, operation and highway administration to maximize long-term data sustainability and minimize the life-cycle cost; also, refer to [49]. This paper proposes the life-cycle framework for highway asset management to support the recycling of infrastructure data and achieve the delivery from construction to maintenance, operation, and highway administration in multi-users. Then, an integration approach is developed to identify master data and determine elements for infrastructure data interoperation. The main contributions of this paper are given as follows:
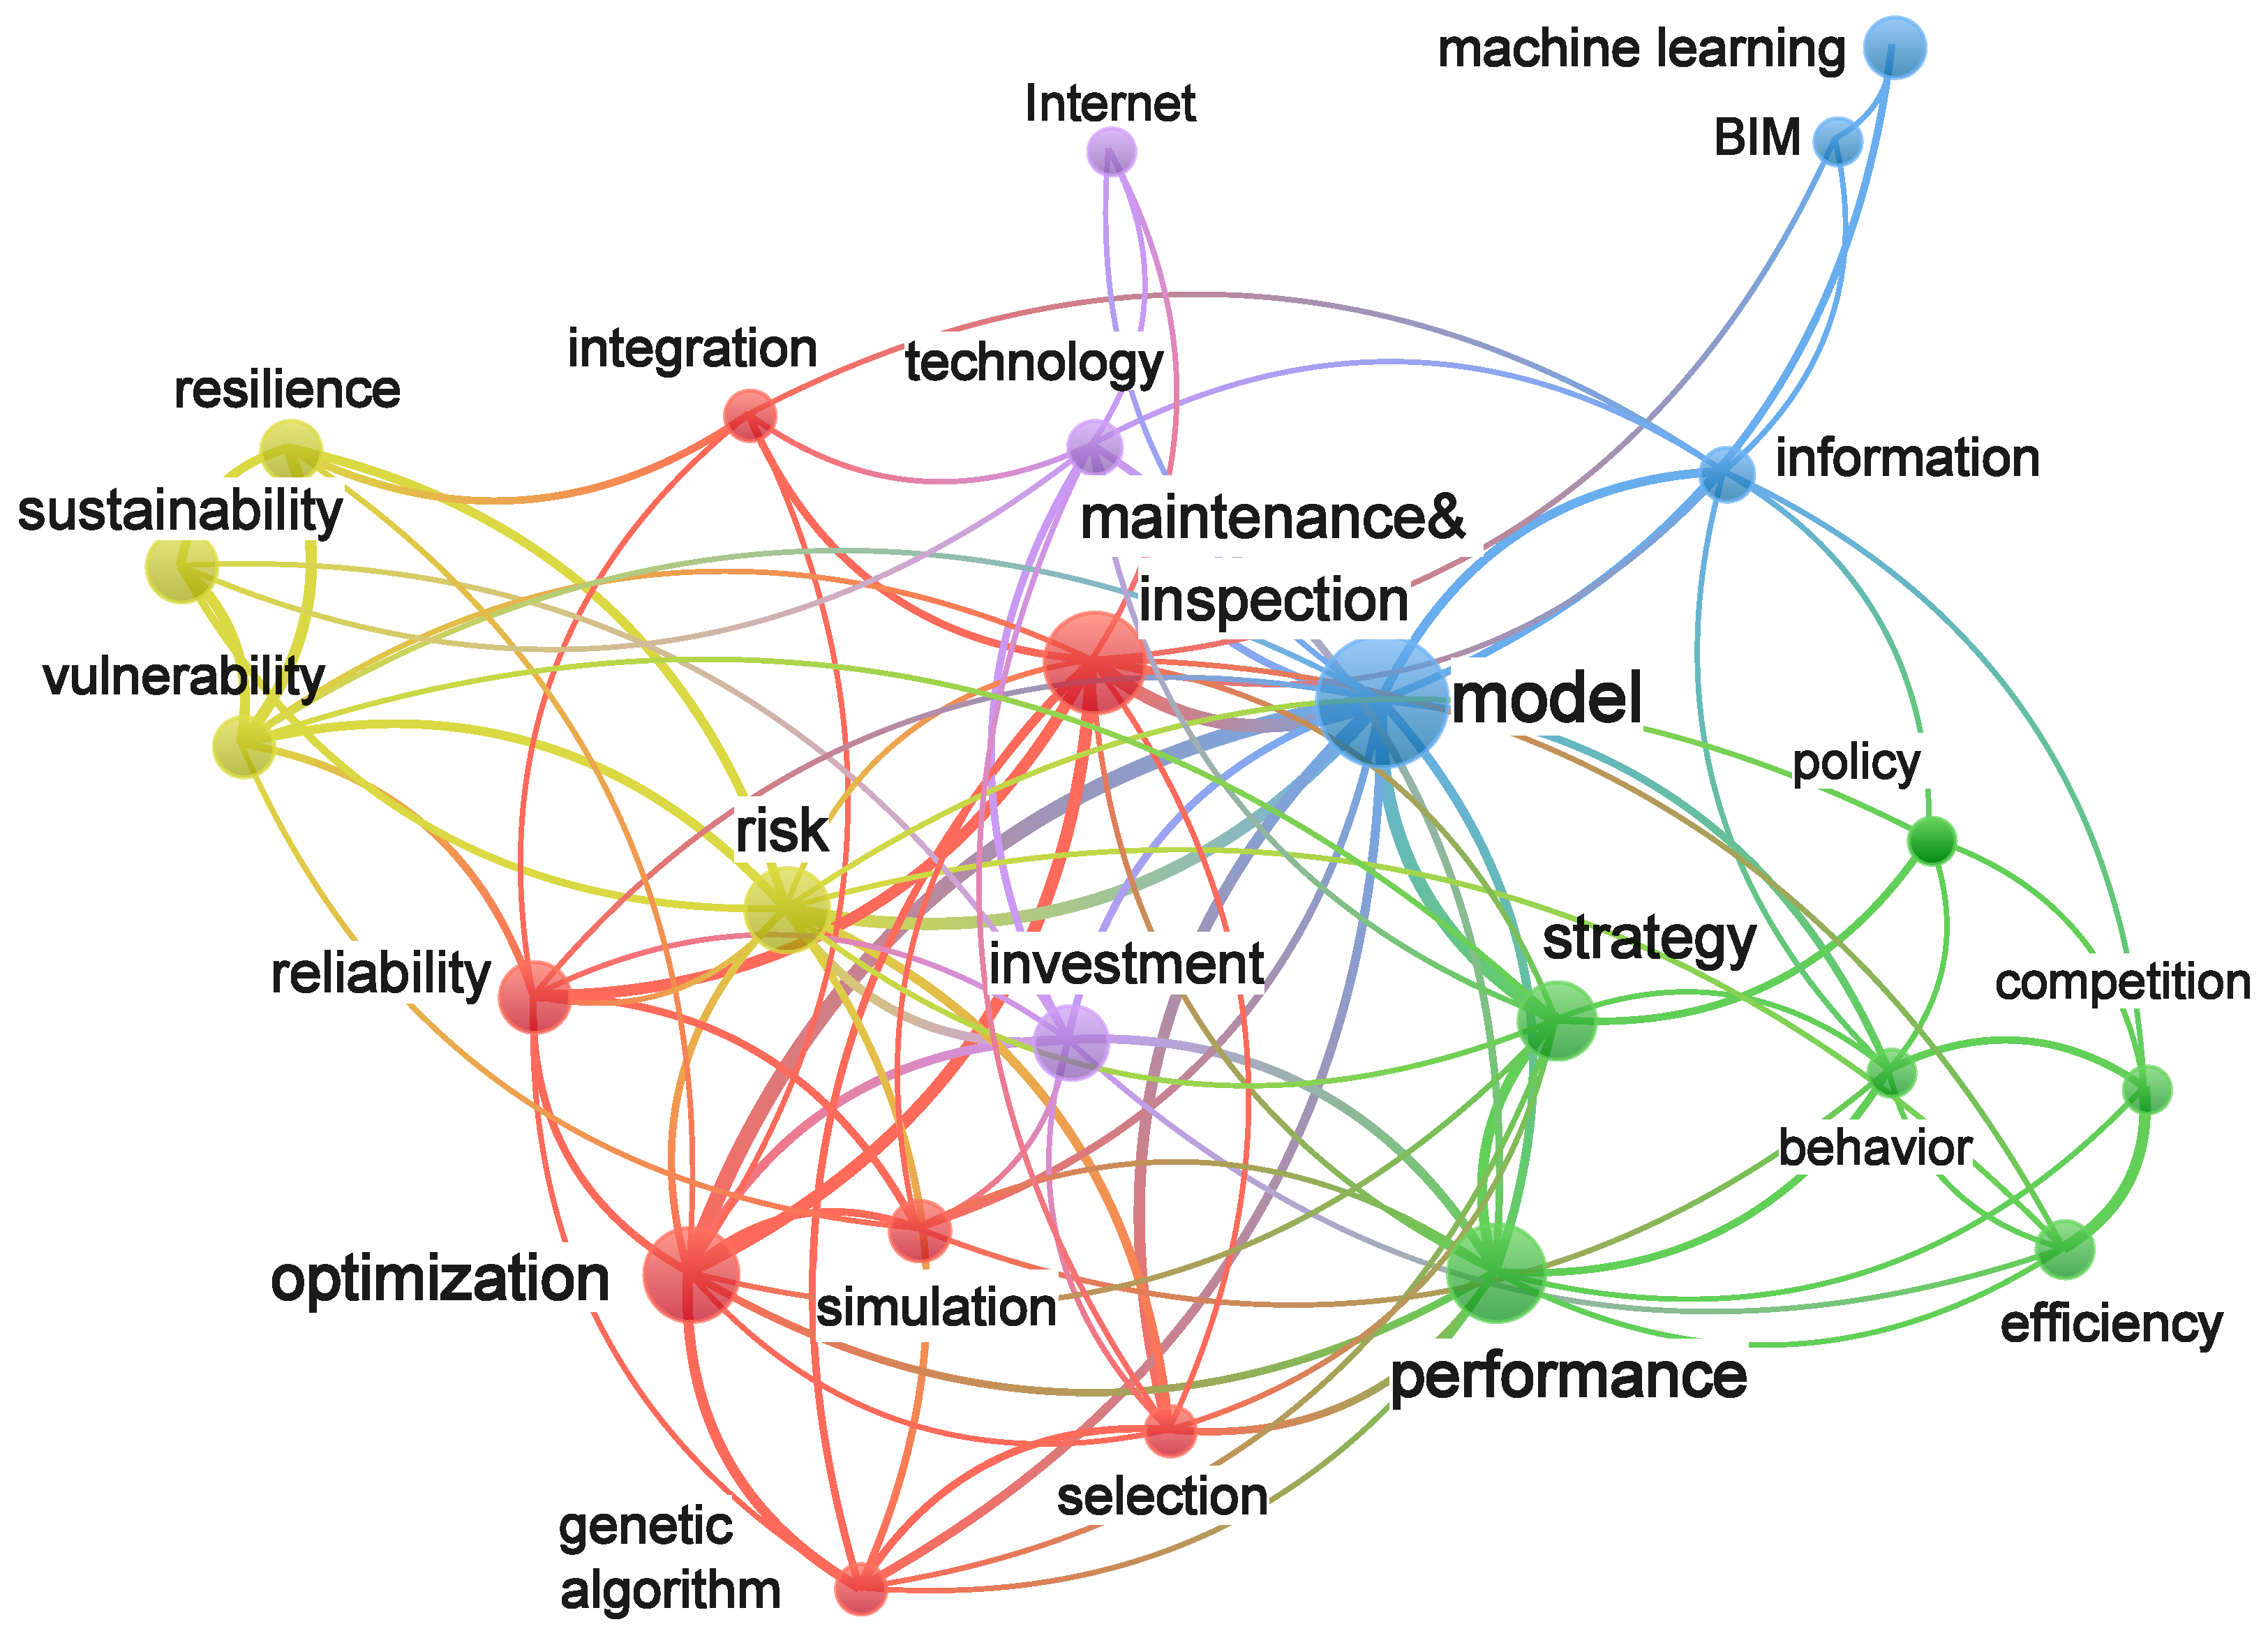
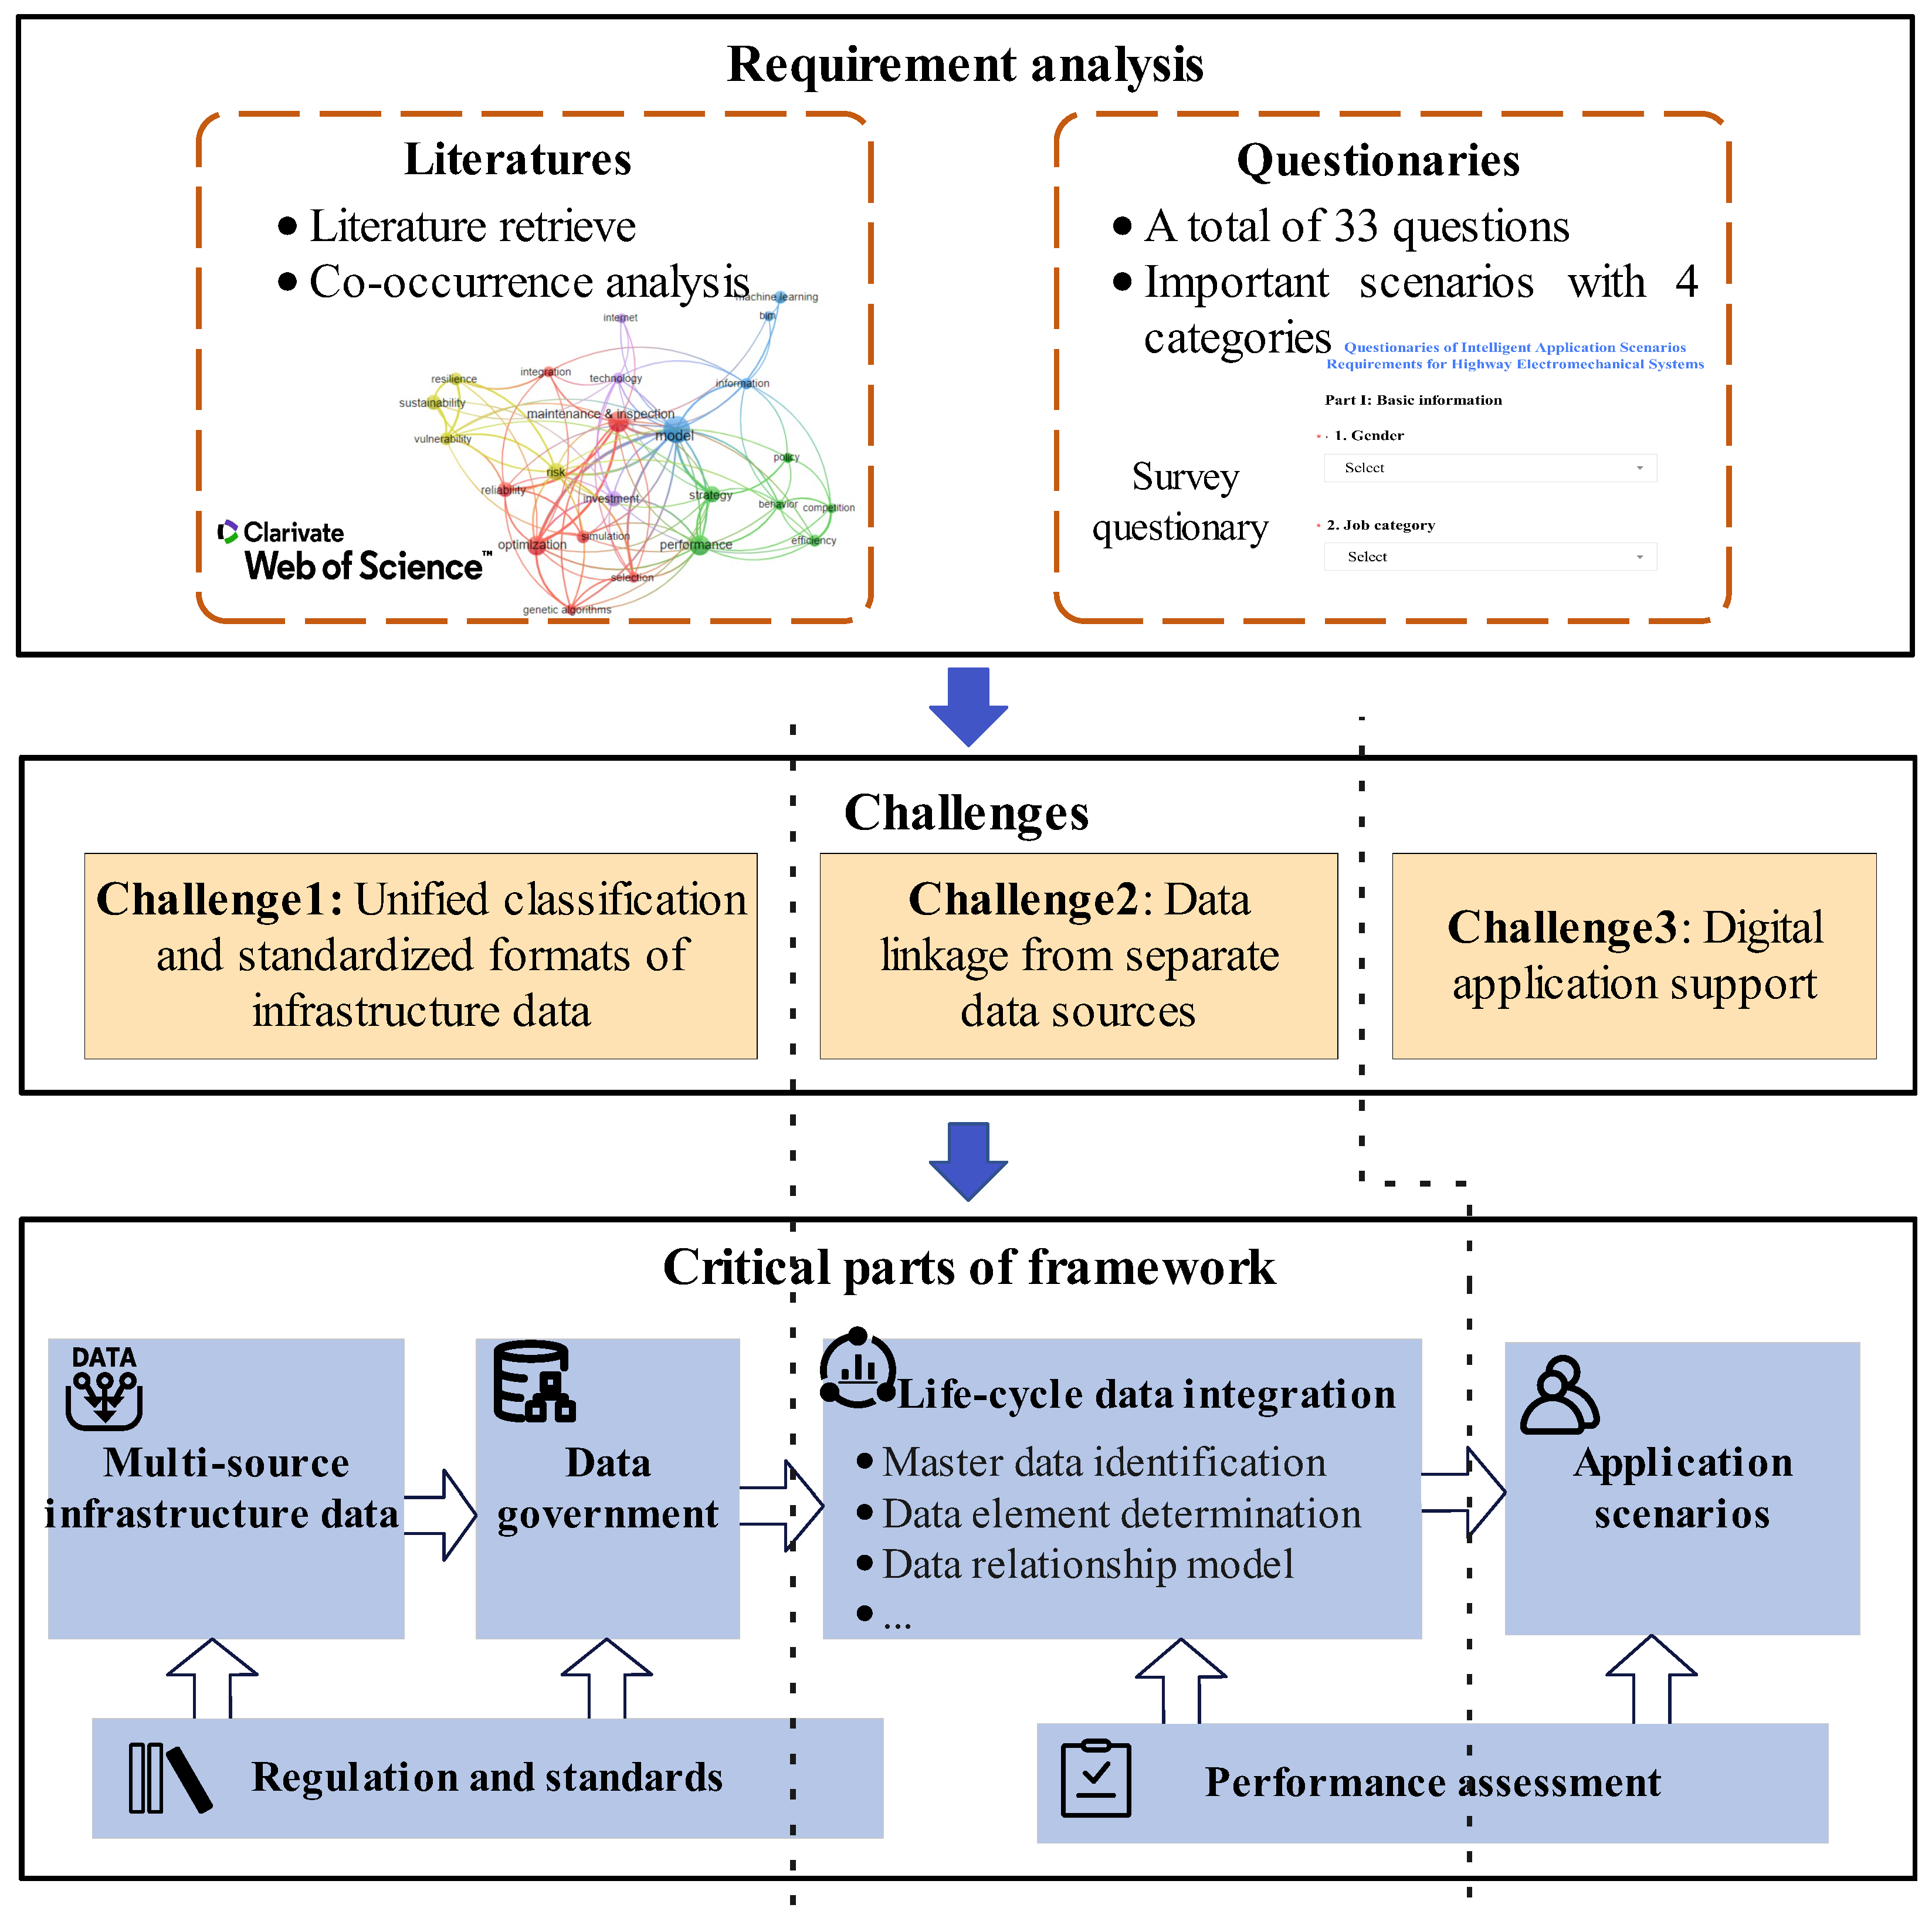
  • A conceptual framework of infrastructure digitalization is proposed with four layers and two support systems to facilitate the life-cycle highway asset management, and a 6-step procedure is presented to guide the framework development. The digital requirements are analyzed through a literature review and survey questionnaires, such as islands of information coherence.
  • A modified data–process matrix with service duration is first developed to characterize the data interoperation across life-cycle scenarios, then identifies master data with evaluation factors.
  • The correlation matrix is adapted to depict the relationship between infrastructure data and different scenarios, and then it determines data elements with the selected assessment factors. A data relationship model is also proposed to describe static and dynamic data correlation from multiple sources.
For comparison, some related studies with the objective, framework, and data acquisition are presented in Table 1.
The rest of this paper is structured as follows. The digital transformation and the research methodology are introduced in Section 2. Section 3 describes the life-cycle infrastructure digitalization framework with four layers and two support systems. In Section 4, a life-cycle data integration approach is proposed to determine master data and elements. The experiments with practical data are implemented in Section 5, and conclusions are presented in Section 6.

2. Method

We analyzed the digital requirements of asset management via a literature review and survey questionnaires. Then, we designed the research methodology to describe the development process of the digitalization framework.

2.1. Literature Requirement

The thematic analysis was utilized in the literature review to summarize the challenges of road asset management. The studies were retrieved from the Web of Science (WoS) core collection for the initial full records, with the keyword “road asset management challenge” or “road asset management requirement” within the period from 2000 to 2024. The automation filtering was set as the document type (article, proceeding paper, and review article), research area (engineering, business economics, computer science, transportation, and construction building technology), and language (limited to English). The search results were then dropped to 459 papers.
All keywords from the authors and also the WoS were applied for co-occurrence analysis in Vosviewer (v1.6.20). The minimal number of occurrences was set as 7 for keyword screening, and a total of 20 requirements were selected. The requirements were divided into five clusters: inspection and optimization, performance and strategy, model and information, risk and sustainability, and investment and technology. The network mapping is shown in Figure 1. Five clusters are represented by red, yellow, green, blue, and purple. The node denotes the requirement and its color and size are determined by the belonging cluster and the occurrence value. The link indicates the co-occurrence of two requirements and the occurrence number in the literature is reflected by its strength.
The occurrences and total link strength of each requirement and cluster are delineated in Table 2. Note that the occurrences and total link strength of each cluster are the average values derived from the associated requirements. The results indicate that the model (in Cluster 3) has the highest occurrence of 48 and total link strength of 57, making Cluster 3 (model and information) the highest occurrence at 18 and the second-ranked total link strength at 18.25. Then, maintenance and inspection and optimization (in Cluster 1) are ranked second place on the occurrences and total link strength. Cluster 1 (inspection and optimization) has the highest value of total link strength 19.3. In sum, Cluster 3 has received more attention in the literature and has a stronger relation with other requirements.

2.2. Practical Requirement

The survey questionnaire was designed for the importance analysis of digital application scenarios, mainly focusing on traffic engineering and facilities. The questionnaire contains 33 questions involving personal information, archives and assets, modeling and simulation, aided decision-making, and auxiliary maintenance. The personnel dealing with design, construction, and operation were invited to fill out the questionnaires, covering highway agencies in provinces of China (i.e., Jilin, Liaoning, Beijing, Jiangxi, Xinjiang, etc.). A total of 538 valid survey questionnaires were screened when the personnel’s response time was greater than 120 s. For more details, we refer the reader to [50].
The importance of digital application scenarios comprises 20 scenarios and importance degrees, as presented in Table 3. These scenarios are divided into four categories, archives and assets (Category 1), modeling and simulation (Category 2), aided decision-making (Category 3), and auxiliary maintenance (Category 4), in which the first two provide the data and modeling foundation for other applications. Note that the degree of each scenario has five scales from strong unimportance to strong importance (i.e., integers 1 to 5). For each category, the degree is the average importance value of all-belonged scenarios.
Table 3 also indicates that Category 1 has a higher value of 4.33 in importance degree, only ranking after Category 4. Intelligent spare part management (Scenario 2) and spatial association visual display (Scenario 5) are also the most important scenarios in Categories 1 and 2, respectively. Hence, life-cycle digital archives and spatial association visualization have drawn more attention in infrastructure digitalization to achieve the life-cycle digital asset management.

2.3. Research Methodology

We propose the processes to establish the framework of infrastructure digitalization, including requirement analysis, a summary of challenges, and a critical part extraction of the framework, as presented in Figure 2. Through an analysis of the literature and practical requirements (see Section 2.1 and Section 2.2), the main challenges are summarized to achieve interoperability of all of the life-cycle scenarios as follows: Challenge 1—provides unified classification and standardized formats of infrastructure data to overcome poor interoperability with multi-scenario applications; Challenge 2—expresses the linkage from separated data sources; and Challenge 3—supports the data analysis for different applications.
To deal with these challenges, critical parts of the framework are extracted as multi-source infrastructure data, data government, life-cycle data integration, application scenarios, regulation and standards, and performance assessment. As divided by the dashed line in the figure, the first two provide the unified classification and data format (for Challenge 1); life-cycle integration provides the master data identification, data element determination, and data relationship model to formulate the data linkage of disparate sources (for Challenge 2); regulation and standards also support Challenges 1 and 2; and application scenarios and performance assessment provide the support for the digital application (for Challenge 3).
The process of the infrastructure digitalization framework is explicitly given below:
Step 1:
Application scenario. Select the application scenarios that are determined for digitalization support, with consideration of business scope, social benefit, etc.
Step 2:
User requirement collection. Collect the requirements for the selected scenarios in Step 1, via literature retrieval and survey questionnaires. Studies are retrieved when setting keywords, period, research area, language, etc. Survey questionnaires can also be used to analyze the requirements of users and operation departments.
Step 3:
Challenge summary. The key challenges are analyzed from the literature with occurrences and total link strength, and practical requirements are selected with importance degree. Then, common interests are summarized as the key challenges.
Step 4:
Critical parts of framework. Find critical parts and methods to solve challenges (in Step 3). Decide the acquisition of multi-source infrastructure data and data government rules. Determine relevant sub-scenarios in the life-cycle data integration for data interchange and data service, which have data interchange with application scenarios in Step 1. Provide the evaluation factors for performance assessment.
Step 5:
Master data and element determination. Across the selected application scenarios in Step 4, master data and the element are determined by the life-cycle data integration method. A data relationship model is also established with static and dynamic infrastructure data.
Step 6:
Establish framework. The infrastructure digitalization framework is established with critical parts, master data and elements, application scenarios, etc.

3. Infrastructure Digitalization Framework

In this section, an infrastructure digitalization framework is introduced for the life-cycle data management on application scenarios, constituting six critical parts (see Section 2.3). The whole framework is proposed with four layers and two support systems: road infrastructure and other data, data governance, life-cycle data integration, application scenarios, regulations and standards, and performance assessment (Figure 3).
The framework is adaptable for life-cycle data application: collect the multi-source data at the data layer, improve the data quality and storage at the data government layer, combine multi-source data with a unified view and support the life-cycle application scenarios of design and construction, maintenance, operation and highway administration. The process complies with regulations and standards and is evaluated at the performance assessment. Note that the infrastructure digitalization framework can guide the design and development process of the highway electromechanical digital twin platform and we refer the reader to [51].

3.1. Data Layer

The data layer aggregates all the information from data acquisitions, including highway infrastructure and other relevant data. The highway infrastructure mainly consists of roads and structures, and traffic engineering and facilities [42,52,53,54]: route, pavement, subgrade, bridge, traffic safety facilities, mechanical and electrical equipment, service facilities, environmental landscape facilities, etc. (Figure 4). New intelligent equipment of surveillance camera, thunder-vision all-in-one machine, infrastructure condition detector, roadside unit, payment self-service terminal, etc., are also categorized as mechanical and electrical equipment.
The basic static data and monitoring data of road infrastructure can be automatically collected from construction (maintenance) and the sensors from maintenance and operation with the front-end process, respectively. Other data are also collected for road asset management, such as traffic operation data, spatial data, and meteorological data.

3.2. Data Government Layer

The data governance layer improves the data quality perceived from the data layer and stores data for data analysis, which contains data preprocessing, quality assessment, standardization and storage, analysis and visualization, etc. The perceived infrastructure data can be inaccurate, incomplete and inconsistent. Data preprocessing is applied to fix poor-quality data, involving the filling of missing values, removal of redundant data, outlier detection, noisy data smoothing, etc. Then, the assessment is provided to evaluate the uniqueness, accuracy, consistency, completeness, format compliance, etc. (refer to [55,56]). Note that only the satisfied data can be standardized and stored for the application. According to data-related regulations and standards for scenario application (such as [52,57,58,59]), data are transformed into the standard form with predefined and constrained values through data standardization. Data analysis and visualization are also applied to discover characteristics or trends of infrastructure.
We give an example to depict the data storage of route, subgrade, and surveillance camera on design and construction, maintenance, operation, and highway administration, as presented in Figure 5. On route data, all scenarios require information of the route name, starting and ending position in mileage, etc. Maintenance, operation, and highway administration, respectively, require the information of handover data, completion data, whether there are toll fees or not, building control zone width, etc. Similarly, subgrade data and surveillance camera data are stored with various contents related to these scenarios.

3.3. Life-Cycle Data Integration Layer

The data from different scenarios (see Figure 5) are maintained to solve the duplication, inconsistencies, and fragmentation and to create the inter-relationships at the life-cycle data integration step, which then provides the application of scenarios as a whole. Hence, the governed infrastructure data are interchanged across the construction, operation, maintenance and highway administration via master data. Data service is provided for the application scenarios, such as attribute, relationship model, spatial typology, etc. A series of processes are applied to avoid discrepancy and strengthen the coherence of infrastructure data from different scenarios, consisting of data requirements, master data identification, data element determination, data assessment, data relationship model, etc.
Figure 6 illustrates infrastructure data integration across four categories: design and construction, maintenance, operation, and highway administration. Except for the master data, each scenario contains its transactional data. For instance, in the operation scenario, traffic volume, traffic incident, emergency event, surveillance video data, etc., are required to handle traffic monitoring and emergency aid. The detailed process of the data integration step is presented in Section 4.

3.4. Application Scenario

The main application phases of highway infrastructure [60,61,62] can be divided into design, construction, maintenance, operation, highway administration, etc. We classify the application scenarios into four categories, i.e., design and construction, maintenance, operation, and highway administration. Each category contains four or five scenarios, which are composed of various sub-scenarios. The unified infrastructure data support the application of these scenarios, provided by the life-cycle data integration layer.
An example of scenarios and sub-scenarios is depicted in Table 4. For instance, the maintenance category consists of four major scenarios: condition inspection, maintenance decision, maintenance design, and maintenance execution. The sub-scenarios of condition inspection include daily, routine, periodic, special, and emergency inspections of structures, traffic safety devices, etc.

3.5. Support System

The two support systems mainly comprise regulations and standards and performance assessment: regulations and standards specify data classification, quality, access rules, security management, etc.; performance assessment evaluates the performance of digital transformation, data quality and interoperability, application effects, etc. The data dictionary of infrastructure is established for the data interoperation requirements, which includes basic information, catalogue of facilities, data attributes and meaning, data structure definition, etc. The dictionary for traffic engineering and facilities is given as an example in [63]. The assessment of infrastructure digitalization is also proposed with a series of factors, such as value, utilization, compliance, consistency, stabilization, etc. (see [64]).

4. Life-Cycle Data Integration Approach

The integration approach is proposed for infrastructure data interoperability across the life-cycle scenarios, with data provided from design and construction, maintenance, operation, and highway administration. According to the integration process in Section 3.3, the detailed integration approach comprises data requirements of life-cycle scenarios, master data identification, data element determination, and the data relationship model.

4.1. Data Requirements

According to the application scenarios (see Section 3.4), the dataflow diagram is applied to describe the interchange data between sub-scenarios and then collect the required and provided data for each scenario. The requirement analysis is divided into the single scenario and life-cycle scenarios.

4.1.1. Analysis of Single Scenario

For each scenario, the sub-scenarios are selected as key domains for data-sharing requirements, and the dataflow diagram is used for the relationship analysis between sub-scenarios and then summarizes the required and provided data. An example of condition inspection is given to analyze the data requirements:
Key sub-scenarios. Condition inspection provides the evaluation quality of infrastructure conditions to support the decision-making plan of maintenance through artificial or automated structural monitoring (see Table 4). The inspection frequency is associated with the structural type, technical condition grad, climate information, etc. The key sub-scenarios consist of automated monitoring, daily inspection, routine inspection, periodic inspection, special inspection, and emergency inspection.
Relationship analysis of sub-scenarios. The dataflow diagram describes the primary data travels of sub-scenarios based on the core business process. The dataflow diagram of condition inspection is summarized in Figure 7; refer to [65,66]. In the figure, sub-scenarios and key processes are denoted as red and gray rectangles with rounded corners, and the datastore of inspection records is represented as right-angle rectangles. For instance, special inspection involves basic information, daily and routine inspection records, automated monitoring, infrastructure damage condition, etc., to generate the special inspection report and provide for the performance assessment.
Additionally, Table 5 provides the dataflow, start point, end point, and data description to illustrate the dataflow between sub-scenarios, processes, and datastore. Data description depicts the content from the start to the end point in detail. Basic information, involving static infrastructure data, historical records of inspection and maintenance engineering, etc., is provided for daily and routine inspection, periodic inspection, special inspection, monitoring scheme, etc.
Data requirement. In the scenario, the required data are set as the initial datastore of the dataflow diagram, i.e., the start point without input. The provided data are also set as the terminal datastore and partial intermediate data. Note that the terminal is the end point without output. As illustrated in Figure 7, the required and provided condition inspection data can be summarized below.
Sustainability 17 00907 i001

4.1.2. Analysis of Life-Cycle Scenarios

Required and provided data. The data interchange process of life-cycle scenarios is aggregated from the required and provided data of all-belonged scenarios (i.e., single scenario; see Section 4.1.1). Table 6 gives the main data requirements of the four categories across the whole life-cycle application, which is composed of categories, provided data, and required data. Note that the design and construction category only generates the design and delivery data of road infrastructure to others without the required data.
Match of required and provided data. The match between the required set R i of scenario i and the provided set P i * of scenario i * is formulated on the life-cycle data interchange process. When required data r i , j R i are matched with the provided data p i * , j * P i * , we have
i = i * , R i P i * j = j * , r i , j = p i * , j * i , i * S
where scenario set S can add third parties to ensure all required data matches.
An example of the dataflow between design and construction, maintenance, operation, highway administration, and third parties is presented in Figure 8. The third parties consist of the meteorological administration, the transport management department, and mapmaker. Meteorological information, satellite positioning of vehicle, traffic condition, etc., are provided to highway administration and operation scenarios. The circular dataflow describes the data provided and required from the same scenario, such as maintenance plan and execution data, condition grade, and structural monitoring data in maintenance.

4.2. Data Identification

With the required and provided data, the modified data–process matrix is proposed to select the master data on the life-cycle processes. Then, the correlation matrix is established to determine the master data element for interchange. Some factors are also considered to evaluate the infrastructure data-sharing process (see [64]), comprising value, utilization, compliance, consistency, stabilization, validity, etc.

4.2.1. Master Data Identification

The data–process matrix (also named use–create matrix) is the necessary step in business system planning [67,68], and is widely applied to link business functions and data class on the information requirement [69,70], enterprise architecture [71], strategy assessment [72], etc. This paper proposes the modified data–process matrix with service duration to characterize data sharing and usage time across life-cycle scenarios. The scenarios in columns contain design and construction, maintenance, operation and highway administration, and the rows are data classes with categories of the road infrastructure data and related data. The dataflow from single-creator to multi-user involves the short, medium, and long users and the data creator to reflect the service duration.
An example of the life-cycle scenarios and data is illustrated in Figure 9. Each type of road infrastructure (see Section 3.1) is composed of topographical analysis, line scheme, design information, project management, construction and delivery information, etc. The related data (i.e., the key factors of influence on the infrastructure maintenance and operation) include traffic condition, emergency measure, abnormal driving detection, weight detection of special transportation, etc. The blue dotted rectangle represents the main life-cycle information systems. The number of systems is determined by the actual application and we set the number to 4 for clarity and brevity. Notations “C”, “SU”, “MU”, and “LU”, respectively, denote the scenario as the creator, shorter, medium, and longer user to provide and use data, which are denoted by green, orange, light brown, and brown circles in the figure. These three users can be defined as the frequency of data usage and whether or not they use data from other systems. For instance, the shorter user uses the data from the belonged category provided by the others, and the longer user uses the data more than 5 times/day from other systems, or is otherwise set as the medium user.
To identify the master data, some principles for utilization and validity are shown below:
  • Source uniqueness. Only one creator is allowed for each datum in the same column.
  • High utilization. Data can be frequently utilized in the same system and other systems, which can be reflected by the user type (the shorter, medium, and longer) and number of users (i.e., inside and outside the blue rectangle in Figure 9).
  • Data storage. The number of medium and longer users (notations “MU” and “LU”) reflects the long storage duration.
  • Data value. Data are necessary for the business function (cannot be missing) and affect management efficiency, operation benefit, driving experience, carbon emission, etc.
For instance, set the following requirements to satisfy high data utilization (in the same line): longer user, medium user from more than two systems, or more than two shorter users inside the system. Then, we have the master data set including line scheme, construction and delivery information, maintenance execution and delivery data, structural monitoring data, traffic interruption information, emergency measure, maintenance plan, patrol information, and overload case.

4.2.2. Data Element Determination

The process data are time-variant across the life-cycle scenarios, and the elements are correlated with the others. So the correlation matrix is proposed to establish the correlation between process data class and the type of infrastructure, and then to determine the master data elements with compliance, consistency, stabilization, etc.
For life-cycle data interchange, data requirements of other processes and infrastructure determine the master data element. The correlation between process data u and u * is divided into strong, medium, and weak with scores from 1 to 3, denoted by the coefficient c u , u * . Similarly, the correlation between infrastructure data k and process data u is classified as weak and strong with relevant scores of 1 and 2, and then the coefficient a u , k is estimated.
Let D u = { D u , 1 , , D u , k , } be the original data element set of process u, where data element D u , k can be empty. For process data u U , the data element set D ¯ u * u of other process data u * is formed by modifying the data element D ¯ u , k when the correlation coefficient c u , u * is not less than the threshold value C [ 1 , 3 ] . D ¯ u , k of infrastructure k is equal to D u , k when the correlation coefficient a u , k is greater or equal to threshold value A [ 1 , 2 ] . So, we have
D ¯ u * u = { D ¯ u * , 1 , , D ¯ u * , k , } , if c u , u * C , otherwise D ¯ u , k = D u , k , if a u , k A , otherwise u , u * U , k K
Here, U and K are the index sets of process data and infrastructure, respectively. Correlation coefficients c u , u * and a u , k can be calculated as the mean value with a series of matrices, obtained from the survey questionnaire.
With the original data element D u and modified process data D ¯ u * u , the data element set M u of process data u is determined by compliance, consistency, and stabilization, and the function f ( * ) is given as
M u = arg max f ( D u , D ¯ u * u , , D ¯ u * u )
Note that the principle is determined by the actual decision requirements to formulate the f ( * ) . For instance, the element with the same metadata attribute, value, and source is selected to achieve consistency.
An example is illustrated in Figure 10 to better comprehend the correlation matrix, which contains process data in columns and infrastructure data in rows. The relative correlation of multiple processes on the left is described as three types of blue cycles, i.e., strong, medium, and weak. The center is the relationship between process data and infrastructure, and the strong and weak are denoted by two types of orange diamonds. For the maintenance plan, correlations with other process data are listed below:
  • Strong: Structural monitoring data, technical condition grade, maintenance execution, and delivery data.
  • Medium: Construction and delivery information, traffic interruption information, and traffic condition.
  • Weak: Line scheme and administration permit.

4.3. Data Relationship Model

Using the master data element, a data relationship model is established to describe the infrastructure data correlation from different scenarios to support and display the infrastructure data in application scenarios. The model comprises a static layer of route and structures, a static layer of traffic engineering and facilities, and a dynamic layer, as presented in Figure 11.
The first two static infrastructure layers are formed by infrastructure data and spatial connectivity with physical interconnection, power supply network, communication network, etc. The data can be obtained from the process data of the topographical analysis, line scheme, design information, and construction and delivery information. On the dynamic layer, infrastructure maintenance information, real-time states, and traffic operation are mainly displayed from the process data of maintenance execution and delivery data, traffic interruption information, traffic condition, emergency measure, etc.

5. Results and Discussion

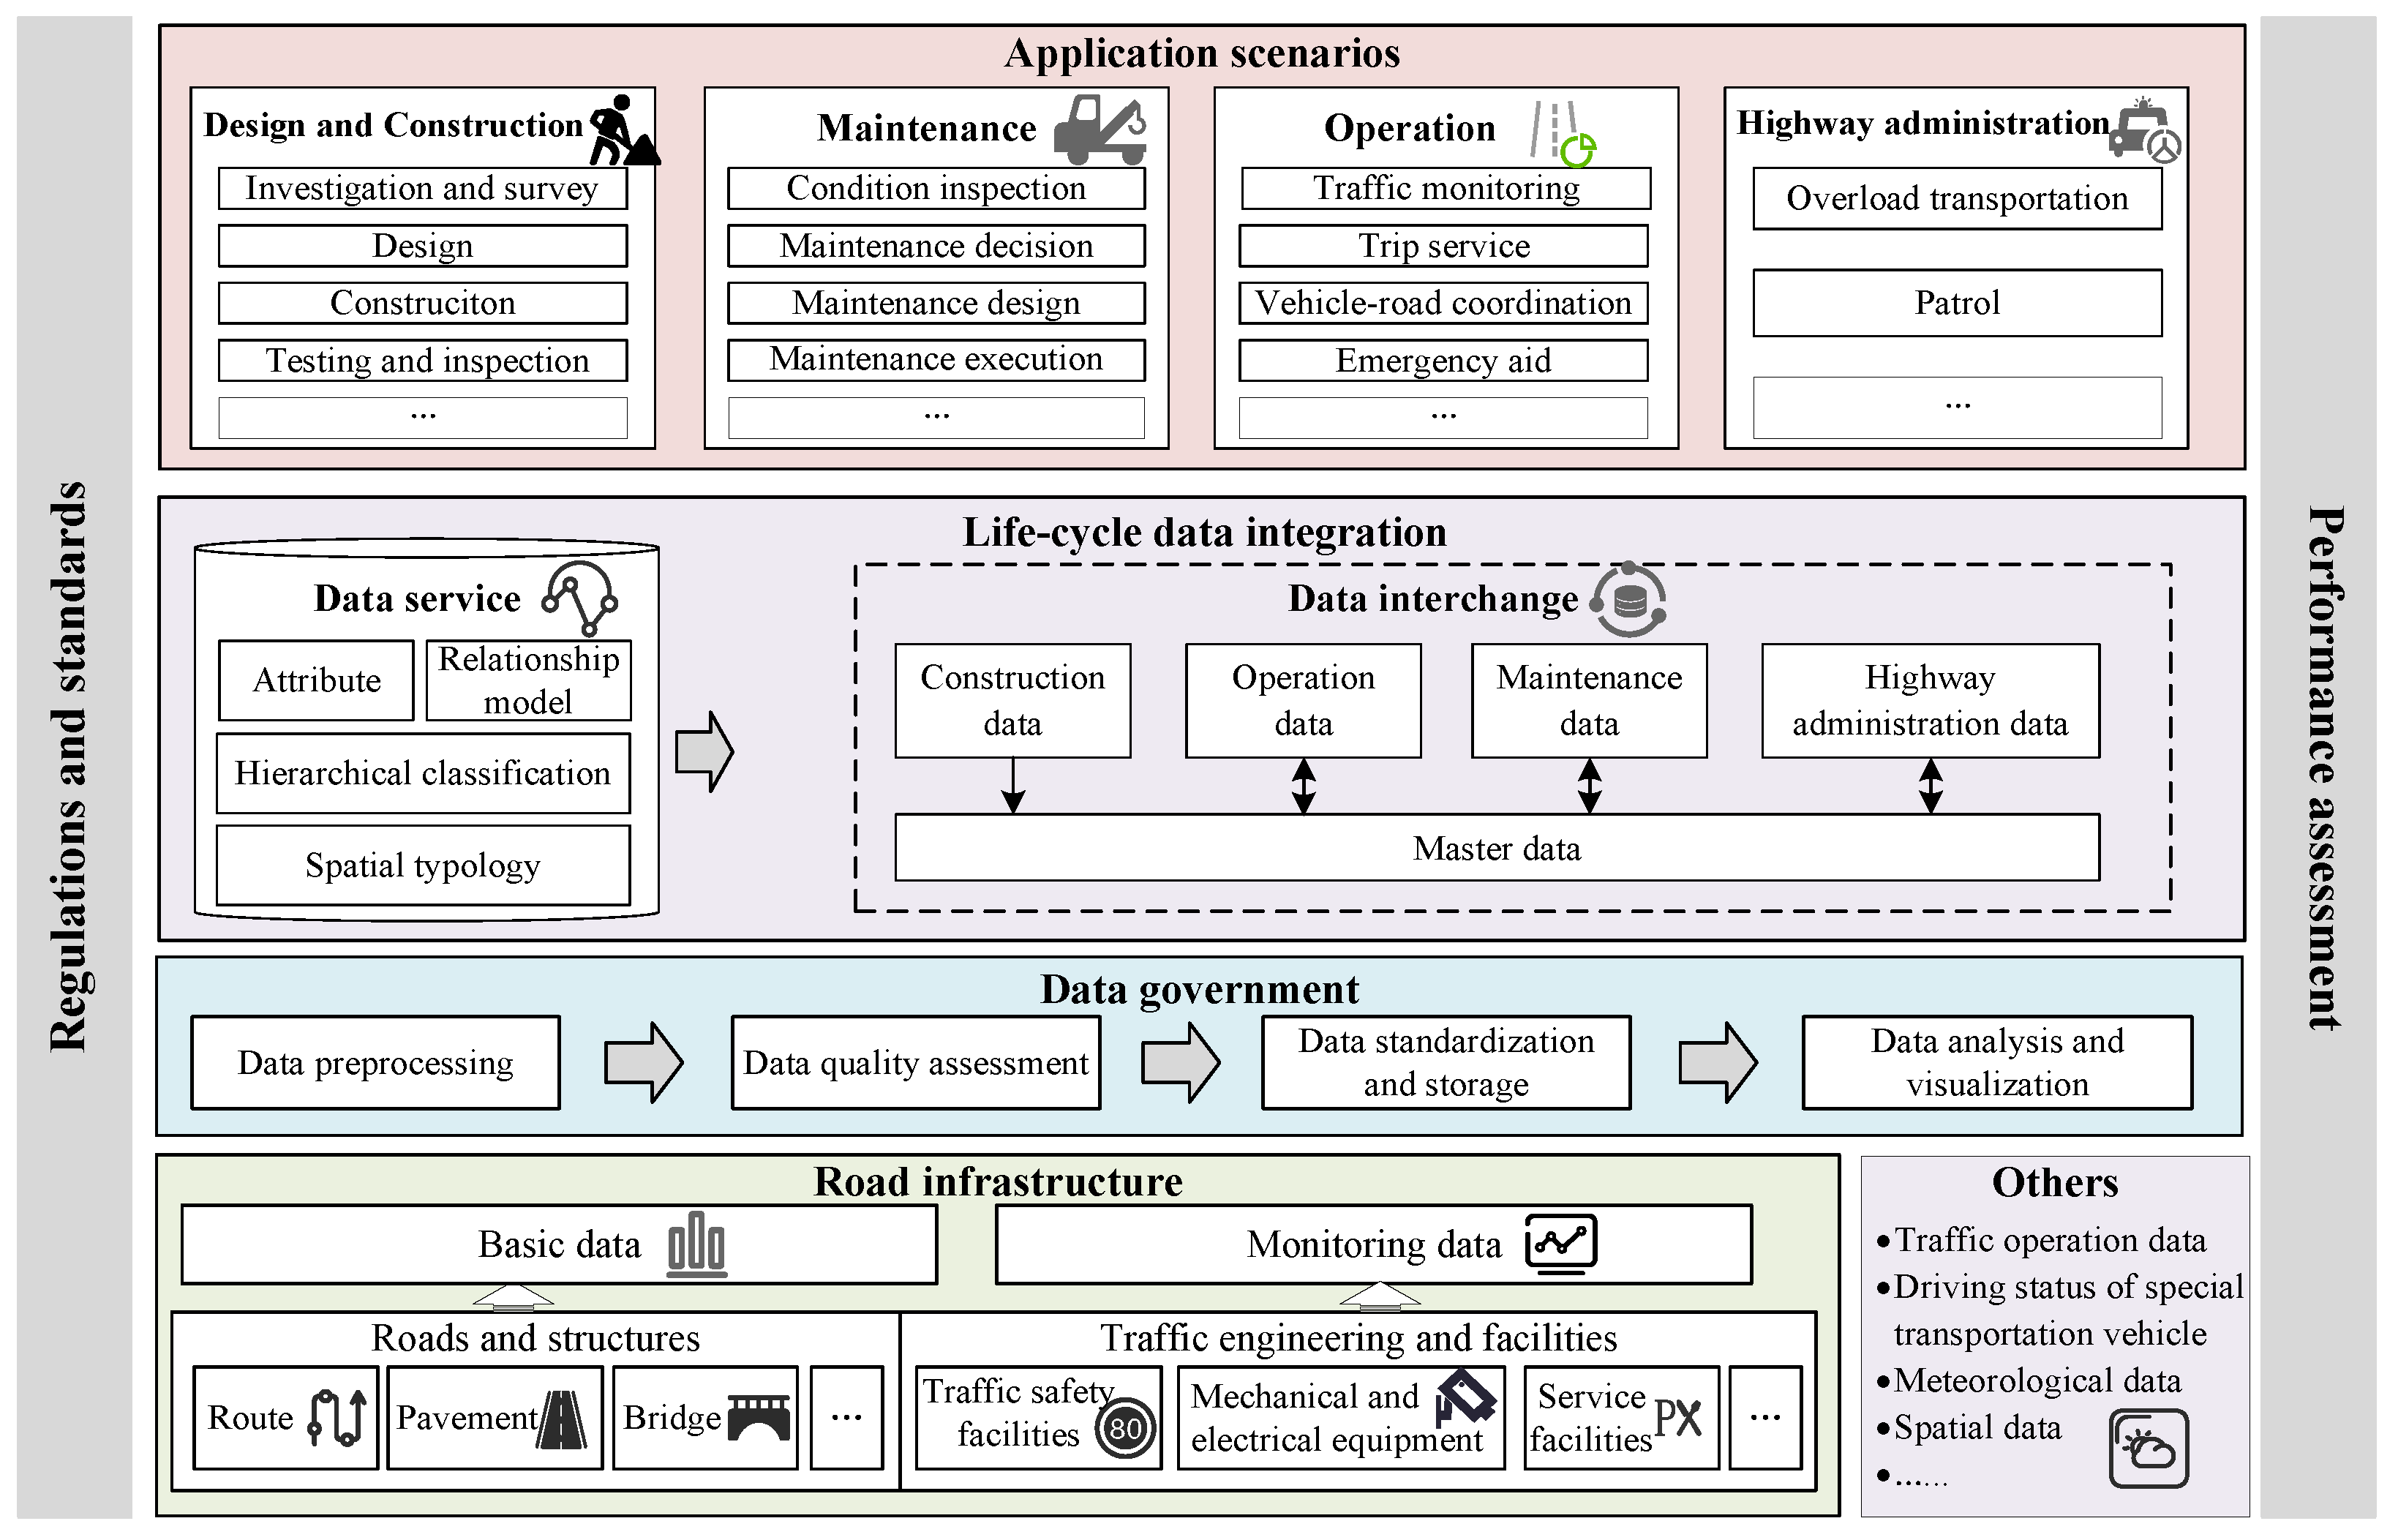
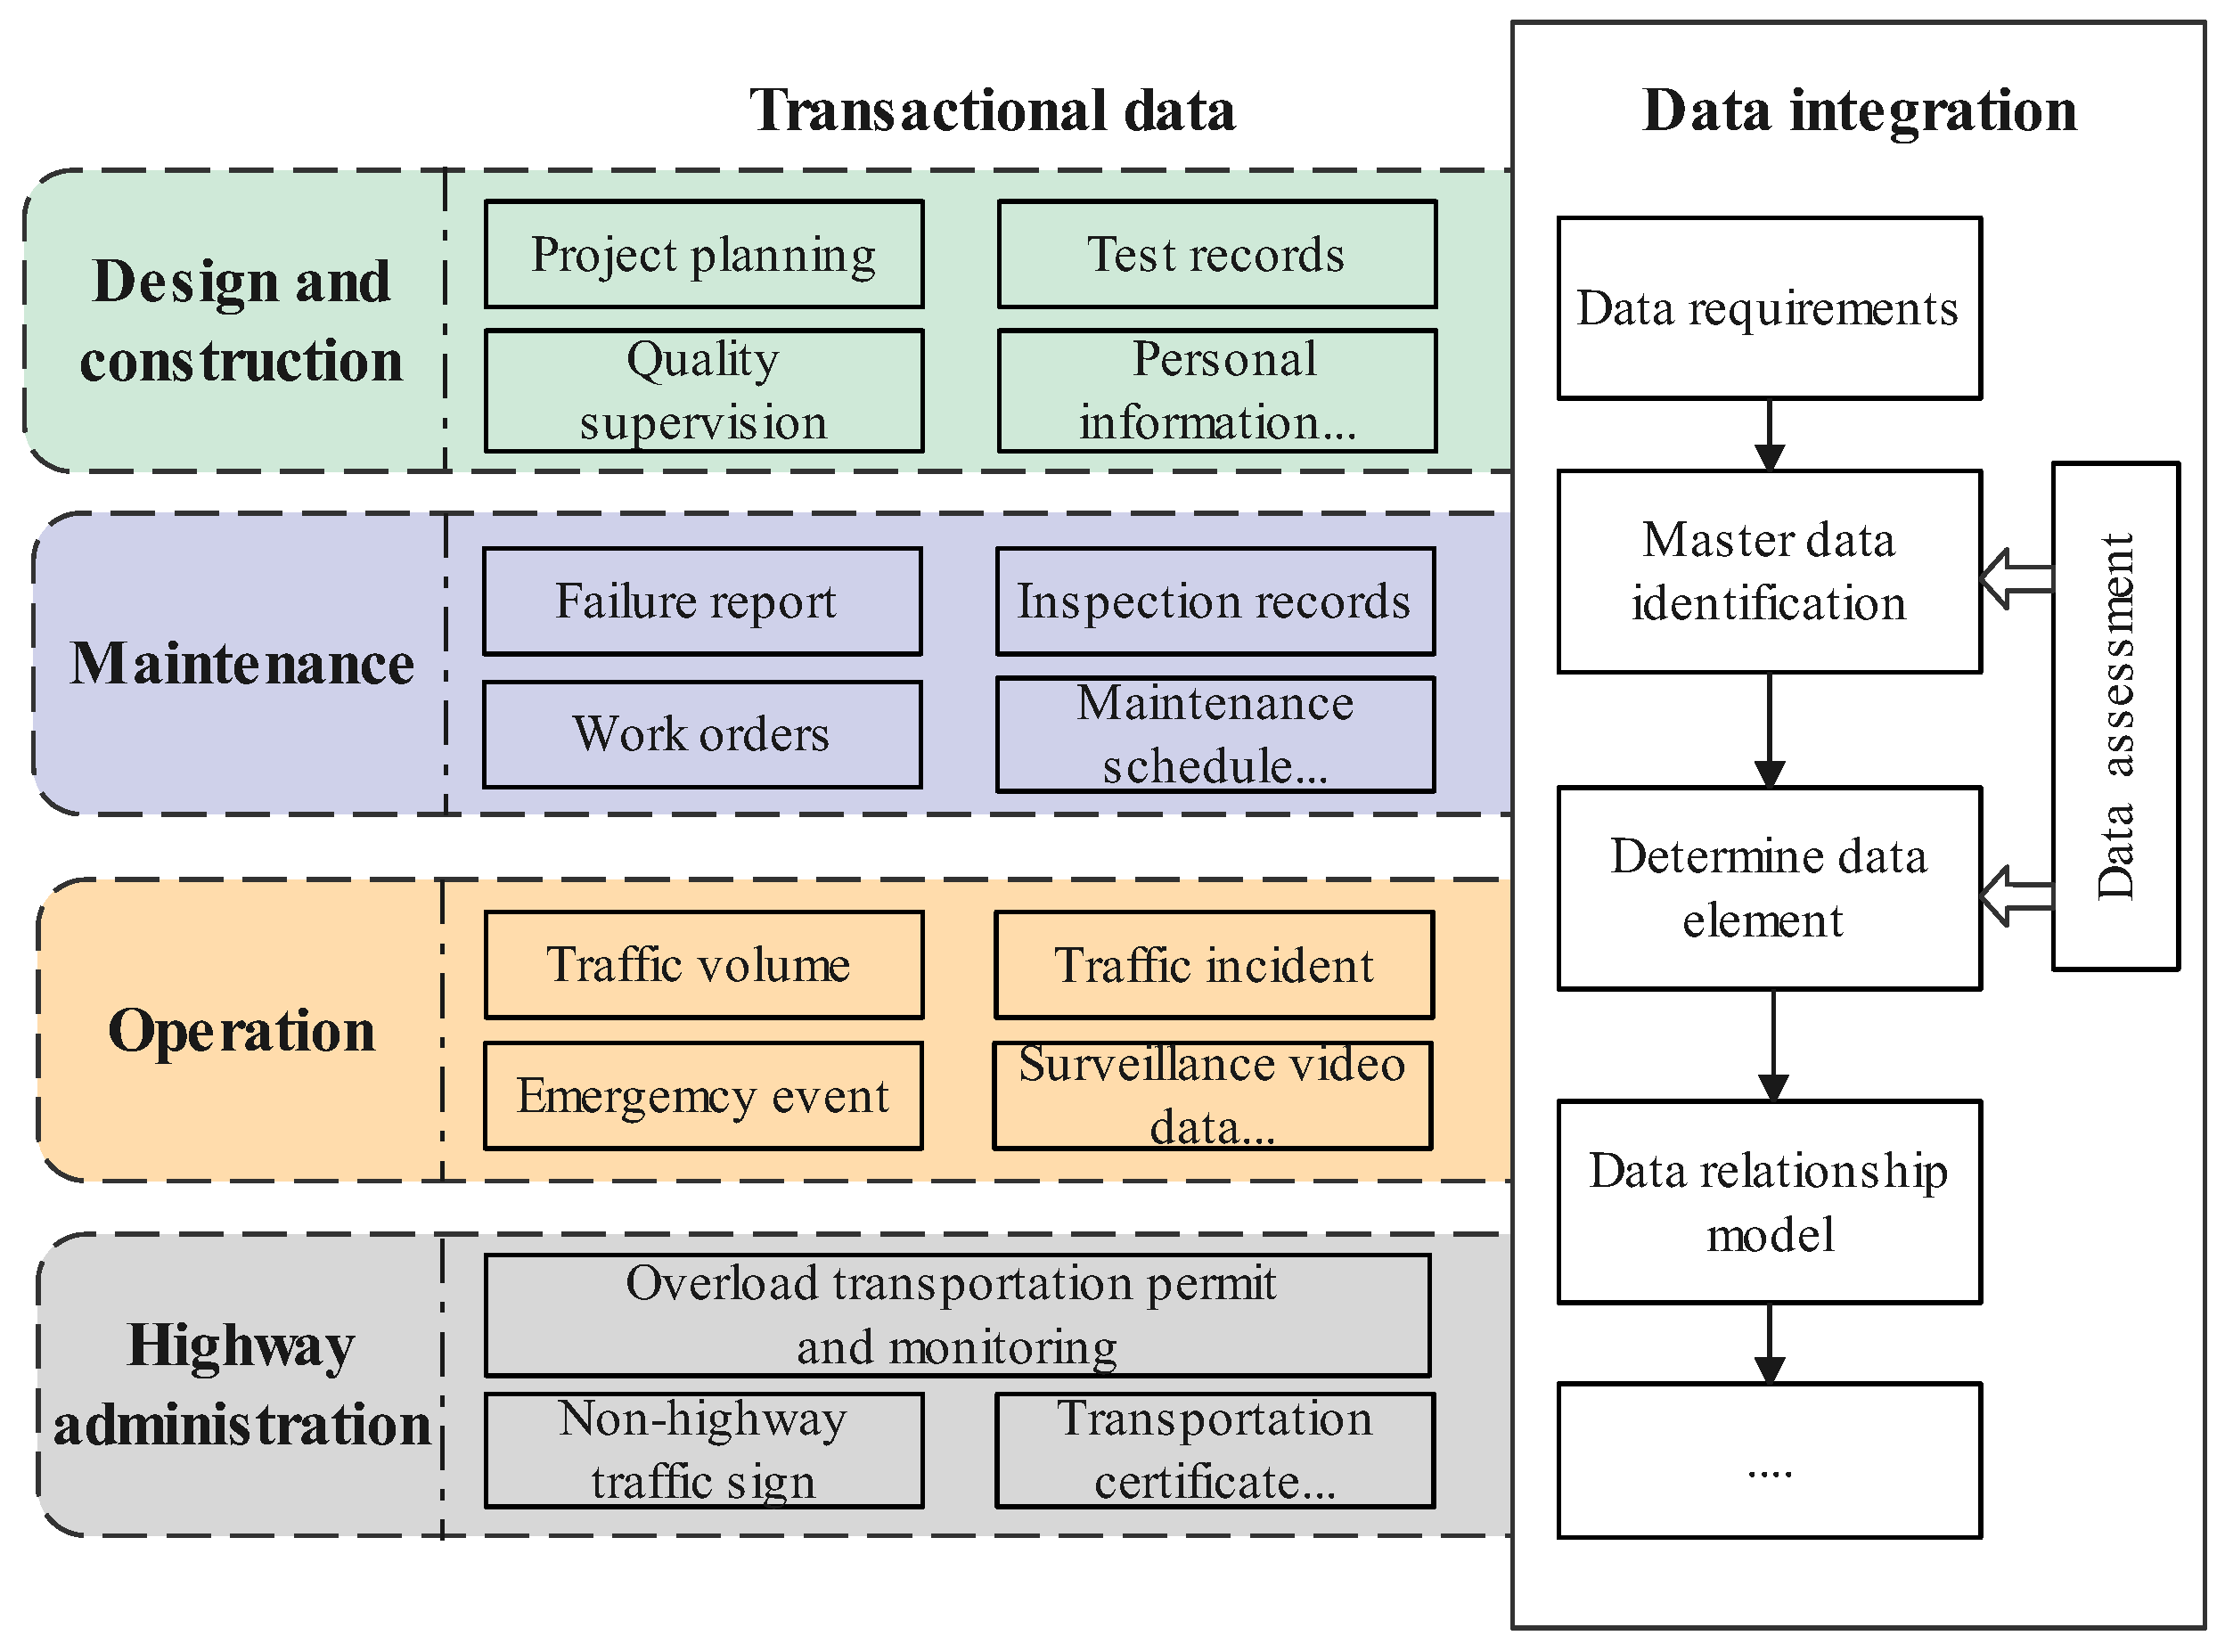
In this section, numerical experiments of the master data calculation process are presented to explicit the data interoperation between highway administration and maintenance, operation, etc. The effectiveness of the life-cycle data integration approach is verified through two methods: master data identification and data element determination. Master data are the core part of data interchange between different scenarios on the life-cycle data integration layer of the infrastructure digitalization framework (see Figure 3).
Two practical highway administration and maintenance systems are adopted for these instances. Accordingly, the required and provided data are summarized via maintenance and highway administration systems; see Appendix A. Then, master data and data elements are determined as follows.

5.1. Master Data Identification Results

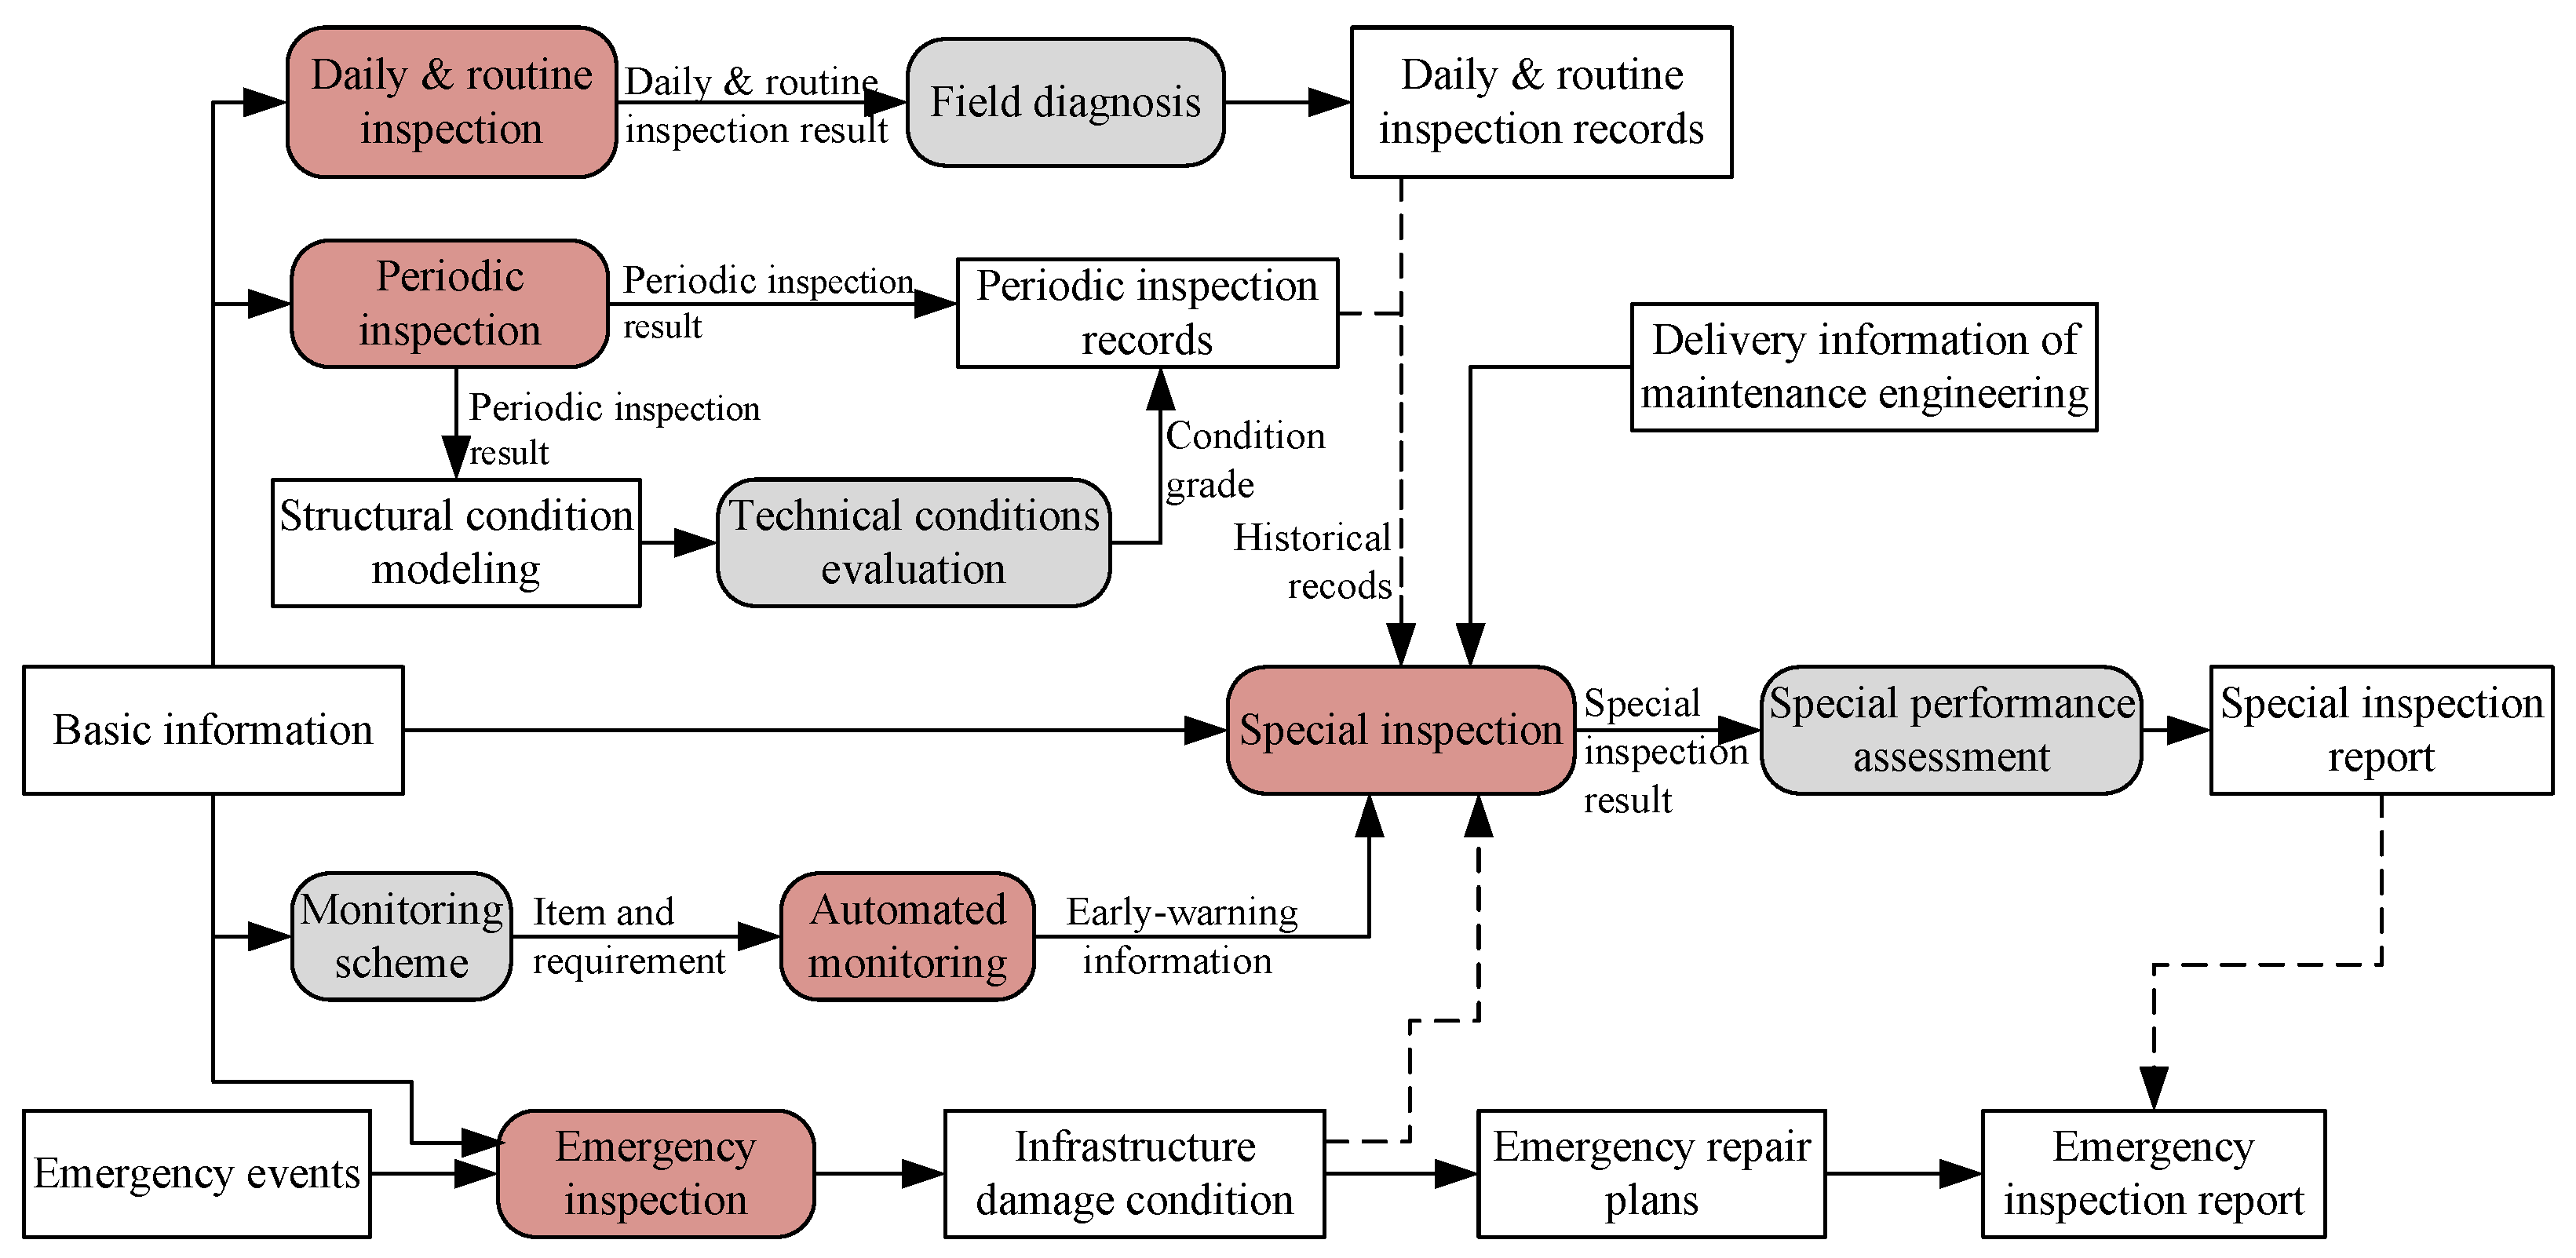
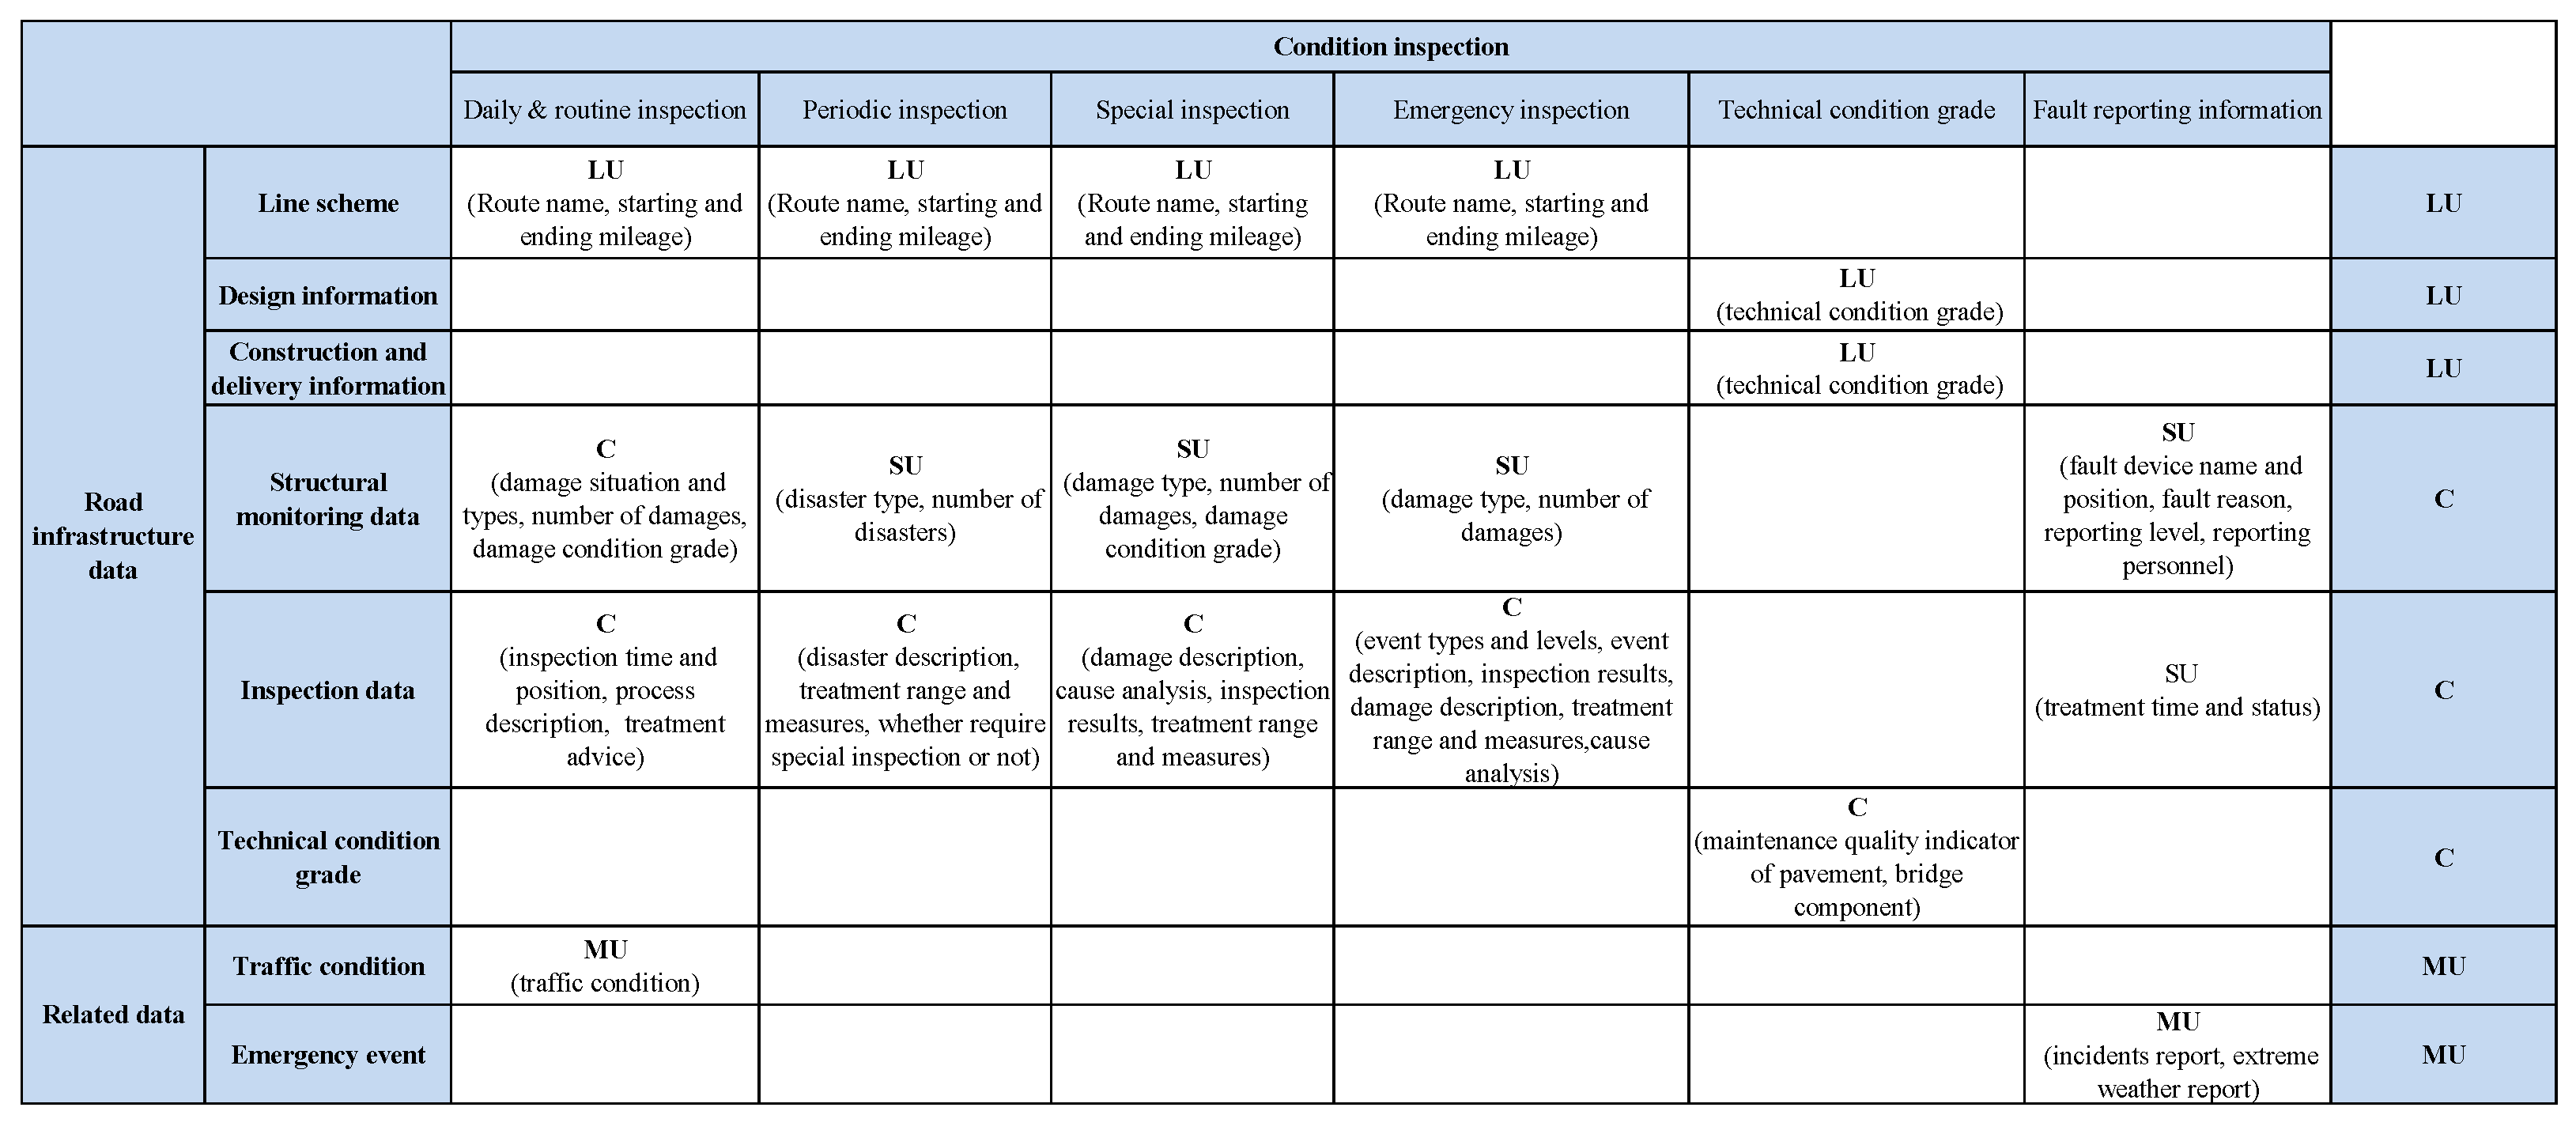
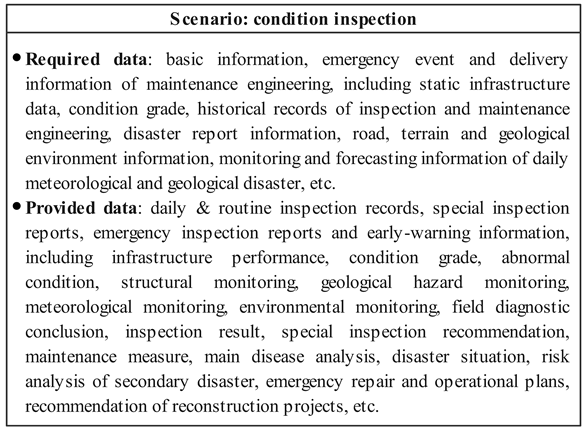
In accordance with the provided and required data, condition inspection with six sub-scenarios to create/use process data are visualized in Figure 12. The creator, shorter user, medium user, and longer user are denoted by the notations “C”, “SU”, “MU”, and “LU”. Road infrastructure and related data consist of line scheme, design information, construction and delivery information, structural monitoring data, inspection data, technical condition grade, traffic condition, and emergency event. In the column, six sub-scenarios contain daily and routine inspection, periodic inspection, special inspection, emergency inspection, technical condition grade, and fault reporting information. Combined with the sub-scenario status, the creator/user status of condition inspection is presented in the last column. There are some rules for the combination: when the sub-scenario has creator “C”, set the status of condition inspection as “C”; otherwise, the status follows the priority of “LU” > “MU” > “SU”. For instance, “Structural monitoring data” is created by daily and routine inspection, and is shortly used by other sub-scenarios, so the status of condition inspection on “Structural monitoring data” is set as “C”.
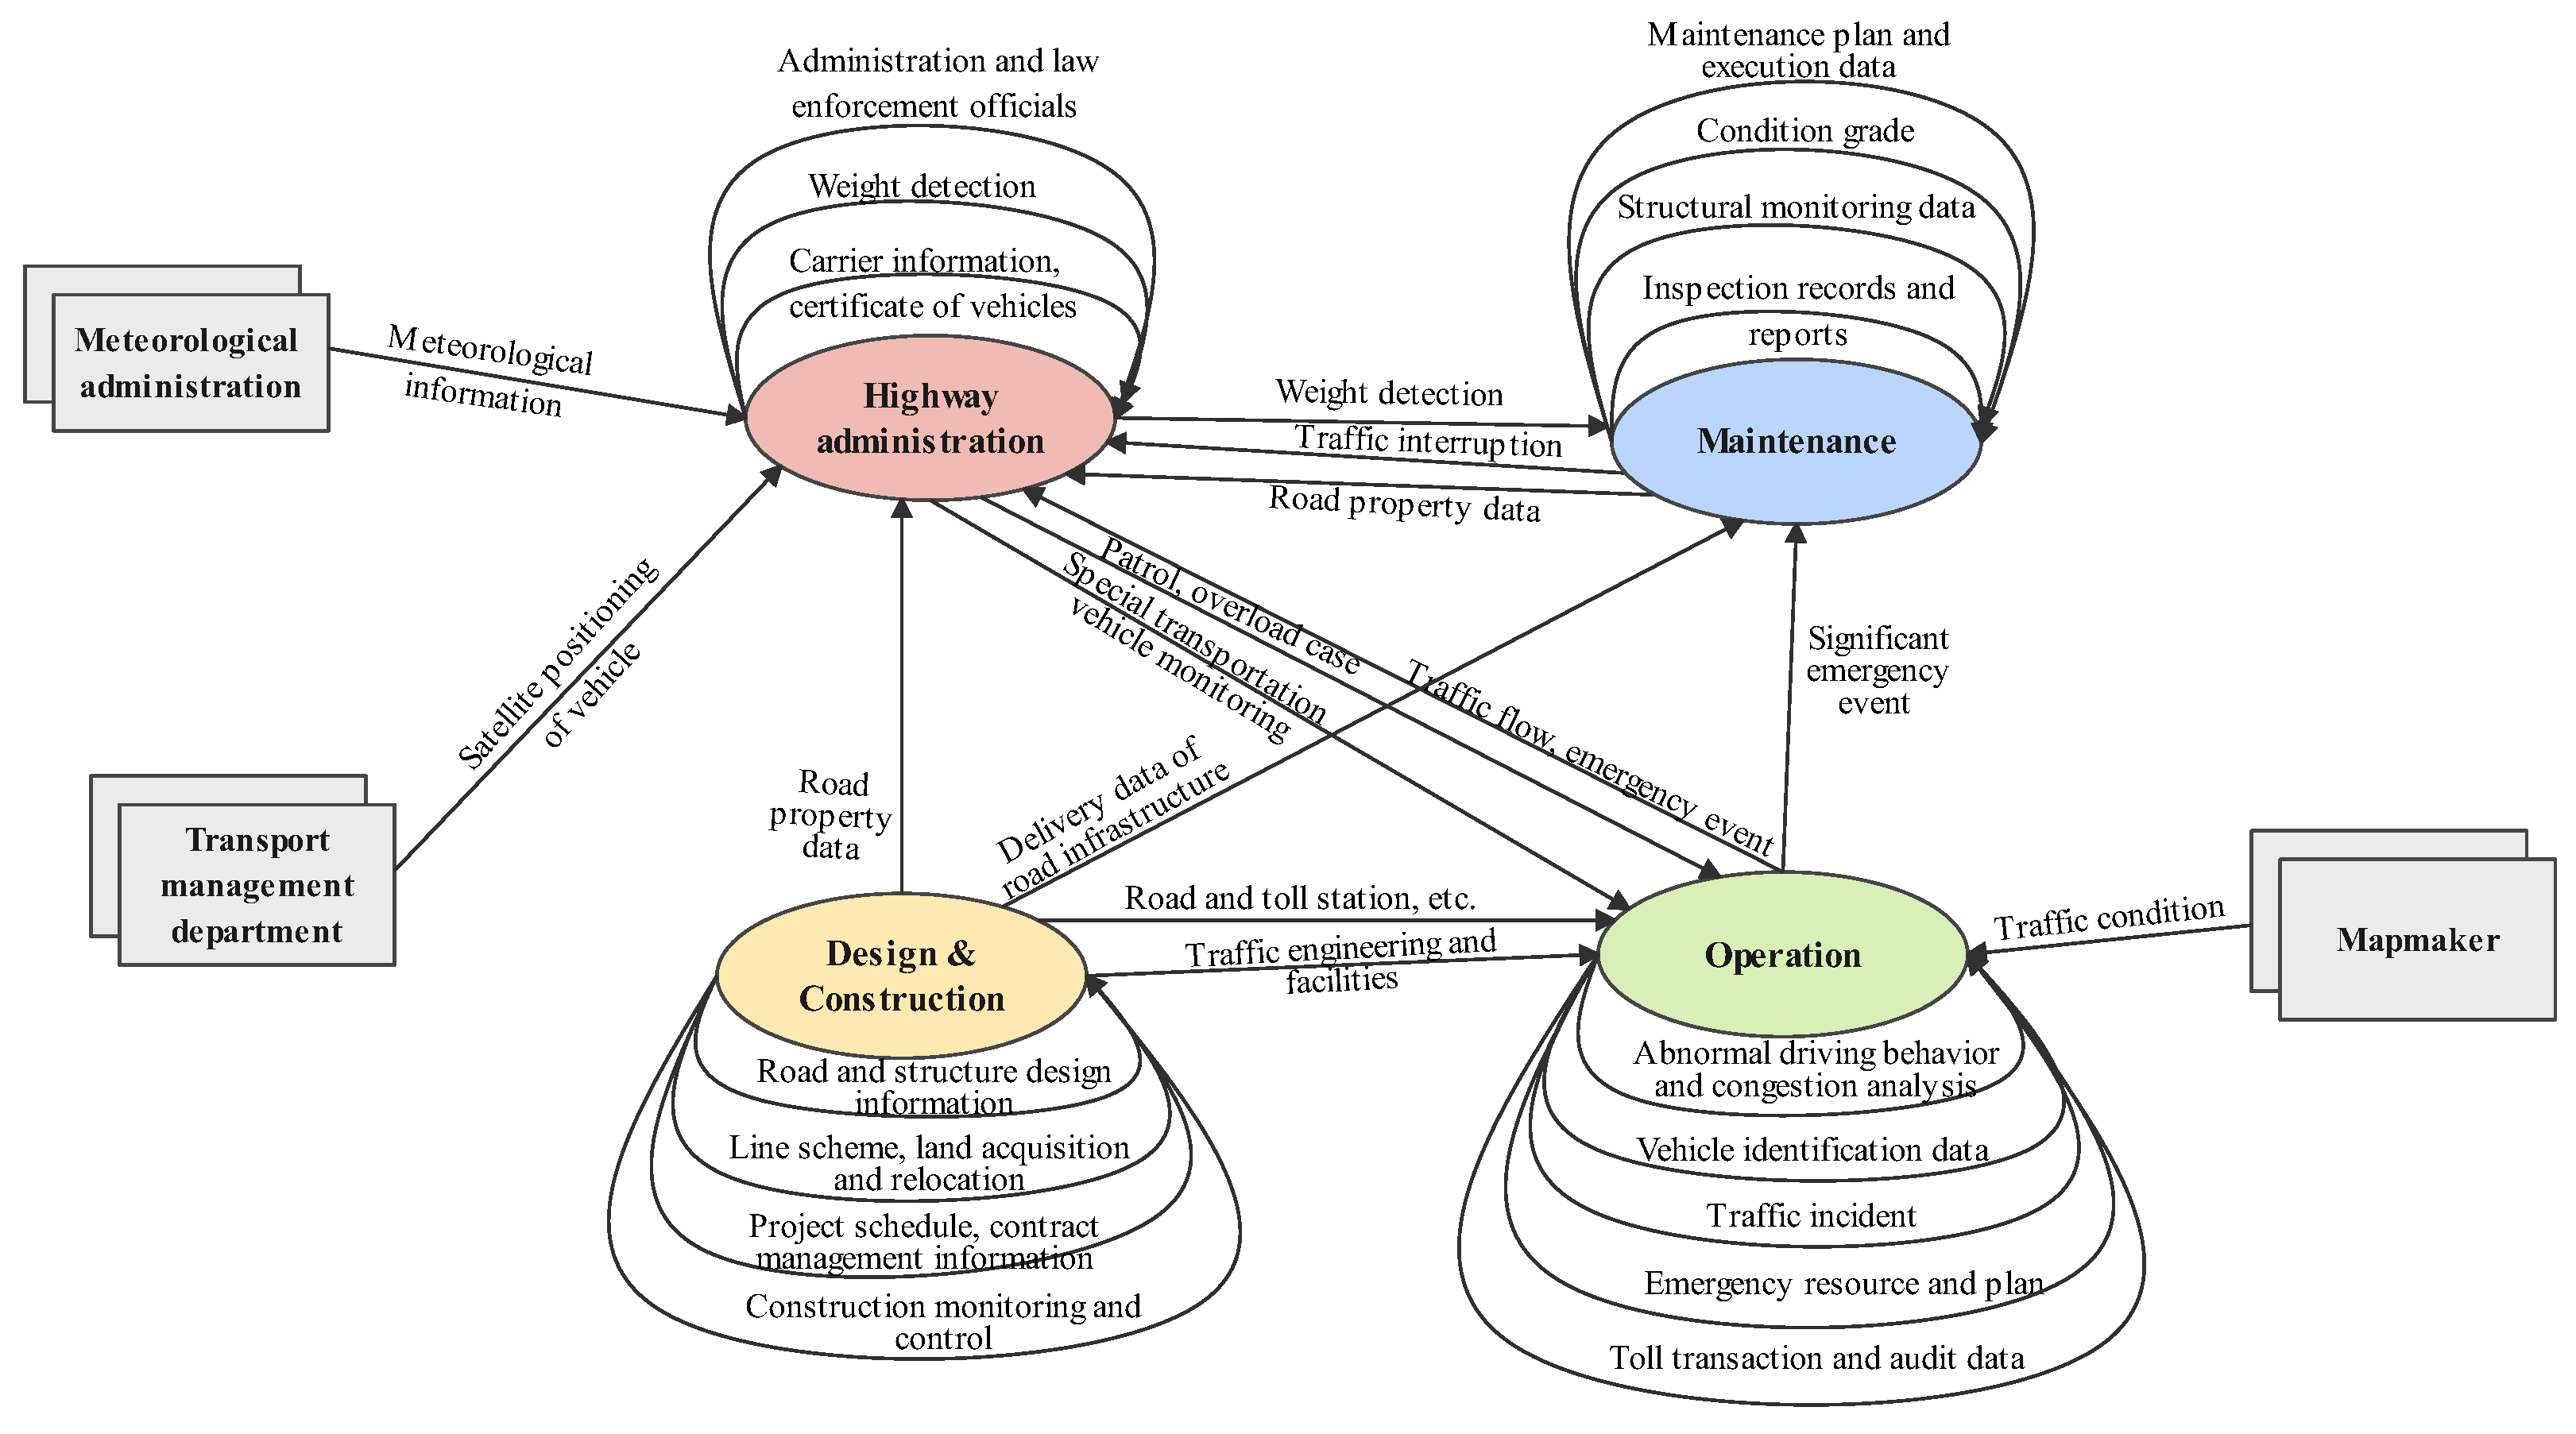
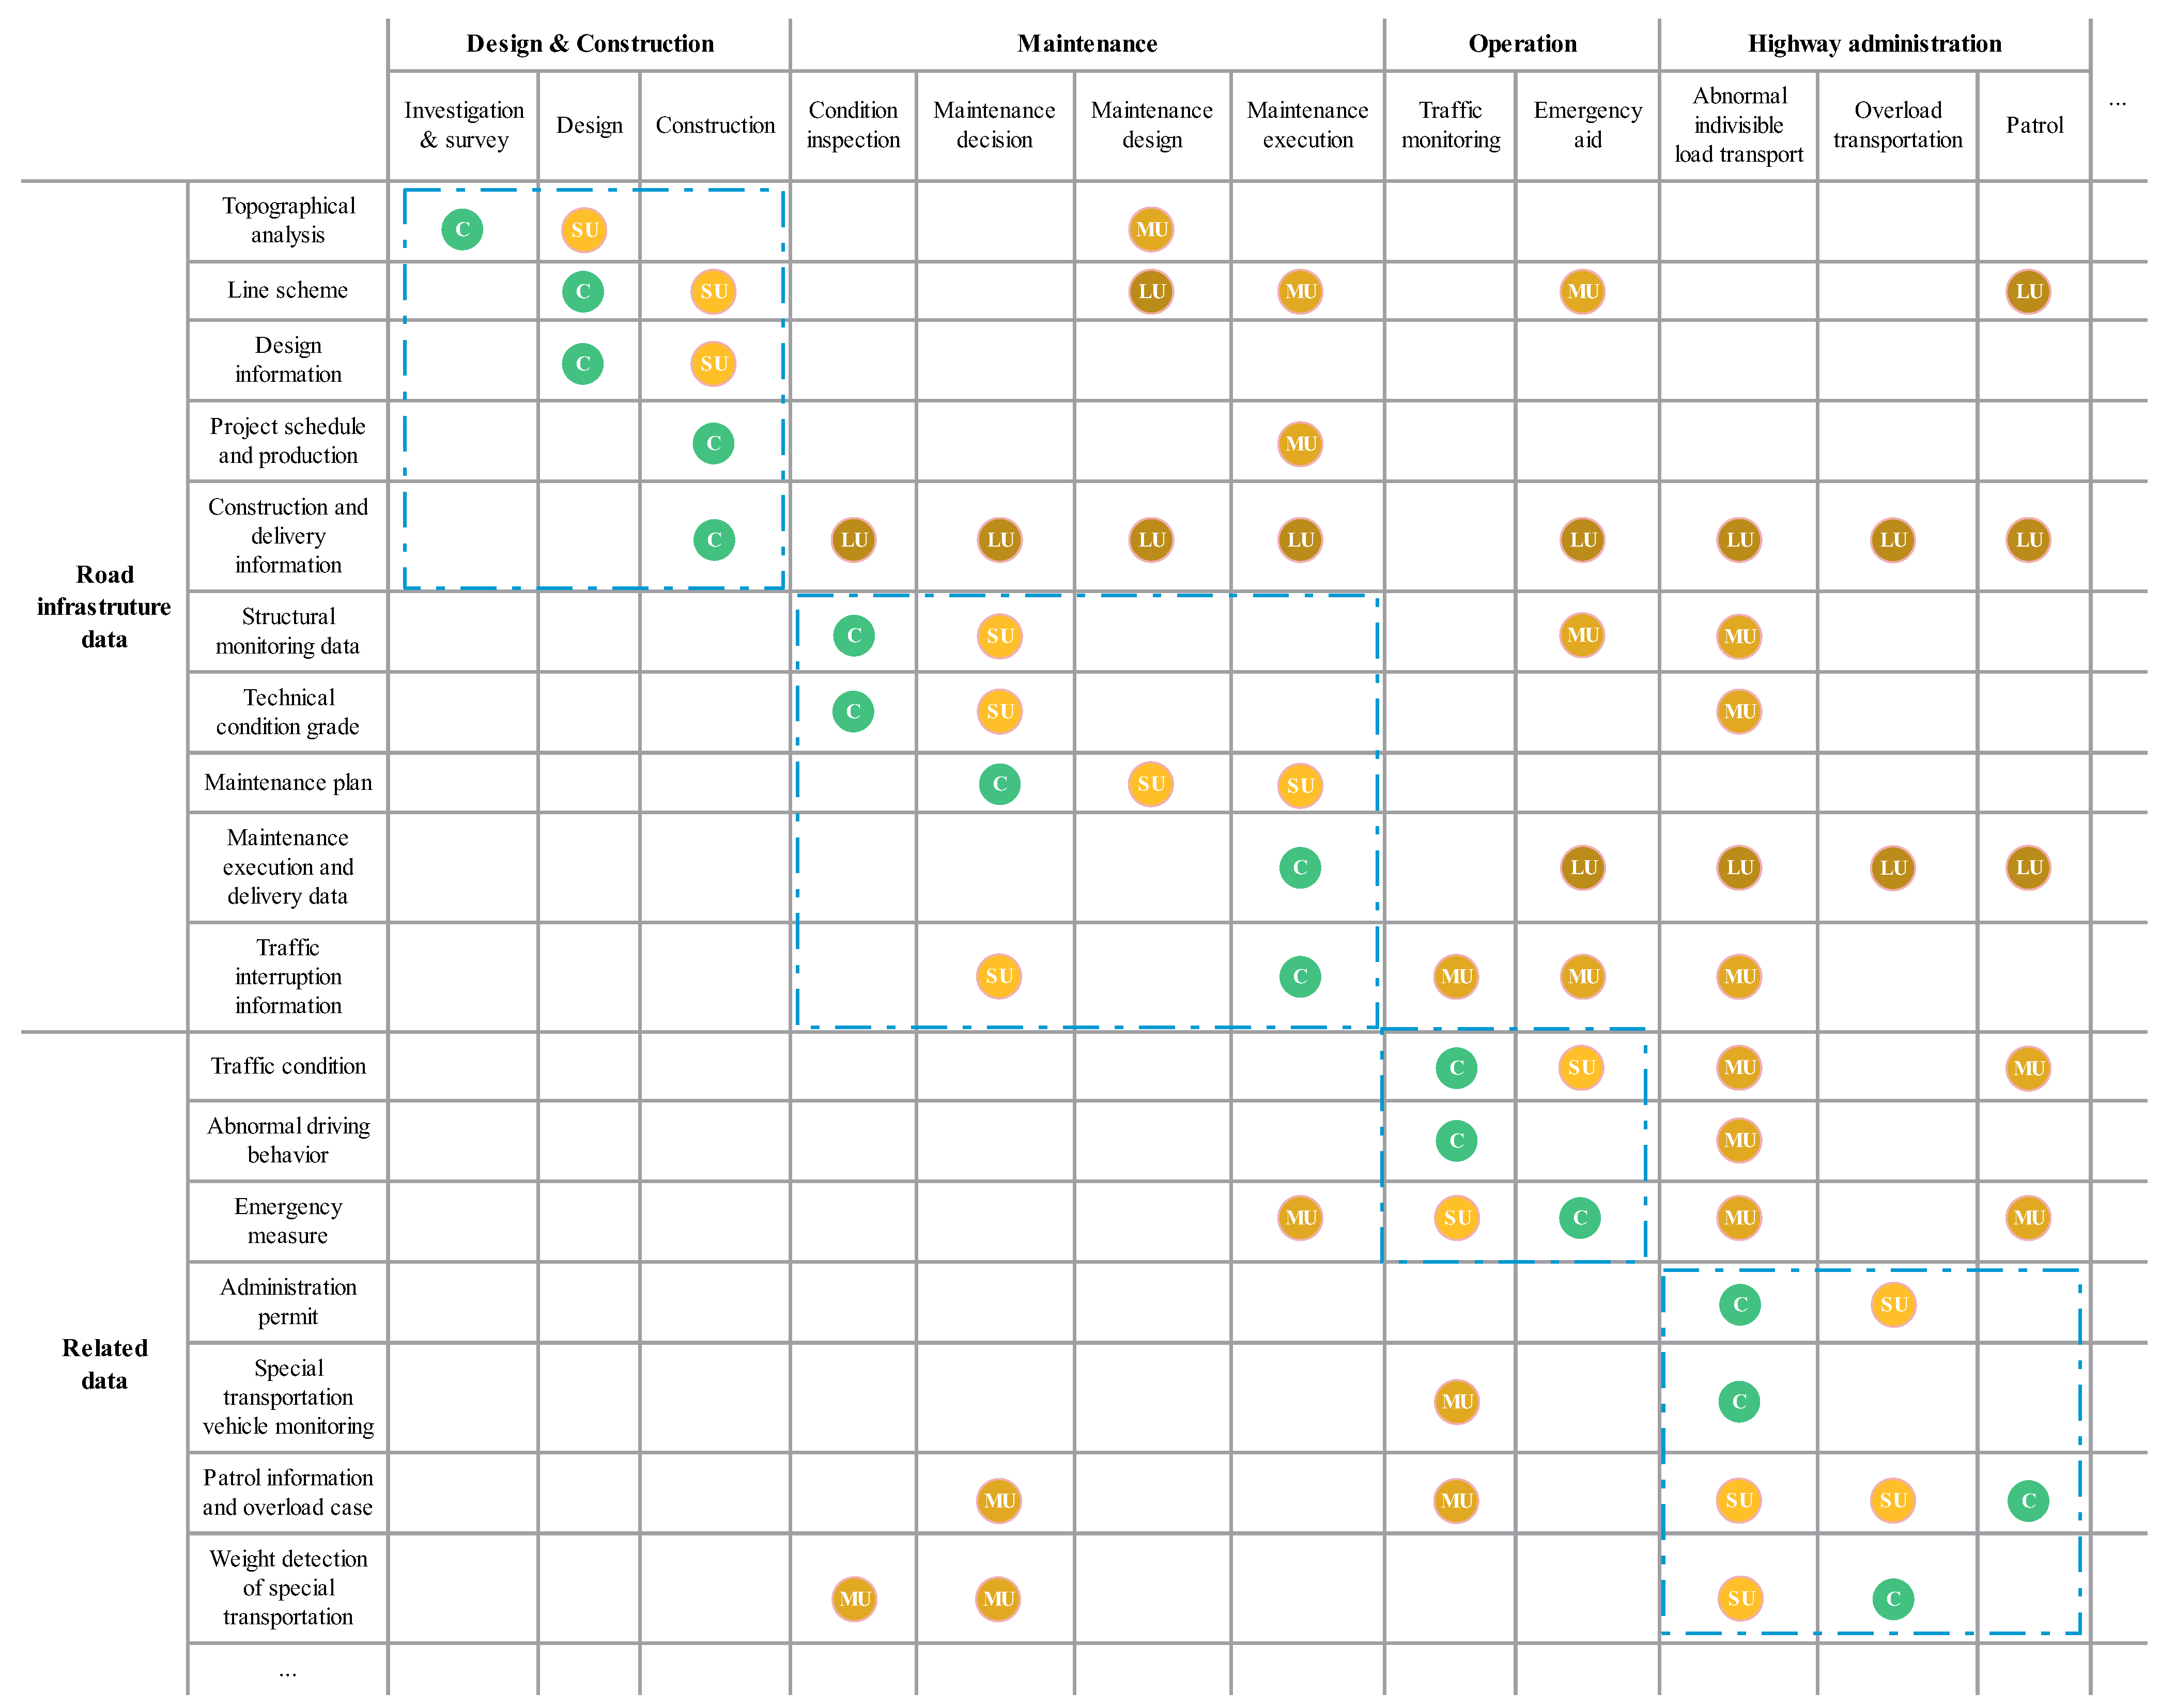
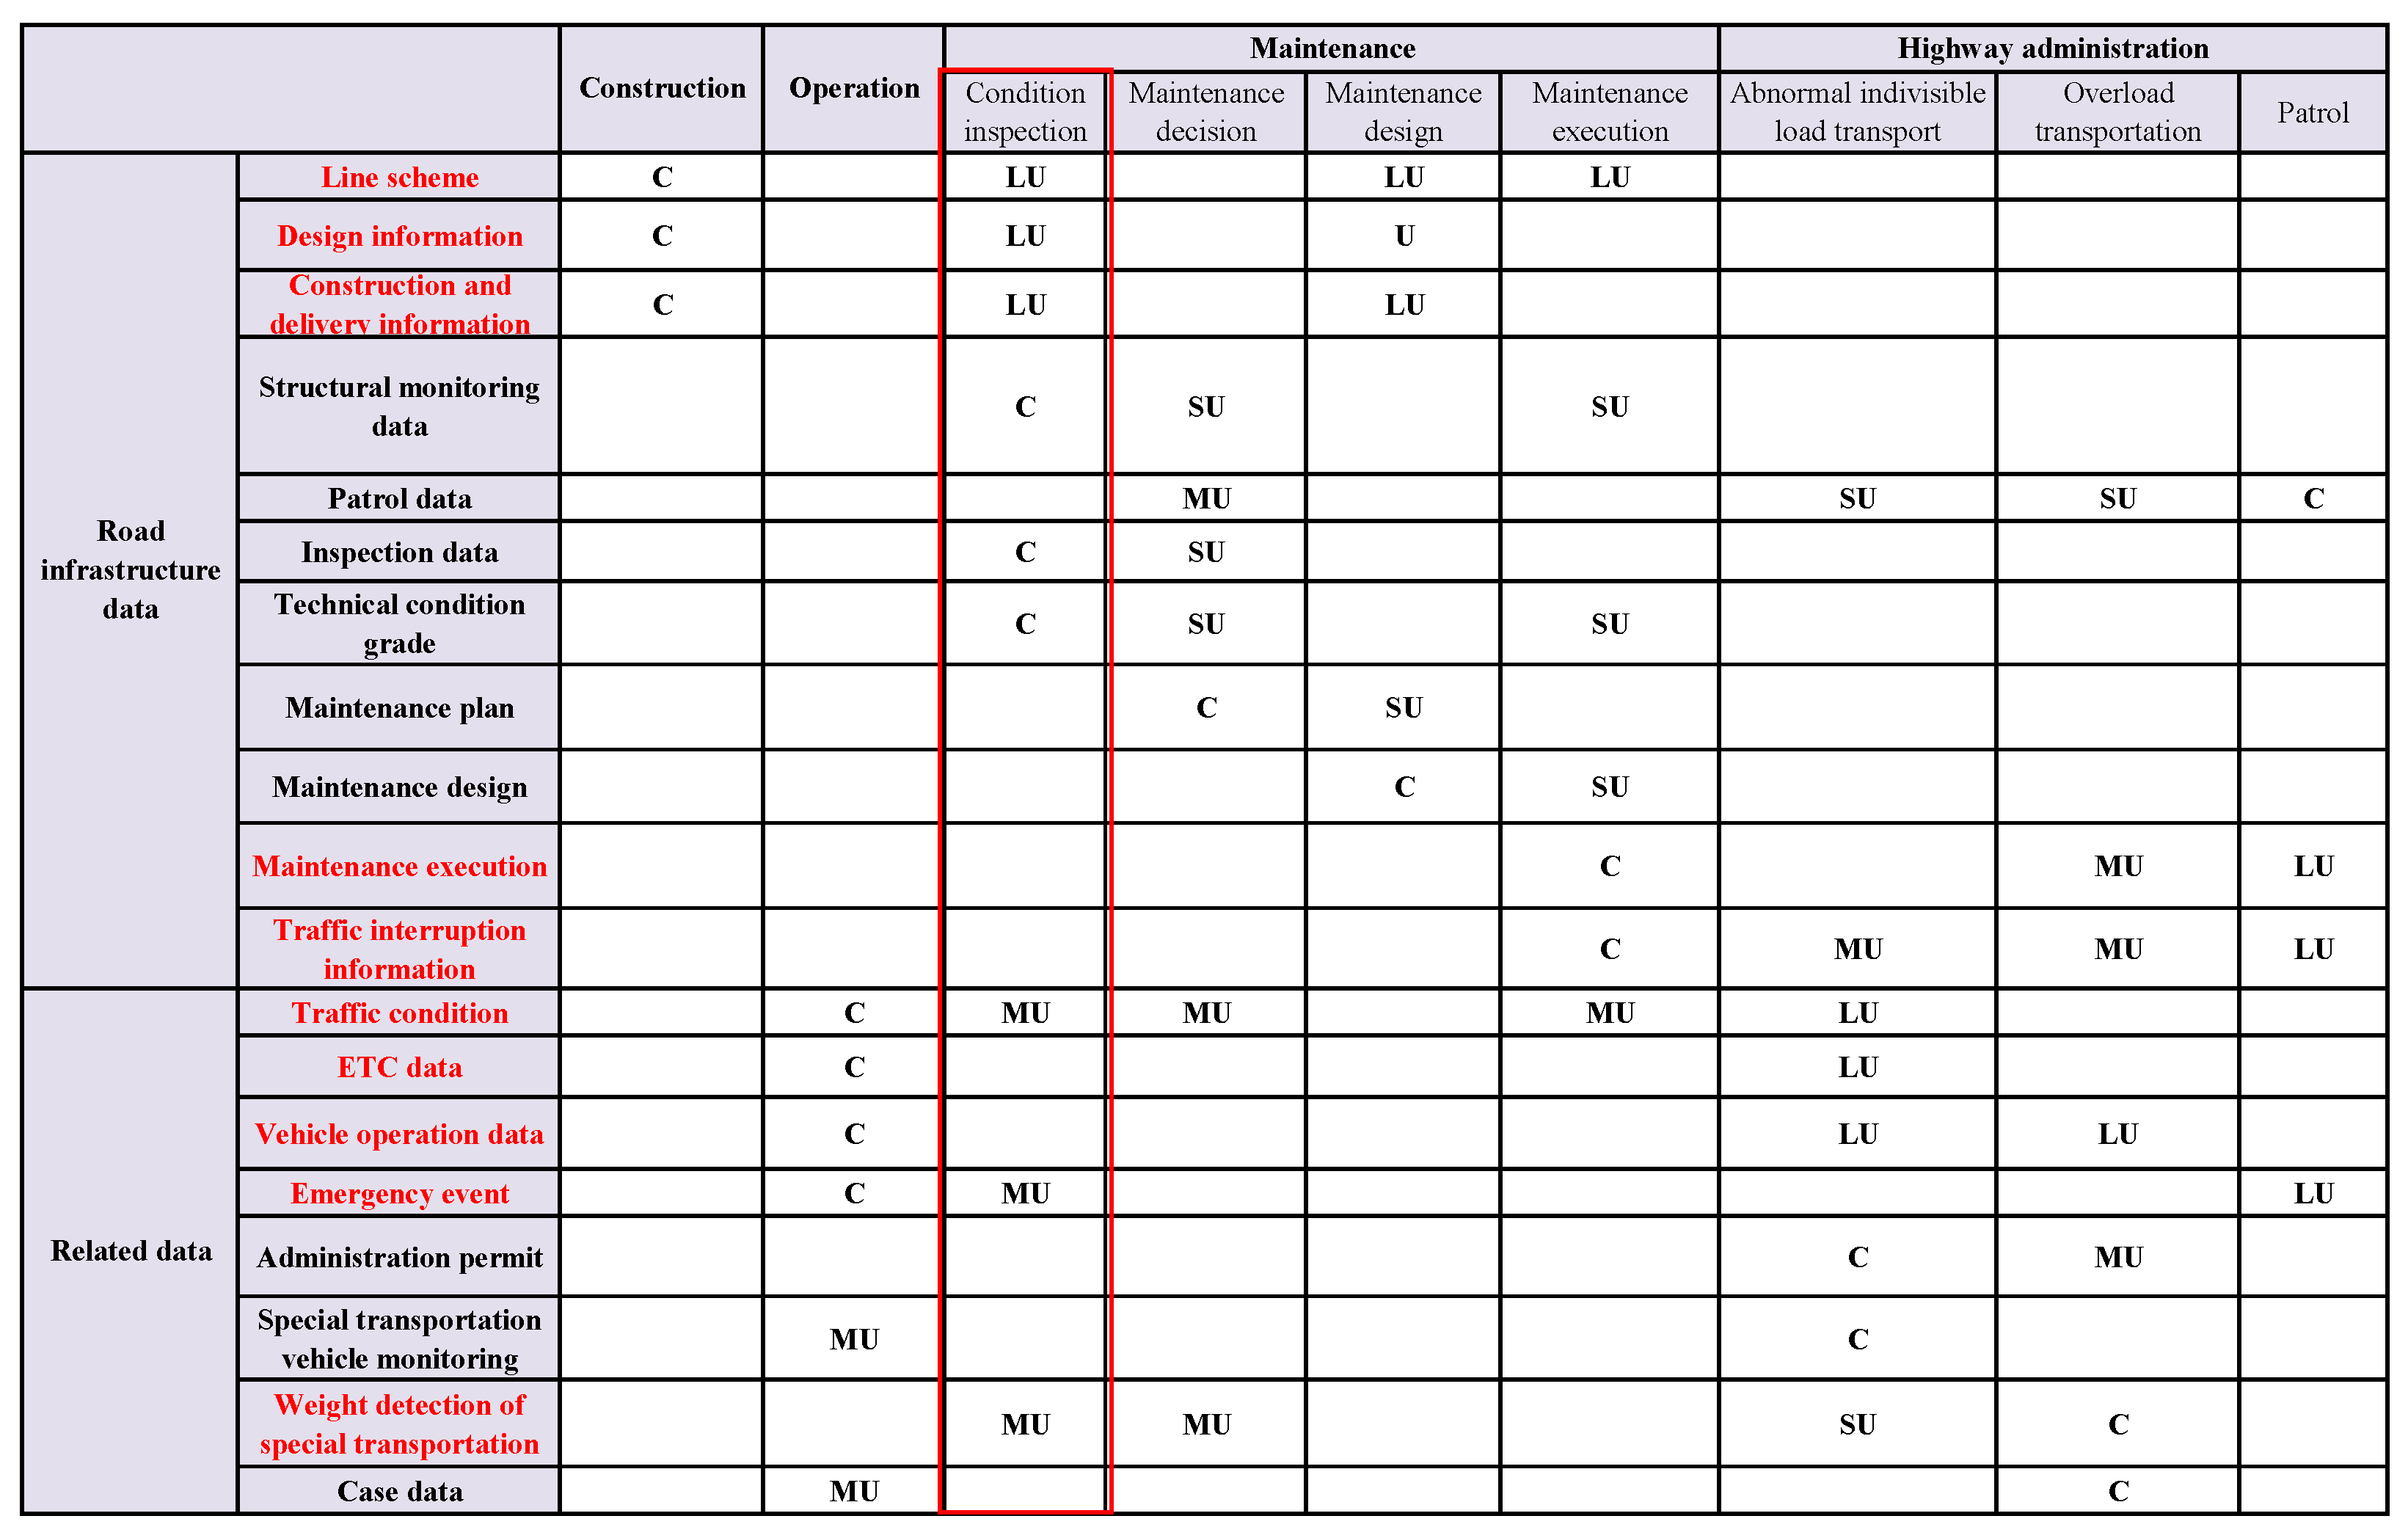
Then, the life-cycle data–process matrix involves 22 sub-scenarios—maintenance and highway administration, construction and operation, etc., as illustrated in Figure 13. The abbreviation of electronic toll collection data is ETC data. Other scenarios are incorporated with a similar analysis of condition inspection as mentioned above (i.e., the red rectangle in the figure). Each column has one creator and three multi-users (composed of shorter, medium, and longer users) denoted by “C”, “SU”, “MU”, and “LU”. Note that the user is set as the shorter user when the user and creator belong to the same category. When the use frequency is greater than 5 times/day, it is set as the longer user; otherwise, it is set as the medium user.
The principles of source uniqueness and high utilization are chosen to select the master data. When the data have one creator, no less than two medium users, or one longer user (i.e., the data in line contain one “C”, “MU” 2 , or “LU” 1 ), the data have high utilization and are set as the master data. Consequently, the master data set is selected as {Line scheme, Design information, Construction and delivery information, Maintenance execution, Traffic interruption information, Traffic condition, ETC data, Vehicle operation data, Emergency event, Weight detection of special transportation}, i.e., the red color in the figure.

5.2. Data Element Determination Results

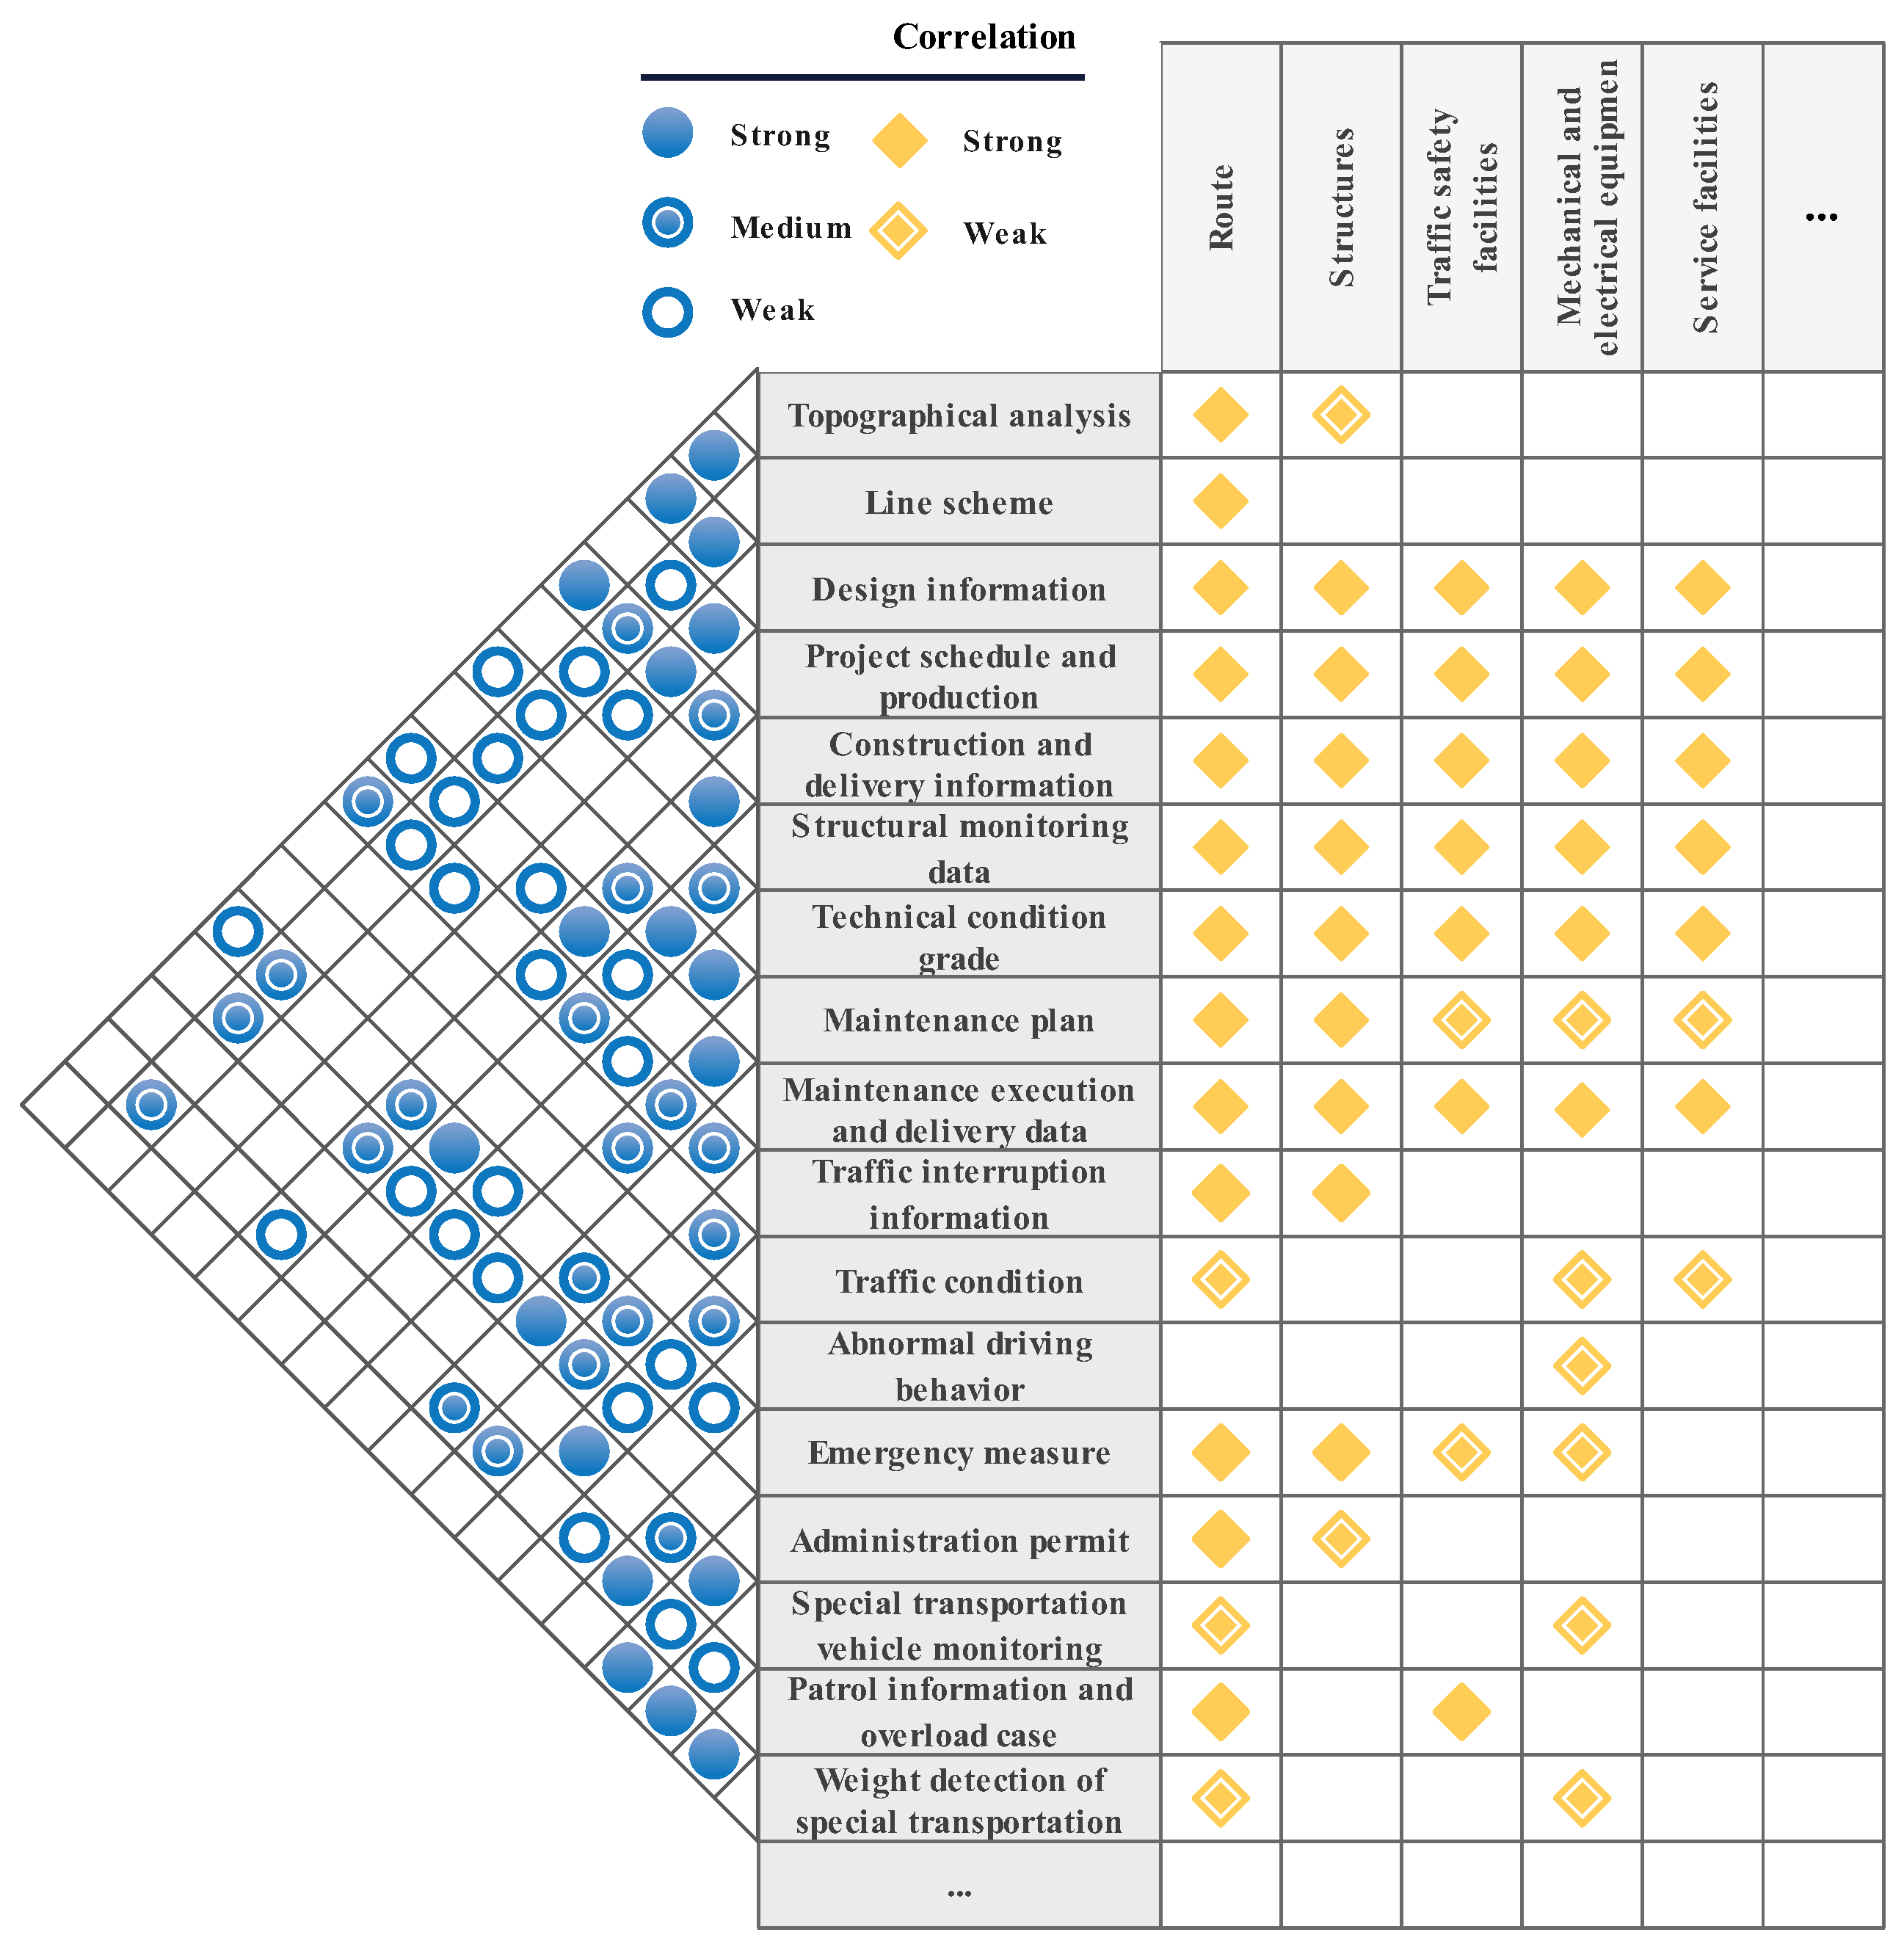
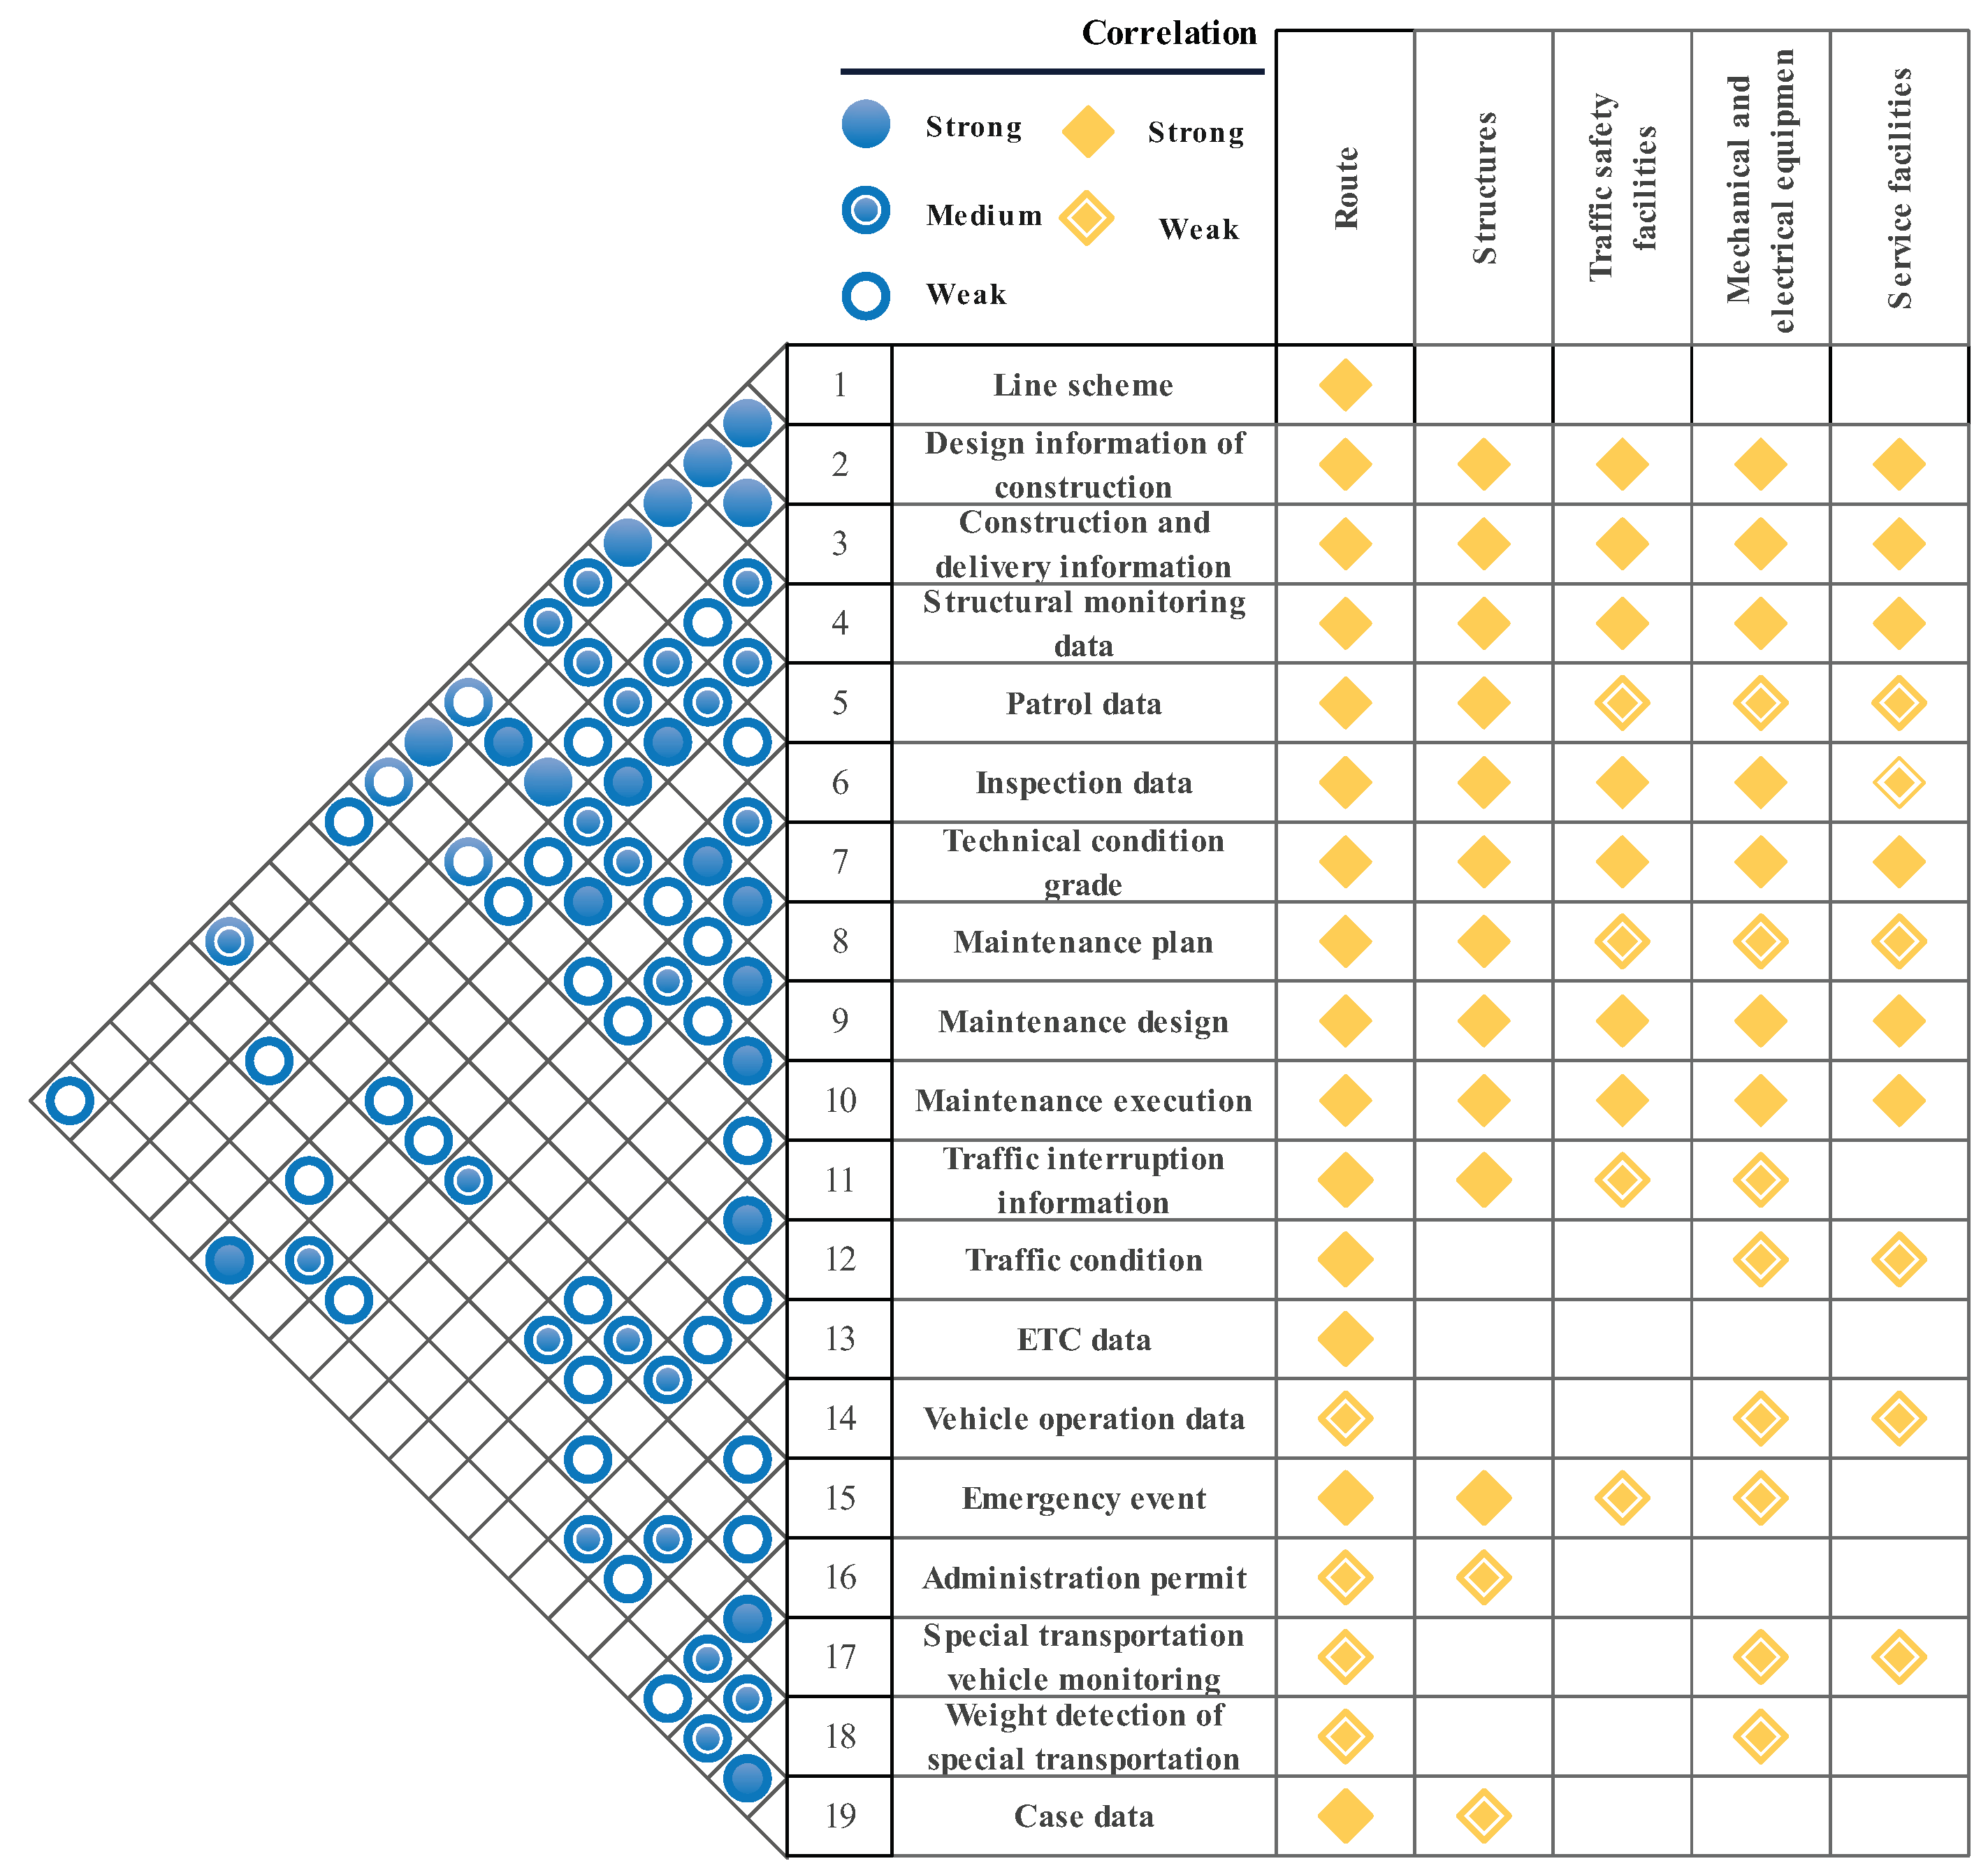
Next, the correlation matrix is formulated to depict the correlation between the process data and infrastructure data as illustrated in 
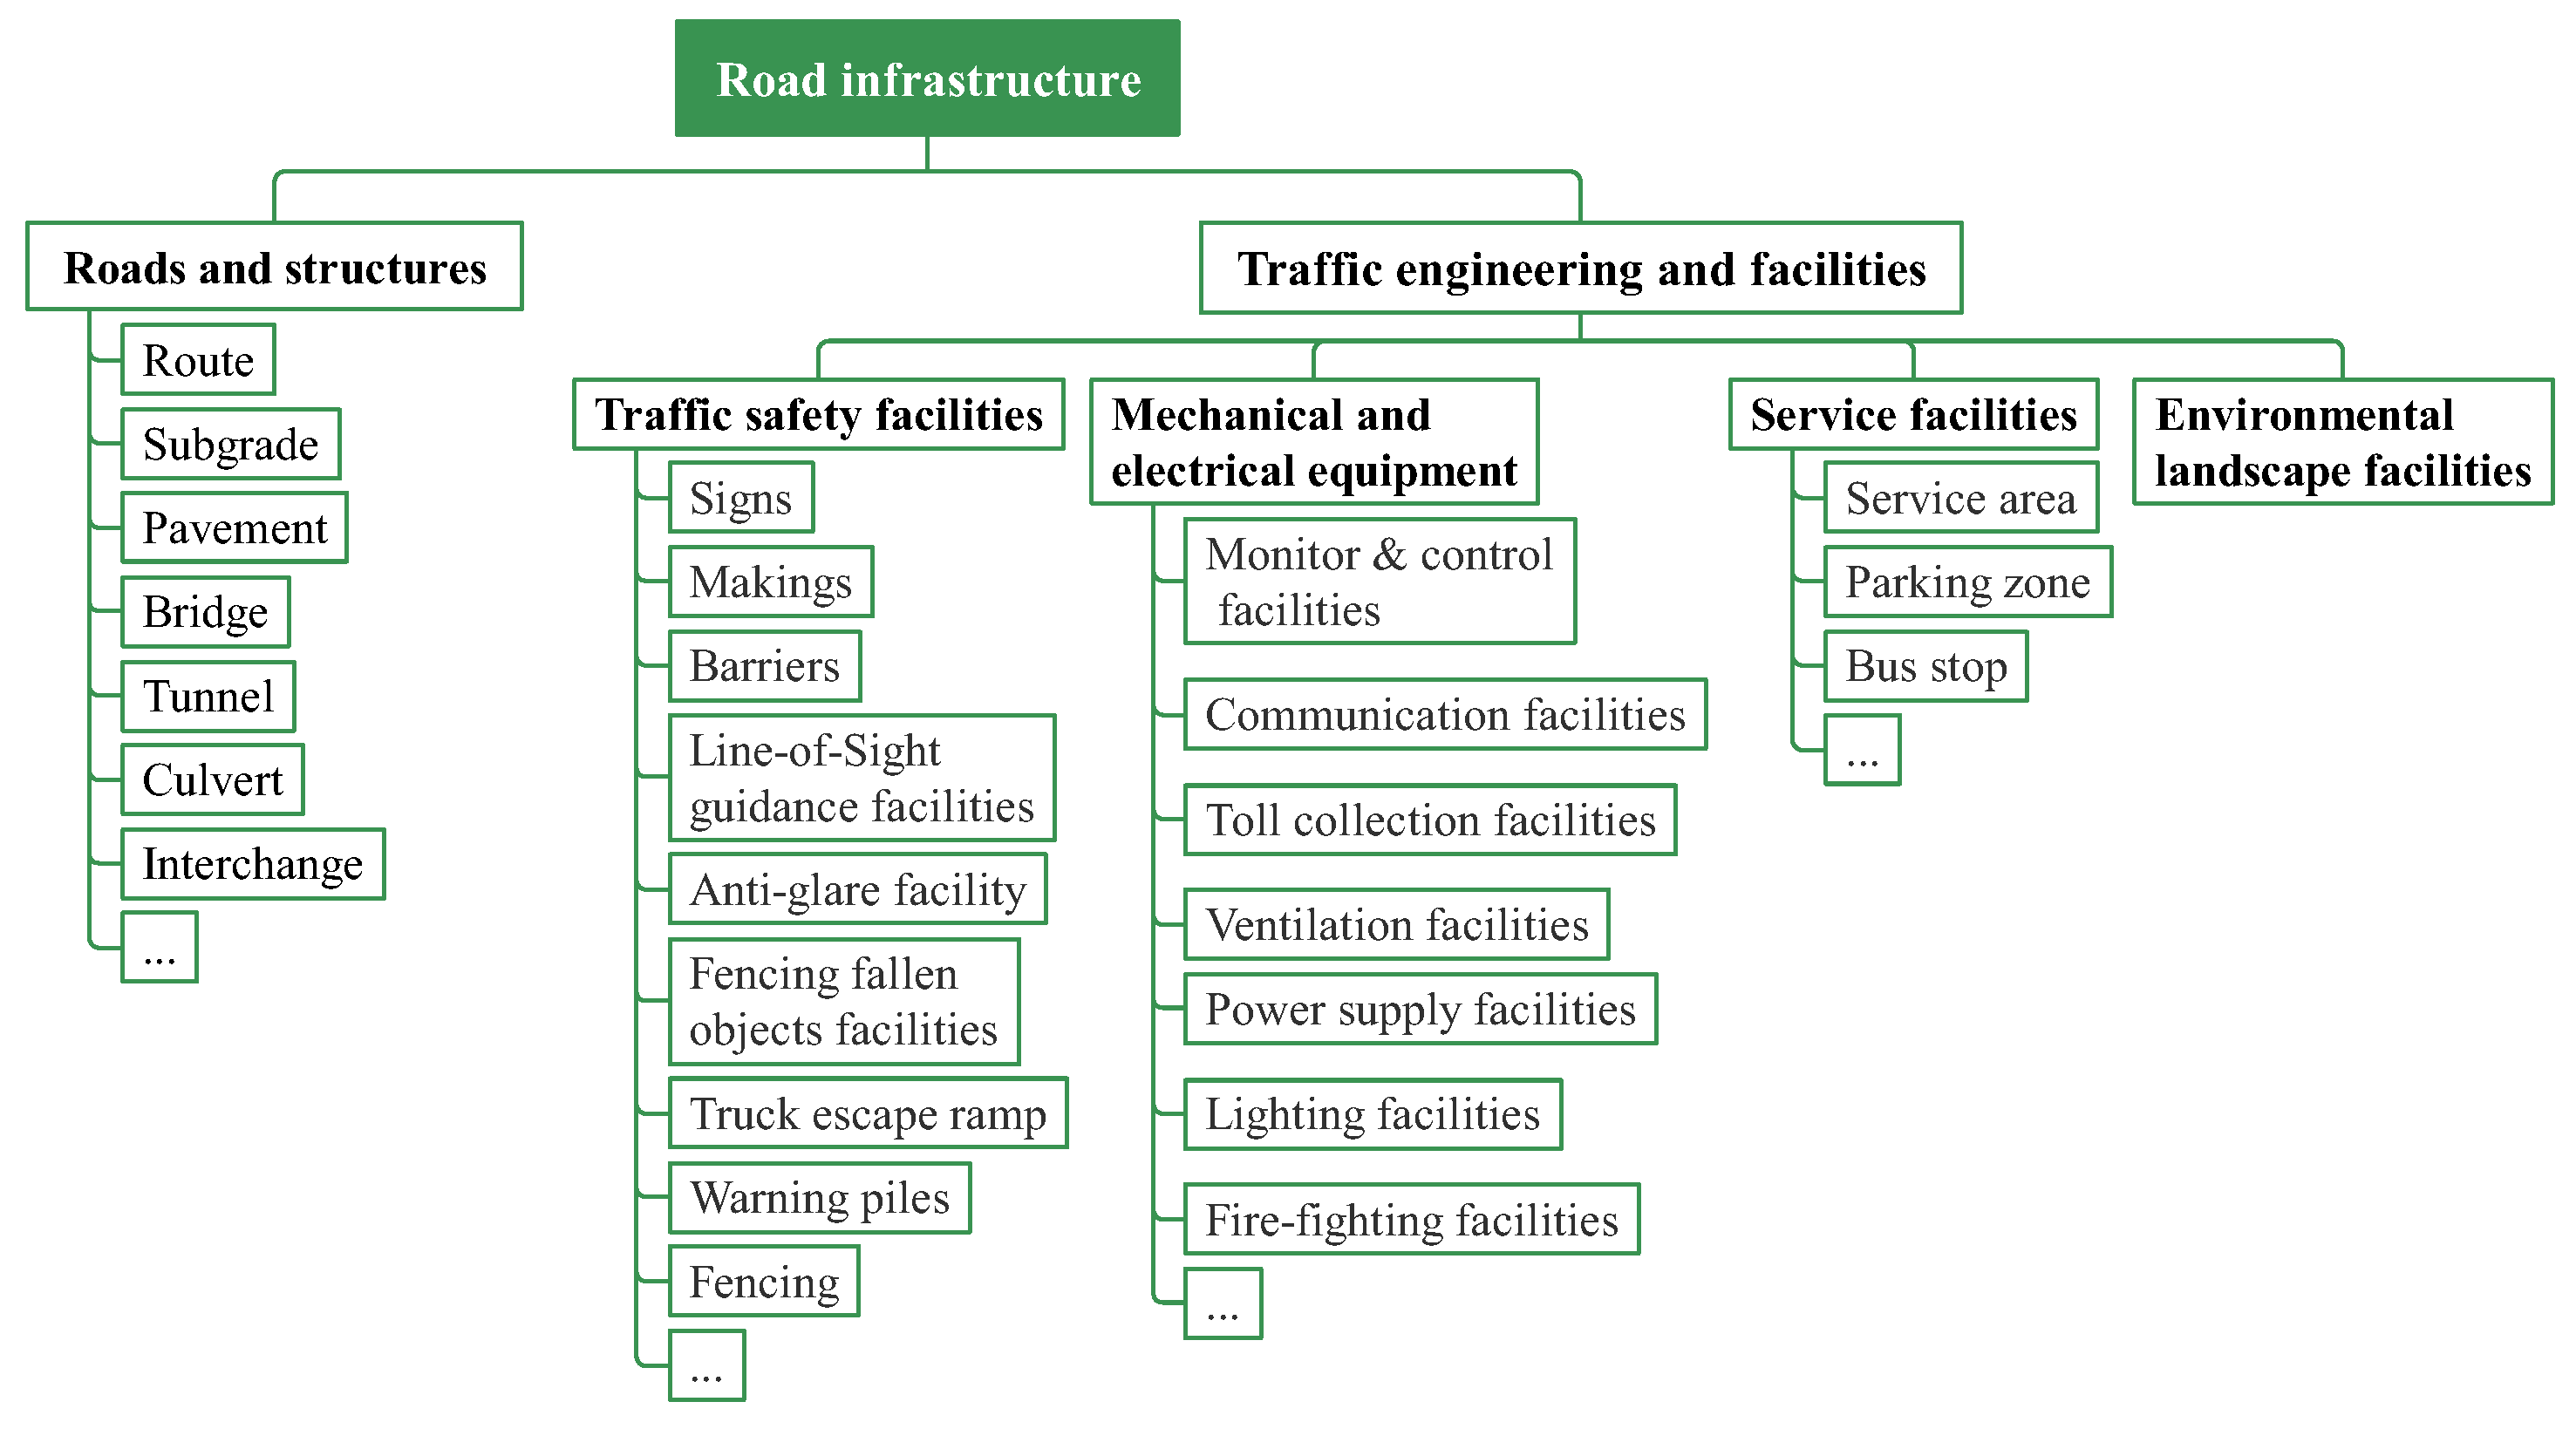
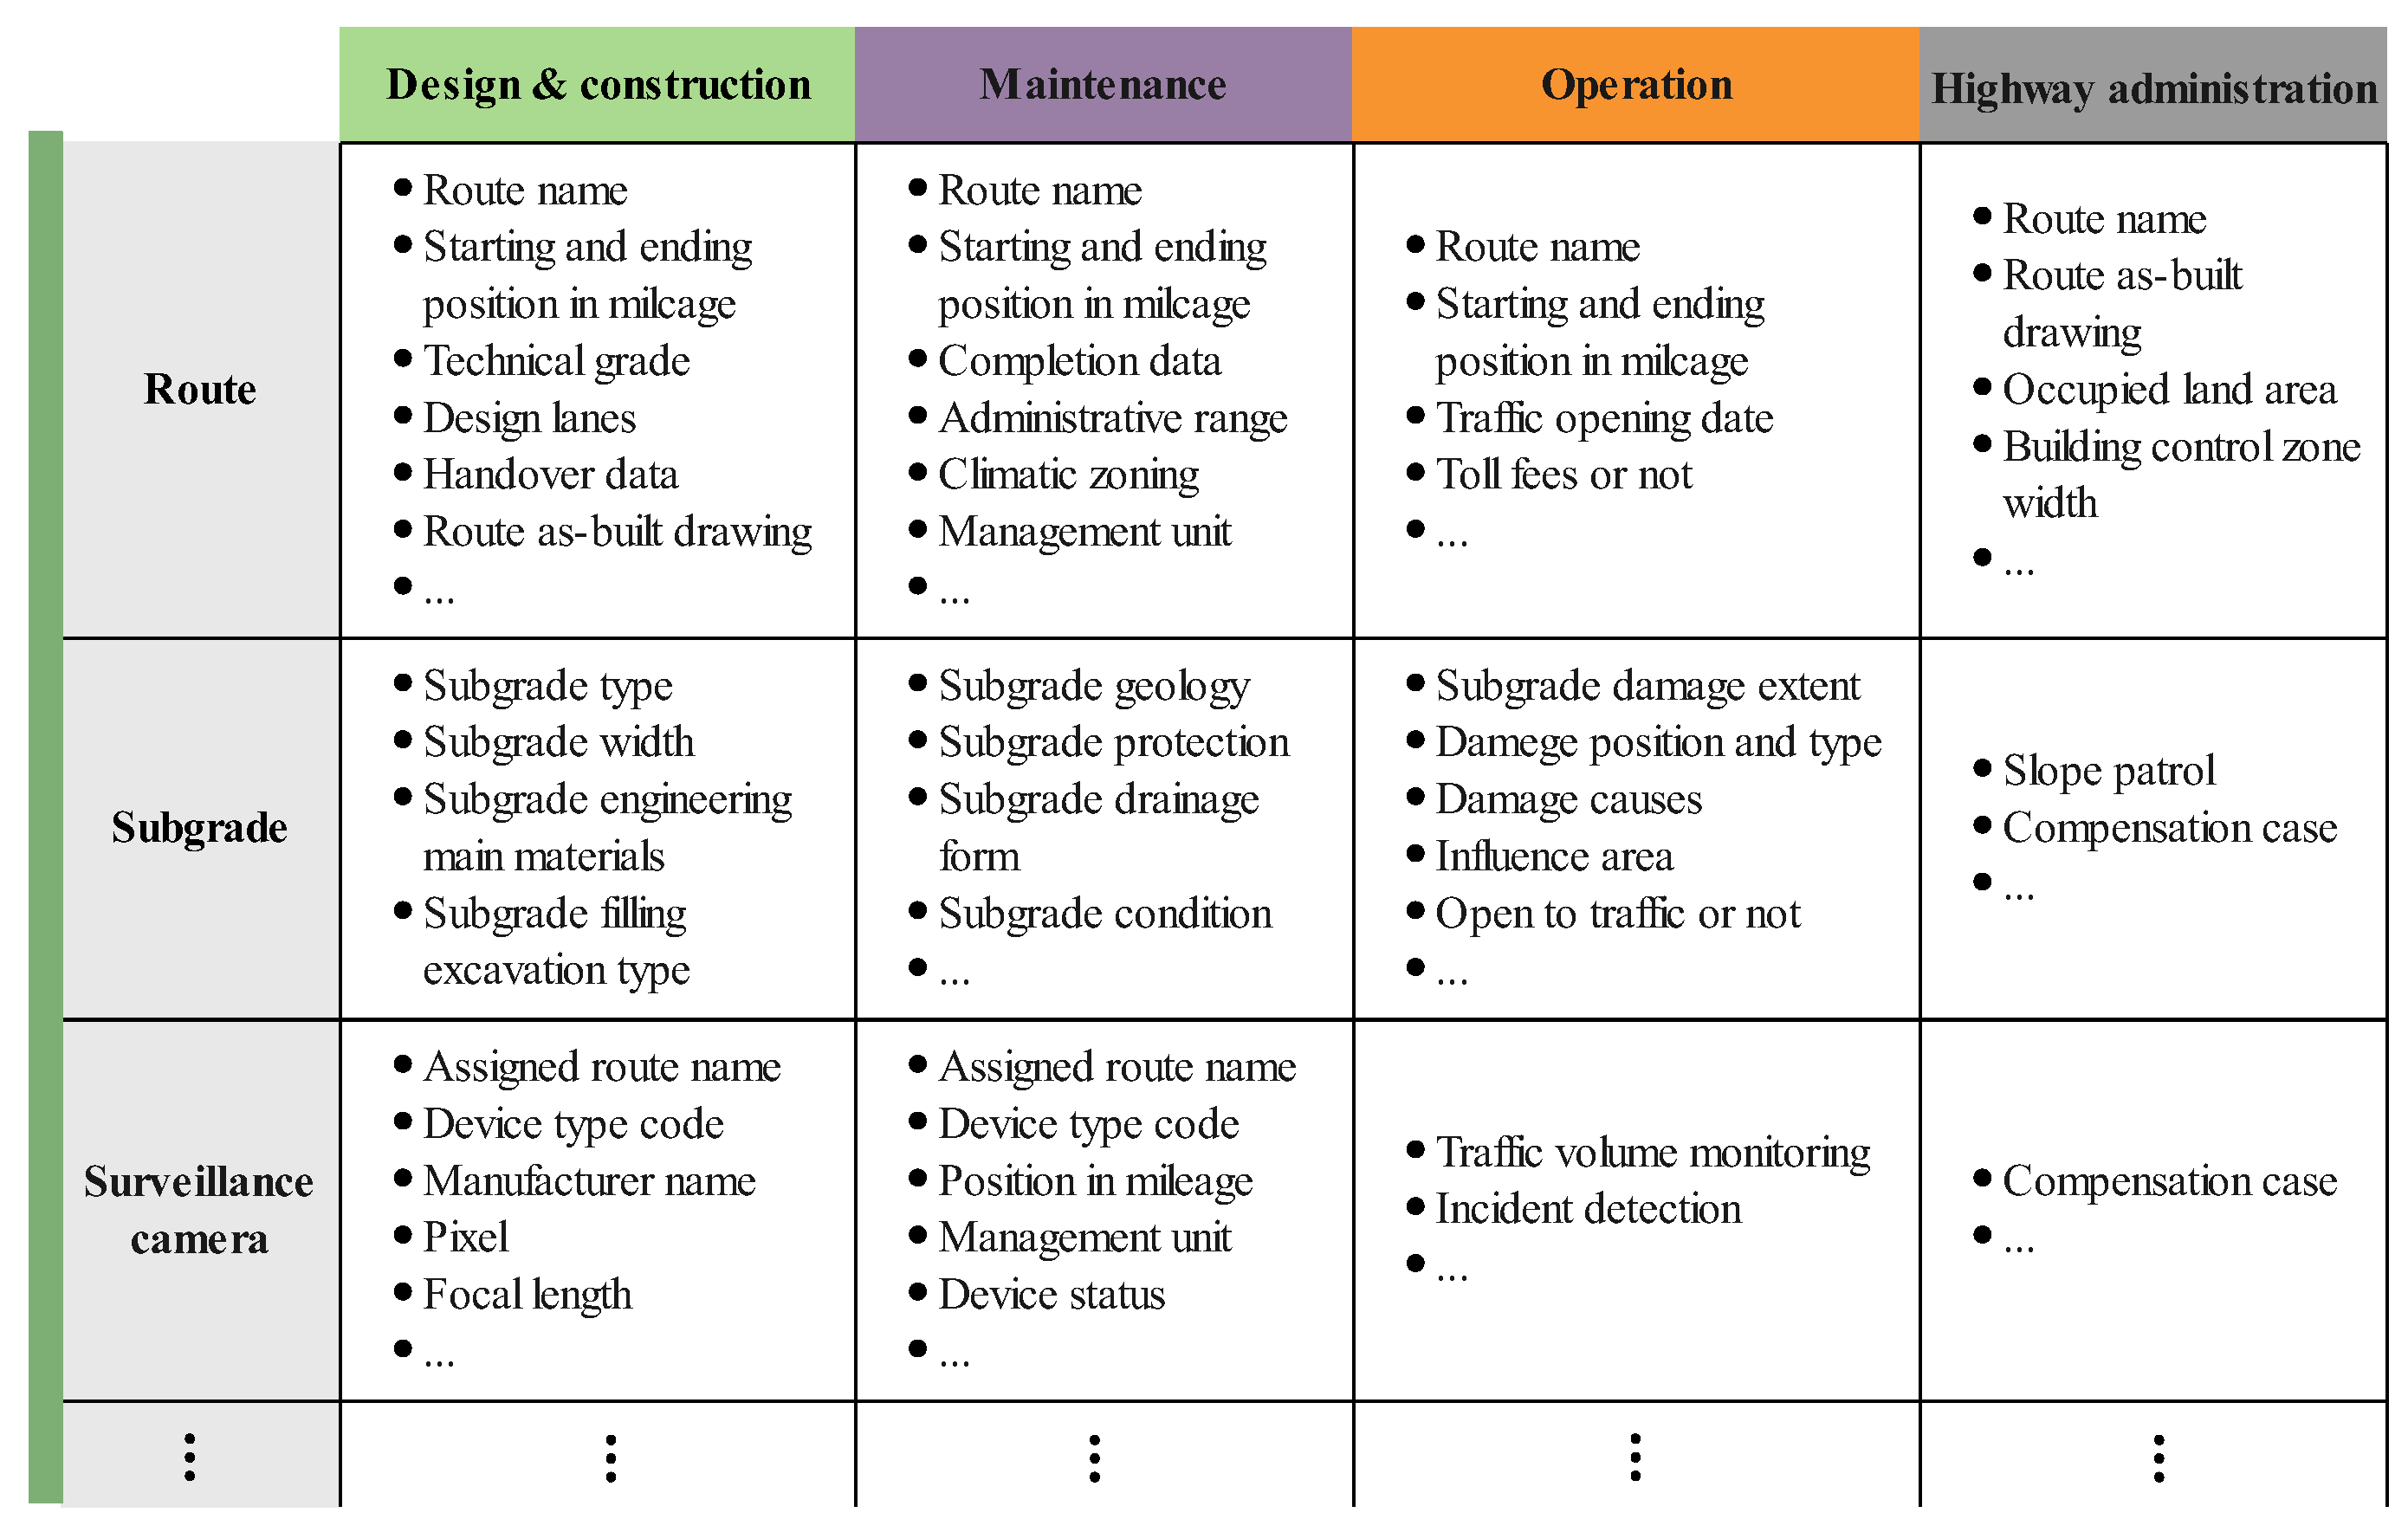
Figure 14. Note that this correlation between process data and infrastructure data mainly depends on standards and workflow regulations. We recommend survey questionnaires to obtain an accurate value of this correlation. The process data in line are obtained in maintenance and highway administration, and infrastructure data in the column consist of route, structures, traffic safety facilities, mechanical and electrical equipment, and service facilities. On the left side, the correlation between different process data is classified into three levels of strong, medium, and weak. For instance, “Construction and delivery information” has a strong influence on “Maintenance design”; there is a medium effect on “Structural monitoring data”, “Inspection data”, “Technical condition grade”, etc., but a weak effect on “Patrol data”, “Maintenance plan”, etc.
In the figure, strong and weak correlations between each process datum and infrastructure datum are denoted by solid and hollow orange diamonds, respectively. The process data of “Design information”, “Construction and delivery information”, and “Structural monitoring data” strongly correlate with all infrastructure, and other data only have a strong or weak correlation with parts of infrastructure data. “ETC data” only have a weak correlation with route data, while “Case data” have strong and weak correlations with route data and structure data.
The data element D u , k of process data u { 1 , 19 } and infrastructure data k { 1 , 5 } is summarized. For instance, data element D 1 , 1 of “Line scheme” and route, and D 2 , 2 of “Structural monitoring data” and structure are presented below:
D 1 , 1 = { route name ,   starting mileage ,   ending mileage } ; D 2 , 2 = { damage situation of structure ,   damage type of structure ,   number of damages , damage condition grade of structure } .
Then, according to the correlation matrix (see Figure 14), the principle of consistency (i.e., same metadata attribute) is selected to determine the master data element. Set threshold value C as 2 and the modified data element set with medium and strong correlations is selected when correlation coefficient c u u * is not less than 2. The threshold value A is set as 2, i.e., only the strong correlation between process data and infrastructure data is selected. The master data of the “Weight detection of special transportation” (i.e., u = 18 ) are given below to illustrate the calculation process.
The master data M 18 are dependent on the original data element D 18 and have medium correlations with “Inspection data” D ¯ 6 18 , “ETC data” D ¯ 13 18 , “Administration permit” D ¯ 16 18 , and “Special transportation vehicle monitoring” D ¯ 17 18 , as well as a strong correlation with “Case data” D ¯ 19 18 . With principles of consistency and value (denoted by f ( * ) ), the master data of “Weight detection of special transportation” can be obtained when those data elements have the same metadata attribute. Note that D ¯ 16 18 and D ¯ 17 18 are empty sets because these two process data cannot contain the strong correlation with infrastructure data (because the threshold value A is 2). Thus, we have
M 18 = arg max f ( D 18 , D ¯ 6 18 , D ¯ 13 18 , D ¯ 19 18 )
where
D ¯ 6 18 = { D 6 , 1 , D 6 , 2 , D 6 , 3 , D 6 , 4 , D 6 , 5 } D ¯ 13 18 = { D 13 , 1 } D ¯ 19 18 = { D 19 , 1 } D 18 = { D 18 , 1 , D 18 , 4 }
Table 7 shows the original data element of “Inspection data” D 6 , “ETC data” D 13 , “Weight detection of special transportation” D 18 , and “Case data” D 19 for the master data M 18 calculation. Index is the number index u of process data in Figure 14. Note that the original data of D 6 , 1 ,   D 6 , 2 ,   D 6 , 3 ,   D 6 , 4 ,   D 6 , 5 , respectively, denote the data element of route, structure, traffic safety facility, and mechanical and electric equipment. For instance, D 6 , 4 contains equipment ID, operational status, fault cause, etc., to describe the inspection of mechanical and electric equipment.
For consistency and value, the same and valuable metadata attributes are selected from D ¯ 6 18 , D ¯ 13 18 , and D ¯ 19 18 , and then the original data D 18 are extended to obtain the master data. Hence, M 18 contains two parts: the route, and mechanical and electrical equipment. They are given below:
M 18 = { M 18 1 ,   M 18 4 }
where M 18 1 and M 18 4 correspond to D 6 , 1 and D 18 , 1 , and D 6 , 4 and D 18 , 4 . So, we have the following:
M 18 1 = {route ID, route name, overload station ID, station name, mileage of station, detection direction, entrance and exit toll gate, entrance and exit time, vehicle trajectory, vehicle license number, carrying capacity, cargo type, violate time, punishment type, cargo source company}.
M 18 3 = {lane ID, equipment ID, operational status, operating environment, detected vehicle type, detection time, detected vehicle speed, total weight of cargo, detected number of axles}.

6. Conclusions

Highway asset management encounters difficulty with the hundreds of types of infrastructure. To achieve maximal data sustainability and minimal cost, infrastructure digitalization is the main method used to integrate information resources and support life-cycle application scenarios. In this paper, the digital requirements are analyzed from the literature and through survey questionnaires, and a research methodology with a six-step procedure is proposed to guide the development of the life-cycle framework. The infrastructure digitalization framework is designed with four layers and two support systems, i.e., road infrastructure and other data, data governance, life-cycle data integration, application scenarios, regulations and standards, and performance assessment. Focused on data integration, an approach with the modified data–process matrix, correlation matrix, and selected factors is first developed to identify master data and the elements. Static and dynamic data are connected in the data relationship model from multi-source infrastructure data. Finally, we verify the effectiveness of the life-cycle data integration approach in numerical experiments to guide the data interoperation between highway administration and maintenance, operation, etc.
Faced with transportation digitalization and transformation, some potential future developments can also be considered in highway asset management. First, a performance assessment system is required to establish a set of detailed evaluation indicators to guide the highway digital transformation in terms of economic and social benefits, like sustainability, values, and outcomes. Second, highway digital transformation involves not only physical infrastructure but also organizational transformation, such as approval process simplification, people’s digital ability, compatible regulation, etc. Third, highway digitalization is a new high-quality means of productivity that promotes society’s economic growth and infrastructure, and other data that act as a digital asset will serve in the integration of transportation with tourism, logistics, commercial business, etc.

Author Contributions

Conceptualization, Y.H. and J.G.; methodology, Y.H.; investigation, Y.H., J.Z. and W.L.; writing—original draft preparation, Y.H.; supervision, L.W. All authors have read and agreed to the published version of the manuscript.

Funding

This research was funded by the Research Institute of Highway Ministry of Transport of “Highway high-capacity capacity theory and model under digitalization condition (No. 2024-9025)” and “2024 high-level and high-skill personnel training project (No. 2024-21)”, and Hubei Transportation Technology Development Co., Ltd. of “Research on Lifecycle Infrastructure Data Standards for Hubei Transportation Investment Expressways”.

Institutional Review Board Statement

Not applicable.

Informed Consent Statement

Not applicable.

Data Availability Statement

Data are contained within the article.

Acknowledgments

The authors acknowledge the contributions of the team members.

Conflicts of Interest

The authors declare no conflicts of interest.

Appendix A. Required and Provided Data from the Practical System

According to the application scenarios and sub-scenarios (see Table 4), the maintenance data with 4 scenarios and 17 sub-scenarios are presented in Table A1, including scenario, sub-scenario, and provided and required data.
Table A1. Provided and required data of a practical maintenance system.
No.ScenarioSub-ScenarioProvided and Required Data
1Condition inspectionDaily and routine inspectionRoute name, starting and ending mileage, inspection time and position, damage situation and types, process description, treatment advice; traffic condition, etc.
2Periodic inspectionDisaster type, number of disasters, disaster description, treatment range and measures, whether require special inspection or not, etc.
3Special inspectionDamage type, number of damages, damage description, cause analysis, inspection results, treatment range and measures, damage condition grade, etc.
4Emergency inspectionEvent types and levels, event description, damage type, number of damages, damage description, cause analysis, inspection results, treatment range and measures, etc.
5Technical condition gradeMaintenance quality indicator of pavement, bridge component; design information, construction information, etc.
6Fault reporting informationFault device name and position, fault reason, reporting level, reporting personnel, treatment time and status; incidents report, extreme weather report, etc.
7Maintenance decisionBasic decision informationDecision period, predictable result of technical condition, maintenance target and indicators, type of maintenance engineering, measures of engineering, cost of engineering, decision personnel and data, management department; traffic volume, axial loading, etc.
8Routine maintenance planMaintenance section, total cost, routine work term, temporary work term; number of ramps, etc.
9Daily maintenance plan of traffic engineering and facilitiesMaintenance section, work term, maintenance cost, daily maintenance and database investment; facilities status, etc.
10Maintenance designProject proposalEngineering category and name, route name, starting and ending mileage, area, total mileage, total funding, etc.
11Preliminary design and budgetEngineering name, design company, engineering category, budget cost, reporting time, etc.
12Project bidingEngineering name, route name, starting and ending mileage, affiliated region, area, total mileage, bidding type, contract, bidding control prices, etc.
13Construction drawing and budgetEngineering name, design department, budget cost, reporting time, etc.
14Maintenance executionContract managementContract name and type, contract amount, company name of part A and B, commencement and termination date, signing date, etc.
15Execution informationConstruction company, start time, complete time, curing technology, worker, material, mechanical equipment, concrete strength, markings width, etc.
16Maintenance supervisionRoute name, starting and ending mileage, complete date and time, disaster category, disaster type, cost, position, acceptance time, management department; traffic condition, technical grade, etc.
17Maintenance assessmentTerm name, supervision company, assessment category, assessment grade and level, assessment time and personnel, etc.
Then, data of the highway administration system with five subscanarios are given in Table A2; also, refer to [64].
Table A2. Provided and required data of the practical highway administration system.
No.ScenarioSub-ScenarioProvided and Required Data
1Abnormal indivisible load transportAdministration permitCarrier information, driving time, driving route, vehicle information, goods information, vehicle escort information, permit certificate of vehicles, etc.
2Driving behavior supervisionInspection time and position, practical condition of goods; ETC gantry information, satellite positioning of vehicle, operation status, traffic flow information, etc.
3 Overload transportationInspection station monitoringStation ID, lane ID, inspection time, vehicle registration plate and type, number of axles, gross vehicle weight, vehicle speed, over-limits weight, etc.
4Overload caseAdministration information, law enforcement officials, violation place, fine; over-limit weight, permit certificate of vehicles, vehicle information, etc.
5PatrolBuilding and structure control zonePatrol time, route and officials, road property status, construction condition; meteorological information, etc.

References

  1. Asset Management for the Roads Sector; Technical Report; Organisation for Economic Co-Operation and Development: Paris, France, 2001.
  2. Ministry of Transport of the People’s Republic of China. 2024. Available online: https://xxgk.mot.gov.cn/2020/jigou/zhghs/202406/t20240614_4142419.html (accessed on 18 June 2024). (In Chinese)
  3. United Nations. Sustainable Transport, Sustainable Development: Interagency Report| Second Global Sustainable Transport Conference; United Nations Publications: Beijing, China, 2021. [Google Scholar]
  4. The State Council Information Office of the People’s Republic of China. Sustainable Development of Transport in China. 2020. Available online: http://english.scio.gov.cn/whitepapers/2020-12/22/content_77040131.htm (accessed on 22 December 2020).
  5. Report on Sustainable Transport in China; Technical Report; China Academy of Transportation Sciences: Beijing, China, 2021.
  6. Macioszek, E.; Granà, A.; Fernandes, P.; Coelho, M.C. New Perspectives and Challenges in Traffic and Transportation Engineering Supporting Energy Saving in Smart Cities—A Multidisciplinary Approach to a Global Problem. Energies 2022, 15, 4191. [Google Scholar] [CrossRef]
  7. Loshin, D. Master Data Management; Morgan Kaufmann: Burlington, MA, USA, 2010. [Google Scholar]
  8. The Institute of Asset Management. Asset Management—An Anatomy; Technical Report; The Institute of Asset Management: Bristol, UK, 2004. [Google Scholar]
  9. World Road Association. Road Asset Management Manual; Technical Report; World Road Association: Paris, France, 2022. [Google Scholar]
  10. Golobal Forum on Maintenance & Asset Management. The Maintenance Framework; Technical Report; Golobal Forum on Maintenance & Asset Management: Toronto, ON, Canada, 2021. [Google Scholar]
  11. Aminifar, F.; Abedini, M.; Amraee, T.; Jafarian, P.; Samimi, M.H.; Shahidehpour, M. A review of power system protection and asset management with machine learning techniques. Energy Syst. 2021, 13, 855–892. [Google Scholar] [CrossRef]
  12. DL/T 1868-2018; Specification for Electric Power Life Cycle Asset Management System. National Energy Administration: Beijing, China, 2018. (In Chinese)
  13. International Union of Railways. UIC Railway Application Guide: Practical implementation of Asset Management Through ISO 55001; Technical Report; International Union of Railways: Paris, France, 2016. [Google Scholar]
  14. ISO 55001:2024; Asset Management—Asset Management System— Requirements. International Organization for Standardization: Geneva, Switzerland, 2024.
  15. ISO 19650-1:2018; Organization and Digitization of Information About Buildings and Civil Engineering Works, Including Building Information Modelling (BIM)—Information Management Using Building Information Modelling Part 1: Concepts and Principles. International Organization for Standardization: Geneva, Switzerland, 2018.
  16. GB/T 33173-2016; Asset Management—Asset Management System— Requirements. General Administration of Quality Supervision, Inspection and Quarantine of the People’s Republic of China, Standardization Administration of the People’s Republic of China: Beijing, China, 2016. (In Chinese)
  17. Abu-Samra, S.; Ahmed, M.; Amador, L. Asset management framework for integrated municipal infrastructure. J. Infrastruct. Syst. 2020, 26, 04020039. [Google Scholar] [CrossRef]
  18. Cruz, C.O.; Sarmento, J.M. Digitalization in road projects: Toward a more integrated mobility supply. In A Modern Guide to the Digitalization of Infrastructure; Edward Elgar Publishing: Cheltenham, UK, 2021; p. 92. [Google Scholar]
  19. Petchrompo, S.; Parlikad, A.K. A review of asset management literature on multi-asset systems. Reliab. Eng. Syst. Saf. 2019, 181, 181–201. [Google Scholar] [CrossRef]
  20. U.S. Department of Transportation Federal Highway Administration. Transportation Asset Management Guide; U.S. Department of Transportation Federal Highway Administration: Washington, DC, USA, 2021.
  21. O’Brien, W.J.; Sankaran, B.; Leite, F.L.; Khwaja, N.; Palma, I.D.S.; Goodrum, P.; Molenaar, K.; Nevett, G.; Johnson, J. NCHRP Report 831: Civil Integrated Management (CIM) for Departments of Transportation, Volume 1: Guidebook; The National Academies Press: Washington, DC, USA, 2016. [Google Scholar]
  22. Hanski, J.; Ojanen, V. Sustainability in strategic asset management frameworks: A systematic literature review. Int. J. Strateg. Eng. Asset Manag. 2020, 3, 263–294. [Google Scholar] [CrossRef]
  23. Alshboul, O.; Shehadeh, A.; Hamedat, O. Development of integrated asset management model for highway facilities based on risk evaluation. Int. J. Constr. Manag. 2023, 23, 1355–1364. [Google Scholar] [CrossRef]
  24. Adey, B.T.; Burkhalter, M.; Martani, C. Defining road service to facilitate road infrastructure asset management. Infrastruct. Asset Manag. 2019, 7, 240–255. [Google Scholar] [CrossRef]
  25. Chen, L.; Bai, Q. Optimization in decision making in infrastructure asset management: A review. Appl. Sci. 2019, 9, 1380. [Google Scholar] [CrossRef]
  26. Gomes Correia, M.; Ferreira, A. Road asset management and the vehicles of the future: An overview, opportunities, and challenges. Int. J. Intell. Transp. Syst. Res. 2023, 21, 376–393. [Google Scholar] [CrossRef]
  27. Srinivasan, R.; Parlikad, A.K. An approach to value-based infrastructure asset management. In Value Based and Intelligent Asset Management: Mastering the Asset Management Transformation in Industrial Plants and Infrastructures; Springer: Cham, Switzerland, 2020; pp. 123–138. [Google Scholar]
  28. Asres, E.; Ghebrab, T.; Ekwaro-Osire, S. Framework for design of sustainable flexible pavement. Infrastructures 2021, 7, 6. [Google Scholar] [CrossRef]
  29. Hakimi, O.; Liu, H.; Abudayyeh, O.; Houshyar, A.; Almatared, M.; Alhawiti, A. Data fusion for smart civil infrastructure management: A conceptual digital twin framework. Buildings 2023, 13, 2725. [Google Scholar] [CrossRef]
  30. Jian-wei, W.; Chao, G.; Shi, D.; Sheng, X.; Chang-wei, Y.; Chi, Z.; Ze-bin, H.; Shan-shan, B.; Qing, C.; Yue, W. Current status and future prospects of existing research on digitalization of highway infrastructure. China J. Highw. Transp. 2020, 33, 101. (In Chinese) [Google Scholar]
  31. Peraka, N.S.P.; Biligiri, K.P. Pavement asset management systems and technologies: A review. Autom. Constr. 2020, 119, 103336. [Google Scholar] [CrossRef]
  32. Adey, B.T. A road infrastructure asset management process: Gains in efficiency and effectiveness. Infrastruct. Asset Manag. 2018, 6, 2–14. [Google Scholar] [CrossRef]
  33. Tilson, D.; Lyytinen, K.; Sørensen, C. Research commentary—Digital infrastructures: The missing IS research agenda. Inf. Syst. Res. 2010, 21, 748–759. [Google Scholar] [CrossRef]
  34. Goger, G.; Bisenberger, T. Digitalization in infrastructure construction—Developments in construction operations. Geomech. Tunn. 2020, 13, 165–177. [Google Scholar] [CrossRef]
  35. Zhang, N.; Ye, J.; Zhong, Y.; Chen, Z. Digital Transformation in the Chinese Construction Industry: Status, Barriers, and Impact. Buildings 2023, 13, 1092. [Google Scholar] [CrossRef]
  36. Kudryavtseva, V.; Vasileva, N. Digitalization as the basis for the construction industry development. In Proceedings of the IOP Conference Series: Earth and Environmental Science; IOP Publishing: Bristol, UK, 2021; Volume 751, p. 012100. [Google Scholar]
  37. Pernestål, A.; Engholm, A.; Bemler, M.; Gidofalvi, G. How will digitalization change road freight transport? Scenarios tested in Sweden. Sustainability 2020, 13, 304. [Google Scholar] [CrossRef]
  38. Ma, R.; Lin, B. Digital infrastructure construction drives green economic transformation: Evidence from Chinese cities. Humanit. Soc. Sci. Commun. 2023, 10, 1–10. [Google Scholar] [CrossRef]
  39. Ugarelli, R.; Sægrov, S. Infrastructure asset management: Historic and future perspective for tools, risk assessment, and digitalization for competence building. Water 2022, 14, 1236. [Google Scholar] [CrossRef]
  40. Sussan, F.; Acs, Z.J. The digital entrepreneurial ecosystem. Small Bus. Econ. 2017, 49, 55–73. [Google Scholar] [CrossRef]
  41. Lafioune, N.; Poirier, E.A.; St-Jacques, M. Managing urban infrastructure assets in the digital era: Challenges of municipal digital transformation. Digit. Transform. Soc. 2023, 3, 3–22. [Google Scholar] [CrossRef]
  42. Transportation Research Board and National Academies of Sciences, Engineering, and Medicine. NCHRP Report 632: An Asset-Management Framework for the Interstate Highway System; The National Academies Press: Washington, DC, USA, 2009. [Google Scholar] [CrossRef]
  43. Piryonesi, S.M.; El-Diraby, T.E. Role of data analytics in infrastructure asset management: Overcoming data size and quality problems. J. Transp. Eng. Part B Pavements 2020, 146, 04020022. [Google Scholar] [CrossRef]
  44. Gao, C.; Wang, J.; Dong, S.; Liu, Z.; Cui, Z.; Ma, N.; Zhao, X. Application of Digital Twins and Building Information Modeling in the Digitization of Transportation: A Bibliometric Review. Appl. Sci. 2022, 12, 11203. [Google Scholar] [CrossRef]
  45. Berson, A.; Dubov, L. Master Data Management and Data Governance; McGraw Hill: New York, NY, USA, 2010. [Google Scholar]
  46. Talburt, J.R.; Zhou, Y. Entity Information Life Cycle for Big Data: Master Data Management and Information Integration; Morgan Kaufmann: Burlington, MA, USA, 2015. [Google Scholar]
  47. Allen, M.; Cervo, D. Multi-Domain Master Data Management: Advanced MDM and Data Governance in Practice, 1st ed.; Morgan Kaufmann Publishers Inc.: San Francisco, CA, USA, 2015. [Google Scholar]
  48. IBM. What Is Master Data Management (MDM)? 2024. Available online: https://www.ibm.com/think/topics/master-data-management (accessed on 19 June 2024).
  49. Birdsall, J. Best Practices for Infrastructure Digitalization. 2021. Available online: https://www.irf.global/parsons-best-practices-for-infrastructure-digitalization/#:~:text=The%20digitalization%20of%20infrastructure%20refers%20to%20the%20process,long-term%20sustainability%20and%20minimize%20its%20total%20life-cycle%20cost (accessed on 20 August 2021).
  50. Li, H.; Gao, J.; Li, W.; Huang, Y.; Sheng, Y. Investigation and Analysis of Intelligent Application Scenarios Requirements for Highway Electromechanical Systems. In Proceedings of the 2025 2nd International Conference on Urban Construction and Transportation, Changchun, China, 7–9 March 2025. [Google Scholar]
  51. Lin, L.; Jierui, Z.; Jian, G.; Yuqi, G.; Hengyu, L.; Sheng, Y. Exploration of digital maintenance for highway electromechanical equipment based on digital twin. In Proceedings of the Ninth International Conference on Electromechanical Control Technology and Transportation (ICECTT 2024), Guilin, China, 24–26 May 2024; SPIE: San Francisco, CA, USA, 2024; Volume 13251, pp. 533–538. [Google Scholar]
  52. Lefler, N.; Zhou, Y.; Carter, D.; McGee, H.; Harkey, D.; Council, F. Model Inventory of Roadway Elements MIRE 2.0; Technical Report; U.S. Department of Transportation Federal Highway Administration: Washington, DC, USA, 2017.
  53. JT/T 1020-2016; Transportation Information System—Data Dictionary Specification. Ministry of Transport of the People’s Republic of China: Beijing, China, 2016. (In Chinese)
  54. GB/T 20606-2006; Intelligent Transport Systems—Requirements for Data Dictionaries. General Administration of Quality Supervision, Inspection and Quarantine of the People’s Republic of China, Standardization Administration of the People’s Republic of China: Beijing, China, 2006. (In Chinese)
  55. ISO 8000-100:2016; Data Quality—Part 100: Master Data: Exchange of Characteristic Data: Overview. International Organization for Standardization: Geneva, Switzerland, 2016.
  56. GB/T 36344-2018; Information Technology—Evaluation Indicators for Data Quality. State Administration for Market Regulation, Standardization Administration of the People’s Republic of China: Beijing, China, 2006. (In Chinese)
  57. ISO 14296:2016; Intelligent Transport Systems Extension of Map Database Specifications for Applications of Cooperative ITS. International Organization for Standardization: Geneva, Switzerland, 2016.
  58. JTG/T 2422-2021; Standard for Application of Building Information Modeling in Highway Engineering Construction. Ministry of Transport of the People’s Republic of China: Beijing, China, 2021. (In Chinese)
  59. JT/T 697.2-2014; Basic Data Element of Transportation Information-Part 2: Basic Data Element of Highway Information. Ministry of Transport of the People’s Republic of China: Beijing, China, 2014. (In Chinese)
  60. U.S. Department of Transportation, Federal Highway Administration. Federal Highway Administration—An Overview for Our Stakeholders; Technical Report; U.S. Department of Transportation, Federal Highway Administration: Washington, DC, USA, 2023.
  61. JTG B01-2014 (E); Technical Standards for Highway Engineering. Ministry of Transport of the People’s Republic of China: Beijing, China, 2017.
  62. JTG 5210-2018 (EN); Highway Performance Assessment Standard. Ministry of Transport of the People’s Republic of China: Beijing, China, 2018.
  63. Huang, Y.; Cao, J.; Zhu, J.; Zhao, H.; Hu, M.; Yin, S. Research on Infrastructure Data Dictionary for Highway Asset Management. In Proceedings of the 2023 3rd International Conference on Big Data, Artificial Intelligence and Risk Management, Chengdu, China, 24–26 November 2023; pp. 903–908. [Google Scholar]
  64. Huang, Y.; Zhou, S.; Li, W.; Guo, J.; Li, H.; Shi, Y.; Yin, S. The Life-cycle Digitalization Assessment of Road Infrastructure Data in Asset Management. In Proceedings of the 24th COTA International Conference of Transportation Professionals, Shenzhen, China, 23–26 July 2024. [Google Scholar]
  65. JTG 5110-2023; Technical Standards for Highway Maintenance. Ministry of Transport of the People’s Republic of China: Beijing, China, 2023. (In Chinese)
  66. Highways Department, The Government of the Hong Kong Special Administrative Region. Road Inspection Manual (RIM); Technical Report; Highways Department The Government of the Hong Kong Special Administrative Region: Hong Kong, China, 2016.
  67. Zachman, J.A. Business systems planning and business information control study: A comparison. IBM Syst. J. 1982, 21, 31–53. [Google Scholar] [CrossRef]
  68. IBM Corporation. Business Systems Planning: Information Systems Planning Guide; IBM: Armonk, NY, USA, 1978. [Google Scholar]
  69. Johnson, A.; Heaton, J.; Yule, S.; Luke, S.; Pocock, D.; Parlikad, A.K.; Schooling, J. Informing the information requirements of a digital twin: A rail industry case study. Proc. Inst. Civ. Eng.-Smart Infrastruct. Constr. 2021, 174, 33–45. [Google Scholar] [CrossRef]
  70. Wei, X.; Wang, Z.; Yang, S. An Automatic Generation and Verification Method of Software Requirements Specification. Electronics 2023, 12, 2734. [Google Scholar] [CrossRef]
  71. Uzhakova, N.; Fischer, S. Data-Driven Enterprise Architecture for Pharmaceutical R&D. Digital 2024, 4, 333–371. [Google Scholar] [CrossRef]
  72. Mueller, B.; Urbach, N. Understanding strategy assessment in IS management. Inf. Syst. e-Bus. Manag. 2021, 19, 1245–1273. [Google Scholar] [CrossRef]
Figure 1. Network visualization of requirements for road asset management.
Sustainability 17 00907 g001
Figure 2. The process of building the framework of infrastructure digitalization.
Sustainability 17 00907 g002
Figure 3. The framework of infrastructure digitalization.
Sustainability 17 00907 g003
Figure 4. The classification of road infrastructure.
Sustainability 17 00907 g004
Figure 5. Infrastructure data storage on different scenarios.
Sustainability 17 00907 g005
Figure 6. Data integration across four categories.
Sustainability 17 00907 g006
Figure 7. An example of dataflow diagram of the condition inspection of sub-scenarios.
Sustainability 17 00907 g007
Figure 8. An example of dataflow diagram of life-cycle scenarios.
Sustainability 17 00907 g008
Figure 9. An example of the data–process matrix of life-cycle scenarios.
Sustainability 17 00907 g009
Figure 10. An example of the correlation matrix between process data and infrastructure.
Sustainability 17 00907 g010
Figure 11. Relationship model of infrastructure data.
Sustainability 17 00907 g011
Figure 12. The data–process matrix for condition inspection.
Sustainability 17 00907 g012
Figure 13. Data–process matrix of maintenance and highway administration.
Sustainability 17 00907 g013
Figure 14. Correlation matrix between process data of maintenance and highway administration and infrastructure data.
Sustainability 17 00907 g014
Table 1. Comparison of some related studies.
PublicationAreaObjectiveFrameworkData Acquisition
[8]GeneralImprove organizations’ asset management capabilities10-box capabilities modelConcept of life-cycle delivery
[10]GeneralMaintenance framework of physical assets with the entire life-cycleMaintenance frameworkConcept of asset data and information
[28]RoadQuantify the lifetime sustainability performance of flexible pavements on design phaseFlexible pavement framework of design/
[42]HighwayManage interstate highway system investmentsAsset management framework for investment analysisData inventory
This paperHighwayLife-cycle data interoperationLife-cycle asset management frameworkData integration method with master data identification and data element determination
Table 2. The key challenges of road asset management.
No.Key RequirementOccurrencesTotal Link Strength
Cluster 1 (red): Inspection and optimization13.919.3
1Genetic algorithms716
2Integration78
3Maintenance and inspection2932
4Optimization2435
5Reliability1316
6Selection717
7Simulation1011
Cluster 2 (green): Performance and strategy11.813.5
1Behavior611
2Competition610
3Efficiency910
4Performance2723
5Policy66
6Strategy1721
Cluster 3 (blue): Model and information1818.25
1BIM63
2Information810
3Machine learning103
4Model4857
Cluster 4 (yellow): Risk and sustainability13.318
1Resilience1014
2Risk2029
3Sustainability1311
4Vulnerability1018
Cluster 5 (purple): Investment and technology9.711
1Internet63
2Investment1518
3Technology812
Table 3. Digital application scenarios and importance degree from survey questionnaires.
No.ScenariosDegree
Category 1: Archives and assets4.33 (average)
1Life-cycle digital archives4.33
2Intelligent spare part management4.35
3Asset value assessment4.3
Category 2: Modeling and simulation4.29 (average)
4Reliable digital twin display4.26
5Spatial association visual display4.4
6Maintenance decision-making simulation4.27
7Data modular access and conversion from construction to maintenance4.25
8BIM from construction to maintenance4.29
Category 3: Aided decision-making4.31 (average)
9Aided planning and budget allocation of operation and maintenance4.24
10Implementation tracking and post-evaluation of operation and maintenance4.26
11Operation and maintenance assistance with fault knowledge base4.38
12Layout with forward design assistance4.3
13Data statistics and mining analysis4.36
Category 4: Auxiliary maintenance4.42 (average)
14Data acquisition via wireless communication of handheld terminal and infrastructure4.38
15Autonomous control and remote operations4.47
16Remote inspection and robotic patrolling4.31
17Real-time monitoring of operation status4.47
18Impact analysis and fault deduction4.44
19Failure precise positioning and cause analysis4.49
20Autonomous emergency disposal and collaboration4.41
Table 4. An example of life-cycle highway application scenarios.
CategoryScenarioSub-Scenario
Design and ConstructionInvestigation and surveyTopographical analysis, soil testing, alignment, grading, etc.
DesignPreliminary design, construction drawing design, design delivery, etc.
Testing and inspectionConcrete testing, pavement testing, electrical and mechanical engineering testing, etc.
ConstructionSubgrade compaction, surface pavement, construction monitoring and control, etc.
MaintenanceCondition inspectionDaily, routine, periodic, special, and emergency inspections of structures, traffic safety devices, etc.
Maintenance decisionAutomatic generation of maintenance plan, project-level decision, network-level decision, etc.
Maintenance designStrengthening design of bridge, maintenance design of asphalt pavement, etc.
Maintenance executionRehabilitative, preventive, special maintenance engineering, etc.
OperationTraffic monitoringNetwork operation monitoring, geological disaster monitoring, structural safety monitoring, etc.
Trip serviceTraffic information service, tunnel operation service, service area operation, etc.
Emergency aidTraffic emergency disposal, equipment and material reserve, etc.
Vehicle–road coordinationTraffic risk warning, traffic incident control service, safe driving behavior reminder, etc.
TollingMobile payment of toll road, free-flow electronic toll collection on expressway ramp, etc.
Highway administrationAbnormal indivisible load transportAdministration permit, driving behavior supervision, vehicle escort, etc.
Overload transportationInspection station monitoring, command and dispatch, analysis and evaluation, etc.
PatrolBuilding and structure control zone, safety protection zone, etc.
Table 5. Dataflow from start to end points.
No.DataflowStart PointEnd PointData Description
1Basic information/Daily and routine inspection, periodic inspection, special inspection, monitoring scheme, emergency inspectionStatic infrastructure data, historical records of inspection and maintenance engineering, etc.
2Daily and routine inspection resultDaily and routine inspectionField diagnosisInfrastructure performance, abnormal condition, etc.
3Daily and routine inspection recordsField diagnosisSpecial inspectionInfrastructure performance, abnormal condition, field diagnostic conclusion, special inspection recommendation, maintenance measure, etc.
4Periodic inspection recordsPeriodic inspectionSpecial inspectionBasic situation, inspection result, condition grade, main disease analysis, maintenance measure, etc.
5Periodic inspection resultPeriodic inspectionTechnical conditions evaluationStatic infrastructure data, infrastructure performance, etc.
6Item and requirementMonitoring schemeAutomated monitoringSubgrade deformation, bridge structure, tunnel structure, tunnel environment, geological disasters, meteorological disasters, etc.
7Early-warning informationAutomated monitoringSpecial inspectionStructural monitoring, geological hazard monitoring, meteorological monitoring, environmental monitoring, etc.
8Special inspection resultSpecial inspectionSpecial performance assessmentCarrying capacity, anti-disaster capacity, traffic capacity, operation safety, material monitoring, etc.
9Special inspection reportsSpecial performance assessmentEmergency inspection reportBasic situation, inspection result, condition grade, main disease analysis, maintenance measure, etc.
10Emergency event/Emergency inspectionDisaster report information; road, terrain, and geological environment information; monitoring and forecasting information of daily meteorological and geological disaster, etc.
11Infrastructure damage conditionEmergency inspectionEmergency repair plansScope, type, causes of damage, secondary disasters and potential safety hazards, traffic condition of road, etc.
12Emergency inspection reportEmergency repair plans/Basic situation, disaster situation, risk analysis of secondary disaster, required special performance assessment, emergency repair and operational plans, recommendation of reconstruction projects, etc.
Table 6. Required and provided data of each category.
No.CategoryProvided DataRequired Data
1Design andconstructionRoad and structure design information, line scheme, land acquisition and relocation, project schedule, contract management information, construction monitoring and control, road property data, delivery data of road infrastructure, etc./
2MaintenanceInspection records and reports, road property data, structural monitoring data, condition grade, maintenance plan and execution data, etc.Significant emergency event, traffic interruption, delivery data of road infrastructure, weight detection, etc.
3OperationTraffic flow, abnormal driving behavior and congestion analysis, vehicle identification data, traffic incident, emergency event, emergency resource and plan, toll transaction and audit data, etc.Traffic condition, road and toll station, traffic engineering and facilities, special transportation vehicle monitoring, patrol information, overload case, etc.
4HighwayadministrationCarrier information, certificate of vehicles, weight detection of special transportation vehicle, special transportation vehicle monitoring, patrol information, overload case, administration and law enforcement officials, etc.Traffic interruption, road property data, meteorological information, satellite positioning of vehicle, traffic flow, emergency event, etc.
Table 7. Original data element of “Inspection data”, “ETC data”, “Weight detection of special transportation”, and “Case data”.
Index uProcess DataData Element D u
6Inspection data D 6 , 1 : Inspection time, route ID, route name, inspection starting and ending mileage, weather condition, etc.
D 6 , 2 : Inspection time, inspection position, disease type of structure, number of diseases, disease range, size, cause analysis, process description, treatment advice, inspection personnel, inspection organization, etc.
D 6 , 3 : Inspection time, inspection item, damage position, damage type, whether discontinuity, damaged condition, failures cause, treatment measures, inspection personnel, inspection organization, etc.
D 6 , 4 : Inspection time, lane ID, inspection item, equipment ID, operational status, operating environment, whether satisfy technical requirement, warning message checking, abnormal status description, fault cause, reporting department, inspection personnel, inspection organization, etc.
13ETC data D 13 , 1 : Entrance toll gate, entrance time, exit toll gate, exit time, vehicle license number, carrying capacity, cargo type, vehicle trajectory, toll cost, etc.
18Weight detection of
special transportation
D 18 , 1 : Overload station ID, station name, detection direction, administrative region, mileage of station, longitude and latitude of station, etc.
D 18 , 4 : Weighing equipment ID, lane ID, detected vehicle type, detection time, detected vehicle speed, total weight of cargo, detected number of axles, etc.
19Case data D 19 , 1 : Administrative region, organization of administrative penalty, case type, violation time, violation place, punishment basis, punishment time, punishment penalty, driver name, license number, transport certificate number, cargo source company, etc.
Disclaimer/Publisher’s Note: The statements, opinions and data contained in all publications are solely those of the individual author(s) and contributor(s) and not of MDPI and/or the editor(s). MDPI and/or the editor(s) disclaim responsibility for any injury to people or property resulting from any ideas, methods, instructions or products referred to in the content.

