Article

System Dynamics-Based Integrated Benefit Analysis of Low-Carbon Management Process of Municipal Solid Waste

School of Environmental Science and Engineering, Tianjin University, Tianjin 300350, China
*
Author to whom correspondence should be addressed.
Sustainability 2025, 17(3), 1193; https://doi.org/10.3390/su17031193
Submission received: 26 December 2024 / Revised: 26 January 2025 / Accepted: 29 January 2025 / Published: 1 February 2025

Abstract

:
With rapid economic development, the amount of the municipal solid waste (MSW) generated has increased dramatically. To improve the socio-economic benefits and environmental impacts of the low-carbon management of MSW, it is crucial to identify the drivers of Greenhouse Gas (GHG) emissions from MSW treatment and assess their systematic and comprehensive benefits. The factor decomposition method is one of the most commonly used methods focused on identifying GHG emission-influencing factors, while the system dynamics (SD) method is commonly used to analyze the causal relationships between linear and nonlinear variables in complex dynamic systems. Unlike existing studies that account for and evaluate MSW from a static perspective, this paper innovatively combines the LMDI-SD model to identify and quantify the GHG emission drivers of MSW and evaluate the benefits of decarbonizing the MSW management in China from a comprehensive and systematic perspective. The results show that the dominant factor driving MSW GHG emissions from 2010 to 2022 is the economic development factor, ∆EED, while the intensity of MSW generation ∆EGI and the structure of MSW treatment ∆ETS play a stronger inhibiting role. Based on this, the SD model is constructed to simulate different scenarios, and the analysis shows that increasing the waste separation rate (S3) is the most effective measure to improve the socio-economic benefits and environmental impacts of the system. Compared with the base scenario, the socio-economic benefits and environmental impacts in 2050, for example, are increased by 82.8% and 43.4%, respectively. Improving the utilization rate of landfill gas (S1), reducing the per capita amount of MSW generated (S4) and increasing the incineration rate of MSW (S2) also have significant advantages for the improvement of benefits. Finally, some policy recommendations for the improvement of the comprehensive benefits of low-carbon MSW management systems are proposed to help policymakers make appropriate decisions.

1. Introduction

Global warming caused by carbon-dioxide-based Greenhouse Gas (GHG) emissions has become a common problem faced by mankind, posing a serious threat to the sustainable development of the global community [1,2]. China formally put forward the dual-carbon target of “carbon peak by 2030 and carbon neutrality by 2060” at the 75th United Nations General Assembly, and all provinces and cities in China have accelerated research on GHG accounting and related emission reduction. The disposal of municipal solid waste (MSW) is one of the major sources of GHG emissions and is also recognized as the third largest source of CH4 emissions [3], contributing about 1/4 of global CH4 emissions [4]. According to the China Statistical Yearbook, China’s MSW generation in 2022 will be 244.4 Mt (million tons), an increase of nearly 47.5% compared to the 118.2 Mt of MSW generated in 2000 [5].
The treatment methods for MSW in China are generally divided into sanitary landfills, incineration, and bio-composting [6]. Sanitary landfills have become the preferred method for treating MSW due to the mature technology used in them [7,8]; however, this method has certain drawbacks, which can easily lead to problems such as the shortage of land resources and increasing soil pollution in China. The bio-composting method has problems, such as high investment and a long processing time, which makes it unsuitable for use in China. Incineration has become the main treatment method for MSW in China owing to its advantages of having a small footprint and strong resource capacity [9,10], but the surge in the amount of MSW generated still causes serious pollution in the urban environment and also produces a large amount of GHG during the treatment process, which has brought about a great deal of pressure to achieve GHG emission reduction in our country, resulting in the loss of a certain amount of socio-economic benefits and environmental impacts, and which has also created a conflict between MSW management and the pursuits toward sustainable development. Therefore, to explore the sustainable management mode of MSW, it is necessary to move on from end-to-end management to the concepts of reduction at the source, reuse, and recycling, implementing these with the principles of the circular economy (3R), to minimize the generation of MSW, ensure that emissions are harmless, and realize resource recycling.
First, domestic and international research on the low-carbon management process of MSW has focused on identifying GHG emission drivers, which have been analyzed from the following aspects: MSW generation and physical components [11,12], treatment methods [13,14], management measures [15], the level of urban economic development [16], and the size of the urban population [17]. In addition, because benefit evaluation can provide a more reliable basis for policymakers to choose an appropriate path, domestic and foreign scholars have also focused on benefit studies on the low-carbon management process of MSW, which mainly focuses on the socio-economic benefits and environmental impacts of the management process. Zhao et al. [18] used a life cycle approach to assess the GHG emissions of different scenarios of separate garbage collection and treatment, and compared and analyzed the environmental benefits of the separate waste collection process. De et al. [19] used the life cycle assessment method to evaluate the environmental performance and economic benefits of recyclable material recovery in the Italian MSW management system. Nie et al. [20] used the cost–benefit analysis method, the life cycle assessment method, and the hierarchical analysis method to evaluate the comprehensive benefits of four different waste separation scenarios for the Pudong district of Shanghai. As can be seen from the relevant studies, the existing studies are not clear about the mechanisms driving GHG emission from MSW, and the GHG emission measurement system is mostly static, with a large amount of accounting workload, which may have necessitated these studies being completed in a short time span. In addition, the studies mostly assess the socio-economic benefits and environmental impacts of the different scenarios from a static perspective by using the life-cycle assessment method and the hierarchical analysis method, but lack a long-term dynamic, comprehensive and systematic perspective, which restricts the evaluation of the effects of the low-carbon management process for MSW and the selection of suitable paths for carbon reduction.
In order to solve the problems in the existing research, this paper innovatively adopts the Logarithmic Mean Divisia Index (LMDI) model to identify and quantify the driving factors affecting the GHG emissions from MSW and their degree of influence,, which will help to identify the key variables of the low-carbon management system for MSW, and then provide a more efficient program and measures for the dynamic assessment of the comprehensive benefits of the system. At the same time, dynamic analysis can reflect the change trends in different management measures in terms of the comprehensive benefits; therefore, this paper innovatively adopts the system dynamics (SD) approach to assess the socio-economic and environmental benefits of the process of low-carbon management of MSW from a long-term dynamic, comprehensive and systematic perspective. This paper takes the national MSW as the research object, combines it with the LMDI-SD framework model to conduct a comprehensive dynamic assessment of the benefits of low-carbon management of China’s MSW from a long-term dynamic, comprehensive and systematic perspective, to explore the driving mechanism of GHG emissions from MSW, to assess the degree of impact on socio-economic and environmental benefits, and to make clear the effect of different waste management measures on the process of low-carbon management of waste to provide a more reliable basis for policymakers.
The rest of this paper is organized as follows. Section 2 introduces the research methodology and data sources, including the model framework and scenario setting. Section 3 analyzes the simulation results of GHG emission drivers and benefits. Section 4 discusses policy implications. Section 5 presents the conclusions.

2. Methodology and Data Sources

2.1. The Framework of the LMDI Approach

2.1.1. Methodology of LMDI

The factor decomposition method is divided into two methods: the exponential decomposition method (IDA) and the structural decomposition method (SDA). The LMDI method is an exponential decomposition method which has the advantages of having no residual terms after the decomposition, satisfying factor reversibility, being highly applicable, and being able to deal with the zero-value problem [21]. The basic idea is to regard each factor variable decomposed from the target variable as a continuously distinguishable function of time t, and then discretize time t and decompose it to derive the contribution of each factor variable to the target variable. This method has been widely used to investigate the relevant drivers affecting GHG emissions [22,23,24,25] in various industries, such as iron and steel, cement, transportation, and electricity, as well as to investigate changes in energy consumption [26] and changes in CO2 emission intensity and emission levels [27].

2.1.2. Driving Forces Analysis

This study adopted the LMDI method to reveal the driving force of GHG emissions from MSW in China, which provides a theoretical basis for model construction and scenario analysis. This method is based on five different perspectives: economic, demographic, social, technological, and management. It analyzes five driving factors: economic development effect (ED), population scale effect (PS), generation intensity effect (GI), emission intensity effect (EI), and treatment structure effect (TS). Based on the basic concept of the LMDI method, China’s MSW GHG emissions can be expressed as follows:
E G H G , t = i E i , G H G , t = i E i , G H G , t M i , t × M i , t M t × M t G D P t × G D P t P O P t × P O P t = i E I i , t × T S i , t × G I t × E D t × P S t    
where E G H G , t denotes the GHG emissions of MSW in year t under treatment method i, and the treatment methods only consider landfill, incineration and biochemical treatment in this study; M i , t denotes the amount of MSW treated in year t under treatment method i; M t denotes the total amount of MSW treated in year t; G D P t denotes the Gross Domestic Product (GDP) in year t; and   P O P t denotes the population size in year t.
The cumulative effect of the five drivers on the GHG emissions of the MSW treatment process was calculated using the following equation:
E G H G = E G H G , t E G H G , t 1 = E E I + E T S + E G I + E E D + E P S
E E I = i E i , G H G , t E i , G H G , t 1 l n E i , G H G , t l n E i , G H G , t 1 × l n E I i , t E I i , t 1 E T S = i E i , G H G , t E i , G H G , t 1 l n E i , G H G , t l n E i , G H G , t 1 × l n T S i , t T S i , t 1 E G I = i E i , G H G , t E i , G H G , t 1 l n E i , G H G , t l n E i , G H G , t 1 × l n G I i , t G I i , t 1 E E D = i E i , G H G , t E i , G H G , t 1 l n E i , G H G , t l n E i , G H G , t 1 × l n E D i , t E D i , t 1 E P S = i E i , G H G , t E i , G H G , t 1 l n E i , G H G , t l n E i , G H G , t 1 × l n P S i , t P S i , t 1

2.2. The Framework of the SD Approach

2.2.1. Methodology of SD

In 1960, Forrester created a system dynamics (SD) method to analyze the causal relationships between linear and nonlinear variables in complex systems as well as a method for studying how structure and parameters affect the behavioral patterns of the system [28]. It is an interdisciplinary field that studies the dynamic relationship between the internal structure and behavior of a system, integrating the theories and methods of cybernetics, information theory, and decision theory. It is now widely used in MSW management systems, including the prediction of MSW generation [29,30], and research on the potential of MSW carbon reduction [15,31] and the system behavior of MSW utility services [32].

2.2.2. Model Framework and Construction

Based on the analysis of GHG emission drivers, this study utilized the SD method to predict the socio-economic benefits and environmental impacts of the low-carbon management process of MSW under different scenario settings. Figure 1 shows the composition and description of the socio-economic benefits and environmental impacts of the low-carbon management process of MSW. From the perspective of economic benefits, the first is brought about by the process of recycling MSW, such as the recycling of recyclables like waste plastics, waste paper, etc., or the effective collection and use of landfill gas, power generation by incineration, and biochemical treatment. Second, through the process of MSW reduction, the amount of waste incineration, landfill, and biochemical treatment can be significantly reduced, thereby reducing the corresponding waste transportation, treatment, and disposal costs and saving the land cost of the required new waste treatment facilities. From the perspective of environmental impacts, first, this approach can reduce the final GHG emissions cost of the MSW treatment process; second, it can reduce the health costs caused by dioxin and other harmful gases produced by the incineration process due to their effects on human health; third, it can reduce the cost of groundwater contamination by landfill process; fourth, it can reduce the costs of land resource use, which is beneficial considering that through the process of MSW reduction, the amount of land occupied, including that of surrounding land, cannot be reduced by waste terminal treatment facilities.
Based on this model framework, following the SD theory and modeling methodology, Anylogic software (8.9.0) is used to design the model and construct a stock flow diagram of the MSW benefits assessment system, and the overall system is divided into the MSW generation and GHG emission accounting subsystem, the socio-economic benefits assessment subsystem and the environmental impact assessment subsystem.

MSW Generation and GHG Emission Accounting Subsystem

Figure 2 shows the MSW generation and GHG emission accounting subsystem. In this study, the amount of MSW generated was directly expressed as the product of MSW generation per capita and the permanent population, as shown in Equation (1). At the same time, considering the availability of data and the comprehensive analysis of historical data, per capita consumption expenditure and household size are selected as the key variables affecting annual MSW generation per capita. This relationship is further confirmed by fitting the merger of the three, as in Equation (2). The per capita consumption expenditure is closely related to the per capita disposable income, and the relationship is further confirmed by fitting the merger of the two, as in Equation (3). There is a high correlation between per capita disposable income and GDP per capita, and the relationship is further confirmed by fitting between the two, as in Equation (4). In addition, this study considers the GHG emissions of MSW from landfill, incineration, and biochemical treatment processes, and the recycling of recyclable waste (waste plastics, waste paper, waste metals, waste glass, waste fabrics). Refuse Plastic and Paper Fuel (RPF) used in the industrial sector can be applied as a substitute for fossil fuels, and offset the two values of the MSW treatment processes net GHG emissions in this study, as shown in (5).
Amount   of   MSW   generation = MSW   generation   per   capita Permanent   population
MSW   generation   per   capita = 5.6555 Per   capita   consumption   expenditure +   0.002 Household   size + 0.0037     R 2 = 0.9907
Per   capita   consumption   expenditure = 0.5657 Per   capita   disposable   income + 3533.2       R 2 = 0.9908
Per   capita   disposable   income = 0.5932 GDP   per   capita   + 956.86       R 2 = 0.9953
Annual   GHG   emission = Annual   GHG   emission   from   Inc   + Annual   GHG   emission   from   AD +   Annual   GHG   emission   from   LF +   Annual   GHG   emission   from   Unmanaged   MSW   +   Annual   CO 2   reduction   from   Rec - Glass +   Annual   CO 2   reduction   from   Rec - Fabrics +   Annual   CO 2   reduction   from   Rec - Paper +   Annual   CO 2   reduction   from   RPF +   Annual   CO 2   reduction   from   Rec - Plastic +   Annual   CO 2   reduction   from   Rec - Metal

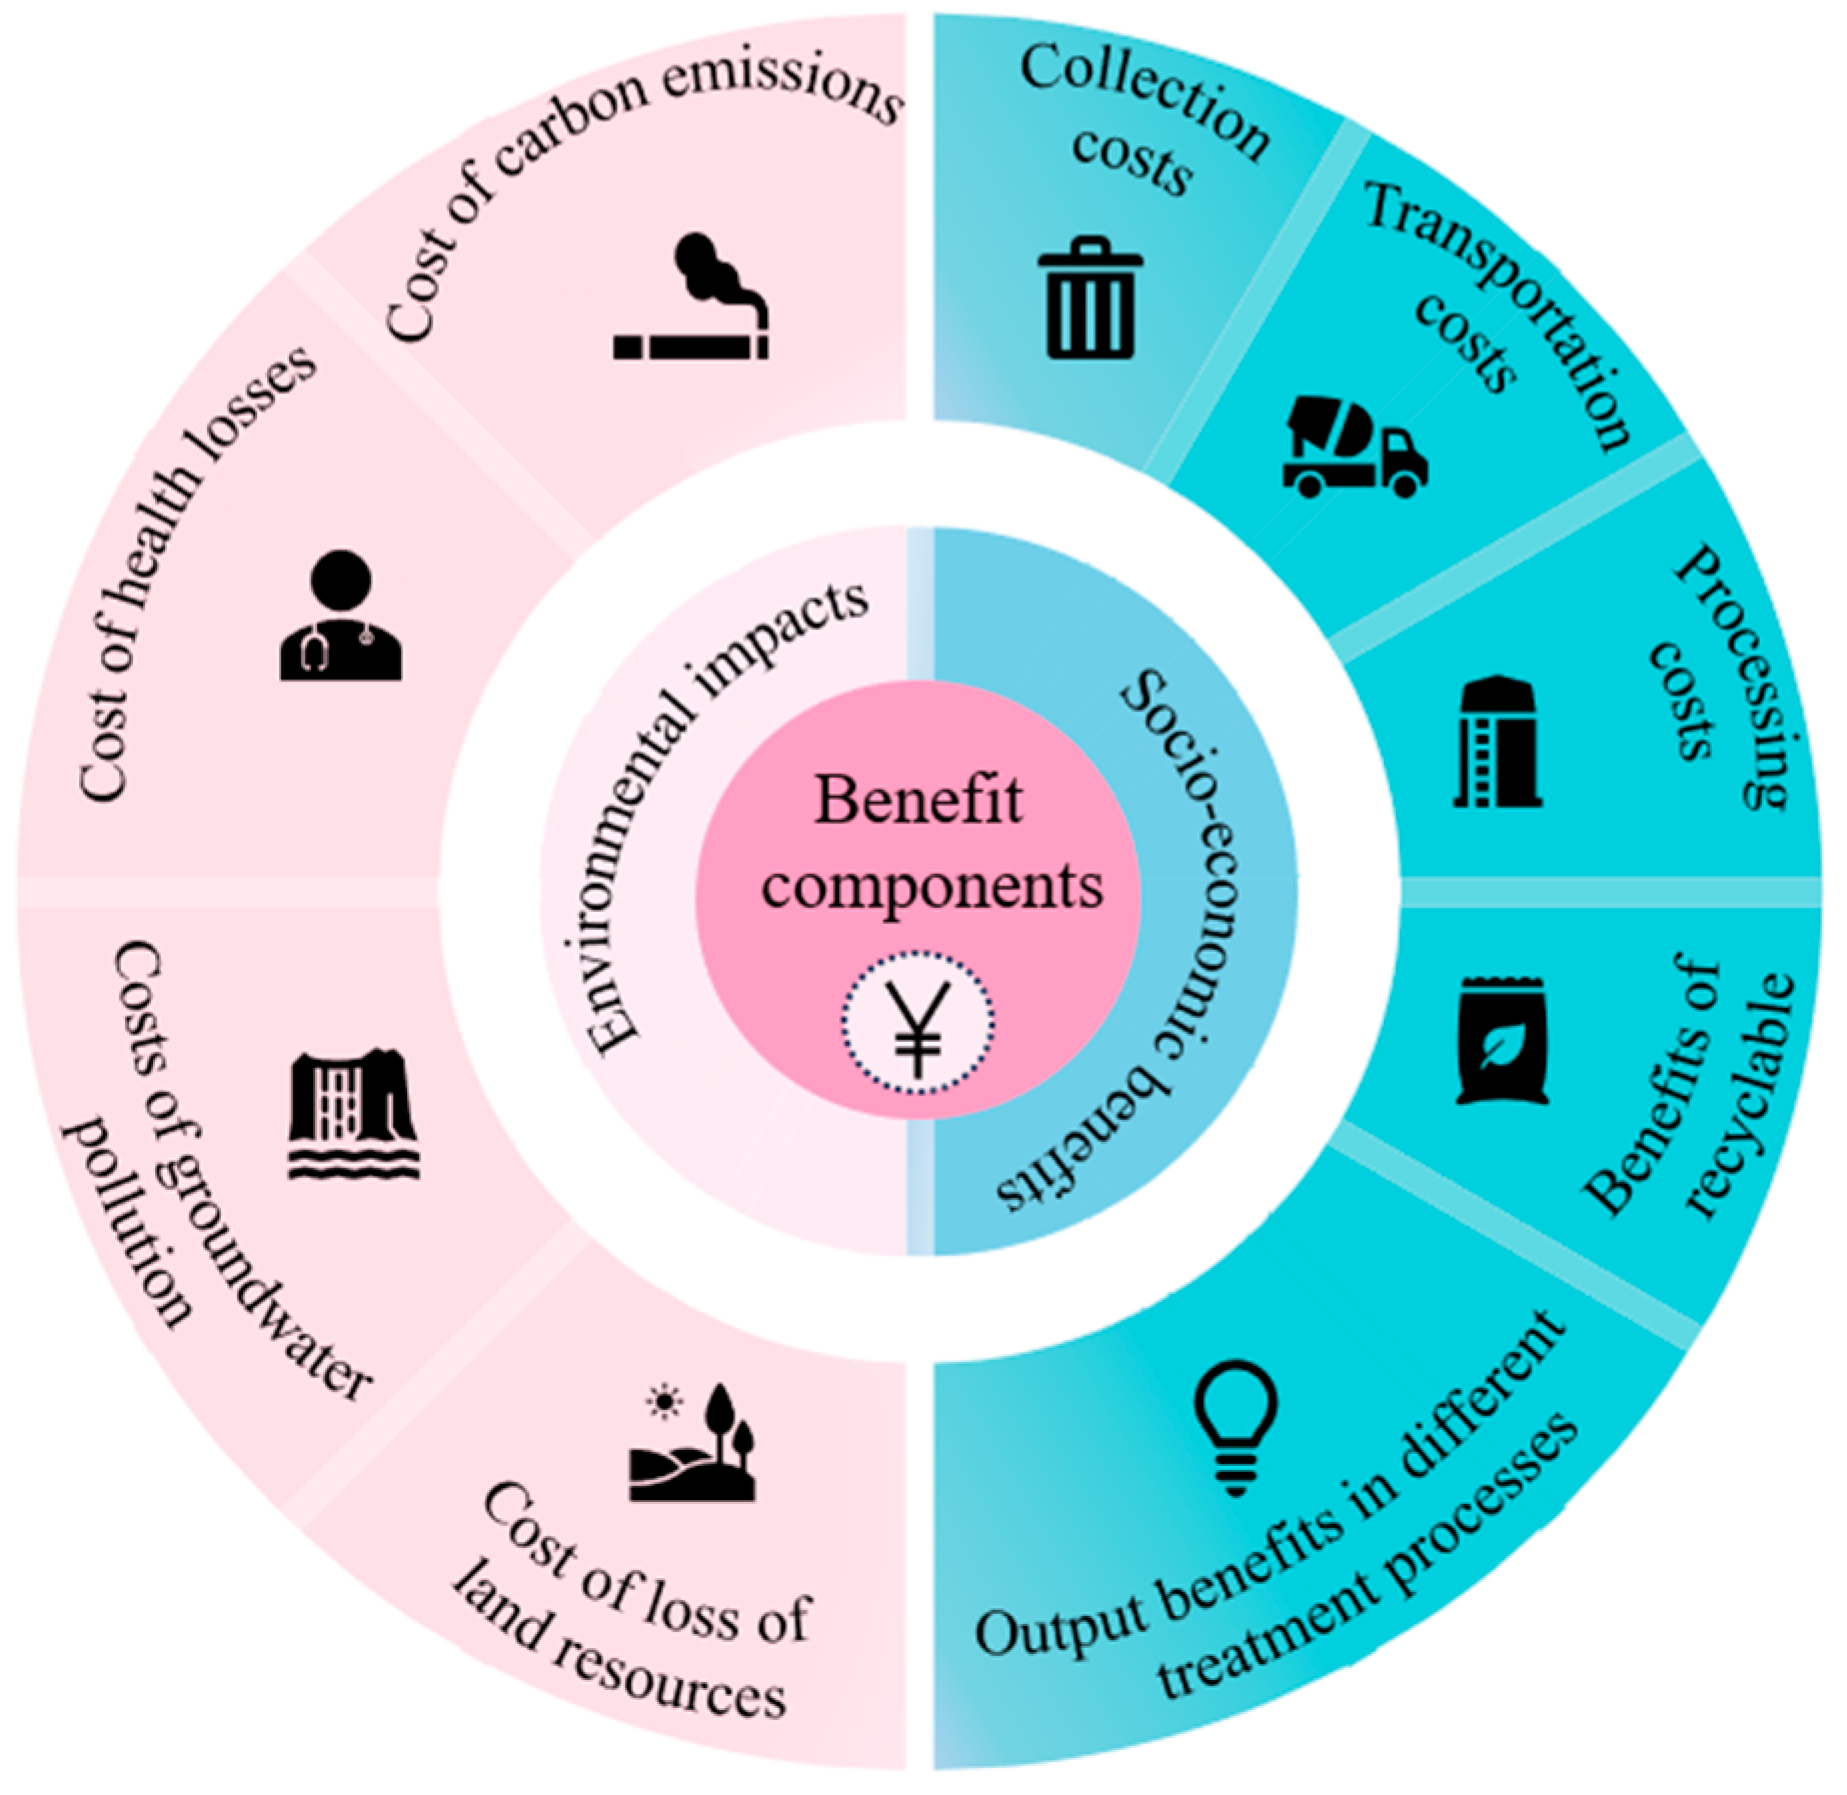
Socio-Economic Benefits Assessment Subsystem

According to the framework of the benefit assessment model in Figure 1, this paper draws on the SD subsystem for assessing the socio-economic benefits of the MSW treatment process, as shown in Figure 3, in which the formula for assessing the socio-economic benefits is shown in (6):
Annual   socioeconomic   Benefits = Annual   socioeconomic   Benefits   of   Inc   waste + Annual   socioeconomic   Benefits   of   AD   waste   +   Annual   socioeconomic   Benefits   of   Recycl - waste +   Annual   socioeconomic   Benefits   of   LF   waste +   Total   cost   of   hazardous   waste

Environmental Impact Assessment Subsystem

According to the framework of the benefit assessment model in Figure 1, this study draws on the SD subsystem of the environmental impact assessment of the MSW treatment process, as shown in Figure 4, in which the formula for the assessment of the environmental impact is shown in (7):
Annual   environmental   impacts = Groundwater   pollution   costs   +   GHG   emission   costs + Health   losses   costs   +   Loss   of   land   resources   costs

2.3. Scenario Setting

Based on the LMDI method, this study identifies five main drivers affecting GHG emissions from MSW: the economic development effect, population scale effect, generation intensity effect, emission intensity effect, and treatment structure effect, based on which six scenarios are set up. The changes in key parameters under the corresponding scenarios are listed in Table 1.
In the base scenario, no measures are taken, that is, there is no waste separation and resource recycling, and the current rate of economic development, population growth, and the structure of MSW are maintained.
Scenario 1 was created to reduce the GHG emission intensity, that is, increase the utilization rate of CH4 produced in the MSW landfill process, with the aim of studying the impact of increasing the utilization rate of CH4 on the efficiency of the MSW treatment process. Xiao et al. [31] pointed out that increasing the utilization rate of CH4 produced in the landfill process not only reduces the total amount of CH4 emissions in the air, but also can be used for power generation to offset some GHG emissions from the local power plant, which has a certain degree of efficiency and can be used for the production of electricity, which has a certain degree of environmental and economic benefits. Therefore, Scenario 1 of this study was designed to increase the utilization rate of CH4 generated from landfills to investigate the impact of reducing the GHG emission intensity on the efficiency of the MSW treatment process.
Scenario 2 was created to optimize the structure of MSW treatment based on the existing situation of MSW treatment and disposal in China. Therefore, this study increased the incineration rate to explore the impact of optimizing the MSW treatment structure on the benefits of MSW treatment processes.
Scenario 3 was created to reduce the MSW generation intensity, aiming to study the impact of increasing the rate of MSW separation on the benefits of the MSW treatment process. Du et al. [33] reported that the proportion of recyclables (waste paper, waste plastics, waste fabrics, waste metals, waste glass) in China’s MSW is about 33%, and that the proportion of high-fossil-carbon-content fractions, such as waste paper and waste plastics, is higher, accounting for about 28.6% and 28.1% of the recyclables, respectively. Therefore, China’s MSW has greater potential for resource recovery and socio-economic benefits. Thus, in Scenario 3, this study set out to improve MSW separation and investigate the impact of reducing the MSW generation intensity on the benefits of the MSW treatment process.
Scenario 4 was created to slow down the rate of economic development, that is, reduce the amount of MSW generated by reducing the amount of per capita MSW generated, with the aim of investigating the impact of this on the benefits of the MSW treatment process.
Scenario 5 was created to slow down the population growth rate, that is, to reduce the amount of MSW generated by controlling the population size, with the aim of studying the impact of this on the benefits of the MSW treatment process.

2.4. Data Sources

The main sources of data in this study were as follows: data on the economy, population, and amount of MSW generation were obtained from the China Environmental Statistics Yearbook (2010–2022) and China Statistical Yearbook (2010–2022) [34]. MSW components and their percentages were obtained from Du et al. [33]. The GHG emission parameters for landfill, incineration, and biochemical treatment processes were obtained from the 2006 IPCC Guidelines for National Greenhouse Gas Inventories [35]. The embodied carbon coefficients for recyclables were obtained from Dong et al. [36] and the Inventory of Carbon and Energy (ICE), established by the University of Bath, UK [37]. The RPF production coefficients and carbon reduction coefficients were obtained from the studies of Dong et al. [36] and Xiao et al. [38]. The cost of health loss per unit of MSW disposed, the unit environmental cost of groundwater management, the unit GHG emission cost, and the land area occupied by the relevant MSW disposal facilities were obtained from previous studies in the relevant literature [39,40,41]. Parameters such as the unit MSW collection cost, transportation cost, and disposal cost were also taken from previous studies in the relevant literature [18].

3. Results

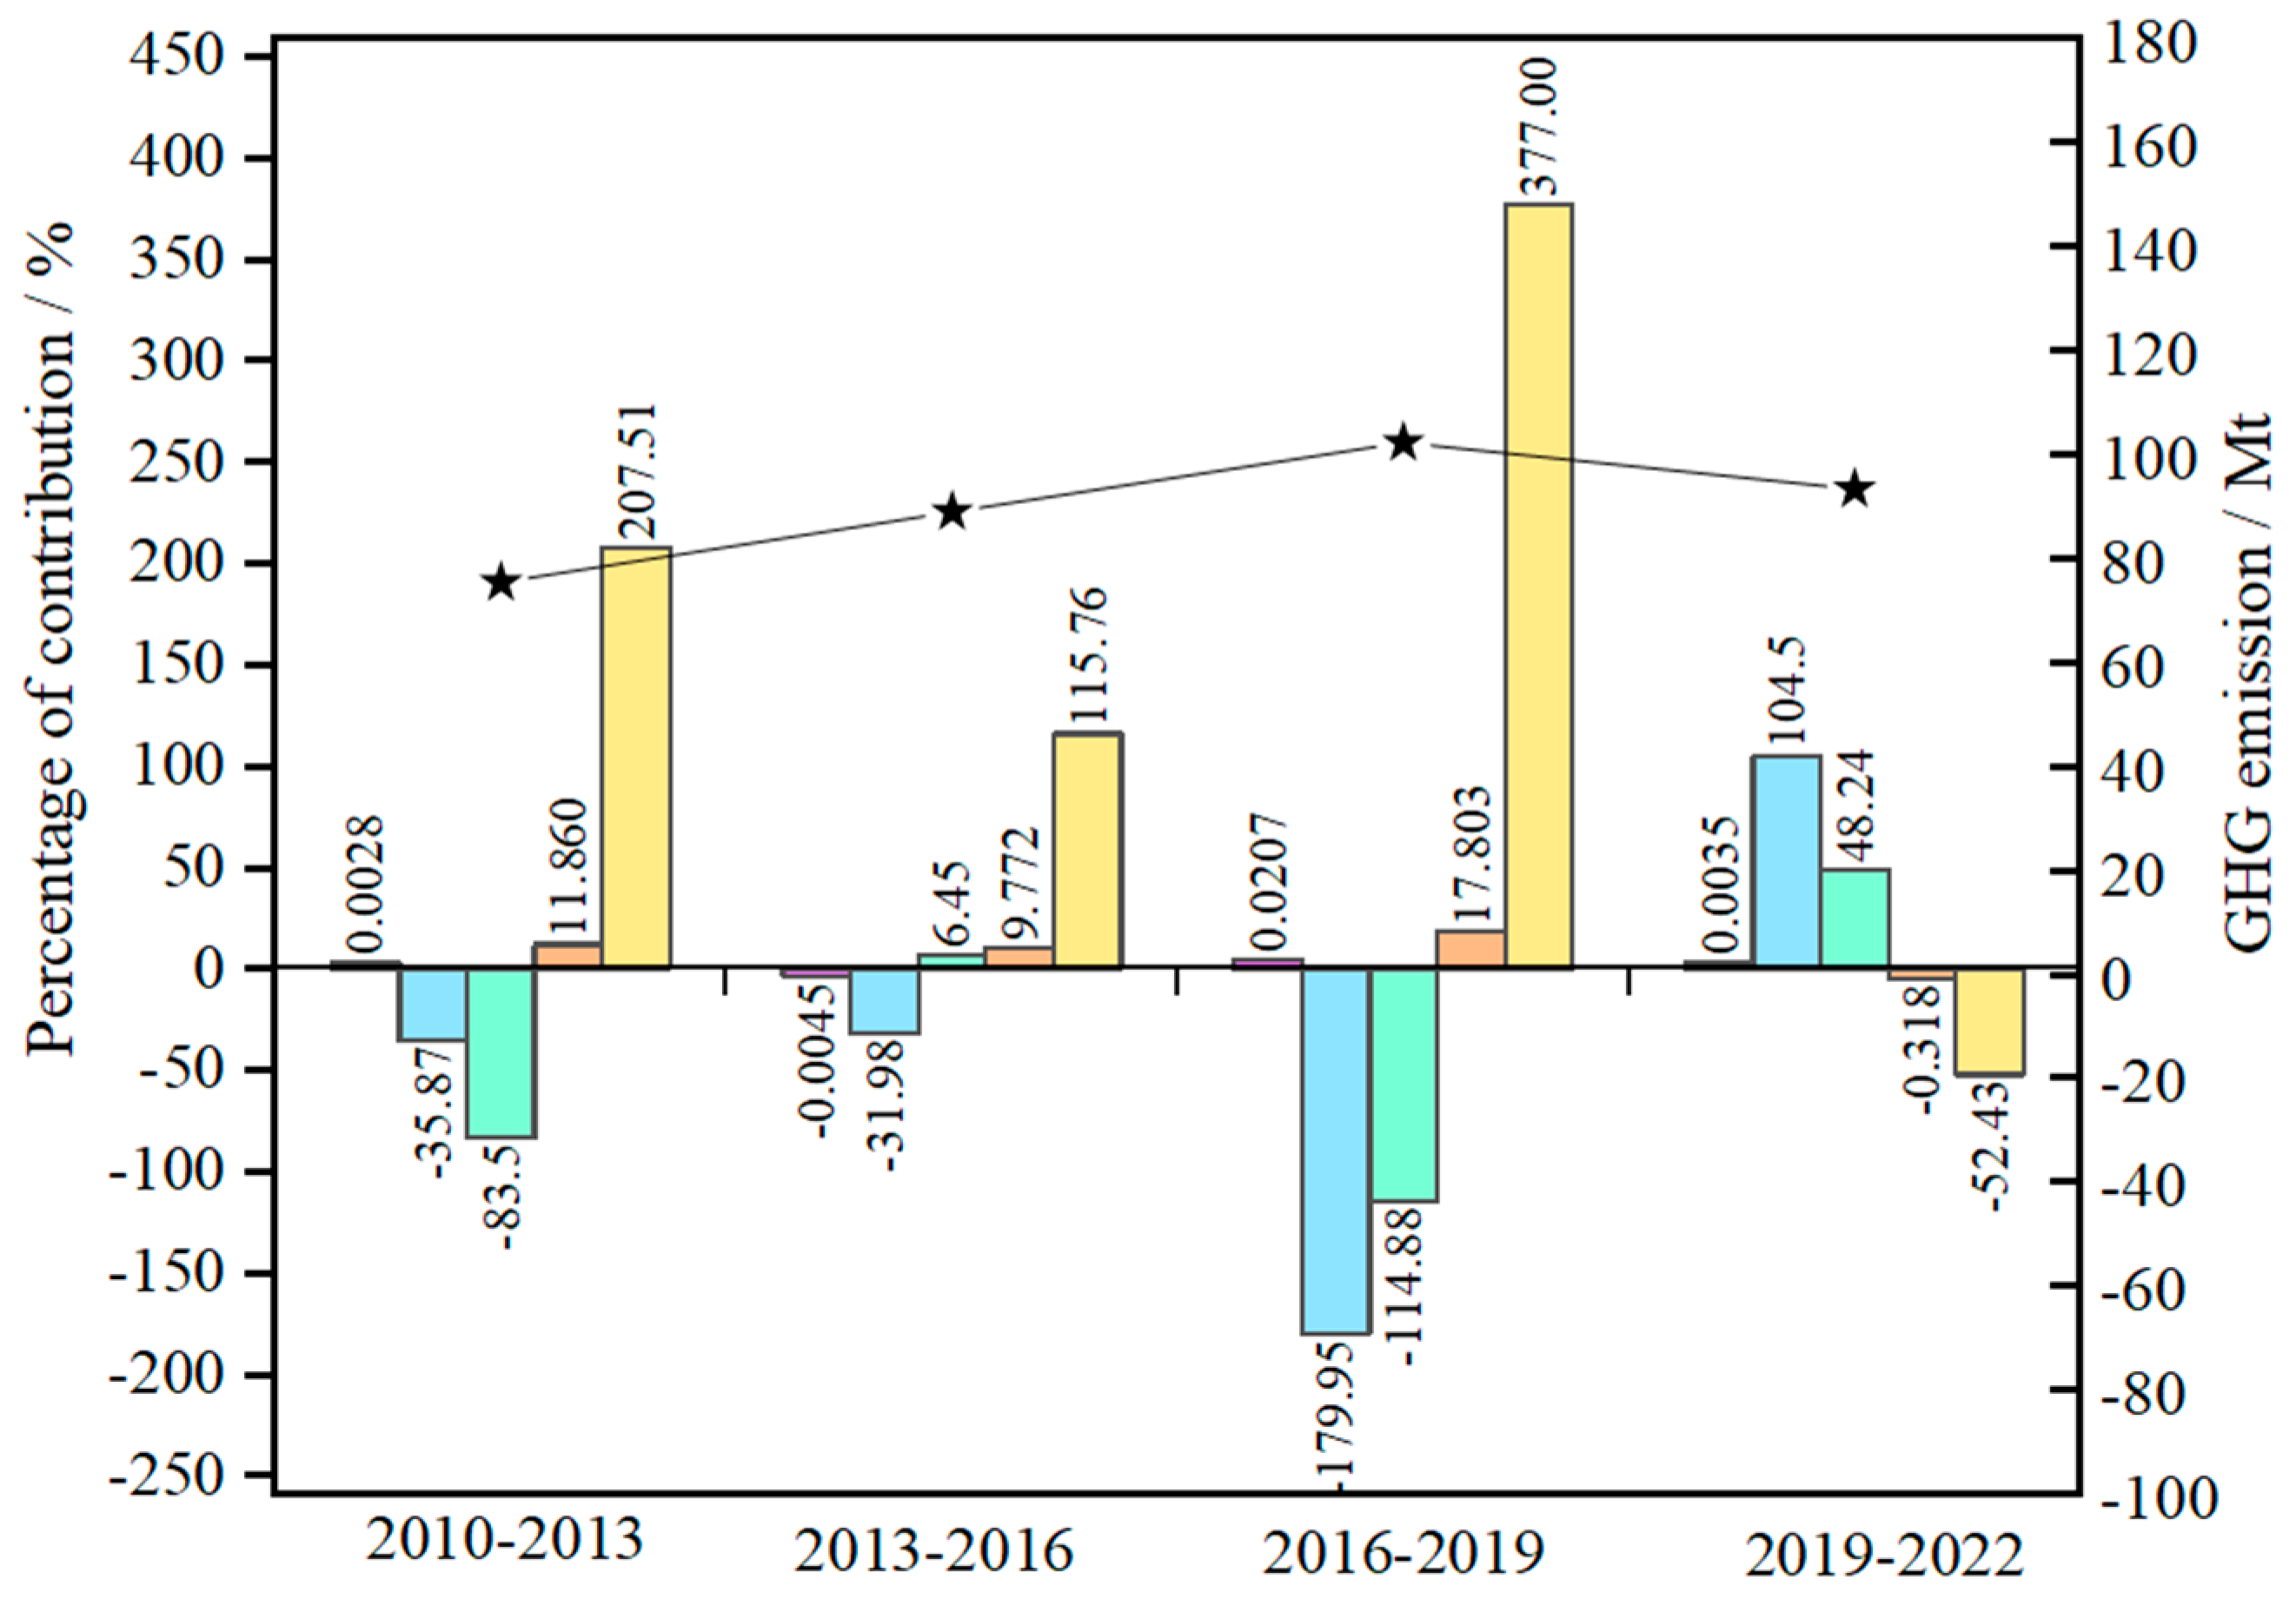
3.1. Identification and Quantification of MSW GHG Emission Drivers

Using the LMDI method in the form of addition to decompose the GHG emissions in the process of MSW treatment from the national level from 2010 to 2022, the period is divided into four time periods, namely 2010–2013, 2013–2016, 2016–2019 and 2019–2022, and the change value and contribution rate of five drivers are obtained. Taking the change trend of GHG emissions in each stage as an indicator, the drivers are the same, as a trend of change would indicate that the method of treatment has a good effect, and the opposite trend would represent that it has an inhibiting effect on it. The results are shown in Figure 5.
As can be seen from Figure 5, for the contribution values and contribution rates of the five drivers in each time period, E E D and E P S all have a promoting effect on GHG emissions, while E T S ,   E G I and E E I mostly show an inhibiting effect on GHG emissions. The degree of influence of each driver on the total GHG emissions of the MSW treatment process was quantified by the contribution rate based on the LMDI, as shown in Table 2.
First, combining the results of E E I for the four time periods in Figure 5 and Table 2, it can be seen that its contribution rate is both positive and negative, and its value accounts for a relatively small amount; in 2019–2022, the contribution rate for the total GHG emissions was 0.0035%, that is, there was a decrease in GHG emissions from the MSW treatment process of 0.11 Mt. This indicates that the contribution of E E I to the reduction in GHG emissions from the MSW treatment process shows a decreasing contribution rate trend. This is mainly due to the fact that the collection and utilization of landfill gas from MSW landfills in China started relatively late. The method of utilizing landfill gas at the present stage will reduce the final GHG emissions to a certain extent, but there is a certain limit to the benefits achieved from recycling and utilization of landfill gas, so although E E I ’s contribution to the GHG emissions from the MSW disposal process is decreasing, the contribution rate is lower at the same time, which is in agreement with the findings of Yao [42].
The results of E T S for the four time periods in Figure 5 show that its contribution to the total GHG emissions is negative, with contribution values of −35.87%, −31.98%, −179.95% and −104.5%;therefore E T S has a strong inhibitory effect on the GHG emissions from the MSW treatment process, which indicates that the change in the MSW treatment method from landfill to incineration and biological treatment can help slow down GHG emissions. From Table 2, it can be seen that the contribution of E T S to total GHG emissions is −104.5% for the period 2019–2022, implying that each unit increase in E T S will inhibit emissions by 104.5%, which represents 3237.9 Mt of GHG emissions from the MSW treatment process.
Further, as seen from the results for E G I in Figure 5, E G I has had a strong inhibiting effect on the contribution of total GHG emissions, except in 2013–2016 when E G I had a weakly inhibiting effect on the contribution of total GHG emissions. As can be seen in Table 2, the contribution of E G I to total GHG emissions in 2019–2022 reached −48.24%, implying that each unit increase in E G I would have prevented 1494.6 Mt of GHG emissions from the MSW treatment process. This suggests that MSW generation intensity is also a major driver in reducing GHG emissions from MSW disposal, which is in agreement with the findings of Xiao [31] and Zhang [2].
In addition, as seen from the results of E P S in Figure 5, the four time periods of E P S contribute 11.86%, 9.77%, 17.80% and 0.318% to the total GHG emissions; all of these show the positive of the method on GHG emissions. From Table 2, it can be seen that the contribution of E P S to the total GHG emissions in 2019–2022 was 0.318%, which means that each unit increase in E P S would have increased GHG emissions from the MSW treatment process by 9.85 Mt. Therefore, the population factor has a certain driving effect on the increase in GHG emissions from MSW.
Finally, as can be seen from the results of E E D in Figure 5, E P S contributes 207.51%, 115.76%, 377.00%, and 60.87% to the total GHG emissions in the four time periods; these values reflect the high increase in GHG emissions from the MSW treatment process, which is in agreement with the findings of Xiao [31]. From Table 2, it can be seen that the contribution of E E D to the total GHG emissions in 2019–2022 was 52.43%, which means that each unit increase in E E D would have increased the GHG emissions from the MSW treatment process by 52.43%, that is, 1624.5 Mt.

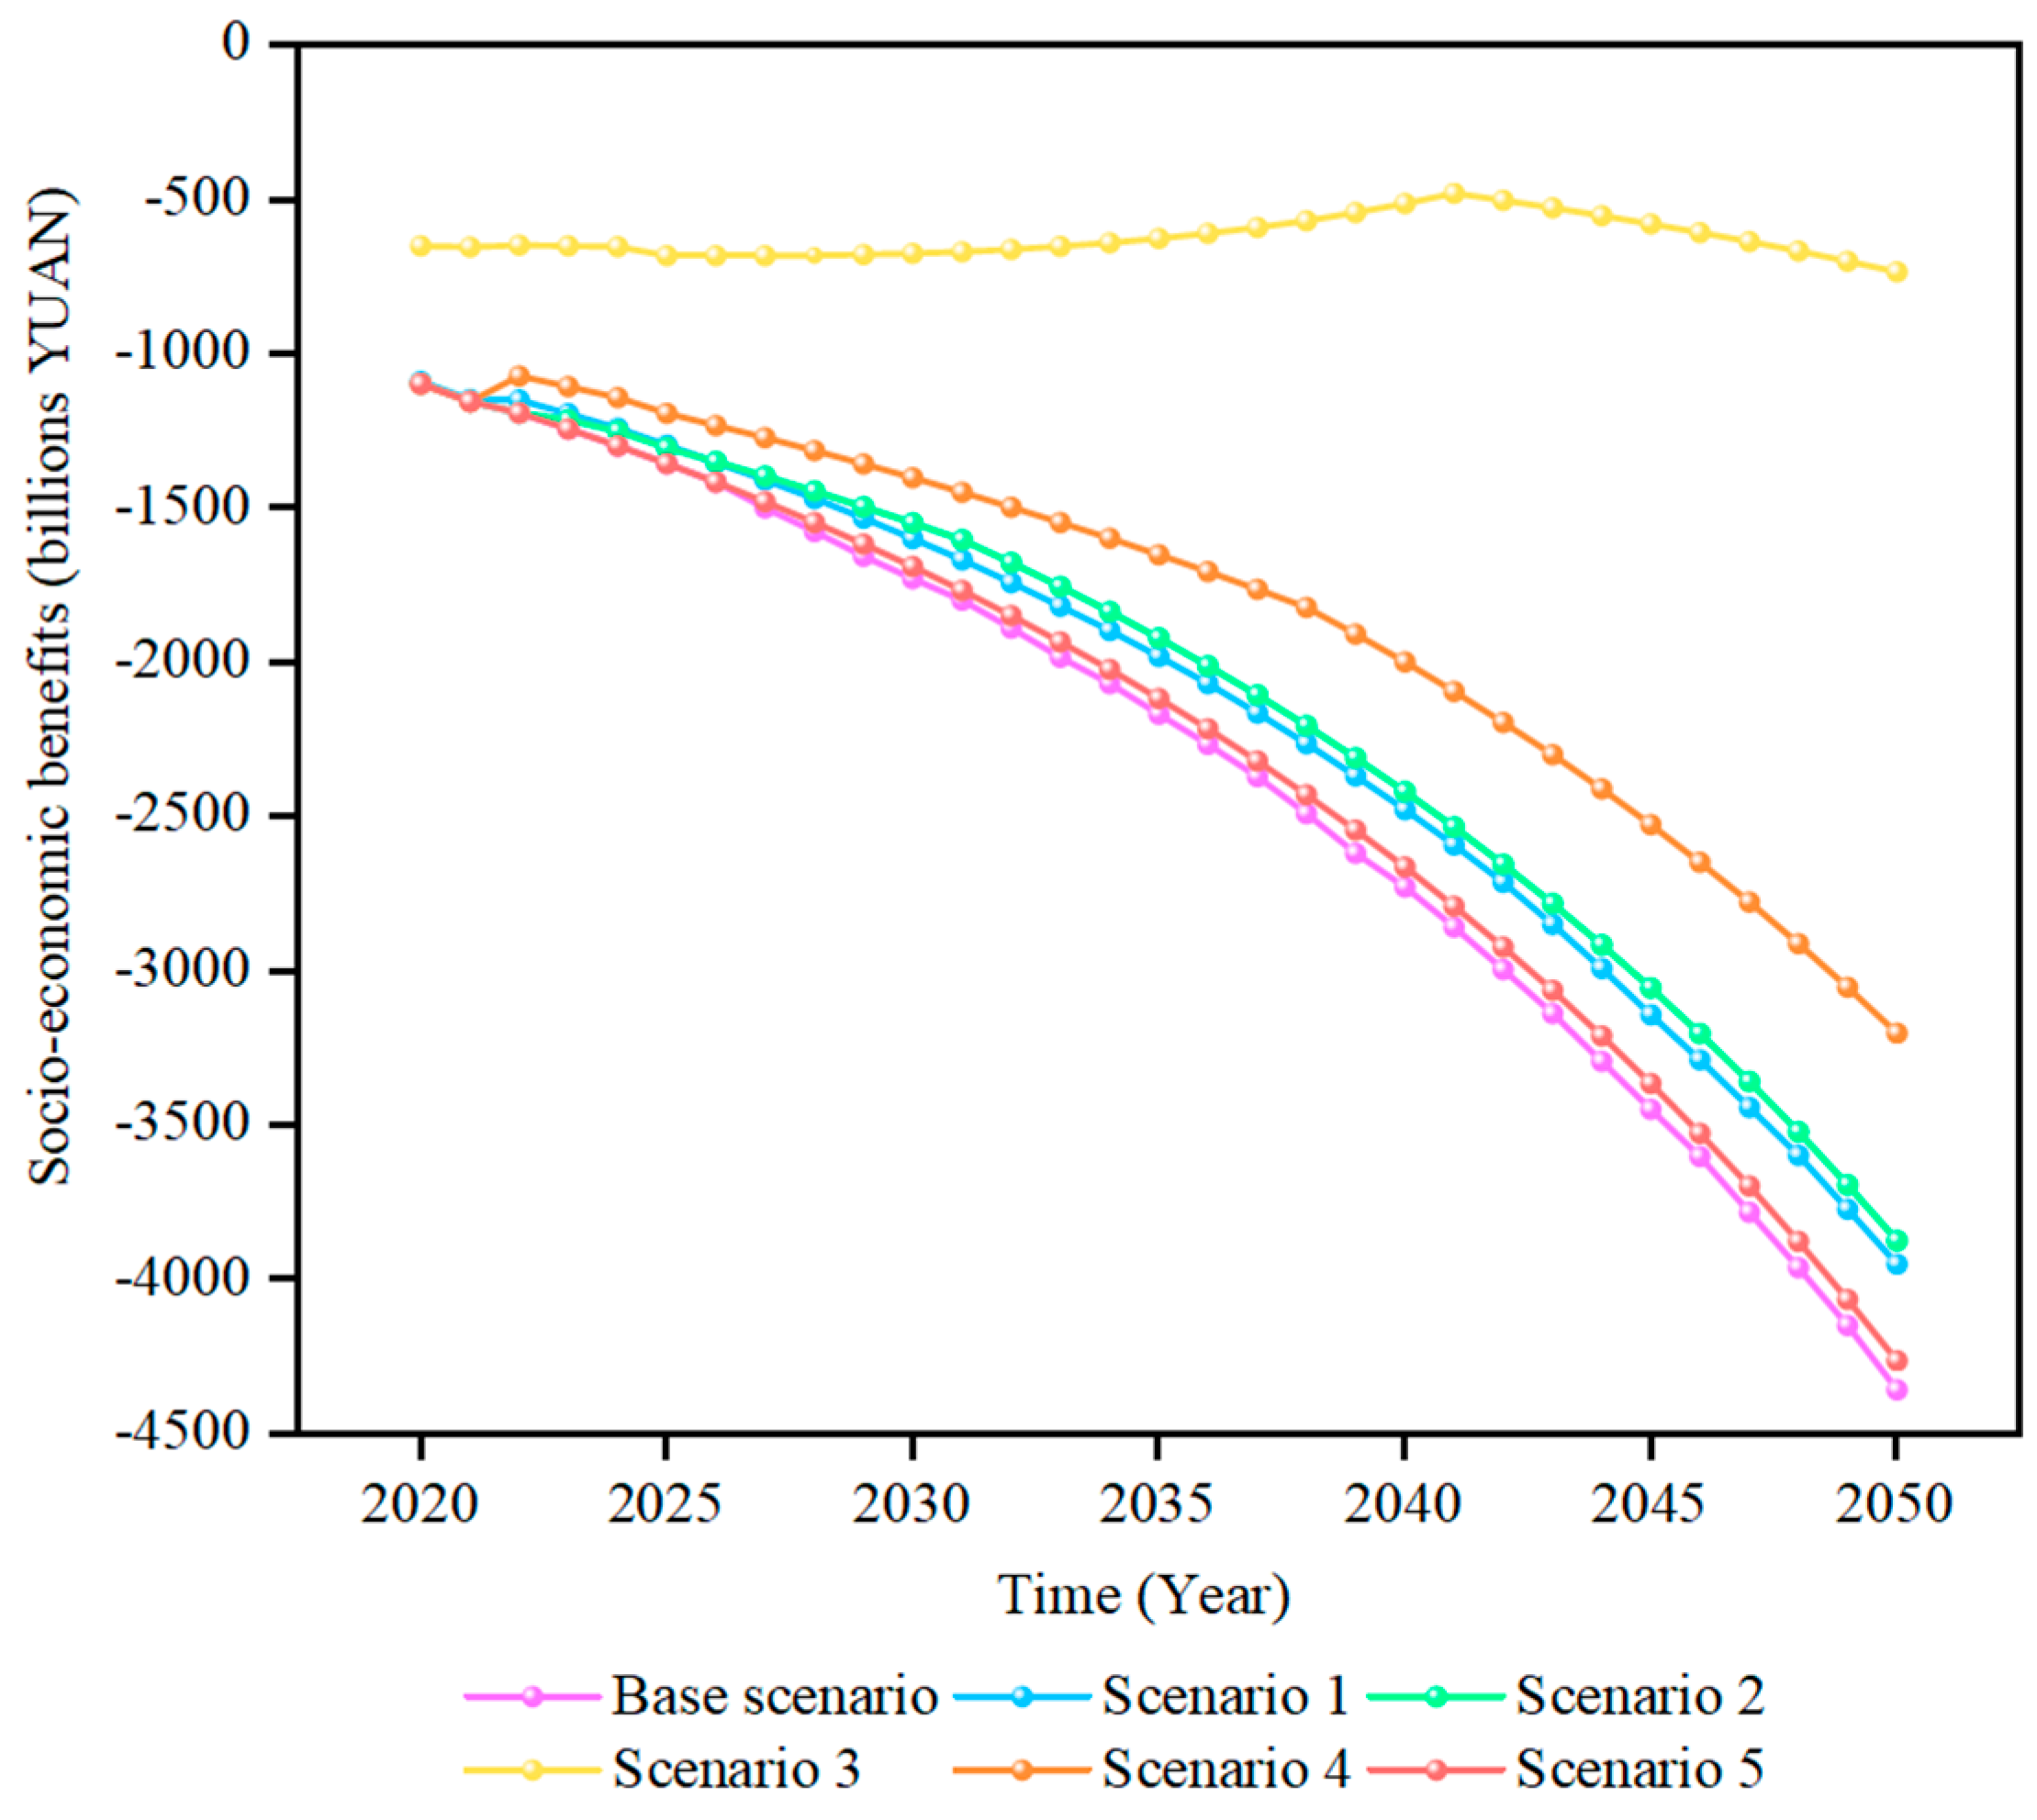
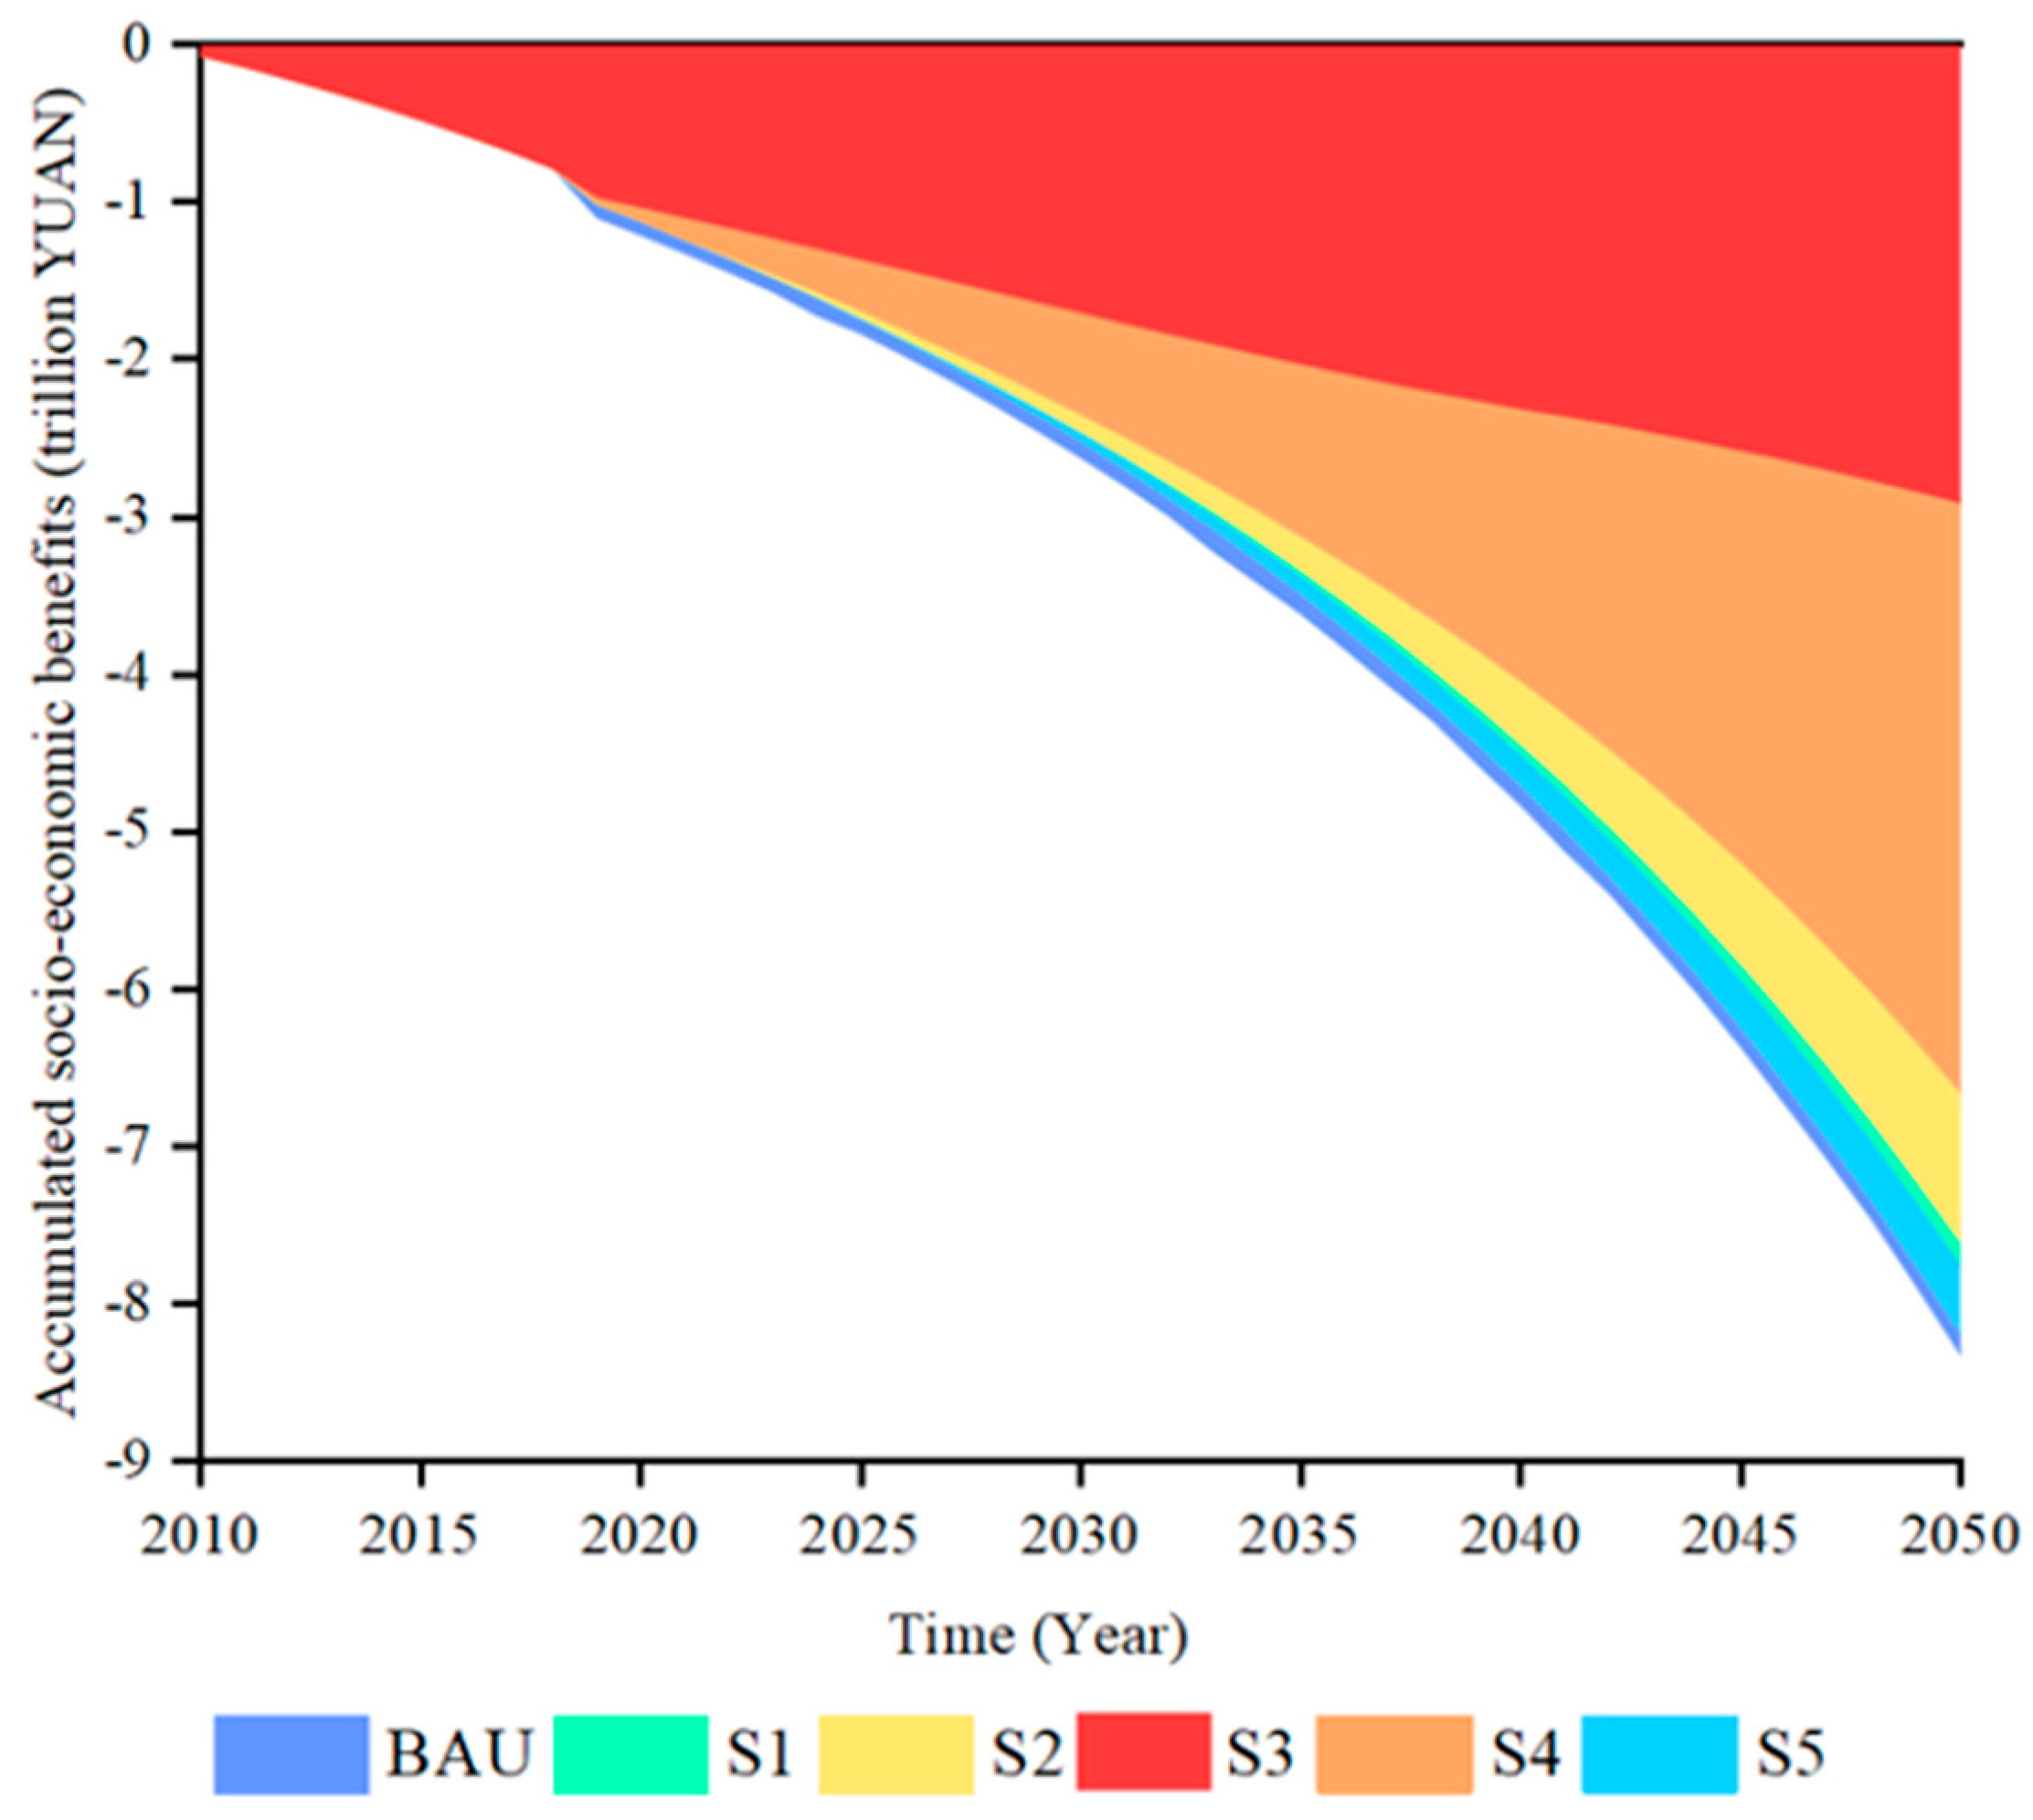
3.2. Results of the Assessment of Socio-Economic Benefits

Based on the SD model for the socio-economic benefit assessment of MSW, the socio-economic benefits of the process of low-carbon management of MSW in China from 2020 to 2050 under different scenarios were predicted and analyzed, as shown in Figure 6. From Figure 6, it can be observed that S3 provides more socio-economic benefits than the other scenarios, and the extent of economic benefits under the rest of the scenarios are, in descending order, S4 > S2 > S1 > S5 > BAU. Therefore, the five proposed measures, increasing the rate of MSW separation, reducing the per capita amount of MSW generated, increasing the incineration rate, increasing the utilization rate of CH4, and slowing down the population growth rate, could improve the economic benefits of the low-carbon management process of China’s MSW in 2020–2050, as shown in Figure 6.
Taking S3 as an example, the economic benefits in 2020–2050 range from CNY −73.58 billion to CNY −65.23 billion, and in 2050, for example, the extent of socio-economic benefits under S3 will be nearly 82.8% higher than that achieved under the BAU of CNY −427.15 billion, which is mainly due to the fact that after increasing the rate of MSW separation, there will be a significant increase in the recycling of materials, and their reprocessing and production processes will bring significant economic benefits, as well as a reduction in the amount of MSW disposed of that enters terminal treatment facilities, reducing the final transportation and disposal costs. The extent socio-economic benefits of the MSW treatment processes under S1, S2, S4, and S5 in 2050 are CNY −391.44 billion, CNY −387.55 billion, CNY −320.36 billion, and CNY −426.55 billion, which are nearly 8.4%, 9.3%, 25.0%, and 0.14% higher compared to that under the BAU. S1 increases the amount of CH4 used to generate electricity by increasing the CH4 utilization rate, which in turn brings certain socio-economic benefits; S2 increases the incineration rate of MSW, which in turn increases the amount of energy generated by incineration, which then generates certain socio-economic benefits; S4 and S5 both reduce the amount of MSW generated, which reduces some of the costs of waste collection and transportation, which in turn increases the eventual socio-economic benefits. From Figure 6, it can also be seen that S5 is less effective in increasing the socio-economic benefits of the MSW treatment process, which shows that there is a limit to the extent of socio-economic benefits that can be achieved by slowing down the population growth rate.
Meanwhile, Figure 7 analyzes the socio-economic benefits of the low-carbon MSW management process under different scenarios from 2010 to 2050, from which it can be seen that all six scenarios cause a certain degree of loss of the socio-economic benefits of the low-carbon MSW management process, and the degree of loss of the socio-economic benefits of the process increases with time. However, S1, S2, S3, S4 and S5 decrease socio-economic losses to different degrees compared to the BAU; in particular, S3 shows the lowest degree of socio-economic benefit loss. In 2050, for example, the cumulative socio-economic benefit of the BAU scenario will be CNY −8.08 trillion, and the cumulative socio-economic benefits of S3 will amount to CNY −2.84 trillion, which represents an increase of 64.85% compared to the BAU scenario. The cumulative values of socio-economic benefits under S1, S2, S4 and S5 are CNY −7.59 trillion, CNY −7.49 trillion, CNY −6.54 trillion and CNY −8.07 trillion, respectively, representing improvements of nearly 6.06%, 7.3%, 19.06% and 0.12% compared with the BAU.

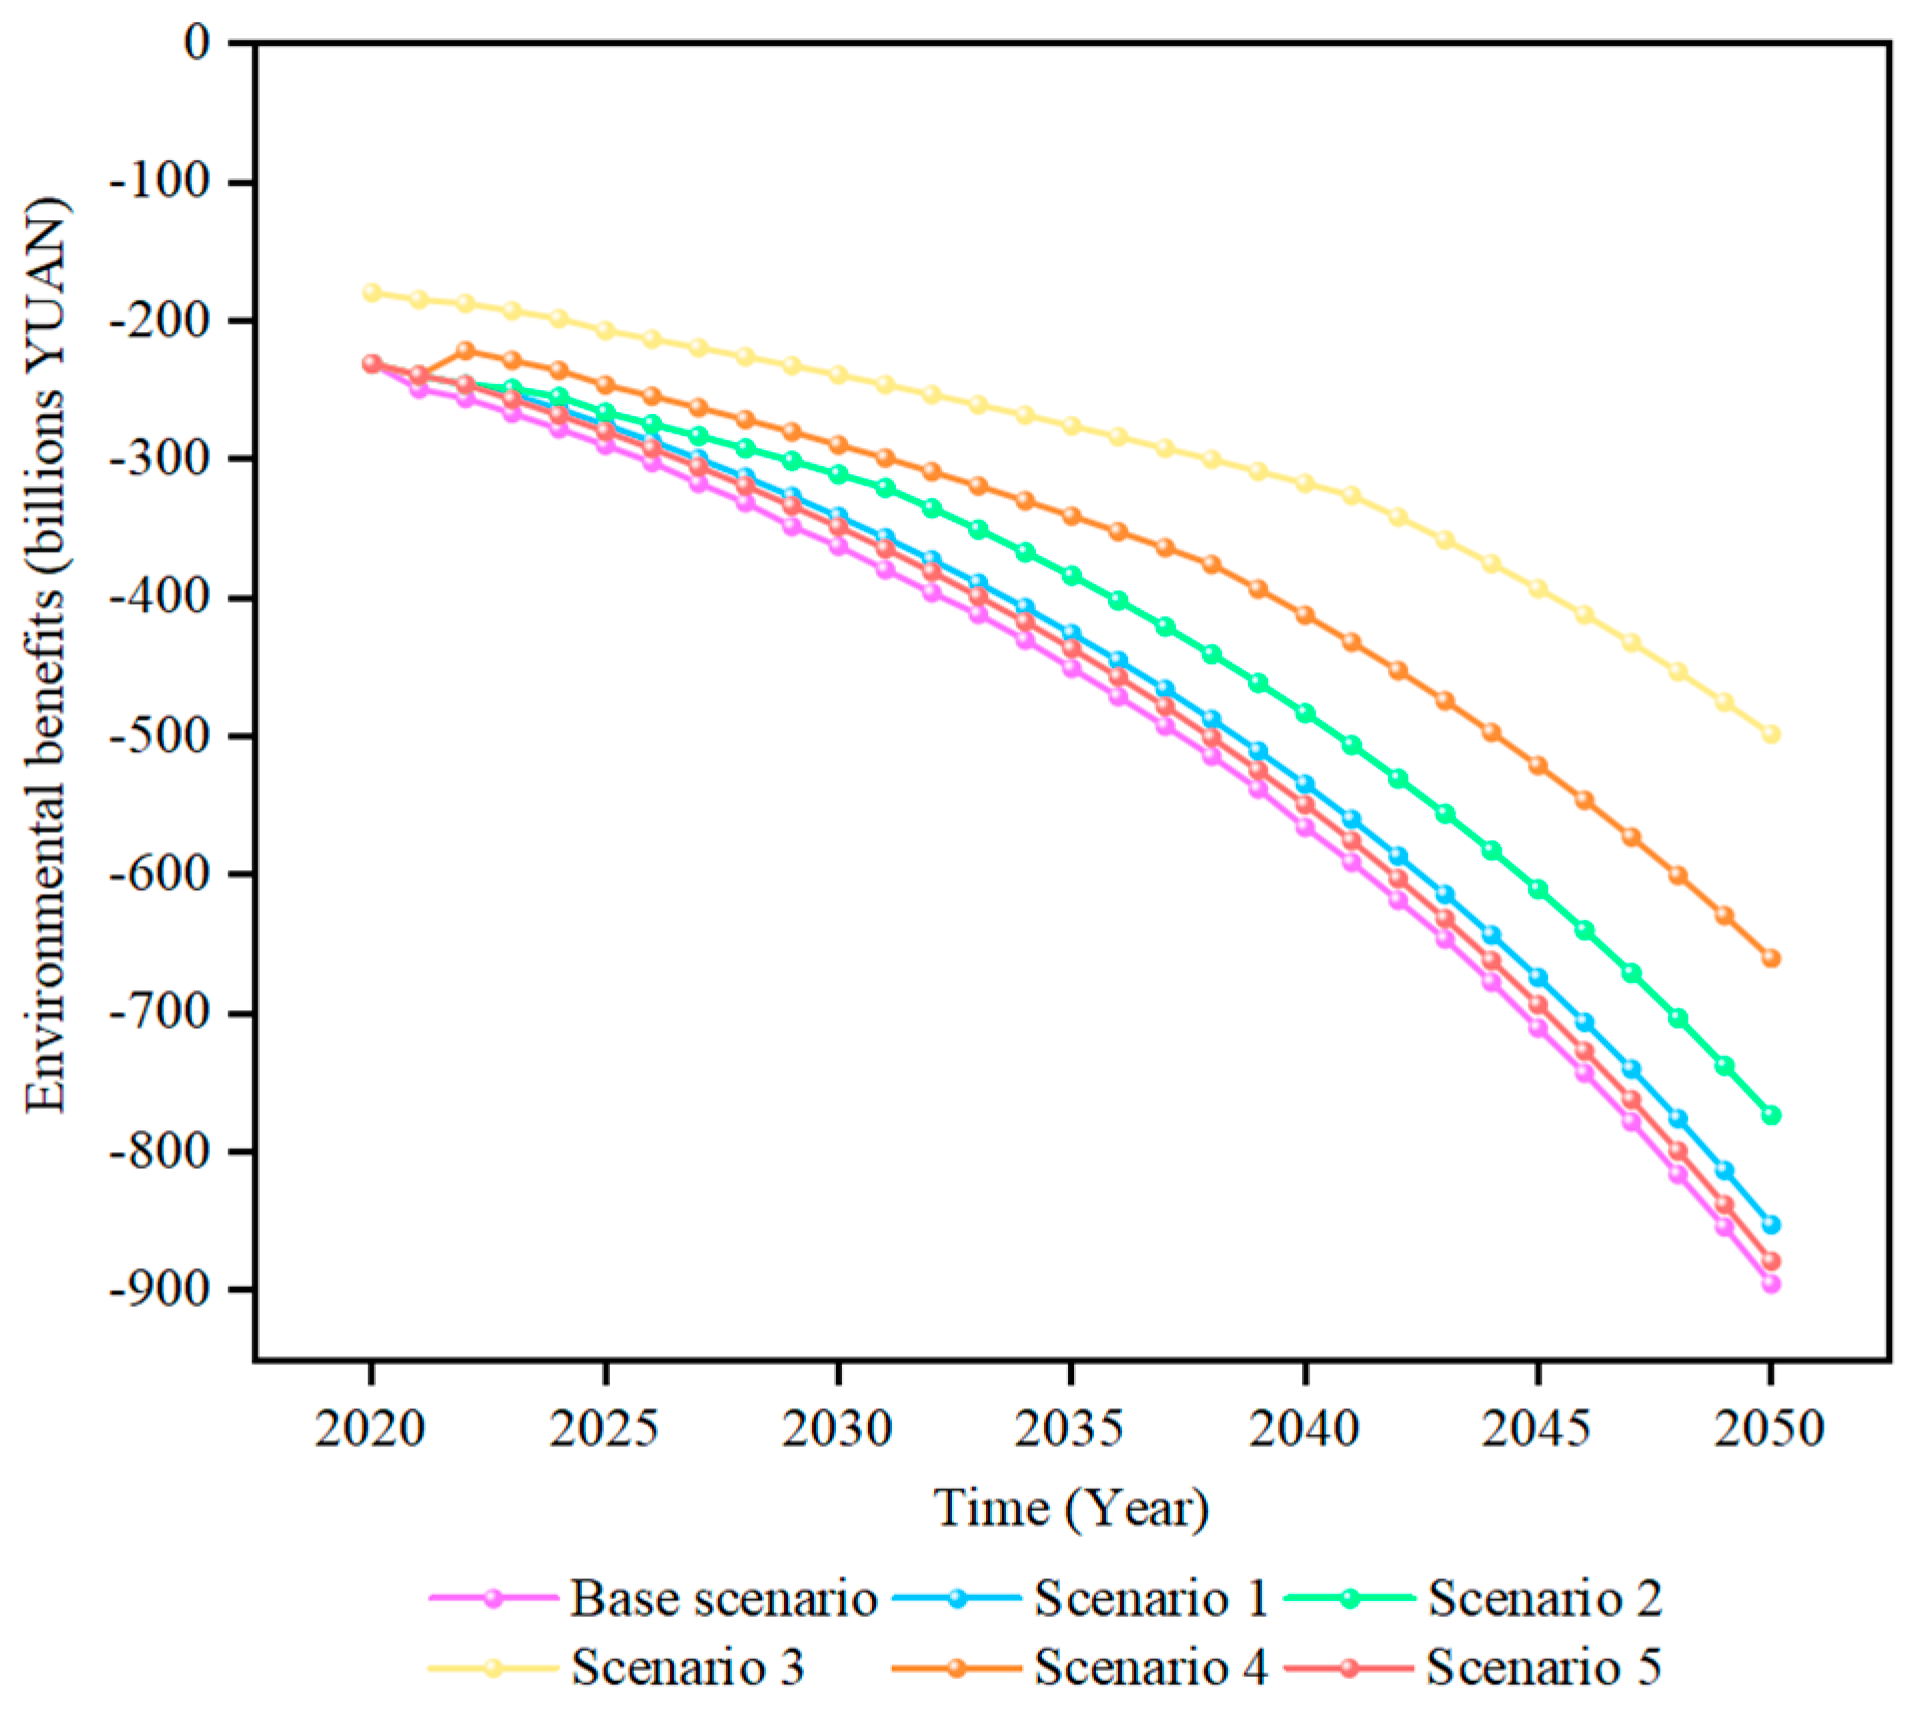
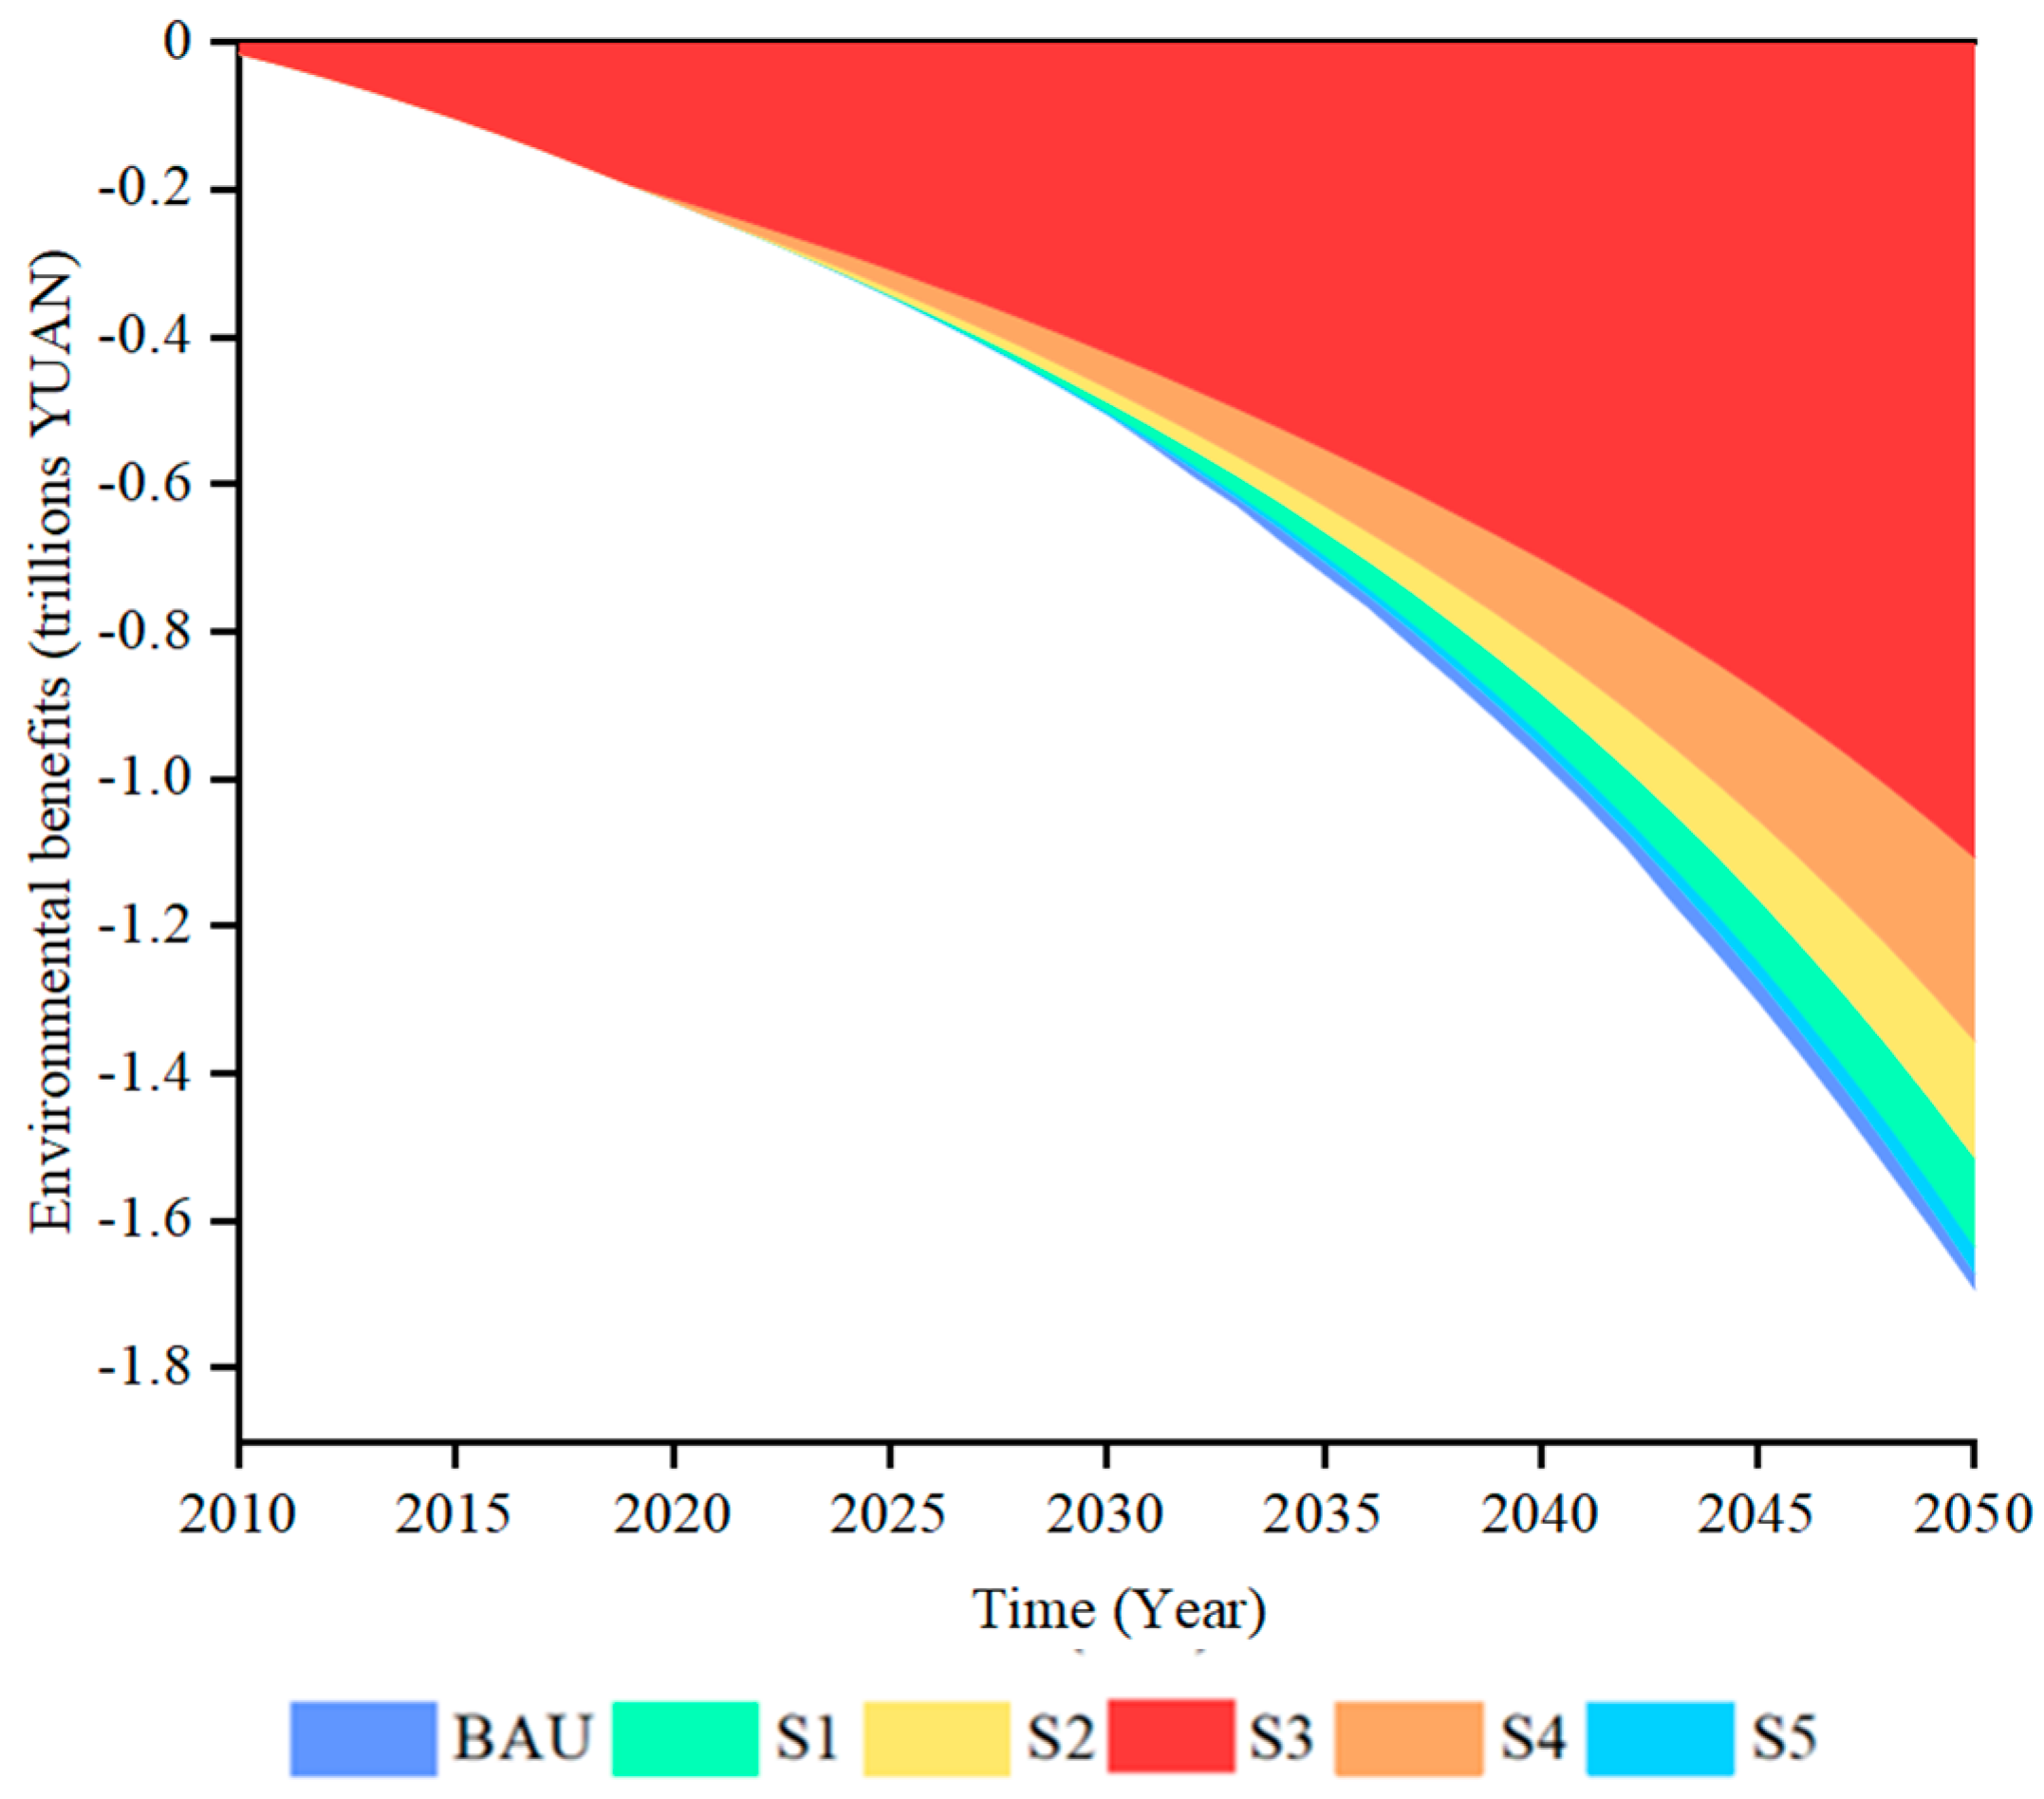
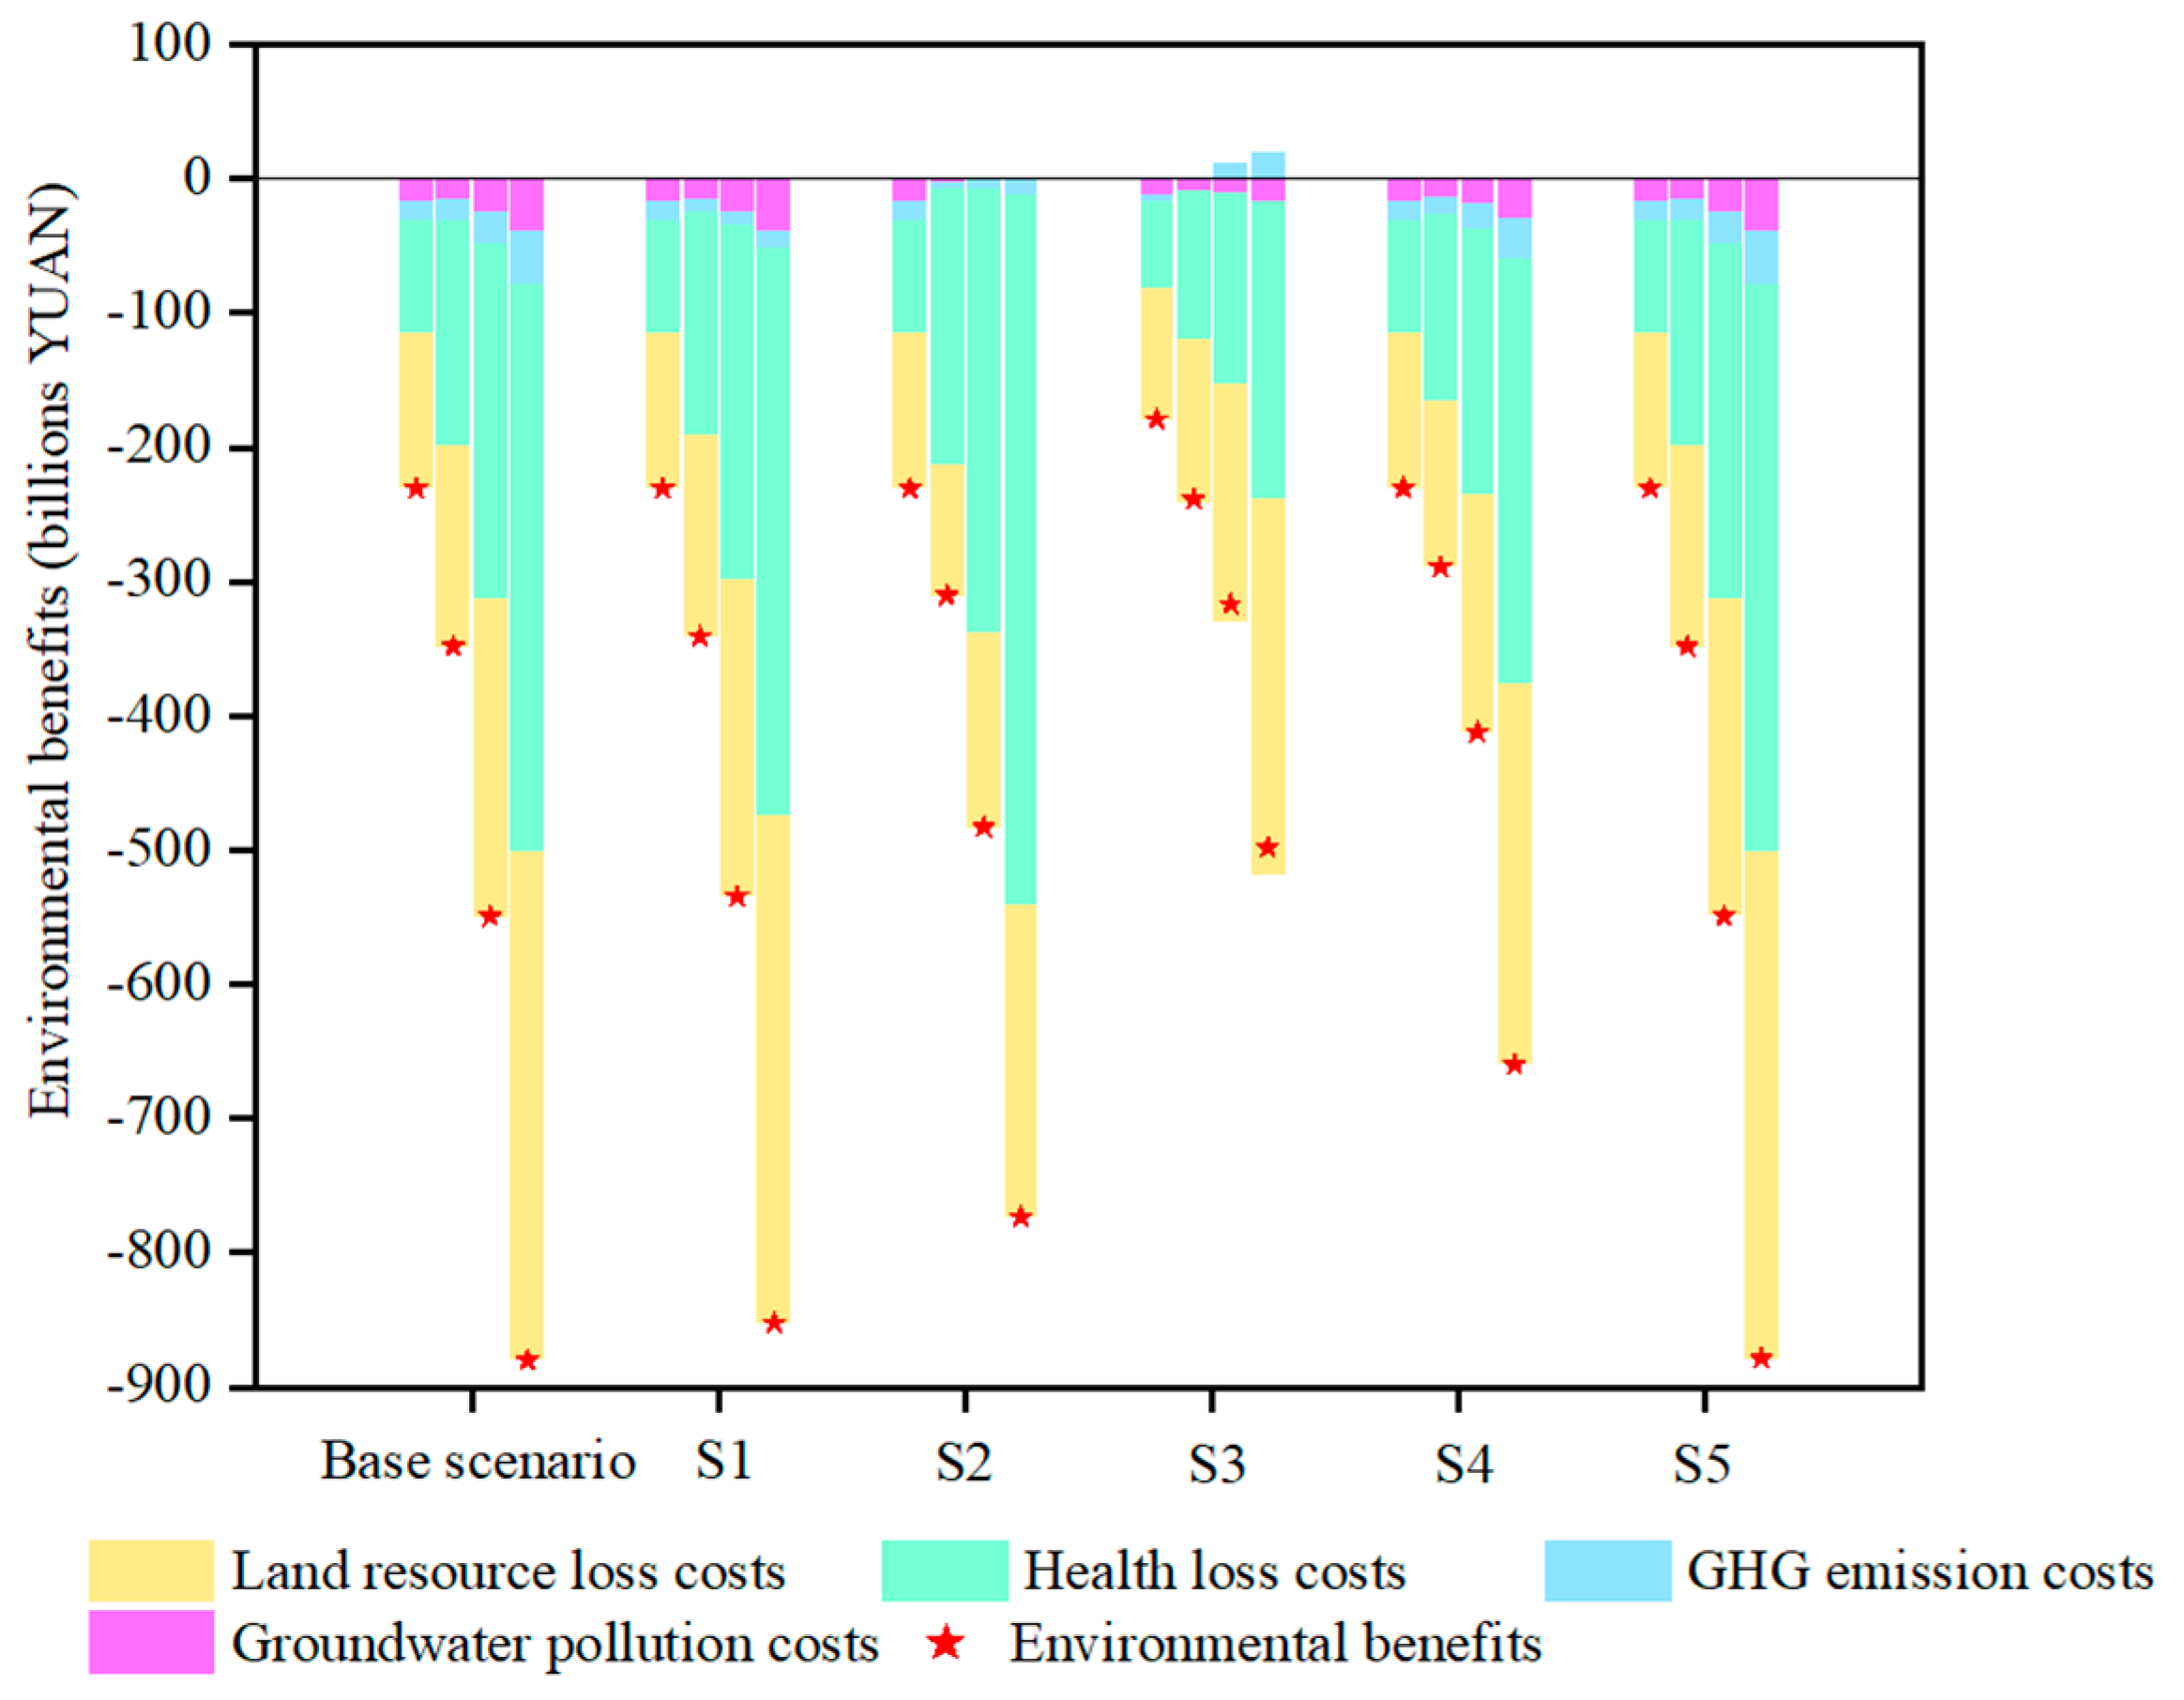
3.3. Results of the Assessment of Environmental Impacts

Environmental impacts are also a key indicator of the effectiveness of the low-carbon management of MSW. Figure 8 reflects the environmental benefits of the MSW treatment process under different scenarios from 2020 to 2050; it is obvious that all six scenarios cause irreversible cost losses to the environment, and their environmental impacts are all negative. The environmental impacts under the six scenarios are ranked in descending order as follows: S3 > S4 > S2 > S1 > S5 > BAU; therefore, the environmental impacts of the MSW treatment process under S1, S2, S3, S4, and S5 are all improved to different degrees compared with the BAU every year, which shows that the costs to the environment of MSW treatment can be effectively reduced by adopting certain measures.
In S3, the environmental impacts range from CNY −49.806 billion to CNY −17.92 billion yuan from 2020 to 2050, and in 2050, the environmental impacts will be improved by nearly 43.4% compared with CNY −87.979 billion under the BAU, which is mainly due to the fact that by increasing the rate of MSW separation, the amount of recyclables recycled will be significantly increased, and the amount of MSW going to the waste terminal treatment facilities will be significantly reduced; furthermore, the corresponding GHG emission costs, groundwater pollution costs, health loss costs, and land resource loss costs will be significantly reduced, therefore bringing about significant environmental impacts, which is in agreement with the findings of Wang [6]. The environmental impacts in 2050 under S1, S2, S4 and S5 will amount to CNY −85.21 billion, CNY −77.321 billion, CNY −65.984 billion and CNY −87.854 billion, nearly 3.14%, 12.11%, 25% and 0.14% higher than those under the BAU. S1 reduces GHG emissions by increasing the CH4 utilization rate, which in turn reduces GHG emission costs and groundwater pollution costs; S2 reduces the amount of waste in the terminal landfill process by increasing the waste incineration rate, which in turn reduces GHG emission costs, groundwater pollution costs, and land resource loss costs; S4 and S5 reduce the amount of MSW generated, reduce the amount of MSW disposed of at the end of the process, and reduce the GHG emissions in the MSW treatment process, in turn reducing the costs of GHG emissions, groundwater contamination, health issues, and land resource loss. From Figure 8, it can be seen that S5 has low potential to increase environmental impacts; therefore, limiting the population size has limited benefits in increasing the environmental impacts of the MSW treatment process.
Figure 9 analyzes the environmental impacts of the low-carbon management of MSW under different scenarios from 2010 to 2050 from a cumulative perspective, from which it can be seen that the low-carbon management process for MSW under the six scenarios has caused a certain degree of loss in terms of China’s environmental impacts, and the degree of loss of environmental benefits has increased with time. However, the cumulative environmental impacts of S1, S2, S3, S4, and S5 have all improved to different degrees compared to those in the BAU. In 2050, the cumulative environmental impact of S3 will amount to CNY −1.107 trillion, which is 50.45% higher than that of BAU (CNY −1.672 trillion). The cumulative environmental impacts of S1, S2, S3, S4, and S5 will be CNY −1.635 trillion, CNY −1.514 trillion, CNY −1.356 trillion, and CNY −1.671 trillion, 2.21%, 9.45%, 18.9%, and 0.059% higher than that of the BAU.
Figure 10 analyses the environmental impacts of MSW disposal under different scenarios in 2020, 2030, 2040, and 2050, from which it can be seen that, based on each scenario, costs of land resource loss health issues account for a higher proportion of the environmental impacts; therefore, unreasonable MSW treatment and disposal pose a more serious threat in terms of China’s ecological resource depletion and human health. At the same time, Figure 10 shows that the GHG emission costs in 2040 and 2050 under S3 will be reduced, mainly due to the carbon neutralization of the GHG emissions from the MSW disposal process after the continuous improvement in the MSW separation rate and the negative value of GHG emissions after that. Therefore, China should continue to promote the effective implementation of the MSW separation policy, optimize the structure of MSW treatment, improve the utilization of CH4, and reduce the costs of MSW treatment processes to the environment, a recommendation in agreement with the findings of Wang [6].

4. Discussions and Policy Recommendations

4.1. Discussion

Based on the LMDI method, used to identify the factors driving GHG emissions from the MSW treatment process in China from 2010 to 2022, it can be seen from Figure 2 that both the economic development factor E E D and the population size factor E P S will contribute to GHG emissions from the MSW treatment process. The economic development factor E E D is the dominant contributing factor, which is mainly due to the fact that with rapid economic development, the amount of MSW generated will increase, and the amount of waste generated that enters terminal waste treatment facilities will increase, which will in turn increase the GHG emissions of the final treatment process. Based on Figure 2, it can also be seen that the generation intensity effect ( E G I ), the emission intensity effect ( E E I ), and the treatment structure effect ( E T S ) will inhibit the GHG emissions of the MSW treatment process to different degrees, among which the inhibition effect of the MSW treatment E T S will be the largest. This indicates that the change in the treatment structure and method of China’s MSW will have a certain positive effect on the inhibition of GHG emissions, and the change in China’s MSW treatment structure and method should also have a certain positive effect on GHG emissions. In the future, China’s MSW treatment structure should continue to be developed according to the existing model.
Through the identification and quantification results of the LMDI method, key variables were identified and an SD model was constructed. Figure 6 and Figure 8 evaluate the socio-economic and environmental benefits of MSW treatment under different scenarios, and show that S1, S2, S3, S4, and S5 allow for different degrees of improvement compared to the BAU, while the socio-economic benefits are increased by 8.4%, 9.3%, 82.8%, 25.0%, and 0.14%, and the environmental impacts are increased by 3.14%, 12.11%, 43.4%, 25%, and 0.14%, respectively. S3 has the highest socio-economic and environmental benefits, mainly because it increases the MSW separation rate to reduce the amount of terminal waste disposed, which significantly reduces the final GHG emissions, reduces the final GHG emission costs, reduces the amount of groundwater contamination, dioxin and other hazardous gases caused by landfilling, and improves the utilization of land resources, thus improving the final socio-economic and environmental benefits. S1 reduces the final GHG emissions by improving the utilization rate of CH4 and reduces the cost of GHG emissions to a certain extent. Simultaneously, the effective collection and utilization of CH4 will provide certain social and economic benefits. S2 will reduce the final GHG emissions, the amount of groundwater pollution, dioxins, and other harmful gases, and land resource utilization by increasing the incineration rate and decreasing the landfill rate. S4 and S5 will reduce the amount of MSW generated by reducing the amount of MSW per capita and limiting the population size, which in turn will reduce the final GHG emissions, thereby improving the environmental impacts and increasing the socio-economic benefits. Figure 10 analyzes the composition of the environmental benefits of MSW treatment under different scenarios in 2020, 2030, 2040 and 2050, and finds that the land resource loss costs and health costs account for a higher proportion relative to the environmental benefits, indicating that ineffective waste treatment poses a certain threat to China’s ecological environment and human life and health.

4.2. Policy Recommendations

Based on the simulation results of the SD model established for determining the socio-economic benefits and environmental impacts of the low-carbon MSW management process, this paper puts forward the following policy recommendations to help policymakers make appropriate decisions and increase the comprehensive benefits of the low-carbon MSW management system.
(1)
Enhance the pathway of CH4 utilization, and improve the utilization rate of CH4
MSW produces a large amount of CH4 in the landfill process, with its complex composition, and its impact on the environment is large; however, the calorific value of CH4 gas in landfill gases is high, its combustion process cannot easily cause secondary pollution, and it can be utilized as a renewable energy source [42]. Therefore, increasing the utilization of CH4 can effectively reduce GHG emissions. The prediction results of the SD model show that with the increasing rate of CH4 utilization, the socio-economic and environmental benefits of the low-carbon management process of MSW in each year will increase compared with the BAU. For example, in 2050, the socio-economic and environmental benefits of MSW under S1 will increase by 8.4% and 3.14%, respectively, compared with the BAU. Therefore, there is an urgent need to formulate more innovative policies to promote the utilization of CH4 in the future, such as for power generation, boiler fuel, the production of chemical products, and other comprehensive utilization methods, so that CH4 utilization projects can be carried out at the same time as the construction of landfill sites, so as to increase the utilization rate of landfill gas and improve the environmental impacts and socio-economic benefits.
(2)
Optimize the structure of MSW treatment and establish a comprehensive MSW separation system
With the continuous encouragement provided by China’s industrial policy, the number and processing scale of China’s MSW incineration plants is expanding, and the incineration of MSW has become the mainstream waste treatment method; it can not only reduce the excessive use of land resources but also meet the dual demand for resource recycling and environmental protection. The prediction results of the SD model show that as the MSW incineration rate increases, the socio-economic and environmental benefits of each year show an upward trend compared with the BAU, and in 2050, the socio-economic and environmental benefits of S2 will be increased by 12.11% and 9.3% compared with the BAU. Therefore, in the future, it is necessary to further increase the amount of MSW incinerated, reduce the amount of landfill waste, and optimize the structure of MSW treatment to improve the comprehensive benefits of the system.
In addition, the prediction results of the SD model show that with an increase in the MSW separation rate, the amount of MSW disposed will be reduced significantly, and the process of recycling recyclables will bring considerable economic benefits; thus, the socio-economic and environmental benefits have the highest potential to be improved compared with the BAU. In 2050, the socio-economic and environmental benefits of S3 will be 82.8% and 43.4% higher, respectively than those of the BAU. In the future, China should further develop its MSW separation system, establish a comprehensive MSW separation system, and raise residents’ awareness of MSW separation. The government should also invest in the construction and purchase of MSW separation treatment facilities at the same time to establish incentivizing mechanisms, constantly improve tax incentives, establish organic waste resource treatments to promote these mechanisms, create a waste recycling subsidy mechanism, study and determine public garbage disposal subsidies and garbage metering charges, increase investment in the research and development of terminal treatment equipment, increase the recycling rate of recyclables, and effectively improve the environmental impacts and socio-economic benefits of MSW.
(3)
Encourage public green behavior and promote low-carbon consumption patterns
The economic development factor and the population size factor were the dominant factors that promoted China’s MSW GHG emissions from 2010 to 2022. The prediction results of the SD model show that, with a reduction in per capita MSW generation or population size, S4 has higher potential to increase the comprehensive benefits compared to the rest of the scenarios, while there are limits to the extent of benefits that can be achieved by the reduction in population size under. However, green behavior can reduce the amount of MSW generated at the source, which is the basic requirement for improving systemic integrated benefits. Therefore, under the premise of sustained economic development and population growth, China should pay more attention to residents’ lifestyles, promote the development of consumption patterns in the direction of low-carbon conservation, reduce the amount of per capita MSW generation, and form green, low-carbon, and energy-saving lifestyle and consumption patterns. The media will play a leading role in publicizing and reporting positively on the policies and measures for MSW separation, reduction and disposal and their effectiveness, and should carry out various forms of thematic publicity activities, produce animated films and public service announcements on MSW separation, and produce and distribute promotional materials with MSW separation publicity content, so as to encourage green lifestyles among the public.

5. Conclusions

Exploring the impact of low-carbon MSW management processes on China’s socio-economic and environmental benefits can provide a more reliable basis for policymakers. In order to reveal the driving mechanisms affecting GHG emissions from MSW, this paper innovatively applies the LMDI method to identify and quantify the degree of influence of the five driving factors in China’s MSW GHG emissions from 2010 to 2022, and applies the SD theory to carry out a comprehensive dynamic assessment of the benefits of the low-carbon management of China’s MSW in a long-term dynamics perspective, and to clarify the effects of different management measures on the process of low-carbon MSW management. The results show that the economic development factor E E D is the dominant contributing factor to the GHG emissions of MSW, while the generation intensity effect E G I and the treatment structure effect E T S play a stronger inhibiting effect on the GHG emissions of the MSW treatment process. In addition, increasing the MSW separation rate has the greatest potential to improve the socio-economic benefits and environmental impacts of the system, and the socio-economic benefits and environmental impacts of S3 in 2050 are 82.8% and 43.4% higher than those of the BAU. Reducing the per capita amount of MSW generated and increasing the MSW incineration rate will also significantly improve the comprehensive benefits of the system. This study concludes with policy recommendations that are important for global warming mitigation, energy recovery, and low-carbon sustainable development. The SD model in this paper can be applied to the whole MSW management process in other cities to help them evaluate socio-economic and environmental impacts under different policy options. In addition, the low-carbon MSW management system is a complex system, in which the variables and their corresponding feedback relationships are quite complicated, and this paper has not yet considered the influence of factors such as the level of urbanization and the tertiary industry on the amount of MSW generated. At the same time, the sources of costs in the efficiency model have not been fully considered, and these limitations are expected to be resolved in future studies as the model is improved.

Author Contributions

G.Z.: methodology, model construction and analysis, data curation, and writing of the original draft. G.L.: conceptualization, formal analysis, review and editing of the manuscript. K.L.: investigation, formal analysis, data curation, validation, writing, review and editing of the manuscript. H.L.: conceptualization, data curation, visualization, validation, review and editing of the manuscript and supervision. All authors have read and agreed to the published version of the manuscript.

Funding

This work was supported by the National Key Basic Research and Development Programme (SQ2019YFC190120).

Institutional Review Board Statement

Not applicable.

Informed Consent Statement

Not applicable.

Data Availability Statement

All data generated or analyzed during this study are available upon request to the corresponding author.

Conflicts of Interest

The authors declare that they have no known competing financial interests or personal relationships that could have appeared to influence the work reported in this paper.

References

  1. Rao, C.; Huang, Q.; Chen, L.; Goh, M.; Hu, Z. Forecasting the carbon emissions in Hubei province under the background of carbon neutrality: A novel Stirpat extended model with Ridge regression and scenario analysis. Environ. Sci. Pollut. Res. 2023, 30, 57460–57480. [Google Scholar] [CrossRef] [PubMed]
  2. Zhang, C.; Dong, H.; Geng, Y.; Song, X.; Zhang, T.; Zhuang, M. Carbon neutrality prediction of municipal solid waste treatment sector under the shared socioeconomic pathways. Resour. Conserv. Recycl. 2022, 186, 106528. [Google Scholar] [CrossRef]
  3. Ritchie, H.; Rosado, P.; Roser, M. Emissions by Sector: Where do Greenhouse Gases Come From. 2022. Available online: https://ourworldindata.org/emissions-by-sector (accessed on 1 January 2024).
  4. Kittipongvises, S.; Polprasert, C. GHGs emissions and Sustainable Solid Waste Management. In Recycling of Solid Waste for Biofuels and Bio-Chemicals; Springer: Singapore, 2016; pp. 55–85. [Google Scholar] [CrossRef]
  5. National Bureau of Statistics of China. China Statistical Yearbook 2022; China Statistics Press: Beijing, China, 2022.
  6. Wang, W.; You, X. Benefits analysis of classification of municipal solid waste based on system dynamics. J. Clean. Prod. 2021, 279, 123686. [Google Scholar] [CrossRef]
  7. Nanda, S.; Berruti, F. Municipal solid waste management and landfilling Technologies: A Review. Environ. Chem. Lett. 2020, 19, 1433–1456. [Google Scholar] [CrossRef]
  8. Jeswani, H.; Azapagic, A. Assessing the environmental sustainability of energy recovery from municipal solid waste in the UK. Waste Manag. 2016, 50, 346–363. [Google Scholar] [CrossRef]
  9. Assamoi, B.; Lawryshyn, Y. The environmental comparison of landfilling vs. incineration of MSW accounting for waste diversion. Waste Manag. 2012, 32, 1019–1030. [Google Scholar] [CrossRef] [PubMed]
  10. Kourkoumpas, D.; Karellas, S.; Kouloumoundras, S. Comparison of Waste-to-Energy Processes by Means of life cycle analysis principles regarding the global warming potential impact: Applied case studies in Greece, France and Germany. Waste Biomass Valorization 2015, 6, 605–621. [Google Scholar] [CrossRef]
  11. Yu, Y.Q.; Zhang, w. Greenhouse gas emissions from solid waste in Beijing: The rising trend and the mitigation effects by management improvements. Waste Manag. Res. 2016, 34, 368–377. [Google Scholar] [CrossRef]
  12. Usiung, L.; Jeongwoo, H.; Michael, W. Evaluation of landfill gas emissions from municipal solid waste landfills for the life-cycle analysis of waste-to-energy pathways. J. Clean. Prod. 2017, 166, 335–342. [Google Scholar] [CrossRef]
  13. Liu, Y.; Sun, W.; Liu, J. Greenhouse gas emissions from different municipal solid waste management scenarios in China: Based on carbon and Energy Flow Analysis. Waste Manag. 2017, 68, 653–661. [Google Scholar] [CrossRef]
  14. Luiza, S.B.L.; Deborah, S.B.L.; Bezerra, B.S. Environmental analysis of organic waste treatment focusing on composting scenarios. J. Clean. Prod. 2016, 155, 229–237. [Google Scholar] [CrossRef]
  15. Xiao, S.; Dong, H.; Geng, Y.; Tian, X. Low carbon potential of urban symbiosis under different municipal solid waste sorting modes based on a system dynamic method. Resour. Conserv. Recycl. 2022, 179, 106108. [Google Scholar] [CrossRef]
  16. Zaman, A.U. A comprehensive study of the environmental and economic benefits of resource recovery from Global Waste Management Systems. J. Clean. Prod. 2016, 124, 41–50. [Google Scholar] [CrossRef]
  17. Rahman, M.M.; Rahman, S.M.; Rahman, M.S. Greenhouse Gas Emissions from Solid Waste Management in Saudi Arabia-Analysis of Growth Dynamics and Mitigation Opportunities. Appl. Sci. 2021, 11, 1737. [Google Scholar] [CrossRef]
  18. Zhao, W.; van der Voet, E.; Zhang, Y. Life cycle assessment of municipal solid waste management with regard to greenhouse gas emissions: Case study of Tianjin, China. Sci. Total Environ. 2009, 407, 1517–1526. [Google Scholar] [CrossRef]
  19. De Feo, G.; Ferrara, C.; Finelli, A. Environmental and economic benefits of the recovery of materials in a municipal solid waste management system. Environ. Technol. 2017, 40, 903–911. [Google Scholar] [CrossRef] [PubMed]
  20. Nie, Y.; Wu, Y.; Zhao, J. Is the finer the better for municipal solid waste (MSW) classification in view of recyclable constituents? A comprehensive social, economic and environmental analysis. Waste Manag. 2018, 79, 472–480. [Google Scholar] [CrossRef] [PubMed]
  21. Ang, B.W.; Zhang, F.Q. A survey of index decomposition analysis in energy and environment studies. Energy 2000, 25, 1149–1176. [Google Scholar] [CrossRef]
  22. Wang, W.W.; Zhang, M.; Zhou, M. Using LMDI method to analyze transport sector CO2 emissions in China. Fuel Energy Abstr. 2011, 36, 5909–5915. [Google Scholar] [CrossRef]
  23. Guo, B.; Geng, Y.; Franke, B. Uncovering China transport CO2 emission patterns at the regional level. Energy Policy 2014, 74, 134–146. [Google Scholar] [CrossRef]
  24. Sun, W.Q.; Cai, J.J.; Yu, H. Decomposition analysis of energy-related carbon dioxide emissions in the iron and steel industry in China. Front. Environ. Sci. Eng. 2012, 6, 265–270. [Google Scholar] [CrossRef]
  25. Xu, J.H.; Fleiter, T.; Eichhammer, W. Energy consumption and CO2 emissions in China cement industry: A perspective from LMDI decomposition analysis. Energy Policy 2012, 50, 821–832. [Google Scholar] [CrossRef]
  26. Wang, M.; Feng, X.Z.; An, Q. Research on Green and Low Carbon Development Strategy of Qinghai Province Based on Decoupling Index and LMDI. Clim. Change Res. 2021, 17, 598–607. (In Chinese) [Google Scholar]
  27. Chontanawat, J.; Wlboonchutlkula, P.; Buddhivanich, A. An LMDI decomposition analysis of carbon emissions in the Thai manufacturing sector. Energy Rep. 2019, 6, 705–710. [Google Scholar] [CrossRef]
  28. Najibi, S.M.; Seyedi, S.H.; Farhadi, P. Development of a model for predicting hospital beds shortage and optimal policies using system dynamics approach. BMC Health Serv. Res. 2022, 22, 1–12. [Google Scholar] [CrossRef]
  29. Kollikkathara, N.; Feng, H.; Yu, D. A system dynamic modeling approach for evaluating municipal solid waste generation, landfill capacity and related cost management issues. Waste Manag. 2010, 30, 2194–2203. [Google Scholar] [CrossRef] [PubMed]
  30. Xi, B.; Huo, S.; Zhang, L. Forecasting municipal solid waste generation with system dynamics modeling in Shenzhen, China. Proceedings of International Conference on Informational Technology and Environmental System Science, Jiaozuo, China, 15–17 May 2008; Volume 2, pp. 902–908. [Google Scholar]
  31. Xiao, S.; Dong, H.; Geng, Y.; Fujii, M.; Pan, H. Greenhouse gas emission mitigation potential from municipal solid waste treatment: A combined SD-LMDI model. Waste Manag. 2021, 120, 725–733. [Google Scholar] [CrossRef]
  32. Phonphoton, N.; Pharino, C. A system dynamic modeling to evaluate flooding impacts on municipal solid waste management services. Waste Manag. 2019, 87, 525–536. [Google Scholar] [CrossRef]
  33. Du, M.; Peng, C.; Wang, X. Quantification of the methane emissions from municipal solid waste landfills in China during the past decade. Renew. Sustain. Energy Rev. 2017, 78, 272–279. [Google Scholar] [CrossRef]
  34. National Bureau of Statistics of China. China Environmental Yearbook 2022; China Statistics Press: Beijing, China, 2022.
  35. Intergovernmental Panel on Climate Change (IPCC). IPCC Guidelines National Greenhouse Gas Inventories; IPCC: Tokyo, Japan, 2006; Available online: https://www.ipcc-nggip.iges.or.jp/public/2006gl/ (accessed on 2 January 2022).
  36. Dong, H.; Geng, Y.; Yu, X.; Li, J. Uncovering energy saving and carbon reduction potential from recycling wastes: A case of Shanghai in China. J. Clean. Prod. 2018, 205, 27–35. [Google Scholar] [CrossRef]
  37. Hammond, G.P.; Jones, C.I. Embodied energy and carbon in construction materials. Proc. Inst. Civ. Eng.-Energy 2008, 161, 87–98. [Google Scholar] [CrossRef]
  38. Xiao, S.; Dong, H.; Geng, Y.; Tian, X.; Liu, C.; Li, H. Policy impacts on municipal solid waste management in Shanghai: A system dynamics model analysis. J. Clean. Prod. 2020, 262, 121366. [Google Scholar] [CrossRef]
  39. Gao, J.; Jiang, Q.; Nie, Z. Accounting and forecasting the total social cost of domestic waste disposal in Shenzhen City. Math. Model. Appl. 2018, 7, 59–68+2. (In Chinese) [Google Scholar]
  40. Yu, Q.; Li, H. Moderate separation of household kitchen waste towards global optimization of municipal solid waste management. J. Clean. Prod. 2020, 277, 123330. [Google Scholar] [CrossRef]
  41. Wei, Y.F. An Economic Analysis of the Domestic Waste Classification Industry in China; Graduate School of the Chinese Academy of Social Sciences: Beijing, China, 2020; (In Chinese). [Google Scholar] [CrossRef]
  42. Yao, Y.B. Research on Low-Carbon Management of Municipal Solid Waste in China Under the Vision of “Carbon Neutrality”: Spatial and Temporal Evolution, Driving Factors, and Emission Reduction Paths; YangZhou University: Yangzhou, China, 2022. (In Chinese) [Google Scholar]
Figure 1. Components related to the assessment of the benefits of the low-carbon MSW management process.
Sustainability 17 01193 g001
Figure 2. MSW generation and GHG emission accounting subsystem.
Sustainability 17 01193 g002
Figure 3. Socio-economic benefits assessment subsystem.
Sustainability 17 01193 g003
Figure 4. Environmental impact assessment subsystem.
Sustainability 17 01193 g004
Figure 5. 2010–2022 China’s MSW treatment process GHG emissions value changes and the contribution of each driving factor.
Sustainability 17 01193 g005
Figure 6. Socio-economic benefits of China’s MSW low-carbon management process under different scenarios in 2020–2050.
Sustainability 17 01193 g006
Figure 7. Cumulative socio-economic benefits of China’s MSW low-carbon management process under different in 2020–2025.
Sustainability 17 01193 g007
Figure 8. Environmental impacts of China’s MSW low-carbon management process under different scenarios in 2020–2050.
Sustainability 17 01193 g008
Figure 9. Cumulative environmental impacts of China’s MSW low-carbon management process under different scenarios in 2020–2050.
Sustainability 17 01193 g009
Figure 10. Composition of environmental impacts of MSW treatment processes under different scenarios in 2020, 2030, 2040 and 2050.
Sustainability 17 01193 g010
Table 1. Scenario description and parameter settings.
ScenarioDriving FactorMethodParameter Setting
Base scenario--The MSW separation rate is 0, and the rest are based on the 2022 level of development.
Scenario 1Emission Intensity effectIncreasing the utilization rate of CH4The CH4 utilization is 40% in 2023, 50% in 2025, 70% in 2035 with 2% annual increases over the period, and 85% in 2050 with 1% annual increases over the period, and the rest are the same as in the base scenario.
Scenario 2Treatment Structure effectIncreasing the incineration rateThe incineration rate is 90% in 2025 and 100% in 2030, with a 2% annual incremental increase during this period to be maintained until 2050, and the rest are the same as in the base scenario.
Scenario 3Generation Intensity effectIncreasing the rate of MSW separationThe MSW separation rate will be 20% in 2020, 40% in 2040 with an annual increase of 2% during the period, and 65% in 2050 with an annual increase of 1% during the period, and the rest will be the same as in the base scenario.
Scenario 4Economic Development effectReducing the amount of per capita MSW generatedPer capita MSW generation is reduced to 90% of the previous level in 2023 and 75% of the previous level in 2038, with 1% annual reductions during this period maintained until 2050, and the rest remains the same as in the base scenario.
Scenario 5Population Scale effectSlowing down the population growth rateThe population growth rate is 0.43% in 2023–2030, 0.33% in 2031–2040, and 0.23% in 2041–2050, and the rest are the same as the base scenario.
Table 2. Quantitative results of the impact degree of each driver of China’s MSW GHG emissions in 2010–2022.
Driving
Factor
2010–20132013–20162016–20192019–2022
Contribution Rate (%)Impact Degree (Mt)Contribution Rate (%)Impact Degree (Mt)Contribution Rate (%)Impact Degree (Mt)Contribution Rate (%)Impact Degree (Mt)
ED207.512540.3115.761915.5377.002702.652.431624.5
PS11.86145.29.77161.717.80127.60.3189.85
GI−83.5−1022.26.45106.8−114.88−823.5−48.24−1494.6
EI0.00280.034−0.005−0.070.02070.15−0.003−0.11
TS−35.87−439.1−31.98−529.1−179.95−1290.0−104.5−3237.9
Disclaimer/Publisher’s Note: The statements, opinions and data contained in all publications are solely those of the individual author(s) and contributor(s) and not of MDPI and/or the editor(s). MDPI and/or the editor(s) disclaim responsibility for any injury to people or property resulting from any ideas, methods, instructions or products referred to in the content.

