Article

Beyond Missing Data: A Multi-Scale Graph Fusion Framework for Sustainable Development Insights

1
School of Software Technology, Dalian University of Technology, Dalian 116620, China
2
Key Laboratory for Ubiquitous Network and Service Software of Liaoning Province, Dalian University of Technology, Dalian 116620, China
*
Author to whom correspondence should be addressed.
Sustainability 2025, 17(3), 1136; https://doi.org/10.3390/su17031136
Submission received: 13 December 2024 / Revised: 15 January 2025 / Accepted: 28 January 2025 / Published: 30 January 2025
(This article belongs to the Special Issue Data-Driven Sustainable Development: Techniques and Applications)

Abstract

:
In the context of sustainable development, particularly in environmental monitoring and resource management, data from multiple heterogeneous sources are often incomplete or inconsistent. This presents a significant challenge for data-driven analysis, especially in tasks like clustering, where the goal is to extract meaningful patterns from multi-view data. Incomplete multi-view clustering (IMVC) aims to address this challenge by effectively leveraging complementary and consistent information despite the missing data. However, traditional graph-based clustering methods that rely on Euclidean distance often fail to capture the complex structures in high-dimensional incomplete data. To overcome this limitation, we propose Motif-Based Multi-Scale Bipartite Graph Fusion (MMBGF_IMC), a novel framework that combines multi-scale measurements with ensemble clustering. By integrating higher-order graph motifs, MMBGF_IMC significantly enhances the representation of inter-instance correlations. Empirical results on seven real-world datasets demonstrate that MMBGF_IMC outperforms existing methods by an average of 5–15% in clustering accuracy (ACC) and normalized mutual information (NMI), offering an effective solution for data fusion, modeling, and mining in sustainable development applications such as ecological monitoring, urban planning, and resource management.

1. Introduction

In the face of increasingly severe global challenges, including resource depletion, environmental degradation, and the pressing need for sustainable development, data-driven approaches have emerged as crucial tools in addressing these issues. Sustainable development, which aims to balance economic, environmental, and social needs, has become a global priority. In this context, big data offers a wealth of information and potential insights that can significantly contribute to the realization of sustainable development goals (SDGs) [1]. From ecological conservation [2] to energy management [3], urban planning [4], and public health [5], diverse fields can benefit from data-driven solutions that enable more informed decision-making. However, the data sources for these applications are often complex, fragmented, and incomplete, making effective data integration and analysis a key challenge in achieving the goals of sustainable development.
Multi-view clustering (MVC) is a powerful technique that can address this challenge by combining information from multiple views or sources to improve the clustering accuracy and robustness compared to single-view methods [6,7,8,9,10]. In real-world applications, data are often collected from multiple sources that offer different perspectives on the same underlying objects, such as sensor data, satellite images, or social media content. Multi-view clustering has the potential to provide a more comprehensive understanding by integrating these diverse data sources. However, existing MVC methods struggle with specific problems: they often assume complete data across all views, which is rarely the case in practice. Missing or partial data in certain views are a common issue, especially when data are collected from heterogeneous sources. This problem is particularly evident in areas like environmental monitoring, where sensors might fail, or in healthcare, where data are often sparse across different domains. Hence, addressing the issue of data incompleteness in multi-view clustering is critical for enabling its widespread application in real-world scenarios, particularly in the context of sustainable development.
To overcome these challenges, graph-based incomplete multi-view clustering (IMVC) methods have been developed to manage missing data by employing strategies that complete or infer the absent views. Graph-based methods, especially spectral clustering, have proven to be highly effective in capturing the complex relationships and intrinsic structures within data [11,12,13,14]. Spectral clustering typically involves constructing similarity graphs for each view, followed by the computation of the eigenvectors of the graph’s Laplacian matrix to partition the data into clusters [15,16]. These methods have shown significant promise in multi-view clustering tasks, particularly in high-dimensional or heterogeneous datasets. However, these methods are constrained by their reliance on Euclidean distance metrics, which fall short in capturing the non-linear and intricate structures inherent in high-dimensional, incomplete data [17,18]. This limitation is particularly problematic in sustainable development applications, where data from diverse sources such as environmental sensors, satellite imagery, and health records exhibit complex relationships that are not effectively modeled by traditional similarity measures. Moreover, when the data are incomplete, traditional graph-based methods tend to struggle, as missing data in one or more views can lead to inaccurate or suboptimal clustering results. For instance, certain approaches construct similarity graphs for each view and apply weighted fusion techniques to mitigate the impact of missing data.
In this paper, we propose a novel approach to incomplete multi-view clustering by introducing motif-based bipartite graph fusion. The motivation behind our method stems from the need to effectively integrate complementary and consistent information from multiple views while overcoming the limitations of existing IMVC techniques. By leveraging multi-scale measurement techniques and ensemble clustering, our method constructs robust bipartite similarity graphs that can accommodate varying neighborhood structures and capture complex relationships within the data. This approach not only addresses the challenge of data incompleteness but also captures more nuanced relationships between data points by integrating information across different scales and views. By using multi-scale measurements and various k-nearest neighbor strategies, our method creates more reliable similarity graphs, improving the clustering accuracy and robustness. The motif-based graph fusion further enhances the integration of diverse views, leading to more effective multi-view clustering, especially in the presence of missing data.
The main contributions of this work are as follows:
  • We introduce a novel incomplete multi-view clustering framework that integrates multi-scale measurements and ensemble clustering into the graph construction process, generating robust bipartite similarity graphs.
  • We propose a motif-based multi-scale bipartite graph fusion method that effectively integrates information from multiple views, addressing data incompleteness while preserving the underlying structural relationships.
  • We demonstrate the effectiveness and robustness of our method through experiments on several benchmark datasets, highlighting its ability to handle incomplete and heterogeneous data in the context of sustainable development research.
Our method represents a significant advancement in the field of multi-view clustering, providing a more accurate and robust solution to the challenge of incomplete data. It holds great potential for real-world applications in sustainable development, where data from diverse sources are often incomplete, fragmented, or noisy. By enhancing the ability to integrate and analyze multi-view data, our approach can contribute to more informed decision-making in critical areas such as environmental monitoring, resource management, healthcare, and urban planning.

2. Materials and Methods

2.1. Preliminaries

Spectral clustering, which relies on graph theory, is widely recognized for its effectiveness in identifying clusters within complex data structures. Given a data matrix X = x 1 , x 2 , , x n , where each instance x i R d × 1 , spectral clustering models these instances as nodes in a graph G = ( X , A ) , with A i j representing the similarity between instances x i and x j [19]. A common similarity function is the Gaussian kernel, defined as follows:
A i j = exp x i x j 2 2 2 σ 2 ,
where σ determines the rate of similarity decay with respect to the distance between instances. The degree matrix D of the graph G , which encodes the connectivity of nodes, is computed as follows:
d i = j = 1 n A i j .
Spectral clustering seeks to find a low-dimensional representation F R n × c for clustering purposes by solving the following optimization problem:
min F T F = I Tr ( F T L F ) ,
where Tr(·) denotes the trace operation and L R n × n is the Laplacian matrix of the graph, defined as L = D A for an unnormalized graph, or L = I D 1 2 A D 1 2 for a normalized graph. Equation (3) is an eigenvalue decomposition problem, whose solution involves the eigenvectors corresponding to the first c smallest eigenvalues of L . These eigenvectors form the new representation F , which is subsequently clustered using the k-means algorithm.
Spectral clustering is particularly suited for multi-view data due to its ability to capture the intrinsic geometry of the data manifold, which is often multi-modal and high-dimensional. By leveraging the eigenvectors of the Laplacian matrix, spectral clustering effectively integrates information from multiple views, facilitating the discovery of clusters that are consistent across different data representations. This makes it an ideal choice for incomplete multi-view clustering (IMVC), where data from some views may be missing or incomplete.

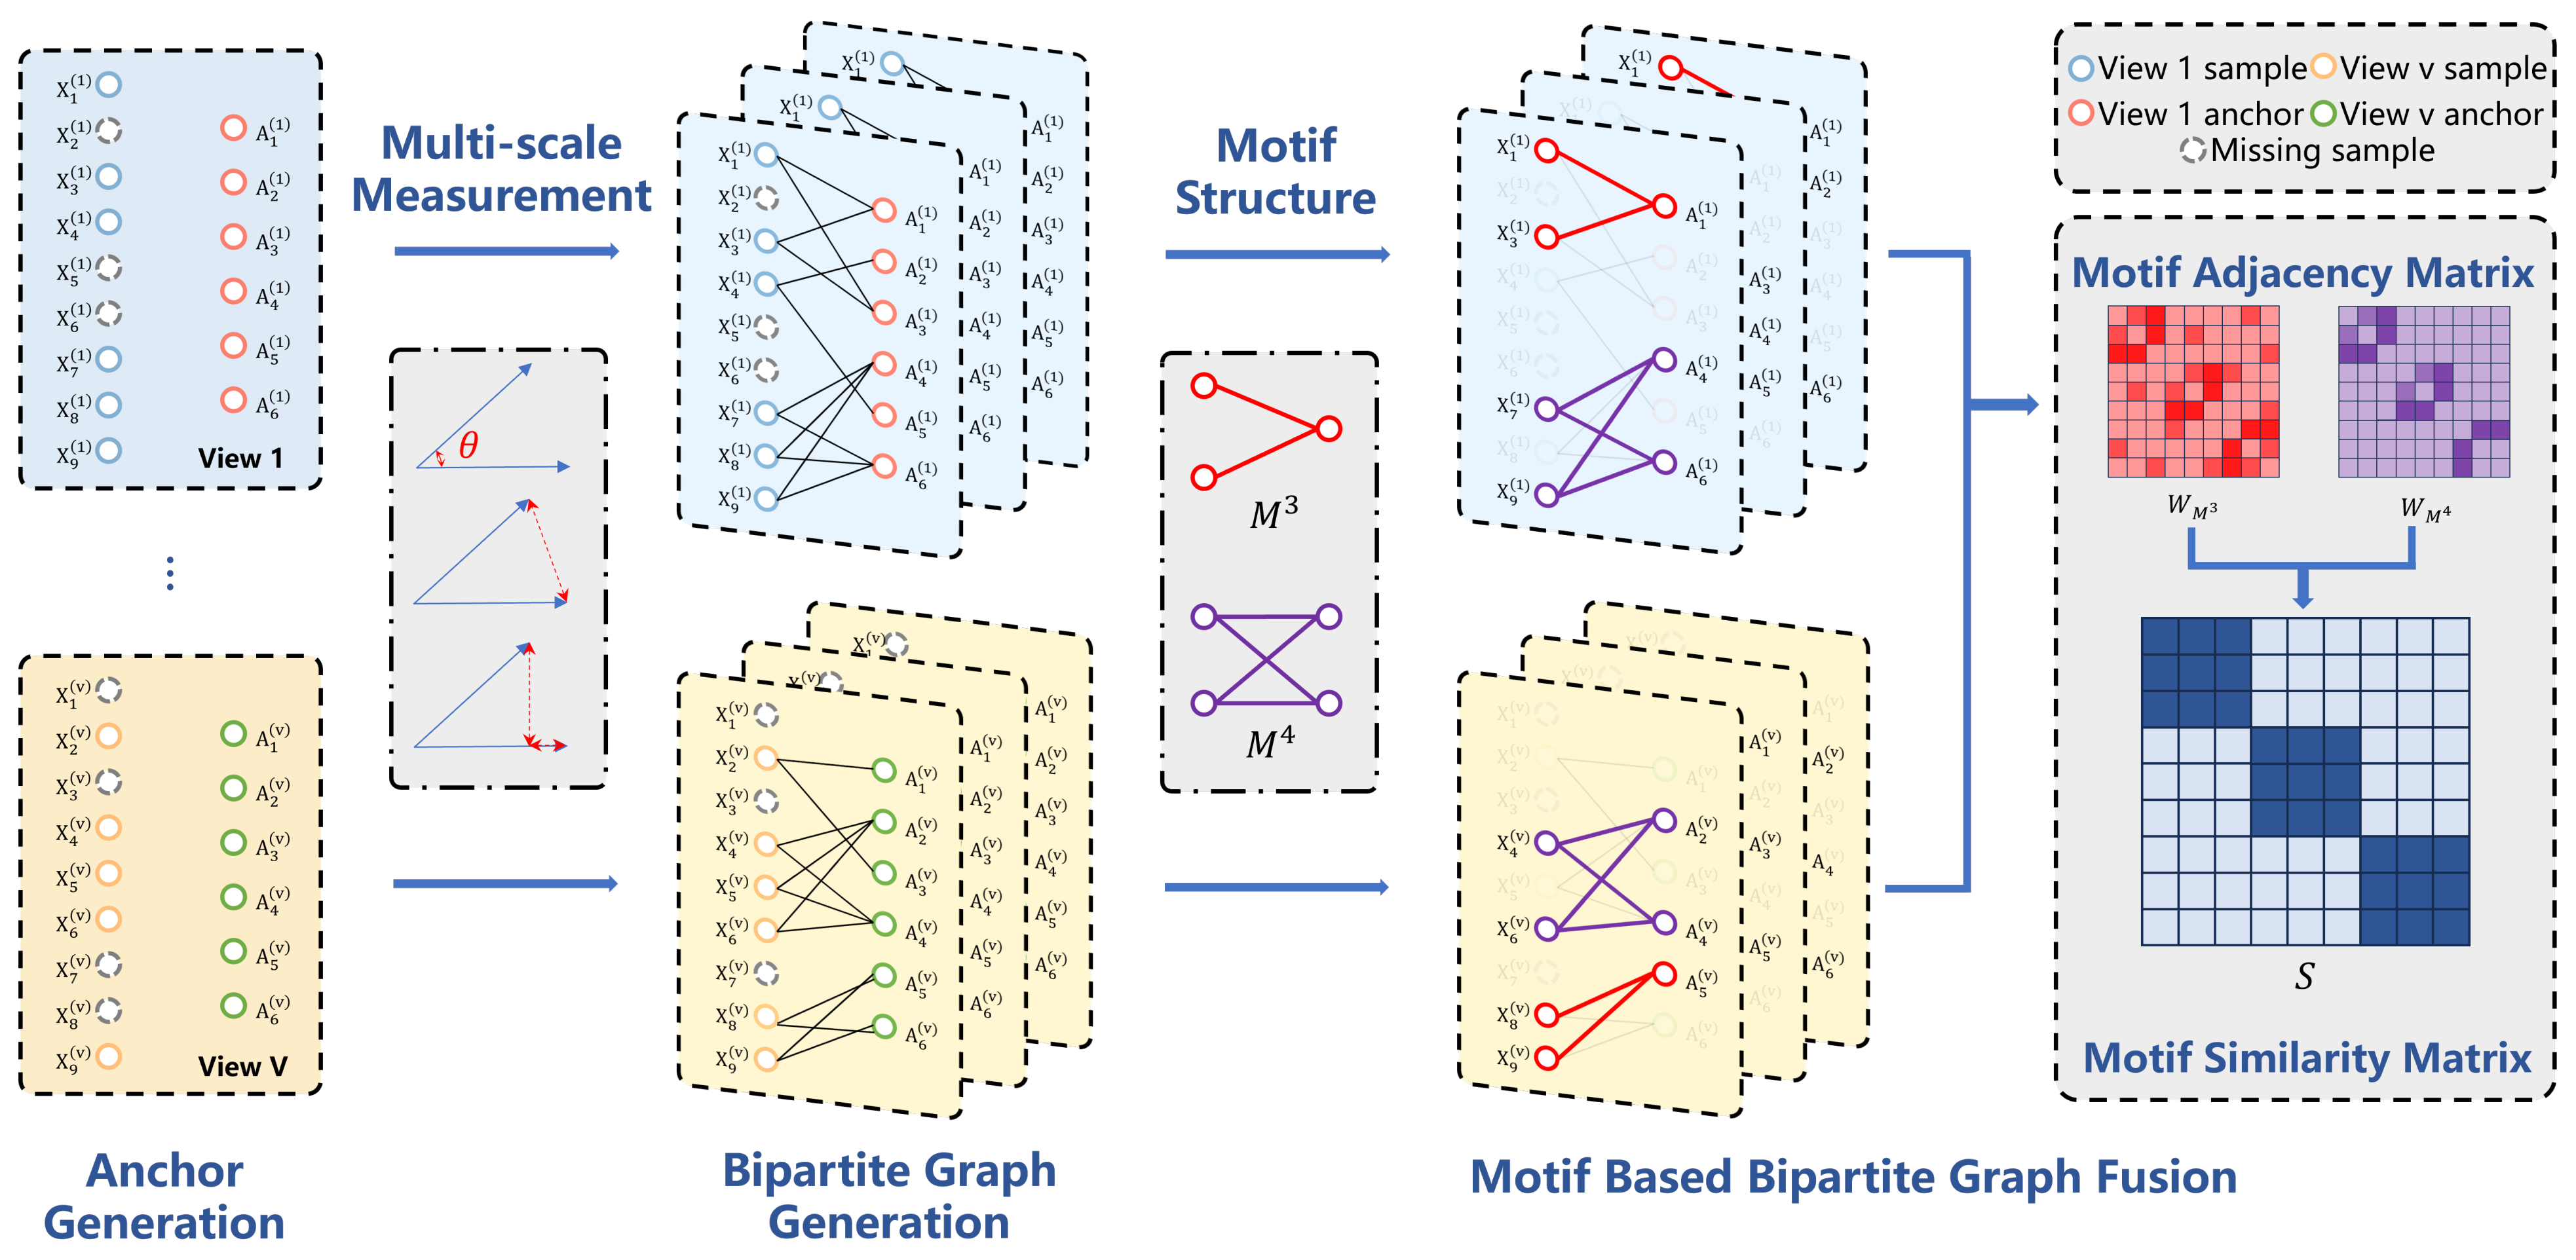
2.2. Multi-Scale Anchor Bipartite Graph

Let X ( 1 ) , X ( 2 ) , , X ( V ) denote the multi-view data with V views, where X ( v ) R N × d v , with N representing the number of samples and d v the feature dimension of the v-th view. Specifically, the data are divided into incomplete and complete subsets for each view: X I = { X I ( v ) } and X C = { X C ( v ) } , where X I ( v ) R N I ( v ) × d v and X C ( v ) R N C ( v ) × d v represent incomplete and complete samples, respectively, in the v-th view.
To construct the similarity graphs for each view, we use an anchor-based approach to capture the intrinsic structural relationships. Anchors serve as representative points, and several selection strategies exist, such as random selection or k-means-based selection. In this work, we use a hybrid anchor selection strategy [20], which balances the efficiency of random selection with the representativeness of k-means clustering. Specifically, a subset of candidate anchors is randomly selected to ensure diversity and computational efficiency, and then k-means clustering is applied to these candidates to identify the most representative anchor points. This combined approach leverages the strengths of both methods, resulting in a more robust and representative set of anchors. For each v-th view, this strategy selects p anchors by first randomly selecting p candidate anchors from X C ( v ) , where p < p N , followed by the k-means algorithm to obtain p cluster centers as the anchor set A ( v ) .
Once the anchor points are selected for each view, we proceed to construct the anchor bipartite graphs. The anchor bipartite graph is a two-layer graph where one layer represents the original samples and the other layer represents the anchor points. The edges between the two layers signify the similarity between samples and their nearest anchors. This bipartite structure reduces computational complexity and memory usage, making it suitable for large-scale datasets.
To fully exploit the geometric structure within each view, we construct anchor bipartite graphs using multi-scale measurement techniques. For each sample X i ( v ) X C ( v ) and anchor A j ( v ) , we measure the similarity between them using multiple scales. Specifically, we compute the distance between X i ( v ) and A j ( v ) using five different distance metrics including Euclidean, Cosine, Correlation, Chebyshev, and Jaccard. Each distance metric captures a different aspect of similarity, allowing the framework to integrate diverse perspectives on data relationships.
Each scale corresponds to a distinct base cluster in ensemble clustering, enhancing the robustness of the similarity graph. For each sample X i ( v ) , we randomly select its k-nearest neighbors, where k ranges from 3 to 5. This variability in k introduces multiple perspectives on neighborhood structures, which are crucial for capturing the inherent data manifold’s complexity. Using these nearest neighbors, we construct a sparse bipartite graph B = { b i j } N × p , where the following hold:
b i j = 1 , if X i ( v ) X C ( v ) and A j ( v ) N K ( X i ( v ) ) , 0 , otherwise ,
This multi-scale approach ensures that the similarity graph captures both local and global structural information, thereby improving the clustering performance, especially in the presence of incomplete data. The resulting bipartite graphs encapsulate multiple neighborhood relationships, which are later fused to form a comprehensive similarity matrix.

2.3. Motif-Based Bipartite Graph Fusion
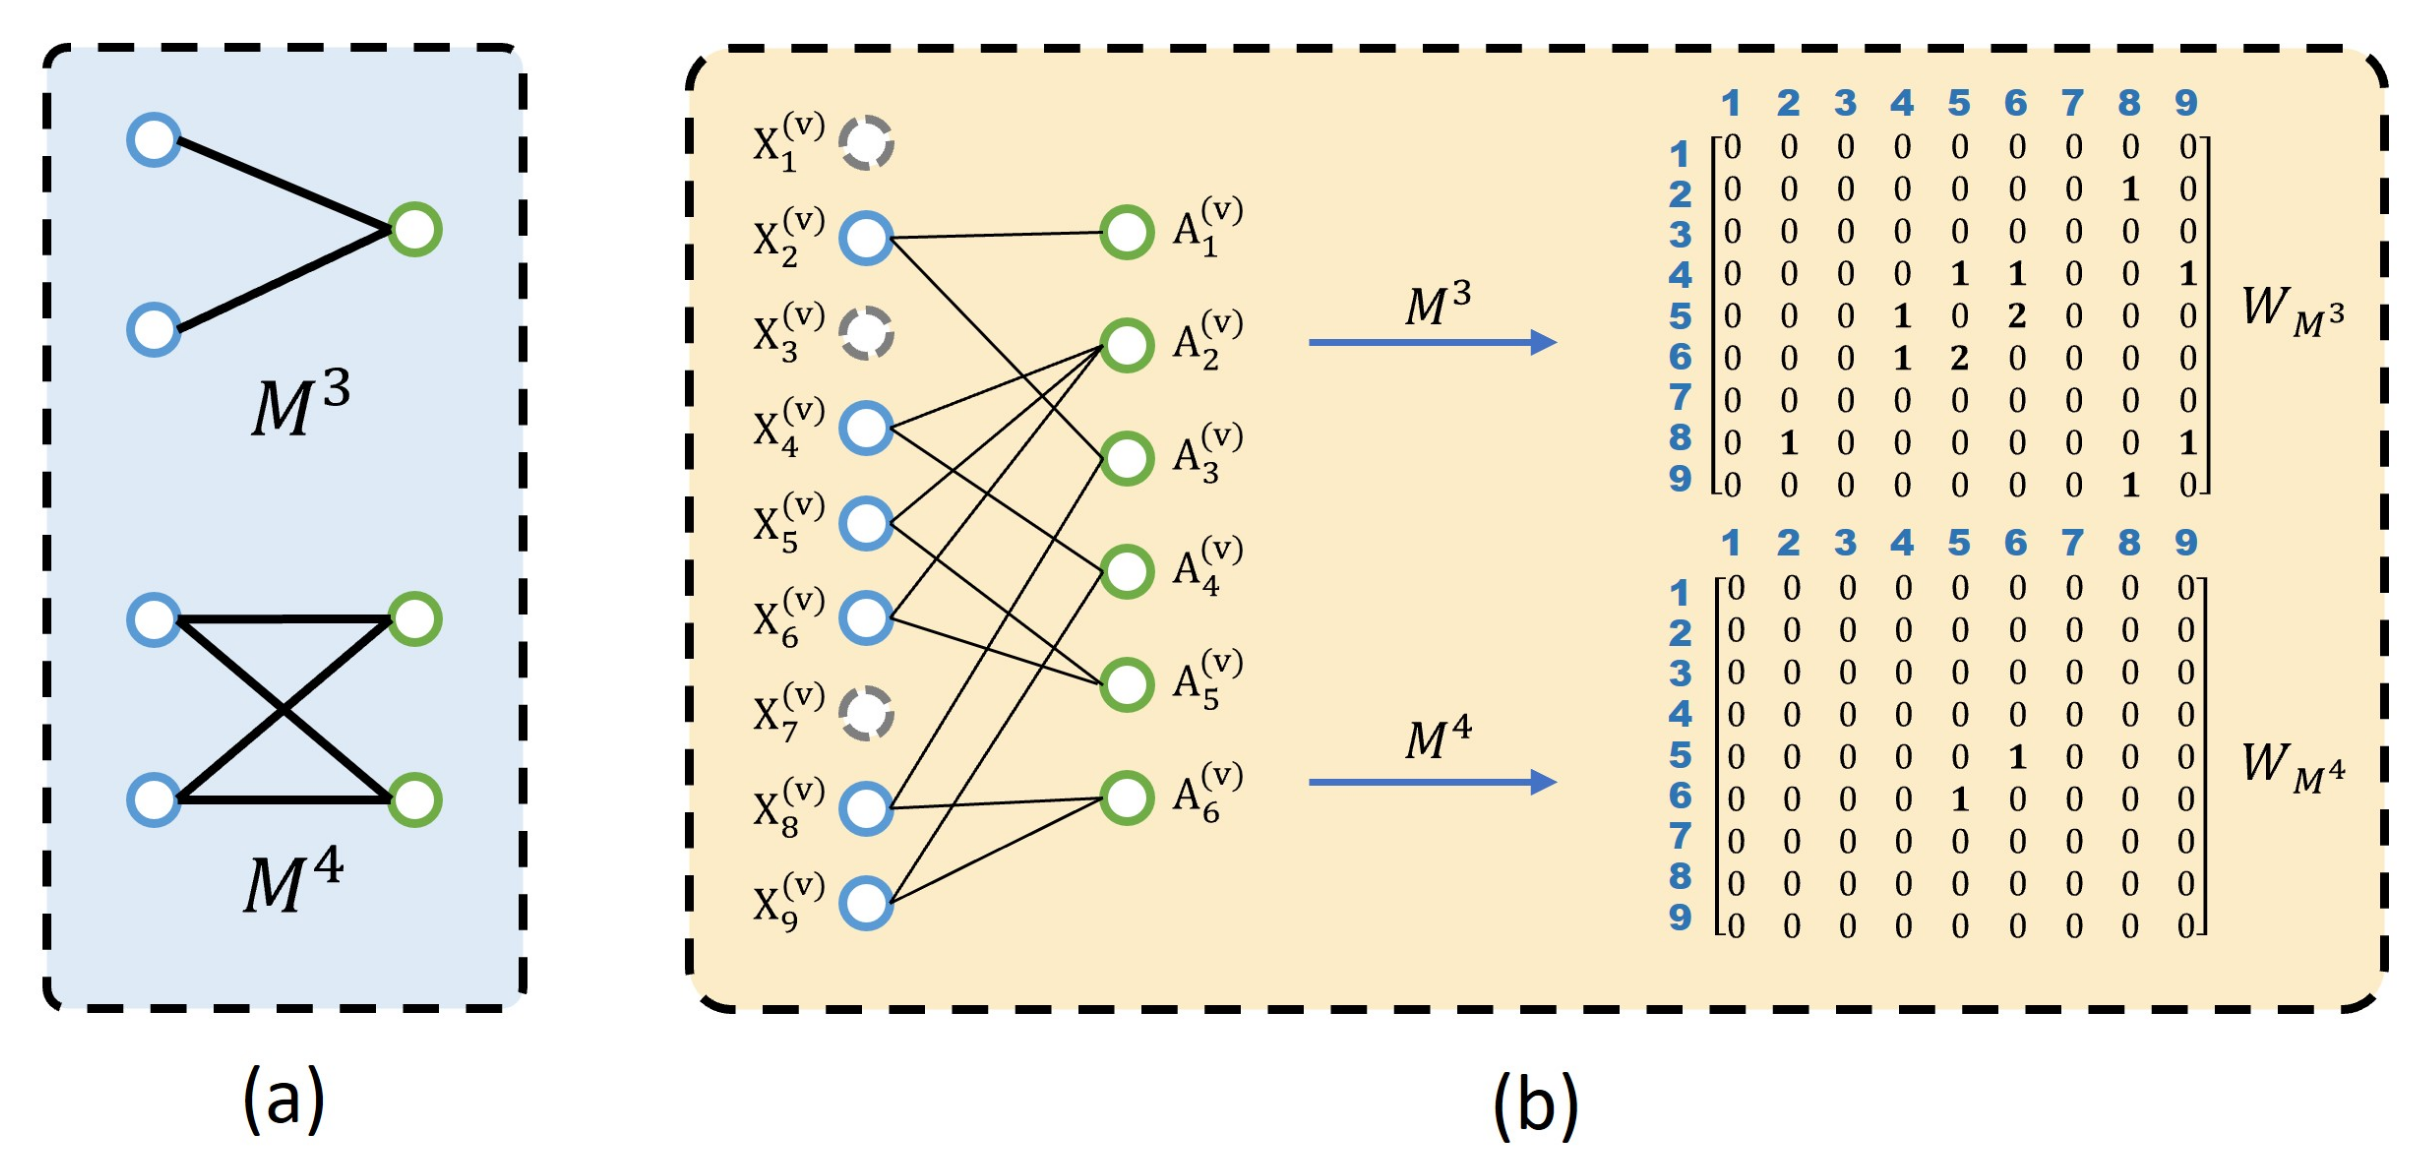
Motifs, which capture higher-order interactions in networks, are pivotal in understanding complex graph structures [21]. We extend the concept of motifs, traditionally applied to networks, to bipartite graphs. In our method, a motif is defined as a subgraph consisting of undirected links, as shown in Figure 1a. The third-order ( M 3 ) and fourth-order ( M 4 ) motifs are considered, and their corresponding motif adjacency matrices W M are constructed from the bipartite graphs generated earlier.

2.3.1. Third-Order Motif ( M 3 )

For the third-order motif, the motif adjacency matrix W M 3 , s ( v ) is computed by counting the number of shared anchors between each pair of instances within a specific view v and scale s. Mathematically, this can be expressed as follows:
W M 3 , s ( v ) ( i , j ) = k = 1 p I ( B i , k ( v ) = 1 B j , k ( v ) = 1 )
where I ( · ) is the indicator function that returns 1 if both instances i and j are connected to anchor k in view v at scale s, and 0 otherwise. This formulation effectively captures the number of shared anchors between each pair of instances, thereby reflecting their similarity based on third-order interactions.

2.3.2. Fourth-Order Motif ( M 4 )

For the fourth-order motif, the motif adjacency matrix W M 4 , s ( v ) accounts for pairs of instances that co-occur with pairs of anchors within the same view v and scale s. This higher-order interaction is captured by the following:
W M 4 , s ( v ) ( i , j ) = k 1 = 1 p 1 k 2 = k 1 + 1 p I ( B i , k 1 ( v ) = 1 B j , k 1 ( v ) = 1 B i , k 2 ( v ) = 1 B j , k 2 ( v ) = 1 )
This equation calculates the number of times each pair of instances simultaneously connects to any pair of anchors ( k 1 , k 2 ) across all views v and scales s. By doing so, W M 4 , s ( v ) captures more complex structural relationships, reflecting the consistency and collaborative connections between instances across multiple anchors.
The consensus motif adjacency matrix is then obtained by summing the motif adjacency matrices across all views and scales:
W m = v = 1 V s = 1 c W m , s ( v ) + W m , s ( v ) T
This aggregation captures the higher-order structural information from all views and scales, ensuring that the consensus similarity matrix S reflects the collective insights from the multi-view data.
The consensus similarity matrix is derived by combining the motif adjacency matrices for third-order and fourth-order motifs:
S = W m 3 + log ( W m 3 + 1 ) + log ( W m 4 + 1 )
The combination of third-order and fourth-order motifs allows the similarity matrix to encapsulate both triadic and tetradic relationships among data instances, providing a richer representation of the data’s structural properties. The logarithmic transformation ensures that the influence of higher motif counts is tempered, preventing domination by overly connected motifs.
The resulting matrix S represents a global consistency graph that is used in spectral clustering. To perform spectral clustering, we compute the Laplacian matrix L = D S , where D is the degree matrix with diagonal entries D i , i = j = 1 n S i , j . By performing singular value decomposition (SVD) on L , we obtain the latent representation V , which is then clustered using the k-means algorithm.
An overview of the proposed framework is shown in Figure 2, and the complete procedure is outlined in Algorithm 1.
Algorithm 1 Motif-based multi-scale bipartite graph fusion for incomplete multi-view clustering
Input: 
Original incomplete multi-view data { X ( v ) } v = 1 V ; Number of anchors p; Range of scales c; Number of nearest neighbors k; Distance metrics { D i s t ( s ) } s = 1 c ;
Output: 
Final clustering results.
1:
Initialize anchor sets { A ( v ) } v = 1 V using a hybrid strategy;
2:
Initialize empty set for bipartite graphs { B ( v ) } v = 1 V
3:
for  v = 1 to V do
4:
   for  s = 1 to c do
5:
     Compute D i s t ( X i ( v ) , A j ( v ) , s ) for each sample X i ( v ) X C ( v ) and anchor A j ( v ) ;
6:
     Select k s nearest anchors based on the computed distance;
7:
     Update bipartite graph B s ( v ) with selected anchors;
8:
   end for
9:
   Fuse multi-scale bipartite graphs to form  B ( v ) by Equation (4);
10:
end for
11:
Extract motif adjacency matrices W m 3 , s ( v ) and W m 4 , s ( v ) from { B ( v ) } v = 1 V using third-order and fourth-order motifs as defined in Equations (5) and (6);
12:
Compute the consensus motif adjacency matrix W m 3 and W m 4 by Equation (7)
13:
Compute consensus similarity matrix S using Equation (8)
14:
Spectral Clustering:
15:
Compute Laplacian matrix L = D S ;
16:
Perform Singular Value Decomposition (SVD) on L to obtain latent representation V ;
17:
Apply k-means clustering on V to obtain final clusters;
18:
return Final clustering results;

2.4. Computational Complexity

The proposed Motif-Based Multi-Scale Bipartite Graph Fusion for Incomplete Multi-View Clustering (MMBGF_IMC) framework comprises several key components, each contributing to the overall computational complexity. The complexity analysis for each component is detailed below:
  • Anchor Selection: The hybrid strategy involves a two-step process: random selection followed by k-means clustering. Selecting p candidate anchors randomly from the complete subset X C ( v ) has a linear complexity of O ( N p V d v ) , where N is the number of samples, p is the number of anchors, V is the number of views, and d v is the feature dimension of the v-th view. Applying the k-means algorithm to the p candidate anchors to obtain p cluster centers incurs a complexity of O ( N p V d v ) . The combined complexity for anchor selection is therefore O ( N p V d v ) .
  • Similarity Graph Construction: For each scale and view, computing distances between samples and anchors, followed by identifying the k-nearest neighbors, incurs a complexity of O ( N p V c d v ) , where c is the number of scales.
  • Motif Extraction: Extracting motifs from bipartite graphs involves identifying higher-order interactions. The complexity for motif extraction is the following:
    For the third-order motif ( M 3 ), the complexity is O ( p · m 2 ) , where m is the average number of anchors connected to each instance.
    For the fourth-order motif ( M 1 4 ), the complexity is O ( p 2 · N ) , where N is the number of instances and p is the number of anchors.
    Given that two motif types ( M 3 and M 1 4 ) are considered, the total complexity for motif extraction becomes O ( p · m 2 + p 2 · N ) .
  • Spectral Clustering: The eigenvalue decomposition required for spectral clustering traditionally has a complexity of O ( N 3 ) in the worst case. However, utilizing fast approximate methods can reduce this to O ( k 3 ) + O ( k n t ) , where k is the number of clusters and t is the number of iterations in the algorithm.
Overall Time Complexity: Summing the complexities of all components, the overall time complexity of the MMBGF_IMC framework is dominated by the spectral clustering step, especially for large values of N. However, with the application of approximate spectral clustering methods, the overall complexity can be effectively managed. The cumulative time complexity can be expressed as O ( N p V c d v ) . This indicates that the framework scales linearly with respect to the number of samples (N) and the number of views (V), making it suitable for large-scale applications. The linear scalability ensures that the framework remains computationally feasible even as the dataset size and the number of views increase.
Space Complexity: In addition to time complexity, space complexity is an important consideration, especially for large-scale datasets. The space complexity is primarily influenced by the storage of similarity graphs and motif adjacency matrices, which require O ( N p V c ) space. Efficient data structures and sparse representations can be employed to optimize memory usage, further enhancing the framework’s scalability.

3. Experiments

Experimental Settings

We assess the performance of various methods on four widely used multi-view datasets: ALOI [22], BBC4 [23], ORL [24], OutScene [25], YALE [26], BDGP [27], and Reuters [28]. Detailed statistics and descriptions of these datasets are presented in Table 1. To simulate incomplete data, we initially select a subset of instances based on varying paired rates and subsequently randomly remove one view from the remaining instances. We generate incomplete datasets with paired rates ranging from 0.1 to 0.9 in increments of 0.2.
We compare the proposed MMBGF_IMC method against several state-of-the-art Incomplete Multi-View Clustering (IMVC) algorithms, including UEAF [29], CBG [30], BSV [31], CONCAT [31], BGIMVSC [32], SAGF_IMC [33], and GIMVC [34]. For each method, we conduct experiments 10 times and report the average performance along with the standard deviation. Clustering performance is evaluated using three metrics: clustering accuracy (ACC), normalized mutual information (NMI), and adjusted rand index (ARI). We employ the default hyperparameters as recommended in the original publications of the respective methods. All experiments are performed on a server equipped with an Intel(R) Xeon(R) Silver 4214 processor, 128 GB of RAM, and MATLAB R2023b (64-bit).

4. Results

4.1. Experimental Results and Analysis

The experimental results for various methods on the incomplete multi-view datasets are summarized in Table 2. The best results for each dataset are highlighted in bold. We make the following key observations based on the results:
Among the evaluated methods, the proposed MMBGF_IMC consistently outperforms competing approaches across most datasets and metrics, demonstrating its superior capability in handling incomplete multi-view data through multi-perspective structural analysis.
MMBGF_IMC exhibits remarkable robustness and stability across varying paired rates, maintaining high performance even as the proportion of missing data changes. This stability is particularly evident when compared to other spectral clustering-based methods, which exhibit higher sensitivity to fluctuations in paired rates. The method’s ability to consistently achieve the highest scores in clustering accuracy (ACC) and normalized mutual information (NMI) underscores its effectiveness in capturing the underlying structures of diverse data types, including images, text, and gene sequences.
When compared to baseline methods such as BSV and CONCAT, multi-view learning-based Incomplete Multi-View Clustering (IMC) methods, including MMBGF_IMC, demonstrate significant advantages by capturing more comprehensive information from incomplete datasets. This superiority highlights the limitations of simple imputation techniques, such as setting missing instances or graphs to zero or averaging, which are inadequate for addressing incomplete clustering problems. In contrast, MMBGF_IMC’s approach of thoroughly exploring the aligned information among available views proves to be a more effective strategy for tackling the complexities inherent in IMC tasks.
Furthermore, while certain graph learning-based and kernel learning-based methods (e.g., SAGF_IMC and BGIMVC) perform exceptionally well on specific datasets such as BDGP, YALE, and OutScene, they encounter significant challenges when applied to larger-scale datasets like Reuters due to memory constraints. The analysis reveals that graph learning-based methods generally achieve more discriminative representations than matrix factorization (MF)-based IMC methods, underscoring the critical role of accurately capturing the geometric structure of data in unsupervised clustering tasks. However, these graph- and kernel-based approaches necessitate the computation of multiple n × n graph or kernel matrices for datasets with n samples, resulting in substantial memory storage requirements and thereby limiting their scalability. This limitation highlights the advantage of MMBGF_IMC in efficiently handling large and complex datasets without compromising performance.
The BDGP dataset, in particular, exhibits distinct characteristics compared to other datasets, primarily due to the inherent unavailability of certain original instances, which are represented as zero vectors. This inherent incompleteness poses significant challenges for the proposed MMB_IMC method, especially under low-paired-rate scenarios. MMB_IMC relies on constructing multi-scale anchor bipartite graphs and subsequently fusing them through motif-based mechanisms to derive a consensus similarity matrix. In the context of BDGP, the presence of zero vectors disrupts the accurate construction of bipartite graphs. Specifically, zero vectors can lead to misleading similarity measurements, as the distance metrics may not effectively capture the true relationships between instances and anchors. This distortion is exacerbated when the paired rate is low, resulting in a limited number of reliable paired instances to anchor the graph construction.
Additionally, the motif-based fusion process depends on the integrity of the bipartite graphs across multiple scales. With a scarcity of valid paired data, the motifs extracted from these graphs become less representative of the underlying data structure, leading to an unreliable consensus similarity matrix. Consequently, the spectral clustering stage, which operates on this consensus matrix, suffers from reduced accuracy and robustness, manifesting in poorer clustering performance metrics.
In summary, while no single IMC method consistently delivers superior performance across all types of datasets, MMBGF_IMC stands out for its robust generalization capabilities, methodological flexibility, and balanced performance across multiple metrics. These attributes make it a versatile and reliable choice for multi-view clustering tasks in real-world scenarios characterized by incomplete and diverse datasets. Future research could focus on integrating MMBGF_IMC with advanced deep learning techniques to further enhance its scalability and applicability to even larger and more complex datasets, as well as exploring its effectiveness in other data domains such as audio or time-series data.

4.2. Ablation Study

To validate the contribution of each component in our framework, we conduct an ablation study by comparing MMBGF_IMC with three variants that progressively eliminate key parts of the model:
Numbered lists can be added as follows:
  • w.o. MS (without multi-scale part): This version evaluates the distances between samples using a standard Euclidean metric, without the multi-scale analysis;
  • w.o. MF (without motif fusion part): This variant employs the multi-scale analysis but omits the motif fusion component, relying on the similarity matrix v = 1 V B ( v ) · B ( v ) T to perform spectral clustering;
  • w.o. MS and MF (without both components): This version excludes both the multi-scale and motif fusion parts, essentially reducing the method to a basic spectral clustering approach.
Table 3 presents the results of this ablation study in the Out-Scene data set with a paired rate of 0.5. Performance metrics (NMI, ACC, and ARI) clearly show the following:
  • MMBGF_IMC outperforms all variants, demonstrating that both multi-scale analysis and motif fusion contribute significantly to its superior performance;
  • Without the multi-scale part (w.o. MS), the method performs noticeably worse, highlighting the importance of capturing hierarchical structures in the data;
  • Excluding motif fusion (w.o. MF) also leads to a performance drop, underscoring the role of motif fusion in combining complementary information from different views.
Table 3. Ablation study on Out-Scene with 0.5 paired rate. It is shown in bold for the best results.
MethodsmeanNMImeanAccmeanARI
w.o. MS0.50550.63470.3705
w.o. MF0.49880.61460.3624
w.o. MS & MF0.48730.59470.3634
MMBGF_IMC0.52720.67270.4103
These findings confirm that both components are crucial for achieving the best clustering performance.

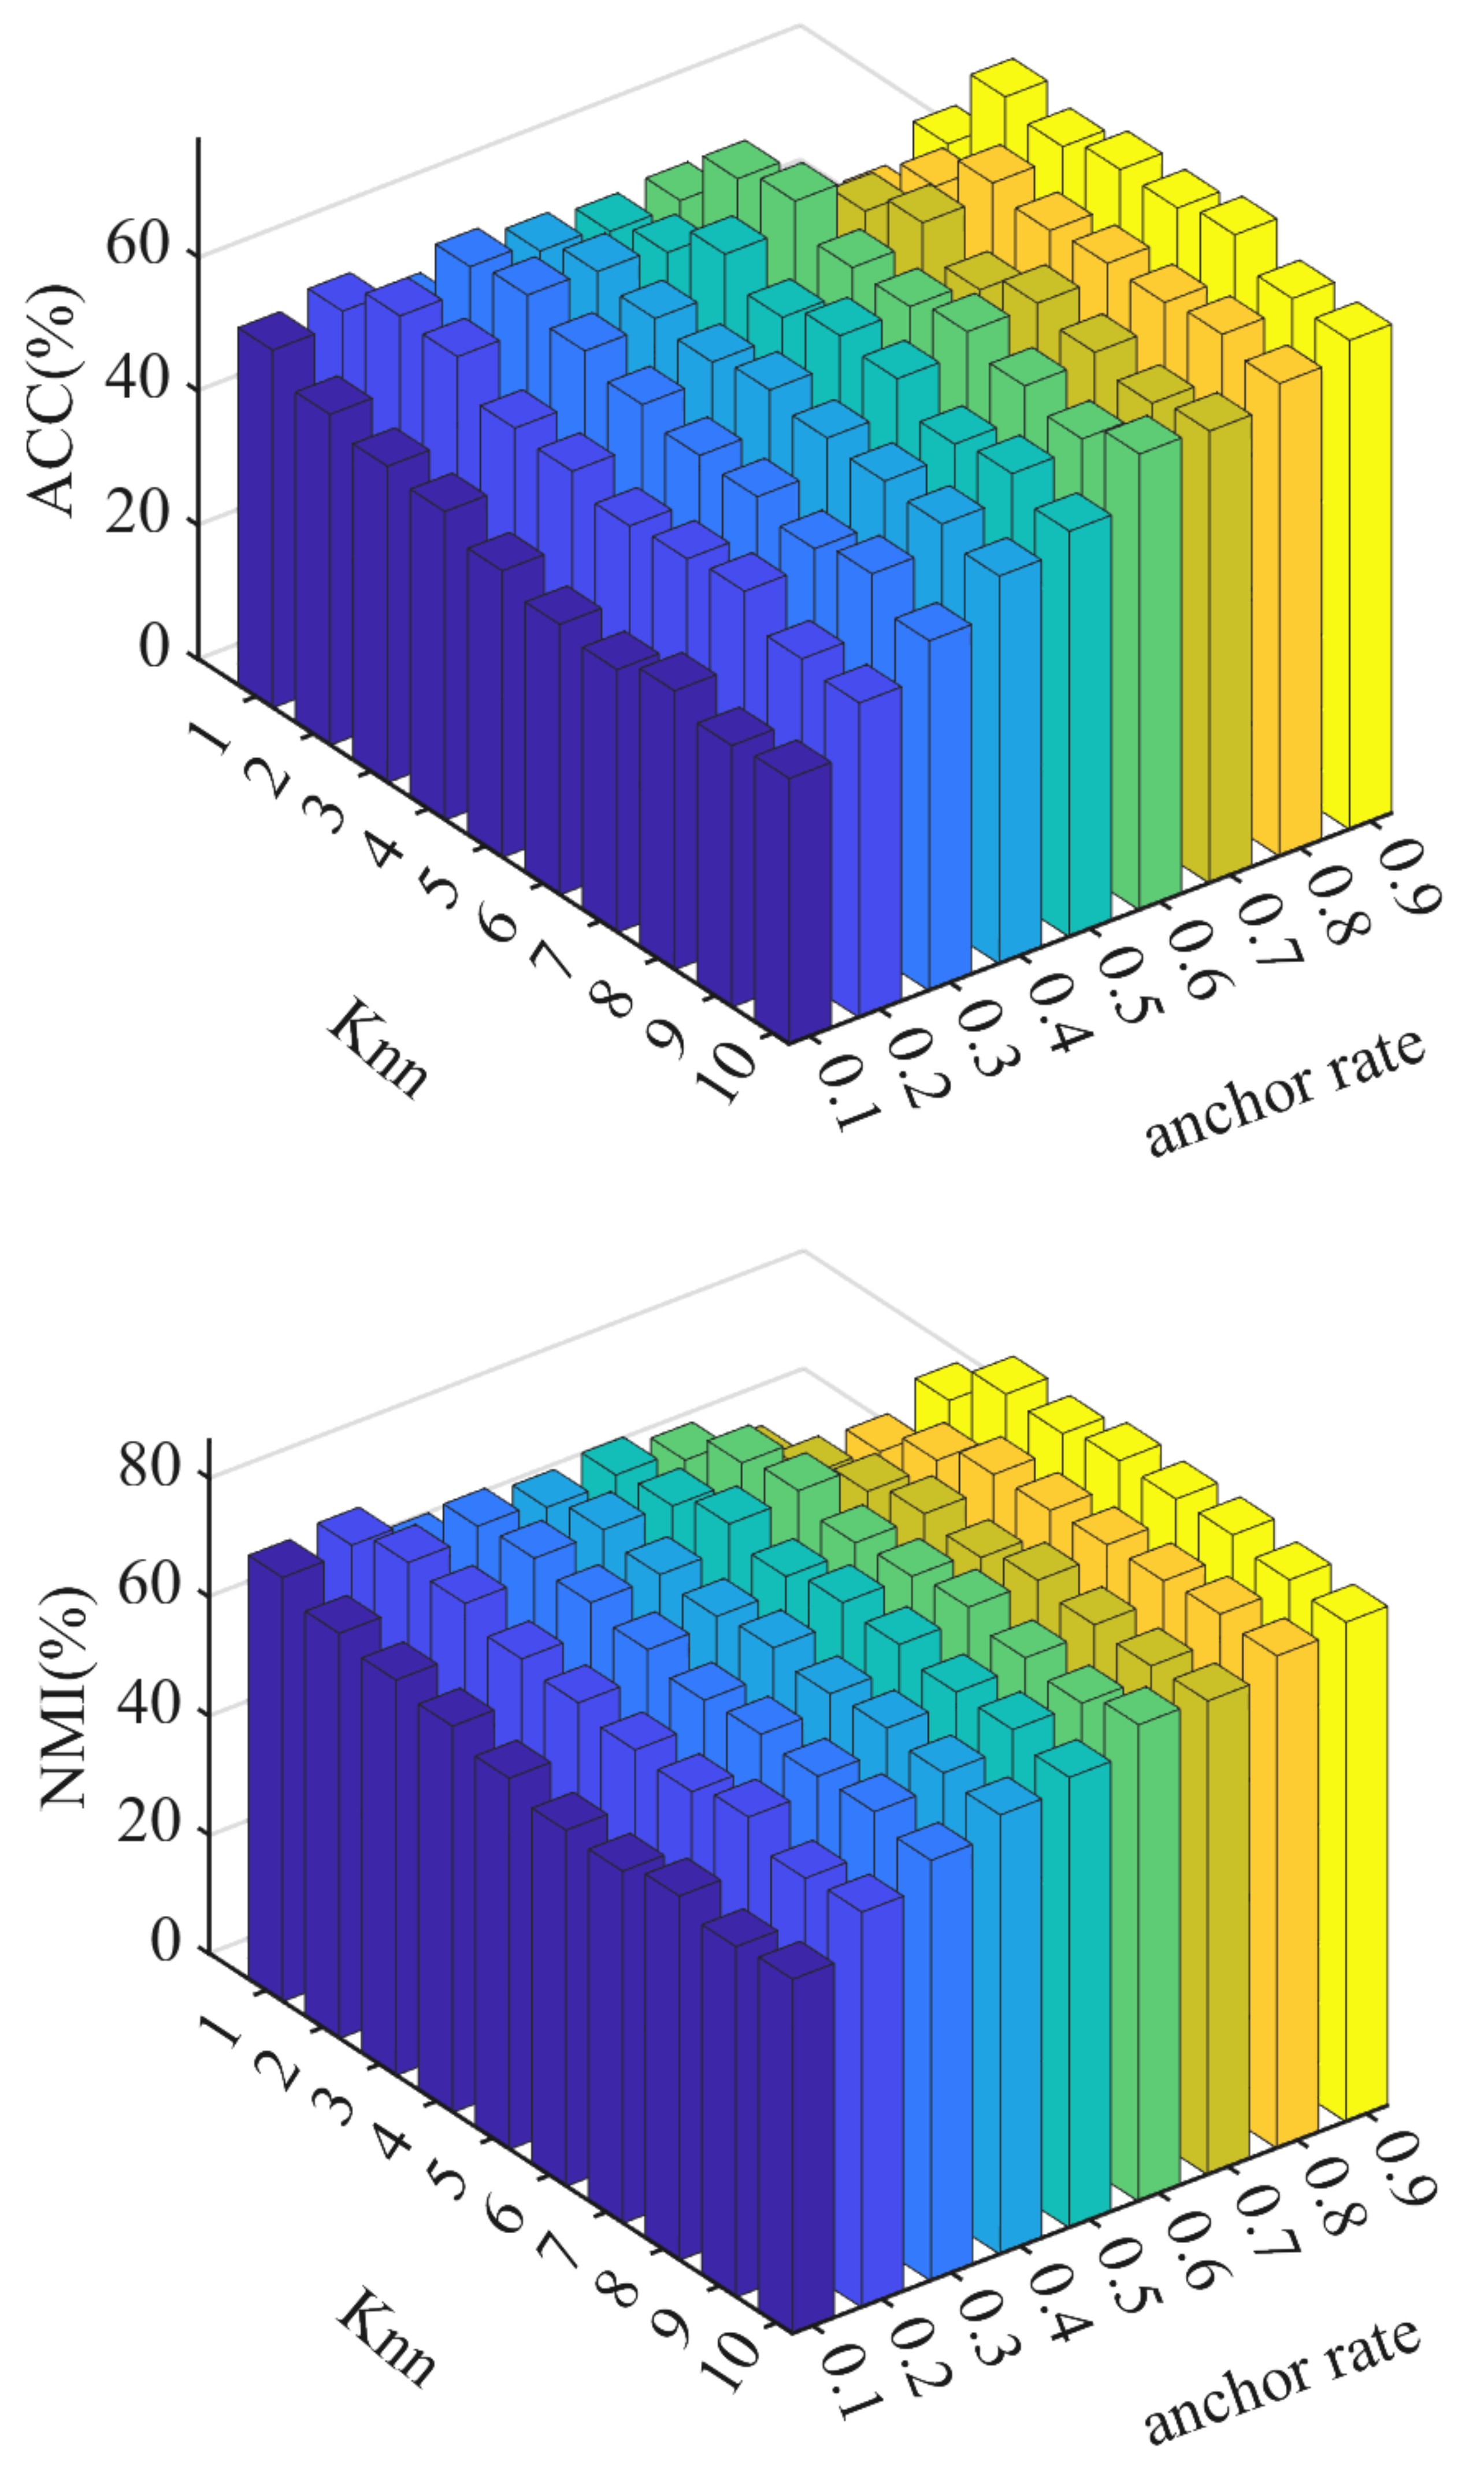
4.3. Parameter Study

To optimize the performance of MMBGF_IMC, we performed a parameter study focusing on the number of nearest neighbors (Knn) and the anchor rate. We explore Knn values in the range of [1, 10] and anchor rates in the range of [0.1, 0.9]. The results, shown in Figure 3, demonstrate the following:
  • Sensitivity to anchor rate: MMBGF_IMC is more sensitive to changes in the anchor rate than the number of nearest neighbors. As the anchor rate increases, performance improves, particularly in terms of ACC and NMI;
  • Effect of Knn: For larger datasets, performance improves with Knn values in the range of 7–10, while for smaller datasets, Knn values in the range of 3–5 yield the best results;
Figure 3. ACC and NMI w.r.t. different #Knns and anchor rates on ORL.
Sustainability 17 01136 g003
Based on these observations, we set the anchor rate to 0.2 and Knn to 7–10 for large datasets. For smaller datasets, the anchor rate is set to 0.8 and Knn to 3–5. These settings provide a good balance between performance and computational efficiency.

5. Conclusions

5.1. Main Conclusions

This study introduces a novel Motif-Based Multi-Scale Bipartite Graph Fusion for Incomplete Multiview Clustering (MMBGF_IMC), specifically designed to tackle the challenges posed by incomplete and heterogeneous data in the realm of sustainable development research.
By integrating multi-scale measurements, ensemble clustering, and motif-based bipartite graph fusion, the proposed framework adeptly captures intricate relationships and structural subtleties within multi-view data, even when faced with data incompleteness. This comprehensive approach ensures that the framework can effectively leverage the complementary information inherent in diverse data sources.
The evaluation of MMBGF_IMC was conducted on seven widely-recognized multi-view datasets—ALOI, BBC4, ORL, Out-Scene, YALE, BDGP, and Reuters. The results consistently demonstrate that MMBGF_IMC outperforms existing state-of-the-art methods across all datasets in terms of clustering accuracy (ACC), normalized mutual information (NMI), and adjusted Rand index (ARI). Notably, the framework exhibits significant performance enhancements, with clustering metrics improving by 7–12% in challenging datasets such as Out-Scene and Reuters. These improvements validate the effectiveness of the proposed method in handling diverse and complex data structures.
Furthermore, MMBGF_IMC showcases remarkable stability across varying paired rates, underscoring its robustness and reliability for real-world applications where data incompleteness is prevalent. Ablation studies reinforce the indispensable roles of both multi-scale analysis and motif fusion within the framework. The multi-scale component enhances the ability to capture hierarchical and multi-faceted data relationships, while motif fusion effectively integrates higher-order structural information, leading to superior clustering performance.
In addressing the primary scientific hypotheses of this research—namely, that multi-scale measurements combined with motif-based graph fusion can significantly enhance incomplete multi-view clustering performance—the experimental findings provide strong validation. The consistent outperformance of MMBGF_IMC across multiple datasets and varied experimental conditions confirms that the integration of these components is crucial for achieving high-quality clustering results in the presence of incomplete and heterogeneous data.
Additionally, the framework’s capability to seamlessly handle incomplete data and amalgamate information from diverse sources positions MMBGF_IMC as a potent tool for sustainable development applications. It facilitates more accurate and insightful analyses in critical areas such as environmental monitoring, urban planning, resource management, public health, and beyond, thereby contributing to informed and evidence-based decision-making processes.

5.2. Policy Recommendations

To further promote the practical adoption and impact of data-driven multi-view clustering methods in sustainable development, several key recommendations are proposed. Firstly, it is imperative for governments and organizations to invest in robust data collection and management infrastructures. Ensuring the availability of high-quality, multi-view datasets is foundational for the success of sustainable development research.
Moreover, fostering interdisciplinary collaborations between computer scientists, environmental experts, urban planners, and other relevant stakeholders will enhance the refinement and applicability of clustering methodologies. Such collaborations can drive the customization of algorithms to better address specific real-world challenges, maximizing their relevance and effectiveness.
Addressing privacy and ethical considerations is also crucial as data-driven techniques become more pervasive. Establishing stringent data governance frameworks and ensuring transparency in data usage will help maintain public trust and ensure equitable outcomes.

5.3. Limitations

Despite the promising advancements presented by the MMBGF_IMC framework, several limitations warrant consideration. One primary limitation is the sensitivity of the method to certain hyperparameters, such as the number of anchors and the number of nearest neighbors (Knn). While optimal parameter ranges have been identified, these settings may need further refinement for different datasets, suggesting the need for automated parameter selection techniques in future research.
Additionally, the computational complexity associated with motif-based fusion and spectral clustering may pose scalability challenges for extremely large datasets. Future work could explore the incorporation of efficient approximation algorithms or leverage parallel computing architectures to mitigate these issues.
Another limitation pertains to the framework’s focus on static datasets. Many real-world applications involve dynamic or temporal data, necessitating extensions of MMBGF_IMC to handle such complexities. Integrating temporal dynamics would significantly enhance the framework’s applicability to time-sensitive domains like disaster management and traffic prediction.
Lastly, while the framework has been validated on general multi-view datasets, its performance on domain-specific datasets—such as those in genomics, finance, or social sciences—remains unexplored. Future studies should assess and adapt MMBGF_IMC to these specialized contexts to fully harness its potential across a broader spectrum of applications.

6. Discussion

This research underscores the transformative potential of advanced data-driven techniques in addressing global sustainable development challenges. By leveraging multi-view data and innovative clustering methodologies, deeper insights into complex systems can be attained, thereby informing more effective and evidence-based decision-making. The proposed MMBGF_IMC framework bridges the gap between theoretical advancements and practical applications, offering a robust tool for sustainable development research. Moving forward, it is essential to refine and expand these methods to ensure their applicability to real-world problems, thereby providing actionable insights that support informed policy and decision-making across diverse fields. The continued evolution of such data-driven frameworks will be pivotal in tackling some of the most pressing challenges of our time, particularly in sustainable development and environmental management.

Author Contributions

Conceptualization, Z.C. and L.Z.; methodology, H.Z. (Hongwei Zhang); software, H.Z. (Hongwei Zhang); validation, H.Z. (Hongwei Zhang), Z.L. and H.Z. (Hao Zheng); formal analysis, H.Z. (Hongwei Zhang); investigation, Z.L.; resources, H.Z. (Hao Zheng); data curation, Z.L.; writing—original draft preparation, H.Z. (Hongwei Zhang); writing—review and editing, H.Z. (Hongwei Zhang); visualization, H.Z. (Hao Zheng); supervision, L.Z.; project administration, Z.C.; funding acquisition, Z.C. All authors have read and agreed to the published version of the manuscript.

Funding

This work was partially supported by the National Natural Science Foundation of China No. 62476038 and Science and Technology Planning Project of Liaoning Province No. 2023JH2/101300092 and 2023JH26/10100008.

Institutional Review Board Statement

This research was approved by the authors’ college of the relevant university.

Informed Consent Statement

Informed consent was obtained from all subjects involved in the study.

Data Availability Statement

The data used to support the findings of this study are available from the corresponding author(s) upon request.

Acknowledgments

We would like to thank the anonymous reviewers for their time and effort devoted to improving the quality of this research.

Conflicts of Interest

The authors declare no conflicts of interest.

References

  1. Kharrazi, A.; Qin, H.; Zhang, Y. Urban big data and sustainable development goals: Challenges and opportunities. Sustainability 2016, 8, 1293. [Google Scholar] [CrossRef]
  2. He, L.; Shen, J.; Zhang, Y. Ecological vulnerability assessment for ecological conservation and environmental management. J. Environ. Manag. 2018, 206, 1115–1125. [Google Scholar] [CrossRef] [PubMed]
  3. Mariano-Hernández, D.; Hernández-Callejo, L.; Zorita-Lamadrid, A.; Duque-Pérez, O.; García, F.S. A review of strategies for building energy management system: Model predictive control, demand side management, optimization, and fault detect & diagnosis. J. Build. Eng. 2021, 33, 101692. [Google Scholar]
  4. Datola, G. Implementing urban resilience in urban planning: A comprehensive framework for urban resilience evaluation. Sustain. Cities Soc. 2023, 98, 104821. [Google Scholar] [CrossRef]
  5. Johnson, D.P.; Ravi, N.; Filippelli, G.; Heintzelman, A. A Novel Hybrid Approach: Integrating Bayesian SPDE and Deep Learning for Enhanced Spatiotemporal Modeling of PM2.5 Concentrations in Urban Airsheds for Sustainable Climate Action and Public Health. Sustainability 2024, 16, 10206. [Google Scholar] [CrossRef]
  6. Hu, Y.; Cai, H. Multi-View Clustering Through Hypergraphs Integration on Stiefel Manifold. In Proceedings of the 2022 IEEE International Conference on Multimedia and Expo (ICME), Taipei, Taiwan, 18–22 July 2022; IEEE: Piscataway, NJ, USA, 2022; pp. 01–06. [Google Scholar]
  7. Li, L.; Zhang, J.; Wang, S.; Liu, X.; Li, K.; Li, K. Multi-view bipartite graph clustering with coupled noisy feature filter. IEEE Trans. Knowl. Data Eng. 2023, 35, 12842–12854. [Google Scholar] [CrossRef]
  8. Zhao, L.; Zhang, J.; Wang, Q.; Chen, Z. Dual alignment self-supervised incomplete multi-view subspace clustering network. IEEE Signal Process. Lett. 2021, 28, 2122–2126. [Google Scholar] [CrossRef]
  9. Chen, Z.; Li, Y.; Lou, K.; Zhao, L. Incomplete Multi-View Clustering with Complete View Guidance. IEEE Signal Process. Lett. 2023, 30, 1247–1251. [Google Scholar] [CrossRef]
  10. Li, Z.; Wu, D.; Nie, F.; Wang, R.; Sun, Z.; Li, X. Multi-View Clustering Based on Invisible Weights. IEEE Signal Process. Lett. 2021, 28, 1051–1055. [Google Scholar] [CrossRef]
  11. Wang, H.; Yang, Y.; Liu, B. GMC: Graph-based multi-view clustering. IEEE Trans. Knowl. Data Eng. 2019, 32, 1116–1129. [Google Scholar] [CrossRef]
  12. Li, Z.; Tang, C.; Liu, X.; Zheng, X.; Zhang, W.; Zhu, E. Consensus graph learning for multi-view clustering. IEEE Trans. Multimed. 2021, 24, 2461–2472. [Google Scholar] [CrossRef]
  13. Wang, H.; Yang, Y.; Liu, B.; Fujita, H. A study of graph-based system for multi-view clustering. Knowl.-Based Syst. 2019, 163, 1009–1019. [Google Scholar] [CrossRef]
  14. Liu, C.; Wu, S.; Li, R.; Jiang, D.; Wong, H.S. Self-supervised graph completion for incomplete multi-view clustering. IEEE Trans. Knowl. Data Eng. 2023, 35, 9394–9406. [Google Scholar] [CrossRef]
  15. Cai, X.; Nie, F.; Huang, H.; Kamangar, F. Heterogeneous image feature integration via multi-modal spectral clustering. In Proceedings of the CVPR 2011, Colorado Springs, CO, USA, 20–25 June 2011; IEEE: Piscataway, NJ, USA, 2011; pp. 1977–1984. [Google Scholar]
  16. Huang, D.; Wang, C.D.; Lai, J.H. Fast multi-view clustering via ensembles: Towards scalability, superiority, and simplicity. IEEE Trans. Knowl. Data Eng. 2023, 35, 11388–11402. [Google Scholar] [CrossRef]
  17. Abu Alfeilat, H.A.; Hassanat, A.B.; Lasassmeh, O.; Tarawneh, A.S.; Alhasanat, M.B.; Eyal Salman, H.S.; Prasath, V.S. Effects of distance measure choice on k-nearest neighbor classifier performance: A review. Big Data 2019, 7, 221–248. [Google Scholar] [CrossRef]
  18. Xia, S.; Xiong, Z.; Luo, Y.; Xu, W.; Zhang, G. Effectiveness of the Euclidean distance in high dimensional spaces. Optik 2015, 126, 5614–5619. [Google Scholar] [CrossRef]
  19. Von Luxburg, U. A tutorial on spectral clustering. Stat. Comput. 2007, 17, 395–416. [Google Scholar] [CrossRef]
  20. Huang, D.; Wang, C.D.; Wu, J.S.; Lai, J.H.; Kwoh, C.K. Ultra-scalable spectral clustering and ensemble clustering. IEEE Trans. Knowl. Data Eng. 2019, 32, 1212–1226. [Google Scholar] [CrossRef]
  21. Benson, A.R.; Gleich, D.F.; Leskovec, J. Higher-order organization of complex networks. Science 2016, 353, 163–166. [Google Scholar] [CrossRef]
  22. Geusebroek, J.M.; Burghouts, G.J.; Smeulders, A.W. The Amsterdam library of object images. Int. J. Comput. Vis. 2005, 61, 103–112. [Google Scholar] [CrossRef]
  23. Greene, D.; Cunningham, P. Practical Solutions to the Problem of Diagonal Dominance in Kernel Document Clustering. In Proceedings of the 23rd International Conference on Machine learning (ICML’06), Honolulu, HI, USA, 23–29 July 2023; ACM Press: New York, NY, USA, 2006; pp. 377–384. [Google Scholar]
  24. Samaria, F.S.; Harter, A.C. Parameterisation of a stochastic model for human face identification. In Proceedings of the 1994 IEEE Workshop on Applications of Computer Vision, Sarasota, FL, USA, 5–7 December 1994; IEEE: Piscataway, NJ, USA, 1994; pp. 138–142. [Google Scholar]
  25. Monadjemi, A.; Thomas, B.T.; Mirmehdi, M. Experiments on high resolution images towards outdoor scene classification. In Proceedings of the Seventh Computer Vision Winter Workshop (CVWW 2002), Bad Aussee, Austria, 6–8 February 2002; Wildenauer, H., Kropatsch, W., Eds.; Vienna University of Technology: Vienna, Austria, 2002; pp. 325–334. [Google Scholar]
  26. Belhumeur, P.N.; Hespanha, J.P.; Kriegman, D.J. Eigenfaces vs. fisherfaces: Recognition using class specific linear projection. IEEE Trans. Pattern Anal. Mach. Intell. 1997, 19, 711–720. [Google Scholar] [CrossRef]
  27. Tomancak, P.; Berman, B.P.; Beaton, A.; Weiszmann, R.; Kwan, E.; Hartenstein, V.; Celniker, S.E.; Rubin, G.M. Global analysis of patterns of gene expression during Drosophila embryogenesis. Genome Biol. 2007, 8, R145. [Google Scholar] [CrossRef] [PubMed]
  28. Amini, M.R.; Usunier, N.; Goutte, C. Learning from multiple partially observed views-an application to multilingual text categorization. Adv. Neural Inf. Process. Syst. 2009, 22, 28–36. [Google Scholar]
  29. Wen, J.; Zhang, Z.; Xu, Y.; Zhang, B.; Fei, L.; Liu, H. Unified embedding alignment with missing views inferring for incomplete multi-view clustering. In Proceedings of the AAAI Conference on Artificial Intelligence, Honolulu, HI, USA, 27 January–1 February 2019; Volume 33, pp. 5393–5400. [Google Scholar]
  30. Wang, S.; Liu, X.; Liu, L.; Tu, W.; Zhu, X.; Liu, J.; Zhou, S.; Zhu, E. Highly-efficient incomplete large-scale multi-view clustering with consensus bipartite graph. In Proceedings of the IEEE/CVF Conference on Computer Vision and Pattern Recognition, New Orleans, LA, USA, 18–24 June 2022; pp. 9776–9785. [Google Scholar]
  31. Zhao, H.; Liu, H.; Fu, Y. Incomplete multi-modal visual data grouping. In Proceedings of the IJCAI, New York, NY, USA, 9–15 July 2016; pp. 2392–2398. [Google Scholar]
  32. Sun, L.; Wen, J.; Liu, C.; Fei, L.; Li, L. Balance guided incomplete multi-view spectral clustering. Neural Netw. 2023, 166, 260–272. [Google Scholar] [CrossRef]
  33. Liang, N.; Yang, Z.; Xie, S. Incomplete multi-view clustering with sample-level auto-weighted graph fusion. IEEE Trans. Knowl. Data Eng. 2022, 35, 6504–6511. [Google Scholar] [CrossRef]
  34. Yang, Z.; Zhang, H.; Wei, Y.; Wang, Z.; Nie, F.; Hu, D. Geometric-inspired graph-based Incomplete Multi-view Clustering. Pattern Recognit. 2024, 147, 110082. [Google Scholar] [CrossRef]
Figure 1. Definition of bipartite motifs and example motif adjacency matrices. (a) The solid blue and green circles represent instances and anchors, respectively. The dashed circles are the missing instances of the corresponding views. (b) Each sample has two nearest anchors as example represented by solid links to construct the motif adjacency matrices.
Sustainability 17 01136 g001
Figure 2. Framework of the proposed incomplete multi-view clustering method. In the bipartite graph generation stage, each sample has a varying range of k-nearest neighbors, from 3 to 5. As a result, the motif structure of each bipartite graph is distinct, and this is visualized through transparent nodes and links in the motif-based bipartite graph fusion stage. The proposed method focuses on learning a consensus similarity graph from multiple views for clustering.
Sustainability 17 01136 g002
Table 1. Summary of multiview datasets.
Dataset#Clusters#Instances#Features
ALOI10010,80077/13/64/125
BBC456854659/4633/4665/4684
BDGP525001750/79
ORL404004096/3304/6750
Out-Scene82688512/432/256/48
Reuters618,71510/10
YALE151654096/3304/6750
Table 2. Mean NMIs, ACCs, and ARIs of different methods on various datasets. It is shown in bold for the best results.
MeanNMIMeanACCMeanARI
DatasetMethod/p0.10.30.50.70.90.10.30.50.70.90.10.30.50.70.9
ALOIBSV0.51080.53830.57010.60960.63680.34900.36850.38950.41190.43290.07030.10460.15460.22160.2810
CONCAT0.29950.31760.33590.35230.37110.12150.12760.13360.13830.14450.01830.02760.04210.05820.0744
UEAF0.55860.56760.57560.59090.61900.34690.34370.35700.38800.41080.18840.20850.21960.23970.2749
CBG0.45210.45260.45390.50550.55610.23050.20940.22690.27540.29840.03790.04250.04490.06370.0880
SAGF_IMC0.62180.64410.66650.67730.67850.51090.53090.55200.55840.56280.08030.10070.12550.14720.1446
BGIMVC0.73030.73120.73660.73610.74070.65170.65130.67510.64930.67950.23150.22110.20390.23170.2025
GIMVC0.71240.71940.73750.74470.75350.43490.44610.46420.50510.50890.23750.23090.27460.31760.2841
MMBGF_IMC0.74110.74480.75520.75290.76440.68250.68600.68820.68890.69860.25830.24420.28940.25600.2955
BBC4BSV0.06050.06780.05530.08080.10520.37420.38740.36740.38260.40350.01040.01900.02360.01330.0311
CONCAT0.05200.01720.05980.11420.09410.36150.34280.36800.37750.38410.01620.00430.02020.02190.0484
UEAF0.57290.59350.63430.61510.57200.71360.74220.79620.74550.68630.51930.54490.61760.58710.4950
CBG0.43230.44940.49250.55410.43760.50120.51090.65360.76160.50040.25110.26260.37540.50380.2879
SAGF_IMC0.47680.46590.47600.47790.49950.70320.69930.69640.69490.69780.48460.46820.47840.47980.4950
BGIMVC0.61200.59070.63540.62830.59370.81550.78470.82220.82530.80000.59580.55410.61950.61260.5654
GIMVC0.18420.18730.11050.19430.15440.49420.47810.42230.46290.44670.18800.15820.11250.18610.1636
MMBGF_IMC0.64700.67950.69500.70140.70590.83010.85900.86730.86920.86920.68450.71790.73300.74560.7451
ORLBSV0.47720.53900.57190.64330.71540.36650.41050.45400.48680.53480.05620.08970.11480.22250.3488
CONCAT0.48190.53320.58720.62110.68830.36030.38330.43680.44350.49980.05800.09500.14480.20510.3072
UEAF0.68590.71340.71400.71540.73100.50350.51980.54130.53880.55280.32040.35550.35950.36970.3866
CBG0.81640.83330.85060.84470.87880.65180.66100.67980.66630.73080.45150.48680.50310.51820.6312
SAGF_IMC0.68770.69000.69380.66910.68860.51630.52850.53500.51180.51330.26950.27100.27360.24730.2651
BGIMVC0.59900.71730.71590.62410.64470.38150.52480.49780.40500.38980.18710.37410.36480.21230.2330
GIMVC0.83390.84510.85370.85020.86180.69350.70030.71550.70650.72420.55790.56140.56640.57910.6007
MMBGF_IMC0.85350.84330.83990.85040.86160.75830.73830.73200.73580.75880.63490.56670.57780.61590.6426
Out-SceneBSV0.33680.34230.37230.39670.42010.44650.48250.48890.52560.53630.17620.20840.23890.27960.3075
CONCAT0.14790.14720.14820.16730.17360.30260.30050.30810.32180.32470.07580.07900.08940.10680.1153
UEAF0.05990.05140.05110.05170.05280.19380.19140.19100.19400.20280.02190.01820.01950.02200.0229
CBG0.36200.35100.38370.38420.39060.48100.51600.51860.51160.51430.26660.26620.29400.28940.2964
SAGF_IMC0.44270.46780.45670.49880.53020.53740.47000.55800.57350.59160.29040.34450.34270.38230.4190
BGIMVC0.45300.45660.49610.52220.46890.57410.55530.56880.60780.56760.35890.31940.38490.42980.3350
GIMVC0.50800.53160.52400.52200.52640.63440.66990.63650.65160.62890.40350.40490.40370.45860.4365
MMBGF_IMC0.52620.52690.52720.53030.53200.66360.67620.67270.67750.67970.40560.41080.41030.41370.4152
YALEBSV0.34040.38240.42270.45920.54540.32850.37150.39880.40480.48300.05990.08970.13060.18110.2934
CONCAT0.33090.32590.39770.43940.47190.32360.30670.36180.39640.40910.05470.06120.12160.15230.2114
UEAF0.57820.59750.59990.59240.57520.52970.52670.53030.53640.51820.34480.36270.36820.36350.3400
CBG0.67100.62160.60440.67820.65400.61820.56550.55640.62000.60420.44580.38610.36250.45400.4258
SAGF_IMC0.53490.53070.55410.56610.57440.48060.47880.49700.50970.51520.27480.31200.29300.33520.3388
BGIMVC0.44380.46490.46870.44630.45830.38910.41330.38850.39880.41640.15430.20320.18270.17460.1837
GIMVC0.66360.62610.64720.66360.66200.62670.58060.60420.63700.63090.43970.39030.40940.47150.4354
MMBGF_IMC0.66870.68230.67480.67270.66970.65520.68060.66550.67030.66360.44790.46770.46210.43380.4365
BDGPBSV0.16310.18750.25190.30120.32460.35140.36340.43590.45670.49490.03320.04420.09190.10690.1621
CONCAT0.18600.21320.25960.30760.36120.36150.38040.40840.46320.49940.04140.05940.08000.11790.1562
UEAF0.43200.59390.67390.71710.77430.69980.82530.86640.88920.91730.41540.61830.69880.74400.8047
CBG0.36680.47620.50300.62550.68250.58360.67320.70400.81720.84870.24410.31450.36620.58480.6441
SAGF_IMC0.46190.51890.71520.64200.66830.66510.71720.88440.71960.73480.66510.71720.88440.71960.7348
BGIMVC0.02510.02200.04870.07850.03130.22400.22200.24230.27240.23040.00090.00050.00350.01560.0012
GIMVC0.37340.56050.59970.60490.63060.54630.68860.68930.68120.67390.29970.52780.55290.55050.5600
MMBGF_IMC0.41390.55350.71380.79600.89380.51610.72600.87390.92510.95880.20740.39030.70460.82280.9004
ReutersBSV0.06100.07280.08920.10300.12140.33800.34980.36420.38730.39760.03050.03610.05320.07120.0987
CONCAT0.05500.07320.11780.14460.17430.30970.32970.38910.40750.43830.02600.03640.07830.10530.1380
CBG0.09720.11600.13330.17430.16710.36830.37350.37190.42580.41420.12320.13190.12120.15480.1676
GIMVC0.21420.23510.24570.24470.24130.43420.44820.45510.45430.43420.16530.15980.16380.16450.1582
MMBGF_IMC0.13530.16260.21600.24820.29480.40580.42390.46420.48880.52330.11920.12120.16640.20540.2569
Disclaimer/Publisher’s Note: The statements, opinions and data contained in all publications are solely those of the individual author(s) and contributor(s) and not of MDPI and/or the editor(s). MDPI and/or the editor(s) disclaim responsibility for any injury to people or property resulting from any ideas, methods, instructions or products referred to in the content.

