Article

Estimation of Environmental Indicators in High Mountain Cattle Ranching Agroecosystems

by
Raúl Andrés Molina Benavides
1,*,
Rómulo Campos Gaona
1,
Mauricio Vélez Terranova
1,
Alberto Stanislao Atzori
2,
David Calero Quintero
1 and
Hugo Sánchez Guerrero
1
1
Departamento de Ciencia Animal, Universidad Nacional de Colombia, Sede Palmira, Palmira 763531, Colombia
2
Department of Agricultural Sciences, University of Sassari, 07100 Sassari, Italy
*
Author to whom correspondence should be addressed.
Sustainability 2025, 17(3), 1135; https://doi.org/10.3390/su17031135
Submission received: 17 October 2024 / Revised: 4 December 2024 / Accepted: 5 December 2024 / Published: 30 January 2025
(This article belongs to the Section Sustainable Agriculture)

Abstract

:
The objective of this study was to analyze soil organic carbon (SOC) and environmental footprints—water and carbon—in an area of livestock intervention located in the high tropics. The work was conducted in La Nevera, Colombia, 03°33′460″ N–76°06’278″ W and 03°31′405″ N–76°01’804″ W, between 2700 and 3300 AMSL. Estimates of soil organic carbon (t SOC/ha), carbon footprint (kg CO2eq/kg of product generated), and water footprint (m3 of water per kg of primary product) were made. The results obtained were: soil organic carbon for the forest cover was 237,491.91 tons (33 t SOC/ha) for an average bulk density of 0.46 (g/cm3) at a depth of 10 cm. For vegetation cover, the average amount of SOC was 52,281.22 tons (25 t SOC/ha). The greenhouse gases emitted by livestock activity were estimated at 2,119,416.29 kg CO2eq/year, with an emission intensity for milk production of 2.77 kg CO2eq/kg and 34.71 kg CO2eq/kg for meat. The cattle farming activity consumed 1,909,430.83 m3 per year, with a water footprint of 2.5 m3/kg of milk produced and 35 m3/kg of meat. Given the negative impact on environmental resources and the low biological efficiency, it is necessary to intervene in livestock production systems.

1. Introduction

Cattle ranching is a fundamental activity in rural Colombia, providing meat, milk, and other essential products. It is carried out in all regions and thermal floors of the country and plays a determining role in the transformation of vegetation cover throughout the national territory [1].
According to the National Livestock Census—carried out by the Colombian Agricultural Institute (ICA) in 2023 [2]—approximately 1,618,483 cattle are found in protected areas and their zones of influence in the northwestern Andes and western Andes. Traditionally, cattle ranching in these sites is extensive and low-tech, using dual-purpose livestock systems—where cows are milked with their calf once a day—to obtain productions between 3 to 6 liters of milk/cow. These animals are fed mainly on forage allowance from native pastures, depending on the edaphoclimatic conditions of the area [3,4]. This productive sector exerts significant pressure on the natural resources where it sustains its activity and affects different ecosystem services such as carbon capture and storage and water regulation, while contributing to the emission of greenhouse gases like methane and nitrous oxide [5]. It is necessary to measure the impacts of livestock farming on the environment to explore solutions to mitigate them [6]. Environmental variables related to soil organic carbon (SOC) and water and carbon footprints are relevant for the livestock sector.
SOC is an environmental indicator of soil quality and its variation determines soil fertility, erosion, and greenhouse gases fluxes. Grazing cattle can impact the SOC concentration, since animal selectivity, trampling intensity, and excreta influence the input of carbon into the soil (plants, roots, nutrients in feces) for decomposition [7]. Several studies have shown that intense grazing can reduce SOC by 7.5 to 17.7% in different agroecosystems [7,8], while moderate grazing intensities with improved pasture management practices can improve SOC stock in tropical conditions [9].
The water footprint (WF) is another environmental indicator related to the total volume of water used to obtain animal products (e.g., milk and meat) [10,11]. Agriculture uses 69% of the global freshwater, and animal products have a large WF compared to crop products. Similarly, water use varies between livestock types, regions, and production systems [12,13]. Usually, the WF decreases with the degree of intensification of the productive system, with a larger WF in beef (15,400 L/kg) than egg (3300 L/kg) and milk (1000 L/kg) production. Food production is where most water is spent in animal activities, and it is there where efforts can be made to reduce it [14].
The carbon footprint (CF) is also relevant in livestock production and estimates the amount of greenhouse gases emitted during the life cycle of a product (e.g., milk and meat) [10,11]. CF estimation includes the carbon emitted from enteric fermentation, farm machinery, land use, animal feed production, and the transport, processing, packaging, and retail of the animal products, and its value is different according to the climate, production system, and genetic component of the animals [15]. In grazing dairy cattle, the CF varies from <1 to >2 kg CO2eq/kg of fat- and protein-corrected milk, with enteric methane emissions being the principal contributor (>50%) [16]. In beef cattle, the CF values range from 8 to 22 kg CO2eq per kg of live weight depending on the year and farm location and production [17].
Environmental indices to estimate SOC, WF, and CF constitute a valuable tool to integrate different sources of information in order to accurately estimate the environmental impact of livestock production in a region. The indexes allow the quantification of water consumption and carbon emission and sequestration hotspots—which is critical for developing effective mitigation strategies. They also provide valuable information to producers and consumers related to the sustainability of bovine products, promoting responsible production practices and informed consumption decisions [3,18]. The appraisal of these indicators is essential to comply with environmental regulations and international commitments on climate change and sustainable water management. As public awareness of environmental issues grows, consumers and organizations demand greater transparency and accountability along the supply chain. This drives cattle ranching systems to adopt sustainable practices, not only to reduce their environmental impact but also to improve their competitiveness in the global marketplace [19].
The construction of environmental indexes related to SOC, WF, and CF in Colombian high mountain cattle systems is rare. Under the studied agroecosystem, this information is required to evaluate the environmental sustainability and the long-term economic viability of the agriculture sector. This, in turn, will allow the producers in the area to adopt practices that guarantee a more sustainable production and a balance with the natural environment to guarantee vital resources for future generations [4]. According to the cattle ranching characteristics in the studied area (extensive and low-tech management), we hypothesize that high WF and CF and low SOC levels will be found. The objective of this study was to estimate environmental indexes related to SOC, WF, and CF in a livestock area located in the high tropics, with possible land use conflicts with moorland ecosystems—protected areas due to their importance as water sources for the population.

2. Methodology

2.1. Study Area

The study area is located in the zone of La Nevera, locality of Toche, municipality of Palmira, Valle del Cauca, Colombia between coordinates 03°33′460″ N–76°06′278″ W and 03°31′405″ N–76°01′804″ W. It is on the western slope of the central mountain range of the Colombian Andes, between the basins of the Nima and Amaime (Toche) rivers, between 2700 and 3300 m above sea level, with an average temperature of 13 °C, annual rainfall between 1600 and 1800 mm, and relative humidity greater than 80% [4]. The zone is characterized by heterogeneity of vegetation cover such as forests, pastures, moorland vegetation, and secondary vegetation [20] (Figure 1). The area has soils of the entisol order, in which the superficial horizons are poorly developed [21].

2.2. Information on Livestock Systems

The cattle inventory and the characteristics of the cattle ranching agroecosystems, such as animal weight, production, reproduction, pasture characteristics, and management, amongst others, were obtained from the 22 farms existing in the area and this was carried out through group meetings with the farmers, field trips, and individual visits where a semi-structured survey was applied, consisting of 162 questions, grouped into three components: social (29.6%), environmental (16.9%), and productive–economic (53.5%). Information on the vegetation cover of the properties was obtained through the geoportal of the Corporación Autónoma Regional del Valle del Cauca (CVC, 2022) [22]. Additionally, different studies carried out in the sector [4,23] informed the present study.

2.3. Soil Organic Carbon (SOC)

Soil organic carbon content, expressed in tonnes of carbon stored per hectare (t/ha), was estimated using the equation proposed by the FAO (2017) [24], which includes the carbon contents determined in the laboratory by the Walkley–Black methodology, the bulk density, and the soil depth at sampling. The equation is the following:
S O C = d × B D × C O × 100
where SOC is soil organic carbon (t/ha), d is depth (cm), BD is bulk density (g/cm3), and CO is carbon content (g/100g).
Carbon contents, determined by the Walkley–Black wet oxidation chemical method, were obtained from the work of Molina (2011) [25], where soil samples were taken in the different vegetation covers (forest, grassland, and secondary vegetation) of the study area. The result showed: (i) on average, the amount of soil organic carbon for the forest cover was 8.21 g/100 g for a mean bulk density of 0.46 g/cm3 at a depth of 10 cm; (ii) for grassland and secondary vegetation cover, both used for animal grazing, the average amount of soil organic carbon was 5.48 g/100 g for an average bulk density of 0.50 g/cm3 at a depth of 10 cm.
Subsequently, to estimate the amount of SOC in the La Nevera locality, the amounts of SOC obtained with the above equation were multiplied by the areas (ha) of the study area, specifically for those with grass (grasslands + secondary vegetation) and forest cover. This information is presented in Figure 1.

2.4. Carbon Footprint of the Studied Livestock Systems

Greenhouse gas (GHG) emissions were estimated using the Intergovernmental Panel on Climate Change (IPCC) Tier 2 equations, from which the amounts of enteric methane, excreta methane, and nitrous oxide were obtained [26].

2.4.1. Enteric Methane

For enteric methane estimation, the equation proposed by IPCC (2006a) [26] Tier 2 was used.
E F : [ G E × Y m 100 × 365 55.65 ]
where:
  • EF = methane emission factor (kg CH4/animal/year);
  • GE = gross energy intake (MJ/animal/day);
  • Ym = methane conversion factor expressed as a percentage of gross energy in feed converted to methane;
  • 55.65 (MJ/per kg CH4) is the energy content of methane.
Ym was calculated using the equation proposed by Gerber et al. (2011) [27].
Y m : 9.75 ( 0.05 × D R )
where DR is the digestibility rate of feed (% of gross energy, GE). Digestible energy of the grass provided to the animals is reported in the literature of studies performed in the area.

2.4.2. Methane from Manure Management

For the estimation of the methane emission factor from manure management, the equation proposed by the IPCC (2006a) [26] was used.
F E m e x c : V S × 30 × [ B O × 0.67 × M C F 100 ]
where: FEmexc = methane emission factor expressed as kg/animal/year; VS = daily volatile solids excreted, expressed in kg dry matter/animal/day; BO = maximum methane producing capacity for manure produced, expressed in m3 CH4 kg [26]; 0.67 = conversion factor of m3 CH4 to kg CH4; MCF = methane conversion factors for each manure management system and the temperature of the region expressed as a percentage. The VS and MCF parameters were calculated as follows:
The VS was determined using the following equation:
V S : G E × 1 D R 100 + E O × G E × [ 1 A S H 18.45 ]
where: (EO × GE) = urinary energy expressed as fraction of GE (EO = 0.04); ASH = content of manure calculated as a fraction of the dry matter feed intake (ASH = 0.08); 18.45 is the conversion factor (GE/kg DM) expressed in MJ kg (values for energy of urine and ash were taken from IPCC, 2006a) [26].
The MCF was obtained with the equation proposed by Serra (2013) [28], by simple regression of the IPCC MCF values on their respective temperatures [26].
M C F p a s t u r e : 0.0034 × T 2 + 0.1852 × T ( 0.5114 )
where: T is the average temperature of the study area in °C.

2.4.3. Excreted Nitrous Oxide

For the estimation of excreted nitrous oxide, the equations proposed by IPCC (2006a) [26] were used.
N   e x c r e t e d = N   i n t a k e × ( 1 N   r e t a i n e d )
where: N excreted and N ingested are expressed in kg N/animal/day, N retained is the fraction of N intake that is retained by the animal. The total nitrogen intake was determined from the following equation:
N   i n t a k e : G E × ( C P 100 6.25 )
where: CP is the percentage of crude protein in diet and 6.25 is the conversion factor from kg of dietary protein to kg of dietary nitrogen.
Values for N retained were obtained from Table 10.20 of IPCC (2006a) [26]. The nitrogen retained for dairy cows was 0.2%; for the other animal categories it was 0.07%.
Once N excreted was obtained, it was multiplied by the percentage that volatilizes (20%, IPCC, 2006b) to acquire the N deposition on the soil. The estimation of direct N2O was achieved using the equation proposed by IPCC (2006a) [26].
d i r e c t   N 2 O = N   d e p o s i t i o n   o n   s o i l × F E d i r N 2 O × 44 / 28
where: direct N20 is expressed in kg/animal/day, FEdirN2O is the direct N2O emission factor (0.02, (IPCC, 2006b)) [29], and 44/28 is the conversion factor of N2O-N–N2O.
The methane and nitrous oxide gas estimations (kg) were converted to kg CO2eq using the following conversion factors: (i) 1 kg CO2 = 1 kg CO2eq, (ii) 1 kg CH4 = 25 kg CO2eq, and (iii) 1 kg N2O = 298 kg CO2eq [30].
Since milk was not the only product derived in these livestock agroecosystems, as there were sales of animals—voluntary and involuntary—that resulted in meat, it was necessary to know what percentage of the total amount of kg CO2eq emitted was attributed to the production of milk and meat, therefore, the biological allocation factor—an equation developed by the International Dairy Federation (IDF) (2010) [31]—was applied.
F m = 1 5.7717 × R
where: Fm is the total fraction of kg CO2eq produced attributed to milk production, R is the ratio of kg meat produced/kg milk produced, and 1 − 5.7717 is the allocation factor for milk. Meat production considers the sum of the live weights of the animals sold, including calves, bulls, steers, and cows for slaughter [31].
With the percentage of CO2eq attributed to milk and meat production, the resulting value was divided by the monthly production of milk and meat—measured in kilograms—which provided the CO2eq emissions per unit of product generated. This calculation represents the emission intensity or carbon footprint.

2.5. Water Footprint of the Livestock Systems

The amount of water used in cattle ranching agroecosystems was estimated following the methodology proposed by Chapagain and Hoekstra (2004) [32]. The total amount of water used in the systems is defined by the sum of direct water consumption—water consumed by the animals and used for their services—and indirect water, which is the water used in the feed production process.
W a t e r   c o n s u m e d = D r i n k i n g   w a t e r + F e e d   w a t e r + S e r v i c e   w a t e r

2.5.1. Water Drinking by Animals

The animals’ drinking water was estimated using equations proposed by different authors. The equation proposed by Meyer et al. (2004) [33] was applied to calculate the water intake of lactating dairy cows, whilst the equation of Winchester and Morris (1956) [34] was used for the other categories.
W I L C = 26.12 + 1.516 × A T + 1.299 × M P + 0.058 × B W + ( 0.406 × N a _ I )
where: WILC is the water intake of lactating dairy cows (l/cow/day), AT is the average ambient temperature (°C), MP is the milk production (l/cow/day), BW is the body weight (kg), and NA_I is the salt intake.
W I O C = D M × 3.413 + 0.01595 × E x p ( 0.01595 × A T )
where: WIOC is the water intake of other categories (l/animal/day), DM is the dry matter intake (kg/animal/day), AT is the average ambient temperature (°C), and Exp is the exponential function.
W a t e r   i n t a k e   o f o t h e r   c a t e g o r i e s   l a n i m a l d a y = D r y   m a t t e r   i n t a k e   k g a n i m a l d a y × ( 3.413 + 0.01595 ) E X P   0.01595 × A v e r a g e   a m b i e n t   t e m p e r a t u r e   ° C .  

2.5.2. Water Used in Pasture Production

For the calculation of the water used in pasture production for grazing cattle, the analyses included the following parameters: (i) water balance for the study area assessed by Thornthwaite’s method (1948) [35], which estimates potential evapotranspiration (PET). PET represents the amount of water that could be returned to the atmosphere if there were enough water available, (ii) the estimation of green forage production per hectare, which was calculated using the frequency availability method proposed by Franco et al. (2006) [36] in which several samples are taken from the paddock to determine the availability of forage and its botanical composition, and (iii) the estimation of green forage consumption based on the knowledge that an animal consumes 10% of its live weight in fresh grass or green forage each day while grazing [37]. With the amount of green forage consumed by the animals and the amount of water used by the pasture for the production of its biomass, the amount of green water used is estimated.

2.5.3. Water Used in Services

Information on service water was sourced from the studies by Nosetti et al. (2002) [38] and Chapagain and Hoekstra (2004) [32]. These works detail the water used for daily activities in cattle production systems, including washing drinkers, milking parlours, barns, teats, machinery, and cattle dip manual spray race, amongst others.

2.6. Statistical Analysis

The information collected from the semi-structured survey was analyzed using frequency tables and descriptive statistics using the Infostat software, version 2020 [39].

3. Results and Discussion

3.1. Characteristics of the Livestock Systems

The most relevant social aspects show that: (i) 80% of farm owners are over 51 years old, 6.66% are between 41 and 50 years old, and 13.33% are between 30 and 40 years old; (ii) 100% of the farms have no public services (electricity, potable water, sewage, gas, etc.); and (iii) all farms must transport their products on horseback over bridle paths.
This information is consistent with the results of the national agricultural survey conducted in Colombia for the year 2019, in which it was observed that more than 50% of the producers residing in the rural area of the country were above 40 years of age and 15.7% of rural dwellings do not have any public services [40].
In terms of production, 66.66% of the livestock agroecosystems in the zone are oriented to dual purpose (DP), of which 40% carry out a complete cycle in their herd, i.e., the males born on the farm are taken to slaughter. In the other 60% of the farms, males are sold after weaning. The predominant breed components are Normande, Ayrshire, and Brown Swiss. Only one manual milking per day is performed, with the use of calves at the foot of the cows. All of these production systems use rotational grazing with electric fencing, which is supplied by solar panels. The predominant pasture species in the area is Cenchrus clandestinus accompanied by mixtures with Dactylis glomerata, Holcus lanatus, and Trifolium repens. All of the milk produced in the area is marketed through the informal channel. The area of the DP-oriented farms varies between 28 and 550 hectares (ha).
A third of the agroecosystems in the zone are oriented to raising and fattening animals. The predominant breed component is Normande. The area of these farms varies between 70 and 588 ha. Eighty percent of these production systems use pasture rotation with electric fences. The average age at slaughter is 33.56 months (±3.61).
The farmers in these areas produce milk and meat under low technological conditions, but their limited income comes only from these activities. This type of property must be improved productively to make it sustainable over time.
All of the livestock producers are members of the locality’s association, called Asociación Agrícola y Ganadera para el Desarrollo Sostenible de La Nevera “ASOAGRIGAN”, established in 2004.

3.2. Productive Paramenters of the Livestock Systems

The cattle inventory, pasture chemical composition, and reproductive parameters of the 22 properties studied are presented in Table 1.
In total, the zone has a cattle inventory of 1121 heads or 771 AUE (1 AUE = 450 Kg live weight), of which 57% are females and 43% are males. On average, the stocking rate for the farms in the zone is 0.46 AUE/ha. Similarly, this pattern reflects the distribution of the cattle inventory in the country, based on data from the ICA (2023) [2] and the national stocking rate reported by Fedegan (2018) [41].
The results obtained in this study show that the characteristics of the pasture analyzed are consistent with those observed at the national level for cold climate pastures, especially those that have not been improved or technified. The forage presents an average quality, which reflects the limited intervention in terms of fertilization, weed control, and pasture renewal. These findings coincide with the general patterns of traditional management in many regions of the country, which affects the efficiency of animal production in these systems [42].
Regarding reproductive parameters, the results found agree with the values reported by Gonzáles et al. (2020) [43], who analyzed 1313 dual-purpose-oriented farms in Colombia and conclude that low performance in the reproductive component leads to a clear inefficiency in livestock activity, highlighting the need to implement more effective reproductive management practices, such as genetic improvement, disease control, and adequate nutrition, in order to optimize the overall performance of the farms.
According to the number of dairy cattle in the different groups in Table 1, and considering the average daily milk production per cow in the study area (5 liters), the annual milk volume for the locality is estimated at 352,225 liters. Similarly, the annual meat production was estimated by considering the number of fattening steers, weaned male calves, and discarded cows, resulting in a total production of 32,975 kg. The values found are at the lower limit of the bovine production indicators in Colombia but are considered valid in the agroecological conditions where the animals are located.

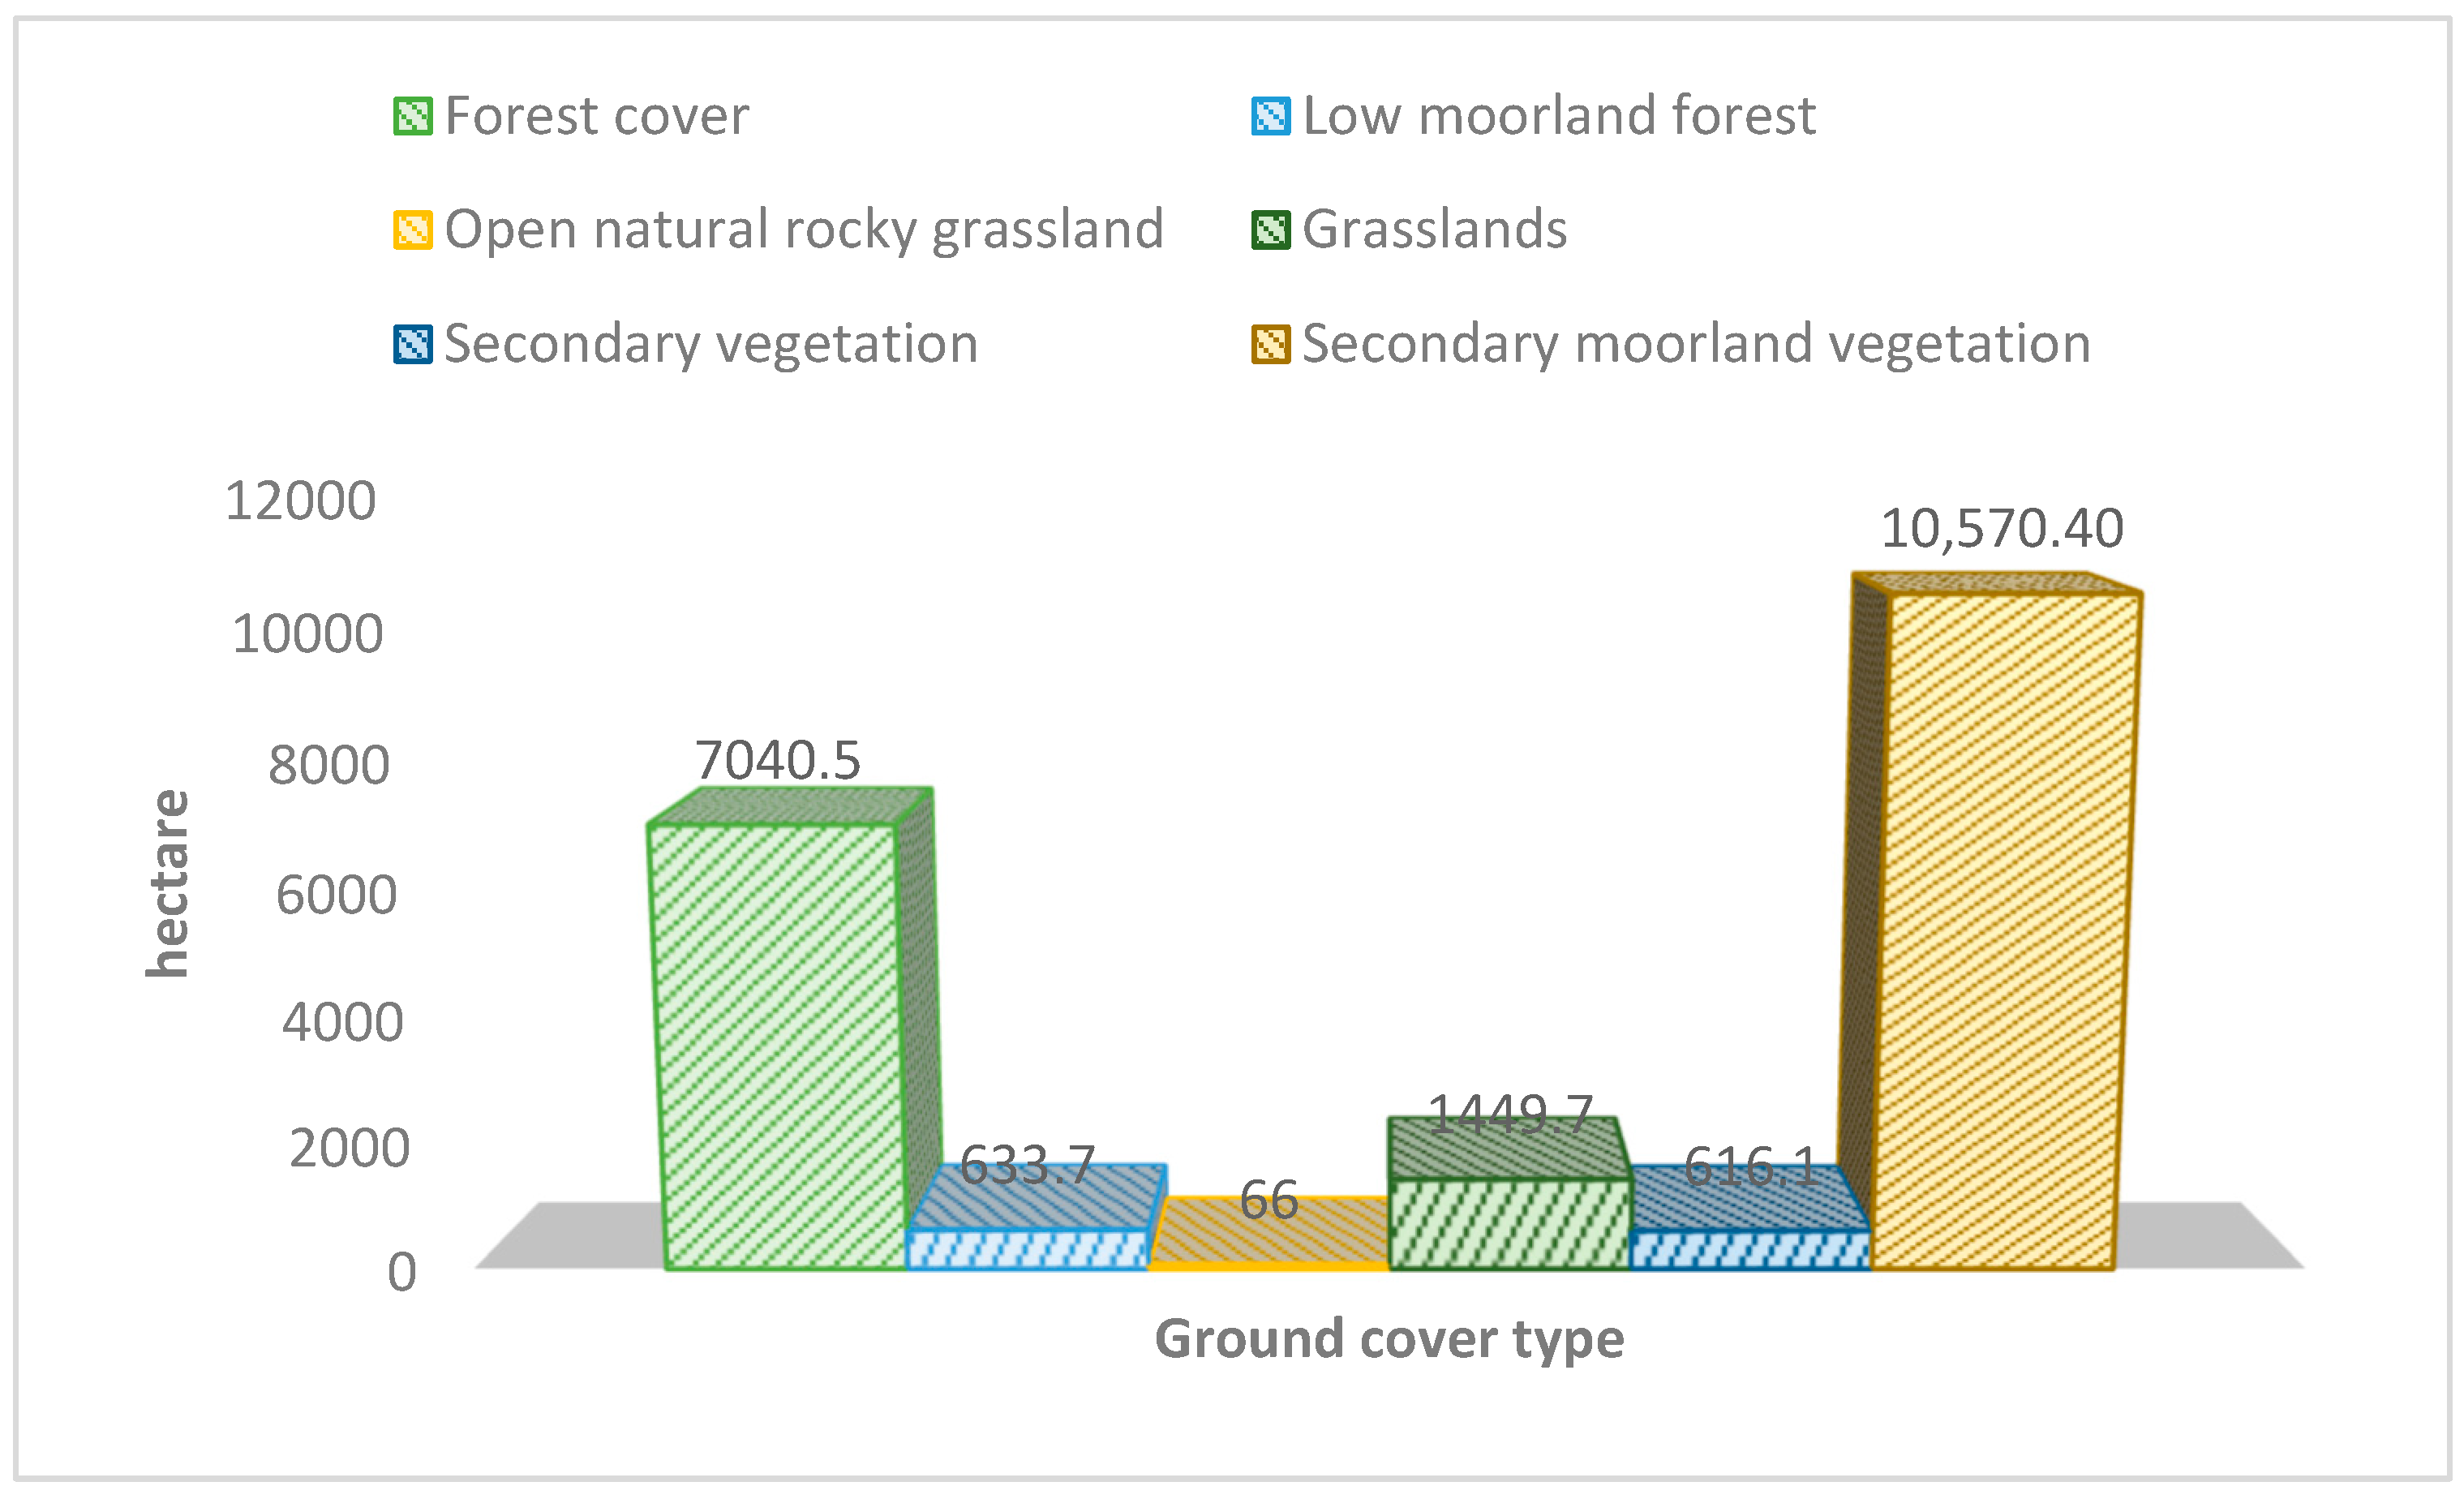
3.3. SOC Estimation in Vegetation Covers

In the La Nevera locality, the estimated amount of SOC for the forest cover was on average 33 t SOC/ha for a bulk density of 0.46 g/cm3 at a depth of 10 cm. Since the locality has an area of 7040.5 ha of forest, the amount of carbon stored is expected to be 237,491.91 tonnes. On the other hand, for the pasture and secondary vegetation covers, both used for animal grazing, the average SOC was 25 t SOC/ha, for a bulk density of 0.50 g/cm3 at a depth of 10 cm. As the region presents an area of 2065.8 ha of these vegetation covers, the expected amount of carbon stored is 52,281.22 tonnes.
Castañeda and Montes (2017) [21] explain that soil organic carbon content depends on the natural vegetation and the protection it provides to the soil surface, protecting it from precipitation and direct solar radiation, ensuring less decomposition of organic matter, which leads to a greater amount of organic carbon. Additionally, Avellaneda et al. (2018) [3] found that cattle ranching influenced soil organic carbon levels. In their study conducted in Los Nevados National Natural Park, areas used for cattle ranching had lower SOC values compared to areas with conservation of vegetation cover. According to these researchers, the loss of native vegetation in these areas directly exposes soils to environmental factors such as precipitation, wind, and solar radiation, which can cause erosion.
In a study conducted in an agroecosystem in Tenerife, located in the municipality of El Cerrito, Valle del Cauca, Colombia (3°42′55″ N and 76°04′44″ W, at elevations between 2200 and 3000 m above sea level) Gómez and Ramírez (2022)[44] contrasting soil organic carbon behavior between forest and pasture cover in the areas influenced by moorlands was observed: Las Hermosas, Las Dominguez, Pan de Azúcar, and Valle Bonito. They obtained values of 105.96 t/ha of SOC from a depth of 20 cm and a bulk density of 0.6 (g/cm3) in forests, and for pastures, they found 151.2 t/ha of SOC for a bulk density of 0.63 (g/cm3) and a depth of 20 cm, demonstrating that agricultural and management tillage can preserve and improve soil organic matter and have positive implications for soil carbon contents and soil structure [45].

3.4. CF Estimation in the Livestock Systems

In the study area, it was estimated that cattle emitted 2,119,416.29 kg CO2eq/year. In Table 2, emissions are disaggregated by enteric methane (CH4 enteric), excreta methane (CH4 excreted), and excreta nitrous oxide (N2O excreted).
As the study area presented two livestock orientations—milk and meat—the carbon footprint estimation showed an emission intensity for milk and meat of 2.77 kg CO2eq/kg milk and 34.71 kg CO2eq/kg meat. These results are consistent with those reported by Paez (2016) [46], who, after analyzing 55 production units located in the rural area of the eastern cordillera of Colombia with similar altitude conditions, found emission intensities ranging from 0.327–9.02 kg CO2eq per kilogram of milk produced. The significant variation in values is attributed to the differing dynamics involved in producing the final product on the farm, the low level of technological integration, and extensive management practices. In this context, enteric fermentation is the primary source of greenhouse gas emissions. Similarly, González et al. (2020) [43], in a study conducted on 1313 dual-purpose livestock farms in Colombia, found the emission intensity for milk was between 2.1 and 4.2 kg CO2eq per unit of product, values like those found in the present study. On the other hand, the carbon footprint found for meat was between 9 and 18.3 kg CO2eq per unit of product, values below those found in this study. This difference could be attributed to the low pasture yields in the high tropics, which has an impact on animal weight gains. However, Molina et al. (2019) [20] report that the emission intensity for beef cattle under high tropic conditions is around 46.2 kg CO2eq per unit of product.

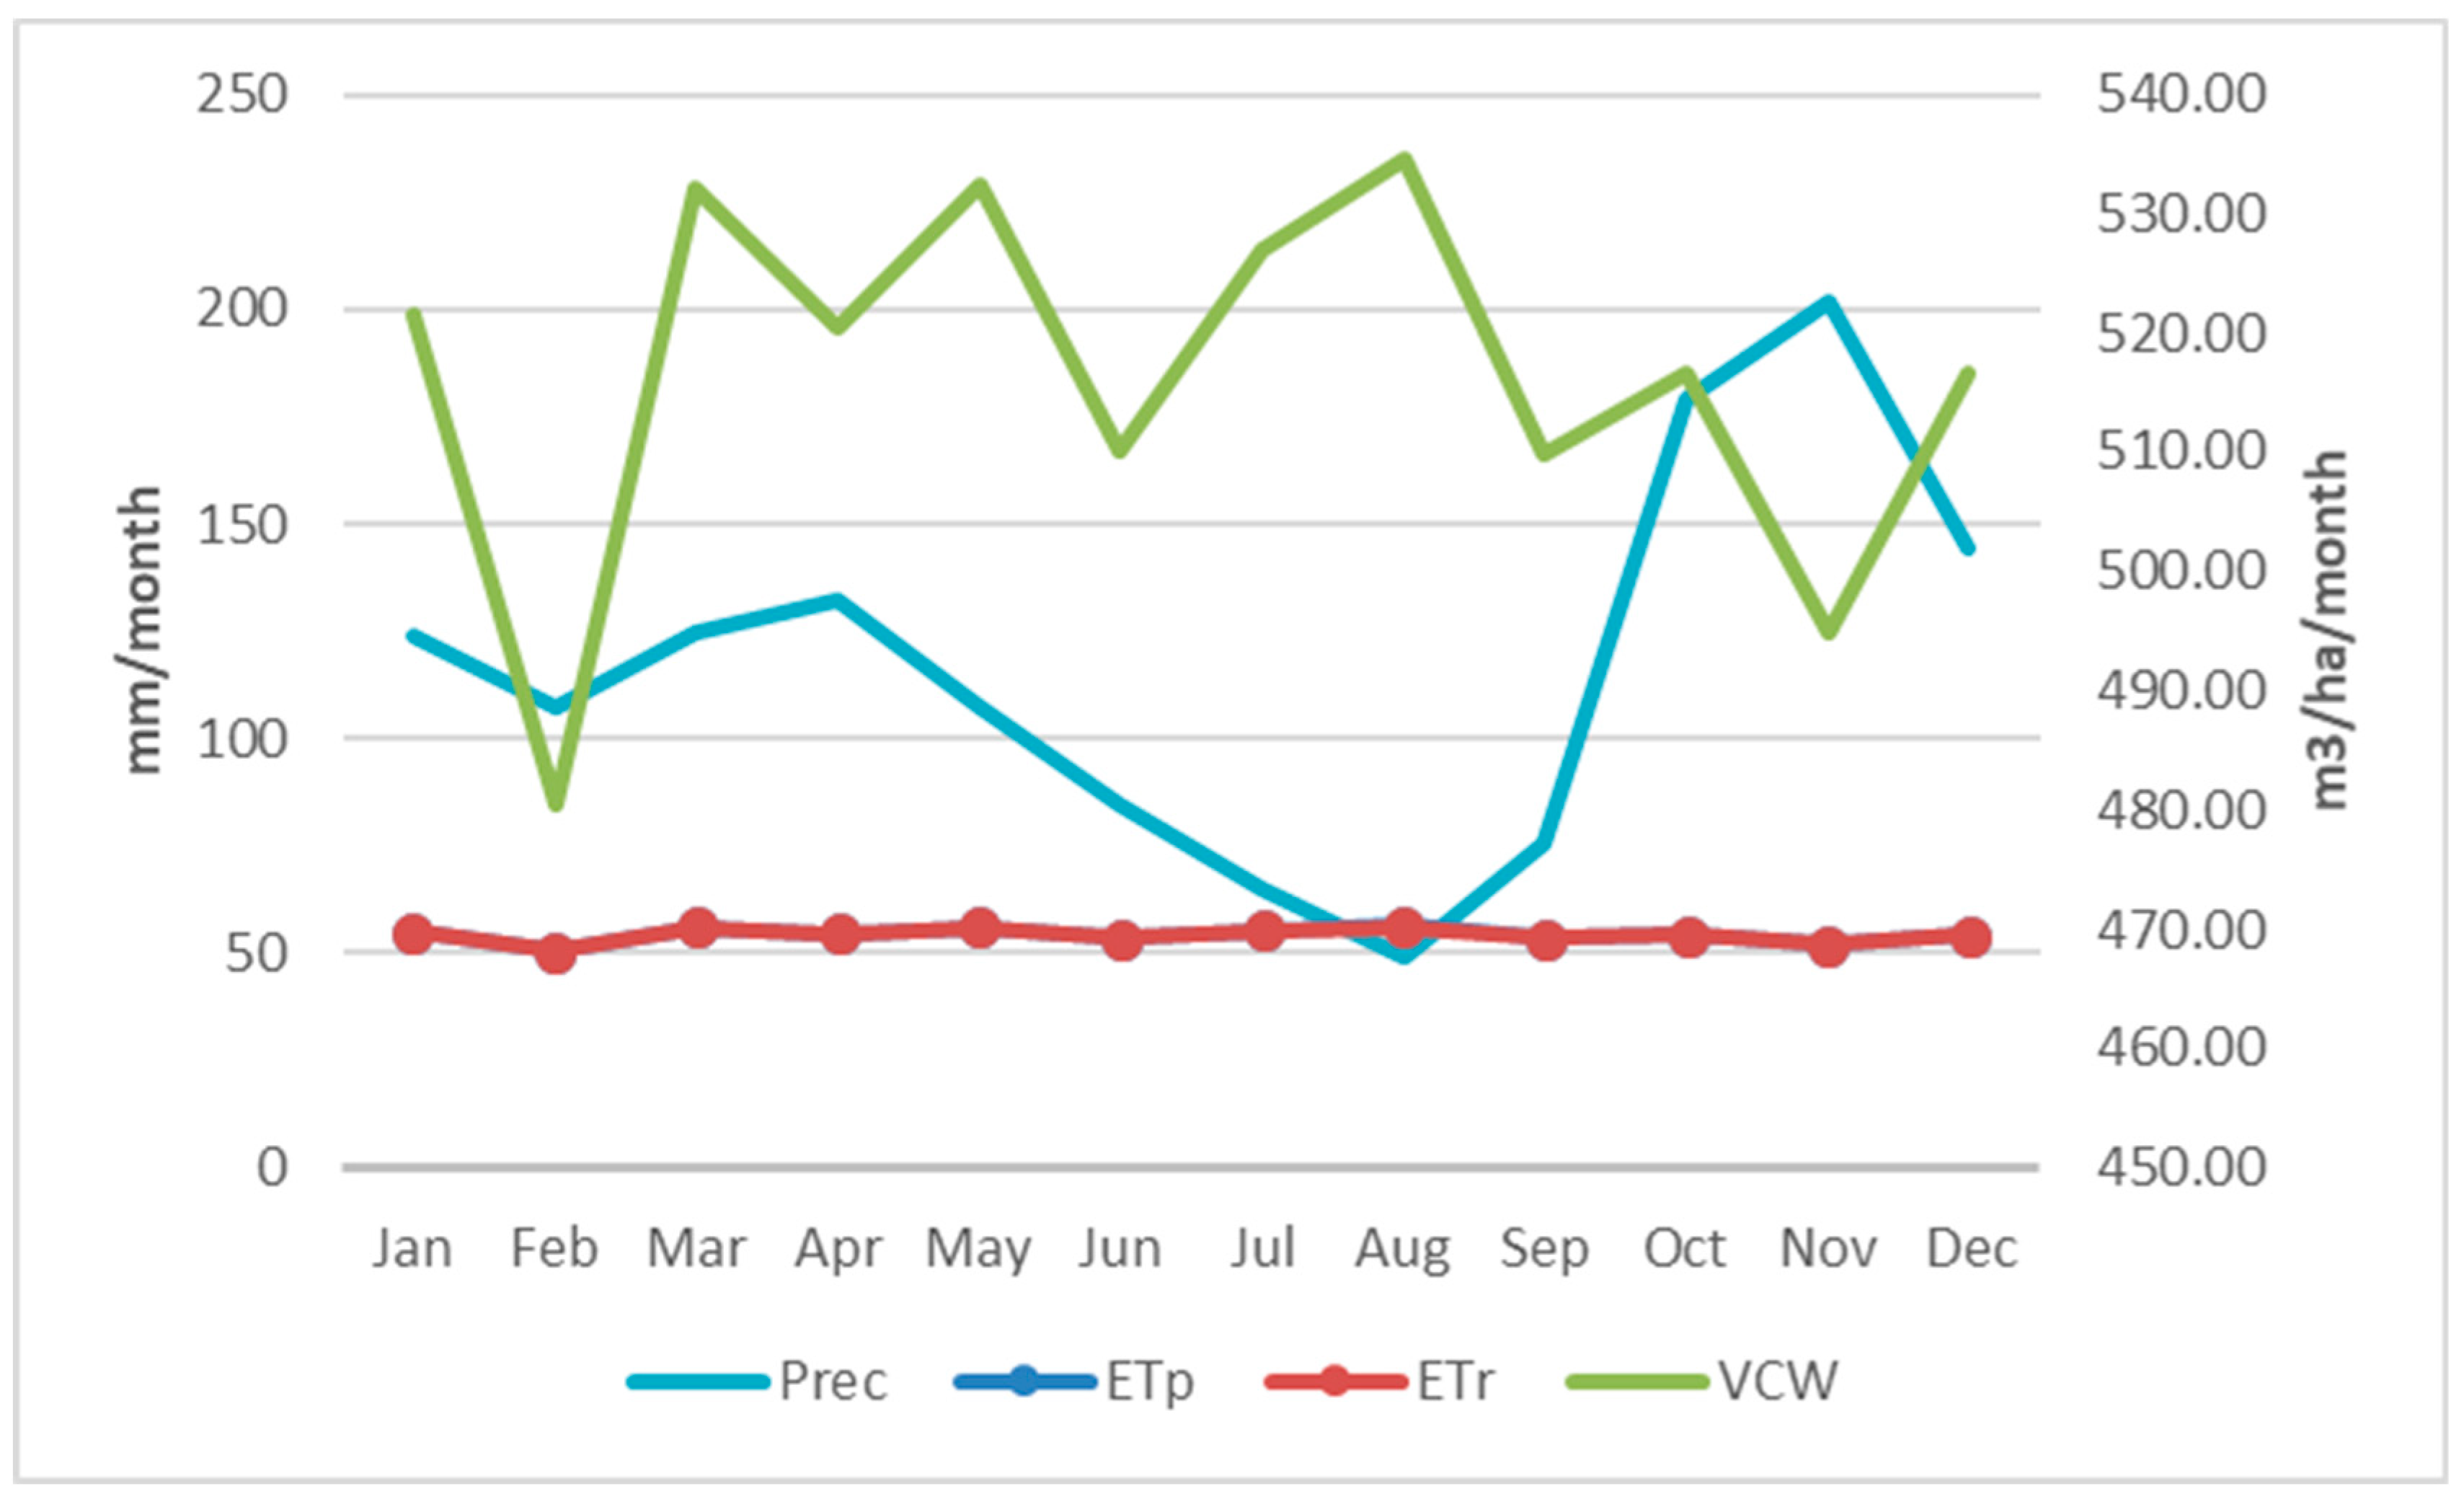
3.5. WF Estimation in the Livestock Systems

According to the water balance carried out for the La Nevera locality, it was observed that Kikuyo grass (Cenchrus clandestinus) was the main species in the region, with an estimate water requirement of 6196.39 m3 of water per hectare annually. The monthly values of this balance are shown in Figure 2.
Figure 2 shows the relationship between the amount of water entering (precipitation) and leaving (evapotranspiration) the study area during a given period, showing how water is distributed in an area and whether there is an excess or deficit. Based on the above, the water consumption by the pasture crop used for cattle feed is estimated.
The annual rainfall in the area is 1394.5 mm, and each hectare of pasture consumes 6196.40 m3 of water. This value is similar to that reported by Martínez et al. (2016) [47], which shows a total water requirement of 7823.54 m3/year/ha for grasslands composed of star grass (Cynodon nlemfuensis).
The distribution of water consumption throughout the livestock production process is detailed in Table 3, and the total WF is shown in Table 4. Notably, most of the water (99.24%) is used for pasture production, which is the sole feed source for the cattle in this locality. Water consumed directly by the animals accounts for only 0.65%, while the remaining 0.11% is used for cleaning the stables.
Once the quantities of water consumed per animal, through drinking and pasture consumption, and the water used in services were estimated, they were multiplied by the number of animals for each age group to calculate the blue, green, and gray water of the livestock activity in the study area (Table 4).
When calculating the total water consumption across three components—drinking, feed, and services—the cattle ranching activity in this study sector uses 1,909,430.83 m3 of water annually. Using the same assumptions applied in the carbon footprint calculation, the water footprint is 2.5 m3 per kilogram of milk produced and 35 m3 per kilogram of meat produced.
Corredor et al. (2017) [48] found that, in 55 production units located in a rural area of the eastern mountain range, 95% of water consumption was green water, 1.56% blue water, and 3.26% gray water. These data confirm that most of the water consumed on livestock farms is used in the production of pastures for consumption. The difference found in gray water, with respect to this study, may be due to the level of modernization—robotic milking parlors, cooling tanks, among others—of the farms located in this study region. On the other hand, Martínez et al. (2016) [47], in research carried out in a livestock system in the low tropics, determined a water footprint of 1.9 m3 of water per kilogram of milk, with 97.4% of this water used in the production of pasture crops throughout their growth cycle. The information found on water use shows the negative impact of livestock production on this resource, the main environmental characteristic of the moorland areas, which is why state and regional policies must be developed for the technical development of livestock activity in order to mitigate its impact in these highly fragile areas.

4. Conclusions

The present work was developed with the aim of creating a baseline for indicators of soil organic carbon (SOC) sequestration, GHG emissions, and water consumption associated with livestock agroecosystems located in an ecoregion of high water impact to analyze the possible future environmental impact of agronomic and livestock practices in sensitive areas due to the fragility of soil, air, and water resources.
According to the data obtained for soil organic carbon, forests presented 33 t SOC/ha and pastures 25 t SOC/ha. It is evident that agricultural and livestock activities decrease the carbon content stored in the soil, possibly due to the removal of native vegetation, which reduces the contribution of organic matter to the soil and accelerates the decomposition of plant residues due to increased exposure to sunlight, precipitation, and the negative effect of the wind factor. The analysis of the water and carbon footprint provided information on the emissions and resource consumption associated with each production unit.
In relation to the primary products derived from the livestock systems in the study area, carbon footprints of 2.77 kg CO2eq/kg for milk and 34.71 kg CO2eq/kg for meat were found, as well as a consumption of 2.5 m3 of water per kg of milk and 35 m3 per kg of meat, which reflects the low productive efficiency of cattle farming in the high tropics.
Given the negative impact on environmental resources and low biological efficiency, livestock production systems must be intervened with to improve animal productivity through better nutrition, health, and reproduction of the system, with the aim of significantly reducing the impact on water and carbon footprints.
In general, research on carbon emissions, greenhouse gas (GHG) emissions, and water consumption in high mountain agroecosystems is limited, despite the fundamental role these ecosystems play in the planet’s biogeochemical cycles. There are other socio-economic factors that negatively affect land use. However, alternatives for livestock production must be sought that allow for the sustainability of the system and guarantee the human development of producers in order to concertedly reduce GHG emissions related to deforestation and forest degradation caused by the alteration of vegetation cover for agricultural exploration activities in areas of limited biological resilience.

Author Contributions

Conceptualization—investigation, R.A.M.B.; Project administration, R.C.G.; Formal analysis, M.V.T.; Writing—review, A.S.A.; editing, D.C.Q.; Writing—draft, H.S.G. All authors have read and agreed to the published version of the manuscript.

Funding

This research was funded by Universidad Nacional de Colombia grant Hermes 60026 and Sassary University.

Conflicts of Interest

The authors declare no conflicts of interest.

References

  1. Bustamante, C.; Rojas, L. Reflexiones sobre transiciones ganaderas bovinas en Colombia, desafíos y oportunidades. Biodivers. Pract. 2018, 3, 1–29. [Google Scholar]
  2. ICA (Instituto Colombiano de Agricultura). Censo Pecuario Nacional. 2023. Available online: https://www.ica.gov.co/areas/pecuaria/servicios/epidemiologia-veterinaria/censos-2016/censo-2018 (accessed on 3 June 2024).
  3. Avellaneda, L.M.; León, T.E.; Torres, E. Impact of potato cultivation and cattle farming on physicochemical parameters and enzymatic activities of Neotropical high Andean Páramo ecosystem soils. Sci. Total Environ. 2018, 631–632, 1600–1610. [Google Scholar] [CrossRef] [PubMed]
  4. Molina, R.A.; Sánchez, H. Sostenibilidad de sistemas ganaderos bovinos de alta montaña en Colombia. Rev. Investig. Agrar. Ambient. 2017, 8, 29–36. [Google Scholar] [CrossRef]
  5. Teague, R.; Barnes, M. Grazing management that regenerates ecosystem function and grazingland livelihoods. Afr. J. Range Forage Sci. 2017, 34, 77–86. [Google Scholar] [CrossRef]
  6. Solomon, T.; Gupta, V.; Ncho, C.M. Balancing Livestock Environmental Footprints with Forestry-Based Solutions: A Review. Ecologies 2023, 4, 714–730. [Google Scholar] [CrossRef]
  7. Hao, X.; Yang, J.; Dong, S.; He, F.; Zhang, Y. The influence of grazing intensity on soil organic carbon storage in grassland of China: A meta-analysis. Sci. Total Environ. 2024, 924, 171439. [Google Scholar] [CrossRef]
  8. Liu, Y.; Zhang, M.; Wang, X.; Wang, C. The impact of diferent grazing intensity and management measures on soil organic carbon density in Zhangye grassland. Sci. Rep. 2024, 14, 17556. [Google Scholar] [CrossRef]
  9. Kumar, S.; Dixit, A.K.; Prasad, M.; Rai, S.K.; Mahanta, S.K.; Singh, S.; Radotra, S.; Ghosh, P.K. Effects of grazing intensity and pasture type on soil organic carbon stock in the semi-arid tropics of India. Trop. Grassl.-Forrajes Trop. 2023, 11, 41–51. [Google Scholar] [CrossRef]
  10. Páez, E.M.; Corredor, E.S.; Fonseca, J.A. La huella hídrica y la huella de carbono: Herramientas para estimar el impacto de la ganadería bovina. Pensam. Y Acción 2018, 24, 81–92. [Google Scholar]
  11. Yerena, J.I.; Jiménez, J.; Rodríguez, E.A.; Aguírre, O.A.; González, M.A.; Treviño, E.J. Dinámica de la captura de carbono en pastizales abandonados del noreste de méxico. Trop. Subtrop. Agroecosyst. 2014, 17, 113–121. [Google Scholar]
  12. Heinke, J.; Lannerstad, M.; Gerten, D.; Havlík, P.; Herrero, M.; Notenbaert, A.M.O.; Holger, H.; Muller, C. Water use in global livestock production—Opportunities and constraints for increasing water productivity. Water Resour. Res. 2020, 56, e2019WR026995. [Google Scholar] [CrossRef]
  13. Gerbens, P.W.; Mekonnen, M.M.; Hoekstra, A.Y. The water footprint of poultry, pork and beef: A comparative study in different countries and production systems. Water Resour. Ind. 2013, 1, 25–36. [Google Scholar] [CrossRef]
  14. Ibidhi, R.; Salem, H.B. Water footprint of livestock products and production systems: A review. Anim. Prod. Sci. 2020, 60, 1369–1380. [Google Scholar] [CrossRef]
  15. Gaillac, R.; Marbach, S. The carbon footprint of meat and dairy proteins: A practical perspective to guide low carbon footprint dietary choices. J. Clean. Prod. 2021, 321, 128766. [Google Scholar] [CrossRef]
  16. Mazzetto, A.M.; Falconer, S.; Ledgard, S. Mapping the carbon footprint of milk production from cattle: A systematic review. J. Dairy Sci. 2022, 105, 9713–9725. [Google Scholar] [CrossRef]
  17. Desjardins, R.L.; Worth, D.E.; Vergé, X.P.C.; Maxime, D.; Dyer, J.; Cerkowniak, D. Carbon Footprint of Beef Cattle. Sustainability 2012, 4, 3279–3301. [Google Scholar] [CrossRef]
  18. Bermudez, C.E.; Arenas, N.E.; Moreno, V. Caracterización socio-económica y ambiental en pequeños y medianos predios ganaderos en la región del Sumapaz, Colombia. Rev. UDCA Actual. Divulg. Cient. 2017, 20, 199–208. [Google Scholar]
  19. Sala, O.; Yahdjian, L.; Havstad, K.; Aguiar, M. Rangeland Systems Processes, Management and Challenges; Springer Open: Cham, Switzerland, 2017; Volume 14, pp. 467–489. [Google Scholar] [CrossRef]
  20. Molina, R.A.; Campos, R.; Sánchez, H.; Giraldo, L.; Atzori, A.S. Sustainable Feedbacks of Colombian Paramos Involving Livestock, Agricultural Activities, and Sustainable Development Goals of the Agenda 2030. Systems 2019, 7, 52. [Google Scholar] [CrossRef]
  21. Castañeda, A.; Montes, C. Carbono alamcenado en Páramo Andino. Entramado 2017, 13, 210–221. [Google Scholar] [CrossRef]
  22. Corporación Autónoma Regional del Valle del Cauca. GeoVisor. 2022. Available online: https://geo.cvc.gov.co/visor_avanzado/ (accessed on 3 June 2024).
  23. Molina, R.A.; Gaona, R.C.; Atzori, A.S.; Sánchez, L.F.; Guerrero, H.S. Application of a system dynamics model to evaluate the implementation of payment for environmental services as a reconversion mechanism in high mountain farming. Ecol. Model. 2023, 484, 110469. [Google Scholar] [CrossRef]
  24. FAO. Soil Organic Carbon: The hidden potential. In Banking (Issue March); FAO: Rome, Italy, 2017; Available online: https://www.inter-reseaux.org/en/ressource/fao-soil-organic-carbon-the-hidden-potential/ (accessed on 24 June 2024).
  25. Molina, R.A. Sostenibilidad de los Sistemas Ganaderos Ubicados en el Parque Natural Nacional de las Hermosas y su Zona de Influencia. Master’s Thesis, Universidad Nacional de Colombia, Bogotá, Colombia, 2011. Available online: https://repositorio.unal.edu.co/handle/unal/7347 (accessed on 3 June 2024).
  26. Hatfield, J.L.; Mangino, J.; McAllister, T.A. Chapter 10. Emissions from Livestock and Manure Management. In 2006 IPCC Guidelines for National Greenhouse Gas Inventories; Agriculture, Forestry and Other Land Use; IPCC: Geneva, Switzerland, 2006; Volume 4, Available online: https://www.ipcc-nggip.iges.or.jp/public/2006gl/pdf/4_Volume4/V4_10_Ch10_Livestock.pdf (accessed on 3 June 2024).
  27. Gerber, P.; Vellinga, T.; Opio, C.; Steinfeld, H. Productivity gains and green house gas emissions intensity in dairy systems. Livest. Sci. 2011, 139, 100–108. [Google Scholar] [CrossRef]
  28. Serra, M. Estimation of Carbon Footprint in Dairy Cattle Farms of Southern Italy. Ph.D. Thesis, Università degli Studi di Sassari, Sassari, Italy, 2013. Available online: https://iris.uniss.it/handle/11388/250597 (accessed on 3 June 2024).
  29. Klein, C.; Novoa, R.S.A.; Ogle, S. Chapter 11: N2O Emissions from Managed Soils, and CO2 Emissions from Lime and Urea Application. In 2006 IPCC Guidelines for National Greenhouse Gas Inventories; Agriculture, Forestry and Other Land Use; IPCC: Geneva, Switzerland, 2006; Volume 4, Available online: https://www.ipcc-nggip.iges.or.jp/public/2006gl/pdf/4_Volume4/V4_11_Ch11_N2O&CO2.pdf (accessed on 3 June 2024).
  30. Foster, P.; Ramaswamy, V. Chapter 2: Changes in Atmospheric Constituents and in Radiative Forcing. In Contribution of Working Group I to the Fourth Assessment Report of the Intergovernmental Panel on Climate Change. Cambridge University Press: Cambridge, UK; New York, NY, USA, 2007; p. 105. Available online: https://www.ipcc.ch/site/assets/uploads/2018/02/ar4-wg1-chapter2-1.pdf (accessed on 3 June 2024).
  31. Internationl Dairy Federation. A common carbon footprint approach for dairy: The IDF guide to standard lifecycle assessment methodology for the dairy sector. Bull. Int. Dairy Fed. 2010, 445, 1–40. [Google Scholar]
  32. Chapagain, A.K.; Hoekstra, A.Y. Water Footprints of Nations; UNESCO-IHE Delft Institute for Water Education: Delft, The Netherlands, 2004; Available online: https://www.waterfootprint.org/resources/Report16Vol1.pdf (accessed on 3 June 2024).
  33. Meyer, U.; Everinghoff, D.; Gadeken, G.; Flachowsky, G. Investigations on the water intake of lactating dairy cows. Livest. Prod. Sci. 2004, 90, 117–121. [Google Scholar] [CrossRef]
  34. Winchester, C.F.; Morris, M.J. Water intake rates of cattle. J. Anim. Sci. 1956, 15, 722–740. [Google Scholar] [CrossRef]
  35. Thornthwaite, C.W. An approach toward a rational classification of climate. Geogr. Rev. 1948, 38, 55. [Google Scholar] [CrossRef]
  36. Franco, L.H.; Calero, D.; Durán, C. Manejo y Utilización de Forrajes Multipropósito. Proyecto: Evaluación de Tecnologías por métodos Participativos para la Implementación de Sistemas Ganaderos Sostenibles en el norte del Departamento del Valle del Cauca; Centro Internacional de Agricultura Tropical (CIAT), Universidad Nacional de Colombia Palmira: Palmira, Colombia, 2006. Available online: https://repositorio.unal.edu.co/bitstream/handle/unal/8429/9789584411754.pdf?sequence=1 (accessed on 3 June 2024).
  37. Montoya, S.; Chará, J.D.; Murgueitio, E.; Correa, G.A.; Barahona, R. Producción forrajera y consumo en ganaderías colombianas con diversos sistemas de pastoreo incluyendo sistemas silvopastoriles. Livest. Res. Rural Dev. 2023, 35, 1. [Google Scholar]
  38. Nosetti, L.; Herrero, M.; Pol, M.; Maldonado, M.; Iramain, M.; Flores, M. Cuantificación y caracterización de agua y efluentes en establecimientos lecheros: Demanda de agua y manejo de efluentes. InVet 2000, 4, 37–43. [Google Scholar]
  39. Di Rienzo, J.A.; Casanoves, F.; Balzarini, M.G.; Gonzalez, L.A.; Tablada, E.M. InfoStat; Versión 2020; Universidad Nacional de Córdoba: Córdoba, Argentina, 2024; Available online: http://www.infostat.com.ar/index.php?mod=page&id=34 (accessed on 3 June 2024).
  40. DANE. Encuesta Nacional Agropecuaria: Tomo 2 Resultados [Informe]. Available online: https://www.dane.gov.co (accessed on 4 June 2024).
  41. Fedegan. Ganadería Colombiana: Hoja de Ruta 2018–2022; Fedegan: Bogotá, Colombia, 2018; ISBN 978-958-8498-80-5. [Google Scholar]
  42. Naranjo, L.F.; Rodríguez, N.; Uron, C.A. Caracterización bromatológica de pastos en seis municipios del Departamento de Norte de Santander; Colombia: Bromatological characterization of pastures in six municipalities of the Department of Norte de Santander; Colombia. Sci. Et Tech. 2023, 27, 245–252. [Google Scholar] [CrossRef]
  43. González, R.; Barahona, R.; Bolívar, D.M.; Chirinda, N.; Arango, J.; Pantévez, H.A.; Correa, G.; Sánchez, M.S. Technical and environmental characterization of dual-purpose cattle farms and ways of improving production: A case study in Colombia. Pastoralism 2020, 10, 19. [Google Scholar] [CrossRef]
  44. Gómez, F.Z.; Ramírez, L.M. Contenidos de carbono y nitrógeno del suelo en un agroecosistema altoandino del Valle del Cauca, Colombia. Rev. UDCA Actual. Divulg. Cient. 2022, 25, e2057. [Google Scholar] [CrossRef]
  45. Alves, L.A.; de Oliveira Denardin, L.G.; Martins, A.P.; Bayer, C.; Veloso, M.G.; Bremm, C.; Carvalho, P.C.D.F.; Machado, D.R.; Tiecher, T. The effect of crop rotation and sheep grazing management on plant production and soil C and N stocks in a long term integrated crop-livestock system in Southern Brazil. Soil Tillage Res. 2020, 203, 104678. [Google Scholar] [CrossRef]
  46. Páez, E. Medición de Huellas Ambientales Como Indicadores de Sostenibilidad en Unidades de Producción Ganadera Bovina en la Región Centro del Departamento de Boyacá (Colombia). Bachelor’s Thesis, Universidad Católica de Ávila, Bogotá, Colombia, 2016. Available online: https://dialnet.unirioja.es/servlet/dctes?codigo=180196 (accessed on 3 June 2024).
  47. Martínez, C.; Ruíz, X.; Morales, S. Huella hídrica de una finca ganadera lechera bajo las condiciones agroecológicas del valle del Cauca. Biotecnol. En El Sect. Agropecu. 2016, 14, 47–56. [Google Scholar] [CrossRef]
  48. Corredor, E.S.; Castro, E.S.; Páez, E.M. Water footprint estimation from milk production in Tunja, Boyacá. Rev. Cienc. Y Agric. 2017, 14, 7–17. [Google Scholar] [CrossRef]
Figure 1. Vegetation cover for the La Nevera locality, Amaime River basin.
Sustainability 17 01135 g001
Figure 2. Water balance for the La Nevera locality. Where: precipitation (Prec), evapotranspiration real (ETR), evapotranspiration potential (ETP), virtual crop water (mm/month/ha) (VCW).
Sustainability 17 01135 g002
Table 1. Productive characteristics of the 22 livestock systems of the La Nevera locality.
Cattle InventoryPasture Chemical CompositionReproductive Variables
Animal GroupsnDM (%)18.1 ± 4.9CI (months)14.87 ± 1.7
Dairy cows193OM (%)67.5 ± 5.9ICC (days)165.6 ± 53.4
Prepartum dry cows93CP (%)15.9 ± 5.1BR (%)77.54 ± 7.4
Heifers130NDF (%)60.4 ± 3.4AFC (months)41.63 ± 6.7
Prepubertal heifers137ADF (%)30.2 ± 3.4
Calves166EE (%)3.7 ± 0.64
Weaned calves297ASH (%)9.4 ± 0.83
Fattening steers90GE (kcal/kg)4011.8 ± 227.2
Bulls15
Total1121
DM: dry matter; OM: organic matter; CP: crude protein; NDF: neutral detergent fiber; ADF: acid detergent fiber; EE: ether extract; GE: gross energy; CI; calving interval; ICC: interval of calving to conception; BR: birth rate; AFC: age at first calving.
Table 2. Estimates of greenhouse gases (GHGs) emitted by the cattle inventory of the La Nevera locality.
GHGskg/YearCO2eq (kg/Year)
CH4 enteric61,738.931,543,473.22
CH4 excreted1218.9030,472.56
N2O excreted1830.44545,470.51
Table 3. Distribution of water consumed during the entire livestock production process in the locality.
Study AreaFC < 1 YearsMC < 1 YearsF = 1–2 YearsM = 1–2 YearsF = 2–3 YearsM = 2–3 YearsF > 3 YearsM > 3 Years
No. Animals83831372971309028615
LW (kg)90100220250380390430500
NEm (MJ/kgDM)5.55.55.55.55.55.5 5.5
DE% (as % gross energy) 55
DMI (kg/day)2.853.085.576.138.398.5610.3210.65
GFC (kg/day)9.010.022.025.038.039.043.050.0
DW (l/animal/day)9.7810.5919.1221.0528.8129.3857.5036.54
WS (washing facilities—l/day) 20
PWR (m3/ha/year)6196.406196.406196.406196.406196.406196.406196.406196.40
GFP (kg/ha/year)40,00040,00040,00040,00040,00040,00040,00040,000
AGFC (kg/year)328536508030912513,87014,23515,69518,250
GWC (m3/animal/year)508.88565.421243.931413.552148.602205.142431.312827.11
BW (m3/year)296.36320.73956.322281.801367.25965.186002.74200.08
GW(m3/year) 2087.8
GrW (m3/year)42,236.9646,929.96170,417.95419,825.23279,318.07198,462.84695,354.9842,406.59
FC: female calves; MC: male calves; F: females; M: males; LW: live weight; NEm: net energy for maintenance; DE: digestible energy; DMI: dry matter intake; GFC: green forage consumption; DW: drinking water; WS: water services; PWR: pasture water requirement; GFP: green forage production; AGFC: animal green forage consumption; GWC: grass water consumption; BW: blue water; GW: gray water; GrW: green water.
Table 4. Water footprint of the studied livestock production systems.
Water Typem3/Year%
Blue water12,3900.65
Gray water20880.11
Green water1,894,95399.24
Total1,909,431100
Disclaimer/Publisher’s Note: The statements, opinions and data contained in all publications are solely those of the individual author(s) and contributor(s) and not of MDPI and/or the editor(s). MDPI and/or the editor(s) disclaim responsibility for any injury to people or property resulting from any ideas, methods, instructions or products referred to in the content.

