Abstract
Under the background of global climate change and sustainable development, low-carbon transformation has become an inevitable choice for China and even global economic development. As the cornerstone of social stability and the key to people’s well-being, employment is facing profound changes brought about by low-carbon development. Based on the micro perspective of enterprise behavior change, this paper takes the implementation of China’s low-carbon city pilot policy as an exogenous policy shock and constructs a time-varying difference-in-differences (DID) model to test the impact of the low-carbon city pilot policy on enterprise employment, based on the data of China’s A-share listed enterprises from 2008–2021. The results show that the implementation of low-carbon city pilot policies significantly expands the employment scale of enterprises and increases overall employment by about 6.77%. From the perspective of employment skill structure, it can promote the employment of high-skilled and low-skilled workers. From the perspective of employment position structure, it can promote the employment of production operations personnel, technology research and development personnel, and service and management personnel. These results are still valid after a series of robustness tests. The policy effect is due to the deepening of enterprise capital integration, green investment, technological innovation and vertical specialization. In addition, it is also affected by the differences of enterprise ownership, enterprise scale, industry pollution degree, regional environmental regulation, and market competition degree. Further research shows that low-carbon city pilot policies significantly reduce the share of labor income of employees in heavily polluting enterprises, resulting in the loss of employee welfare. From the perspective of employment, this paper provides more theoretical support and empirical evidence for low-carbon policies to drive changes in micro-enterprise behavior, so as to achieve the sustainable goals of “double carbon” and “stable employment”.
1. Introduction
With the increasing severity of global climate change and environmental problems, green and low-carbon transformation has become the only way for countries around the world to move towards sustainable development. At the 75th United Nations General Assembly in 2020, China pledged to reach a peak in carbon dioxide emissions by 2030 and to achieve carbon neutrality by 2060. Low-carbon transformation is not only a strategic choice at the national level but also an important task that every economic subject needs to actively participate in. As the main participants in economic activities, enterprises play a vital role. Low-carbon transformation methods such as clean technology, changes in energy structure, and environmental information publicity in enterprises are the changes made by enterprises at the micro level. These methods have played a key role in reshaping corporate development strategies, promoting production model innovation, and driving economic growth [1]. To achieve the goal of carbon emission reduction in the short run, the low-carbon transformation behavior of enterprises will inevitably lead to changes in the labor market. Enterprises will change their investment and financing behavior to reallocate factor resources, thus affecting the supply and demand structure of the labor market. The labor force of different industries and enterprises will face competition, elimination, and adjustment of employment [2]. In the current situation of increasing downward pressure on the economy and reducing demographic dividends, balancing low-carbon development and employment stability is an urgent problem to be solved in China’s current economic and social development.
The low-carbon city pilot policy, launched by China to address climate change and promote sustainable development, began in 2010 with five provinces and eight cities, including Guangdong and Liaoning. The policy expanded with a second batch in 2012 and further deepened in 2017. By 2021, 81 cities across six provinces and regions were included in the pilot program.
Early research on low-carbon city pilot policies focused on emission reduction targets and policy design logic [3]. Later studies highlighted the environmental and economic benefits of these policies. In terms of environmental benefits, low-carbon city pilot policies can significantly improve air quality and reduce pollutant emissions and carbon emissions [4,5]. In terms of economic benefits, low-carbon city pilot policies can promote industrial transformation and upgrading, green technology innovation, and the high-quality development of enterprises [6]. Institutional theory points out that enterprises usually lack the internal motivation for environmental governance due to the externalities of environmental pollution. However, reasonable environmental regulation will encourage enterprises to increase green investment for the purpose of transforming technological processes and realizing “innovation compensation”. This leads to the internalization of governance costs, which affects the production and performance of enterprises [7,8]. Wang et al. [9] used enterprise-level data to investigate the impact of policies on the green technology innovation of enterprises and found that the pilot policy would promote the green technology innovation of listed companies in pilot cities. The policies mainly induce the overall green technology innovation of enterprises through command-controlled policy tools [10]. Compared with green utility patent innovation, pilot policies have a more significant impact on green invention patent innovation [11]. Zheng et al. [12] found that pilot policies can promote the transformation of industrial structure through technological innovation [13], reduce the proportion of high-carbon industries, and improve the degree of upgrading of industrial structure, but the impact on the rationalization of industrial structure is not significant.
Focusing on the labor market, existing studies have discussed the internal relationship between environmental regulation and labor employment around the “double dividend hypothesis” [14,15]. Starting from specific emission reduction measures or environmental policies of countries or regions, they usually adopt the general equilibrium model to examine their impact on industry and regional employment [16,17]. Yamazaki [18] found that Britain’s revenue-neutral carbon tax policy resulted in an average employment growth rate of approximately 0.74% from 2007 to 2013. But Marin and Vona [19] simulated the impact of the carbon tax on employment, and the results showed that it would have a negative impact on employment in the short term [20].
Anyway, the impact of environmental regulation on employment is complex and multifaceted. Although most studies support the “Porter Hypothesis” view that technological innovation is driven, the direct result of innovation is not always equal to net job growth. And because of the differences in research content and subjects, scholars have not reached a consensus conclusion. Meanwhile, current studies mostly focus on how environmental regulation affects the overall demand for employment. It is believed that environmental regulation will affect the employment demand of the labor force through the output effect, factor substitution effect, and innovation compensation effect [21,22], while its role in optimizing or reshaping the employment structure is relatively less discussed.
According to the above analysis, it can be found that there is still a lack of research to test the impact of low-carbon city pilot policies on the job market from the enterprise level. Therefore, we use data from China’s A-share listed enterprises from 2008 to 2021, taking the implementation of low-carbon city pilot policies as a quasi-natural experiment, and employ a time-varying DID model to empirically test the impact of the policy on enterprise-level employment. This paper deeply analyzes how the impact of low-carbon policies drives the change of production decisions of enterprises and explores the impact of changes in enterprise behavior on different skill levels and position employment from a micro perspective. In the face of the constraints of low-carbon transition, enterprises can actively use the various tools of external capital markets to enhance their capabilities and tend to adopt capital integration strategies to promote green transition [23]. At the same time, green investment driven by low-carbon policies is the fundamental driving force behind the transformation of economic models and production and living styles to low-carbonization, and it can accelerate the renewal and upgrading of traditional investments [24]. In order to mitigate the transition challenges posed by low-carbon policies, enterprises will choose to change their production organizational model by upgrading the specialization of their production processes, which in turn will have a corresponding impact on the labor market [25]. Moreover, we examine the heterogeneity of policy effects at the enterprise level, comparing the differences in policy impact on enterprise employment under different ownership, scale, industry pollution degree, environmental regulation differences, and market competition. Furthermore, we analyze how this policy affects the salaries of employees.
The main contributions of this paper are as follows. Firstly, this paper focuses on the micro-effects of low-carbon policies, particularly their impact on enterprises and the labor market. While most research addresses macro-level effects, this study explores the direct and indirect impacts of low-carbon city pilot policies on employment, offering a detailed view of how changes in enterprise behavior influence the labor market over time. Secondly, it expands the depth and breadth of research from the perspective of employment. This paper not only pays attention to the impact of low-carbon policy on total employment but also probes into its differentiated impact on the employment structure of different skill levels and job positions. This comprehensive analysis helps us to more accurately grasp the dynamic and structural changes in the labor market during the low-carbon transformation process and provides a more detailed reference for policy-making. Thirdly, we reveal the heterogeneity of the impact of low-carbon city pilot policies on the labor force of different types of enterprises. Considering the differences in the capabilities and strategies of enterprises with different ownership, scale, industry pollution, environmental regulation, and market competition in low-carbon transformation, this paper conducts a heterogeneous analysis of the employment of different types of enterprises. This differentiated research helps to put forward more targeted policy suggestions and promote fair transformation.
The technology roadmap for the article is shown in Figure 1, and the rest of this paper is structured as follows. Section 2 explains the policy background and presents the hypotheses. Section 3 introduces the empirical model and data. Section 4 is the benchmark regression and robustness test. Section 5 presents a mechanism analysis. Section 6 is for further analysis, including the heterogeneity analysis of policies on the employment structure of enterprises and their impact on employees’ income. Section 7 summarizes the research conclusions. Section 8 proposes policy recommendations.
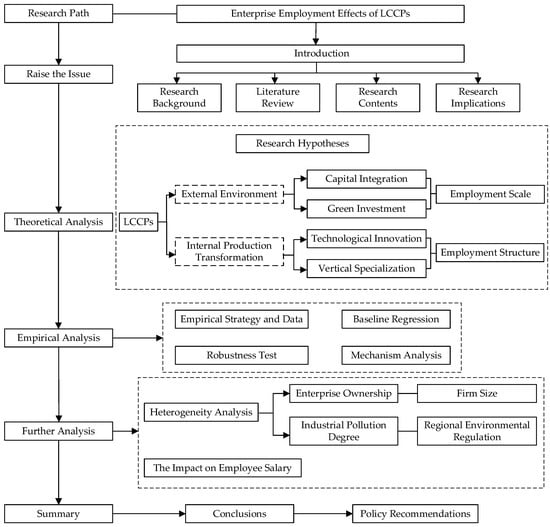
Figure 1.
Technology roadmap.
2. Policy Background and Research Hypotheses
2.1. The Construction of Low-Carbon Cities in China
As early as 2007, China’s total carbon emissions reached 6.6 billion tons, surpassing the United States to become the world’s largest carbon emitter. Nowadays, resource shortages and environmental degradation have become major obstacles to China’s sustainable development. In order to solve this dilemma, China has implemented low-carbon city pilot policies to achieve green and sustainable economic and social development. In 2008, the World Wildlife Fund (WWF) launched a low-carbon city development project in China, selecting Baoding and Shanghai as the first pilot areas. In 2010, China’s National Development and Reform Commission (NDRC) officially issued the “Notice on Carrying out Pilot Projects for Low-Carbon Provinces and Cities”, confirming that the first batch of pilot lists included five provinces and eight cities, including Guangdong and Hubei. Subsequently, the scope of the pilot project was gradually expanded, and the second batch of pilot projects was expanded to 29 provinces and cities, including Beijing and Shanghai in 2012. The third batch of pilot projects in 2013 included 45 cities (districts and counties) such as Wuhai and Shenyang. The policy gives local governments greater autonomy, allowing local governments to formulate a series of low-carbon industry development, low-carbon system construction, and other related policies on the basis of their own actual situation to control greenhouse gas emissions and promote regional green development.
The specific policy contents are shown in Table 1, mainly including the following three aspects. First of all, the pilot areas continue to improve their low-carbon policy systems. Twenty-five cities, including Shenzhen and Qingdao, have issued special plans for low-carbon development, while 24 cities, including Beijing, Tianjin, and Hangzhou, have issued climate change plans. For example, Shenzhen has proposed to constantly improve the low-carbon development policy and regulation system, low-carbon industrial system, low-carbon clean energy system, and carbon emission statistical accounting and assessment system. Secondly, they focus on the supply of green and low-carbon technologies. Ningbo emphasizes promoting technological innovation in the fields of renewable energy and advanced energy storage, the efficient recycling of solid waste resources, and carbon capture, utilization, and storage (CCUS) and has started to implement major special projects for “double carbon” scientific and technological innovation. Finally, in the exploration and practice of various cities, they seek experience and practices with typical demonstration significance. For example, some pilot cities continue to guide financial resources to invest in low-carbon areas, leveraging more social funds to promote carbon reduction and emission reduction. Some other cities have formed innovative models such as the “photovoltaic internet plus green financial model” and “finance plus market” photovoltaic village promotion and implemented a reform plan for climate finance and the construction of “carbon neutral” branches.

Table 1.
Implementation of low-carbon city pilot policies.
2.2. Research Hypotheses
From the perspective of the external environment of enterprises, low-carbon city pilot policies affect the capital structure and investment behavior of enterprises, which have an impact on employment. Capital integration and green investment are usually strategies adopted by enterprises to cope with changes in the external environment such as policies, regulations, and environmental pressure. These behaviors reflect how enterprises adapt and transform through resource integration and capital investment in the face of external challenges. From the perspective of the internal production transformation of enterprises, low-carbon city pilot policies also change the modes of technological innovation and production division within enterprises. Technological innovation and the professional division of labor are the keys to the optimization of internal management and operation of enterprises, which are directly related to the production efficiency, product quality, and market competitiveness of enterprises. The main references for all hypotheses are shown in Table 2.
2.2.1. Capital Integration
Faced with the constraints of low-carbon transformation, enterprises that can make full use of external capital market tools to empower enterprises will choose capital integration for low-carbon transformation to achieve the carbon emission control goals set by the governments of pilot regions [23]. As an important way to integrate resources in the capital market, green mergers and acquisitions (M&A) have obvious speed advantages, which can help the main merger enterprises quickly obtain the clean resources and clean technologies of the target enterprises and extend the industrial chain [26]. Green M&A introduces green concepts into the enterprise’s M&A strategy to achieve sustainable development by integrating environmental factors. In the context of strategic corporate decision-making, companies are more motivated to make green M&A decisions in order to maximize economic benefits, given investors’ investment preferences that are concerned about the environmental performance of the company and the increased regulatory and media pressures that enterprises face [27].
In addition, according to the institutional transaction cost theory and compliance cost hypothesis, the implementation of a green M&A strategy helps alleviate the compliance cost pressure of enterprises, improves market competitiveness, and has an impact on labor employment. For one thing, the implementation of green M&A strategies by enterprises has released positive signals of low-carbon development, which helps them reduce institutional transaction costs and obtain financing advantages and the potential benefits of government support [28]. Enterprises can quickly gain market share and consumer recognition and expand their product and service markets. The expansion effect of the production scale has also increased the overall employment demand of enterprises and expanded their employment scale. During the process, the upstream and downstream industrial chains continue to extend. For instance, thermal power companies after green M&A have absorbed low-sulfur coal production enterprises into the group, establishing a more stable supply chain system and increasing the demand for low-skilled workers and production operators. For another, according to the compliance cost hypothesis, it is believed that green M&A will reduce the investment of enterprises in other fields, resulting in an increase in operating costs [29]. However, green M&A can play a role in cost compensation at the same time because they can quickly obtain the environmental protection resources and high-tech resources needed for emission reduction, avoid possible environmental penalties and the risk of closure and rectification, and adapt to changes in the regulatory environment more quickly [30]. The introduction of new technologies and processes will increase the demand for highly skilled R&D personnel and further adjust the employment structure.
Hypothesis 1a.
The low-carbon city pilot policy can increase the employment scale of enterprises by promoting the integration of the capital market.
Hypothesis 1b.
The low-carbon city pilot policy can adjust the employment structure by promoting the integration of the capital market.
2.2.2. Green Investment
Investment is an important tool for stabilizing economic growth. Under the background of low-carbon policy, the inclination of investment into green areas can fundamentally promote the low-carbon transformation of the economic development model and production and living styles, accelerate the renewal of traditional investment, and provide a continuous and stable green investment policy environment [24]. Green investment is a kind of “social responsibility investment” that takes into account social development, environmental improvement, and economic efficiency improvement. It requires enterprises to invest a lot of resources into the allocation of cleaning equipment, technological upgrading, and green product research, as well as the construction of the corresponding organizational management system [31]. In the short term, it will occupy part of the productive investment of enterprises and reduce the demand for employment. But in the long run, green investment can effectively reduce pollutant emissions while reducing the cost of pollution control and environmental penalties. Thus, more funds will be used to expand productive investment and give full play to the multiplier effect of investment, which can help to expand production scale and derive new formats, so as to absorb more labor force and improve the overall employment level of enterprises [32].
The impact of green investment on the employment structure of enterprises is mainly reflected in the following two aspects. From the perspective of capital allocation, green investment builds a “bridge” for the development of the financial industry and environmental protection industry, which smooths the flow of capital elements and guides the flow of funds to emerging industries and green industries such as environmental protection and clean energy [33]. While creating green jobs, it also drives the low-carbon transformation of traditional industries and the growth of employment in related industrial chains, especially the demand for production personnel who master green manufacturing and clean production technologies and technical personnel engaged in production process improvement. From the perspective of risk management, injecting “living water” into the green development of enterprises can not only cope with environmental risks but also play the role of risk management to cope with risks in the process of economic development, including operational risks and market risks of green projects. Thus, enterprises can take the initiative to disclose environmental information to win the favor of investors and consumers and better promote the sustainable development of enterprises [34]. To further provide workers with a more stable working environment and career development prospects, which is conducive to attracting and retaining talents. At the same time, it has spawned new occupations such as ESG rating analyst and green investment analyst, which has brought new vitality to the labor market.
Hypothesis 2a.
The low-carbon city pilot policy can increase the employment scale of enterprises and adjust the employment structure by promoting green investment in enterprises.
Hypothesis 2b.
The low-carbon city pilot policy can adjust the employment structure by promoting green investment in enterprises.
2.2.3. Technological Innovation
According to the Porter hypothesis, appropriate environmental regulation can generate “innovation compensation” [7]. Enterprises in low-carbon pilot areas formulate green development plans according to their own technological background and introduce cutting-edge green technologies and new environmental protection products, thus reducing the marginal cost of product production and compensating for the additional pollution control costs caused by environmental regulation, which results in increased product demand and market expansion. Eventually, it will bring about the growth of employment and improve the employment scale of enterprises [21].
With policy constraints, the pilot areas of low-carbon cities have relatively clear environmental governance responsibilities and regulatory penalties. Most cities incorporate low-carbon pilot work into the government’s target assessment system. Local governments transmit the pressure of governance to enterprises by decomposing carbon emission targets and tracking and assessing enterprise carbon emission targets, which will force enterprises to carry out technological innovation and upgrading. These lead enterprises to choose between front-end and end-of-pipe environmental governance in order to achieve low-carbon transformational development, which in turn has a different impact on changes in the employment structure of companies [8]. In front-end governance, enterprises will eliminate production processes with high energy consumption and heavy pollution to adopt advanced technologies with high energy efficiency and low pollution emissions and introduce a comprehensive environmental quality management system. This will increase the demand for highly skilled personnel such as environmental technology research and development engineers and environmental management consultants. At the same time, the renewal of the industrial chain will give birth to green production jobs such as renewable energy manufacturing and low-carbon material production. The innovation compensation effect of technological upgrading will absorb more jobs and bring green employment opportunities [35]. In end-of-pipe governance, enterprises carry out the terminal treatment of pollutants by installing pollution control facilities such as desulfurization, denitrification, and dust removal equipment. Such governance will increase the operating costs of enterprises, and enterprises may choose to reduce production scale or reduce labor employment to reduce costs in the short term. But in the long run, enterprises need to hire more environmental professionals and equipment operators to manage and maintain pollution control facilities. Moreover, given the long-term nature of low-carbon policy implementation and the pressure of environmental governance, enterprises are more inclined to opt for front-end environmental governance strategies with higher cost advantages and return on investment in order to promote the realization of the dual benefits of emission reduction and employment growth [36].
Hypothesis 3a.
The low-carbon city pilot policy prompts enterprises to adopt front-end environmental management strategies in order to increase the employment scale of enterprises.
Hypothesis 3b.
The low-carbon city pilot policy prompts enterprises to adopt front-end environmental management strategies in order to optimize and adjust the employment structure by increasing their level of technological innovation.
2.2.4. Vertical Specialization
In response to the transformation pressure exerted by the pilot low-carbon policy on enterprises, enterprises change the mode of production organization by improving the level of specialized division, which affects the labor market. Combined with the theory of division of labor and transaction costs, enterprises will develop towards vertical specialization as a whole in order to meet the diversified needs of low-carbon development in the market. When the cost of external transactions is relatively low compared with the cost of internal control, enterprises are more likely to carry out the specialized division of labor and cooperation. Otherwise, they will choose vertical integration methods [25,37]. Under the background of low-carbon policies, some enterprises have insufficient transformation and development capacity due to the weak low-carbon emission reduction technology, which makes it difficult to achieve the prescribed carbon emission quota target. They will seek support from embedded suppliers with specialized emission reduction technologies to enable companies to outsource the allocation of intermediate products. Thus, they can concentrate their strengths to consolidate their core competence [38]. Firstly, the public disclosure of environmental information in low-carbon policies accelerates the collection and integration of market information and helps enterprises to quickly understand and screen suitable potential trading partners, reducing information search costs. The strengthening of market supervision has also effectively curbed the opportunistic behavior tendency of suppliers and reduced the supervision cost of enterprises simultaneously [39]. The reduction of such operating costs facilitates the expansion of production by enterprises and increases labor inputs, such as the increased demand for low-skilled labor in the corresponding production, processing, and assembly segments. Secondly, the specialized division connects enterprises in different production links, which can stimulate enterprises to learn the advanced technology of high-level suppliers and optimize production processes. This helps enterprises to gather high-skilled talents for technology research and development and optimize the employment structure of enterprises. Finally, the improvement of the production process promotes the effective allocation of various resource elements, so that enterprises can expand product value-added services and deepen industrial linkages to maximize product value and create more jobs. The promotion of low-carbon production and lifestyle will increase the demand for production, service, and sales personnel of related products.
Hypothesis 4a.
The low-carbon city pilot policy can increase the employment scale of enterprises by promoting vertical specialization.
Hypothesis 4b.
The low-carbon city pilot policy can adjust the employment structure by promoting vertical specialization.
Table 2.
Main literature review.
Table 2.
Main literature review.
| Hypothesis | Authors | Main Conclusions |
|---|---|---|
| Capital Integration | Liu et al. (2023) | Companies are more motivated to make green M&A decisions in order to maximize economic benefits, given investors’ investment preferences that are concerned about the environmental performance of the company and the increased regulatory and media pressures that enterprises face [27]. |
| Capital Integration | Shi and Huang (2024) | Green M&A can play a role in cost compensation. Because they can quickly obtain environmental protection resources and high-tech needed for emission reduction, avoid possible environmental penalties, and adapt to changes in the regulatory environment more quickly [30]. |
| Green Investment | Xie et al. (2024) | In the long run, green investment can effectively reduce pollutant emissions while reducing the cost of pollution control and environmental penalties, which can absorb more labor force and improve the overall employment level of enterprises [32]. |
| Green Investment | Hua et al. (2024) | Green investment builds a “bridge” for the development of the financial industry and environmental protection industry, which smooths the flow of capital elements and guides the flow of funds to emerging industries and green industries [33]. |
| Technological Innovation | Wang and Ge (2022) | The introduction of cutting-edge green technologies and environmentally friendly products by enterprises in low-carbon pilot areas generates “innovation compensation”. This leads to increased demand for products and market expansion, which ultimately leads to job growth and an increase in the scale of employment in the enterprise [21]. |
| Technological Innovation | Wang and Chu (2024) | Enterprises are more inclined to opt for front-end environmental governance strategies with higher cost advantages and return on investment, in order to promote the realization of the dual benefits of emission reduction and employment growth [36]. |
| Vertical Specialization | Pan et al. (2023) | When the cost of external transactions is relatively low compared with the cost of internal control, enterprises are more likely to carry out specialized division of labor and cooperation. Otherwise, they will choose vertical integration methods [37]. |
| Vertical Specialization | Sun et al. (2020) | Enterprises lacking technology will seek support from embedded suppliers with specialized emission reduction technologies to enable companies to outsource the allocation of intermediate products. Thus, they can concentrate their strengths to consolidate their core competence [38]. |
3. Empirical Strategy and Data
3.1. Empirical Model
In order to identify the impact of low-carbon transformation on enterprise labor employment, we use the implementation of low-carbon city pilot policies as an exogenous shock and employ a time-varying DID model for hypothesis testing in view of the fact that the pilot policy of low-carbon cities needs a long cycle from open implementation to the transformation of new and old kinetic energy in the market and then has an impact on the labor market. The implementation time of the first and second batches of pilot projects is relatively close, and it is difficult to reflect the impact of the first batch of policies in a short time, so the first two batches of policies are merged. Meanwhile, the second batch of pilot areas was announced on 26 December 2012. Considering the lag of policy implementation, the year 2013 of expanding the scope of the pilot and the year 2017 of the third batch of pilots are used as the time point of policy implementation [11]. The provinces and cities included in the pilot scope will be used as the treatment group, while the other provinces and cities will be used as the control group. The specific model is set as follows:
where Laborit represents the number of employees of enterprise i in year t. treatedit reflects whether the city where enterprise i is located has implemented the low-carbon city pilot policy in year t. If the city where enterprise i is located has implemented the policy in year t, it is assigned 1, and if not, it is assigned 0. The coefficient β of the DID term is the focus of attention in this paper, which measures the impact of the implementation of low-carbon city pilot policies on enterprise employment. Ctrit represents the control variables at time t in city i. Referring to the existing papers [21,40,41], enterprise age (lnage), enterprise wage level (Wage), enterprise growth ability (TobinQ), proportion of fixed assets (Fixed), ownership concentration (Top10), cash flow ratio (Cashflow), regional economic development level (lngdp), and urban population size (lnpop) are used as control variables. μi stands for firm fixed effects, controlling for firm-level characteristics that do not change over time. γt represents time fixed effects, controlling for time-level characteristics that do not change with region. εit is a random disturbance term and is clustered at the firm level.
3.2. Data and Variable Description
3.2.1. Data
Based on the research content of this paper and data availability, we select China’s A-share listed enterprises in Shanghai and Shenzhen from 2008 to 2021 as the research sample. The data involved mainly include the educational background, number of positions, and other financial operation information of employees. The data involved mainly include the educational background of employees, the number of employees in various positions, and other financial operating information of the enterprises. Enterprise-level data comes from the CSMAR database and the Wind database. City-level data are mainly from the China Urban Statistical Yearbook, the China Statistical Yearbook, and statistical bulletins and statistical yearbooks in the same period of each city. To avoid the influence of abnormal samples, the raw data were processed as follows: (1) excluding samples of ST, * ST, and PT listed enterprises during the sample period; (2) eliminating samples of financial listed enterprises during the sample period; (3) rejecting samples with severe missing key variables. After processing, we finally obtained the unbalanced panel data for 4010 listed enterprises with a total of 32,573 observations. Taking into account the implementation time and lag of the low-carbon city pilot policy, the policy implementation dates have been determined as 2013 and 2017. Referring to the research of Wang and Ge [21], all cities under the jurisdiction of low-carbon pilot provinces are uniformly regarded as pilot areas. If a city involves multiple policy launch points, the initial implementation time node will be used as the criteria for the city to be included in the low-carbon pilot program. Finally, enterprises located in 254 cities in China were selected as research samples.
3.2.2. Variable Description
The employment of the enterprise labor force is the dependent variable, represented by the logarithm of the number of enterprise employees and denoted as Labor. Drawing on the studies of Wu and Yang [42] and Qin et al. [40], the employment structure is measured from the perspectives of employment skill structure and employment position structure, respectively. Firstly, according to the educational background of employees, those with a college degree or above are classified as high-skilled labor (HQLabor), while those with a high school degree or below are classified as low-skilled labor (LQLabor). Secondly, according to the position structure of the employees, the employees are divided into production and operation personnel (ProLabor), technology research and development personnel (TecLabor), and service and management personnel (SerLabor) to examine the specific impact of the pilot policy on the employment structure of enterprises. The dummy variable treated is the core independent variable, which is essentially an interaction term between the city dummy variable and the time dummy variable. If a city is a low-carbon city pilot area, the area dummy variable takes the value of 1; otherwise, it is 0. If the time is after the pilot year, the time dummy variable is assigned the value of 1; otherwise, it is 0. Based on the previous analysis, the timing of the policy shocks to the pilot areas is set to 2013 and 2017.
Referring to existing studies [21,40,41], this paper selects a series of factors at the enterprise and city levels that may affect enterprise employment as control variables. (1) Years of establishment of the enterprise (lnage). Enterprises with a generally long history of establishment have established a complete business network system, which can better respond to market changes. This advantage helps enterprises to stabilize their operations and provides workers with more permanent and stable employment opportunities. The age of an enterprise is an important indicator of its life cycle and maturity. There may be significant differences in the organizational structure, market position, and human resource strategy of enterprises with different years of existence, and these differences will have a direct impact on the labor demand of enterprises. In this paper, the year of establishment is measured by subtracting the current year from the year the firm was established, adding 1, and taking the logarithm. (2) Enterprise wage level (Wage). According to the theory of labor supply and demand, wages reflect the labor cost in the production input of enterprises, and the rise of wages will cause enterprises to reduce labor employment. Therefore, this paper measures the wage level of enterprises with the average salary of employees. (3) Enterprise growth (TobinQ). Tobin’s Q reflects the ratio between the market value of an enterprise and its replacement cost, which reflects the growth ability of an enterprise. Enterprises with strong growth ability have greater expansion potential, which may create more job opportunities and increase labor demand. While changes in labor force employment may affect the production capacity and future prospects of a firm, the determinants of Tobin’s Q remain primarily the capital market valuation of the firm and the overall economic environment. Therefore, Tobin’s Q is used to measure the growth of an enterprise. (4) Proportion of fixed assets (Fixed). A higher share of fixed assets usually means that a firm has more production equipment and facilities, the operation and maintenance of which require a certain amount of labor to support. At the same time, however, firms may reduce their need for labor by purchasing automated equipment or technology to improve production efficiency. Thus, there may be a complementary or substitutive relationship between changes in the share of fixed assets and labor demand. In this paper, the proportion of net fixed assets to total assets is used to measure the proportion of fixed assets. (5) Equity concentration degree (Top10). The relatively stable ownership structure of the company helps to reduce the risk of personnel adjustment or organizational structure reform caused by frequent management changes, ensure the continuity and stability of enterprise operation, and maintain the stability of enterprise employment. Enterprises with higher levels of equity concentration may have major shareholders who are more concerned about the impact of policy changes on the enterprise. Therefore, differences in equity concentration may affect enterprises’ adherence to and disclosure of low-carbon policies, thus indirectly affecting firms’ labor demand. In this paper, the shareholding ratio of the top ten shareholders is used to measure the degree of ownership concentration. (6) Cash flow ratio (Cashflow). Cash flow ratio is an important indicator to measure the health of an enterprise’s cash flow, which reflects the adequacy and sustainability of the enterprise’s cash flow. A high cash flow ratio means that an enterprise can pay employees on time and in full. Changes in the cash flow of an enterprise mainly come from its operation and financial decisions, which are affected by the external environment, enterprise management, market demand, and other factors rather than solely the number of employees. In this paper, the adequacy of cash flow is assessed by the ratio of net cash flow generated by business activities to total assets. (7) Control variables at city level. Considering the possible impact of the urban macroeconomic environment and population size on the employment of enterprises, this paper controls the gross regional product (lngdp), which is measured by the logarithm of the gross regional product. The urban population size (lnpop) is measured by the numerical value of the city’s registered population at the end of the year.
The descriptive statistics of the main variables are shown in Table 3. The independent variable treated has 32,573 observations. The dependent variable Labor has 32,567 observations. HQLabor has 32,459 observations. LQLabor has 26,268 observations. ProLabor has 27,657 observations. TecLabor has 31,812 observations. SerLabor has 32,069 observations. It can be seen that the mean value of the logarithm of the number of employees (Labor) in the sample period is 7.632, and the standard deviation is 1.299. The standard deviations of the logarithm of the number of other high-skilled (HQLabor), low-skilled (LQLabor), production and operation (ProLabor), technology research and development (TecLabor), and service managers (SerLabor) are all above 1.310, indicating that there are significant differences in the employment of different enterprises during the sample period. The sample mean of treated is 0.556, which means that the sample proportions before and after the policy shock are 44.40% and 55.60%, respectively.
Table 3.
Descriptive statistics of variables.
4. Empirical Analysis
4.1. Baseline Regression Results
Table 4 reports the benchmark regression results based on Model (1) to examine the impact of low-carbon city pilot policies on labor employment. Column (1) shows that the regression coefficient of Labor on the policy variable treated is 0.065 and significant at the level of 1% when the enterprise fixed effect and year fixed effect are controlled and no control variable is added. In Column (2), the control variables at the enterprise and city levels are added on the basis of Column (1), and the regression coefficient of the policy variable treated becomes 0.068, which remains significant at the level of 1%, indicating that the low-carbon city pilot policy will significantly improve the overall employment level of enterprises and promote the average increase of enterprise employment by about 6.77% compared with the non-pilot areas. The policy mainly plays the role of job creation.
Table 4.
The impact of LCCPPs on enterprises’ labor.
The employment structure is further refined into employment skill structure and employment post structure, and the regression results are shown in Columns (3)–(7) of the table. In terms of the regression results of low-carbon policies on the employment skill structure of enterprises in Columns (3) and (4), the regression coefficients are significantly positive at the level of 10%, which are 0.045 and 0.069, respectively, indicating that low-carbon policies promote the employment of both high-skilled and low-skilled workers, and the promotion effect on the employment of low-skilled workers is greater. According to the regression results of low-carbon policy on the job structure of enterprises in Columns (5), (6), and (7), the regression coefficients are significantly positive at the level of 10%, indicating that the policy also promotes the employment of production operation, technology research and development, and service management personnel, increasing the employment by more than 5% on average. The utility from large to small is service management personnel, production and operation personnel, and technology research and development personnel. The possible reason is that low-carbon policies mainly expand the production scale through the compensation effect of innovation, and the demand for production and service personnel surpasses, while the overall labor supply of high-end talents such as technology R&D is relatively limited, and the employment growth is relatively small. The above results show that the low-carbon city pilot policy can significantly expand the employment scale of enterprises and optimize the employment structure.
4.2. Robustness Test
4.2.1. Parallel Trend Test
The premise of using the DID model is that the treatment group and the control group must follow the parallel trend assumption, that is, before the launch of the low-carbon city pilot policy, the employment status of enterprises in the pilot city and the non-pilot city should show a basically similar trend, so as to ensure the unbiased estimation results. In this paper, the event study method is used to test the hypothesis of parallel trends, and the specific model is set as follows.
where treatedn is a relative year policy variable generated by referring to the year when the pilot policy was implemented. The treatedn of the city where the enterprise is located is 1 in the pilot area and 0 in the non-pilot area. The year before the implementation of the pilot was set as the base period of the event analysis, and βn was the regression coefficient relative to the base period, reflecting the difference in the employment of enterprises in the pilot cities and non-pilot cities in the t year of the policy implementation, and the meanings of other variables were consistent with the benchmark Model (1). In addition, this paper summarized the data of the first five years before the implementation of the policy into phase-5, and the data of the second five years after the implementation into phase 5. The results of the parallel trend test are shown in Figure 2. It can be seen that the regression coefficient of the years before the implementation of the policy is not significantly different from 0, that is, the employment trend of enterprises between the pilot areas and the non-pilot areas is basically consistent, and there is no significant difference, which is in line with the hypothesis of parallel trend. After the implementation of the pilot policy, the driving effect of the policy begins to appear gradually, and there is a certain lag in its effect.
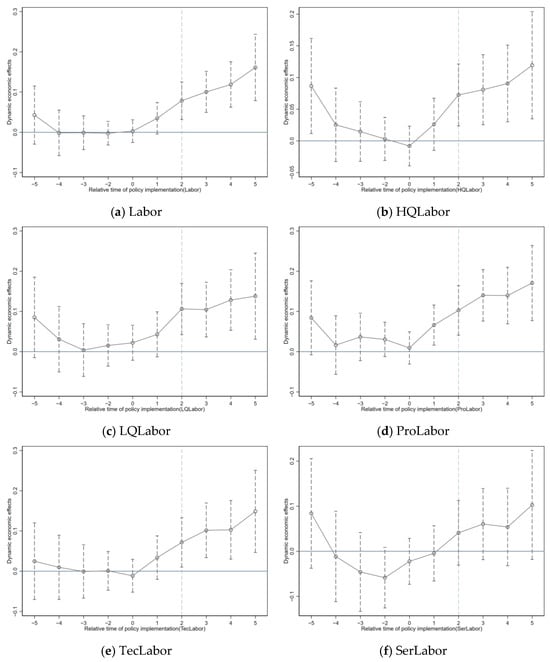
Figure 2.
Parallel trend assumption test.
4.2.2. Placebo Test
In order to further control the potential interference of omitted variables or unobserved random factors on the benchmark regression results, this paper conducts a placebo test. Specifically, a random experimental group is generated by randomly generating a list of virtual regions that implement the low-carbon city pilot policy, and 500 placebo tests are conducted in turn. Figure 3 shows the kernel density function and p-value distribution of the estimated coefficient of the placebo test. The regression results of the policy dummy variable are all around 0 and follow the normal distribution. Most of the regression results are not significant, and the actual estimated coefficient is obviously an outlier, which is in line with the expectation of the placebo test. It shows that the conclusion that the pilot policies of low-carbon cities in the baseline regression have a positive impact on corporate employment is robust.
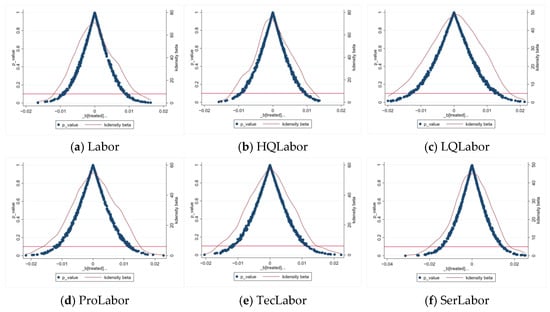
Figure 3.
Placebo test.
4.2.3. Mitigating the Impact of Nonrandom Selection in Pilot Cities
This paper takes the low-carbon city pilot policy as a quasi-natural experiment to estimate its impact on the employment of enterprise labor force by the DID method. The ideal situation is that the selection of the treatment group and control group is random. However, in fact, the pilot cities are designated by the superior government or determined by independent declaration and evaluation, which may be affected by the city’s own development level, so their selection is not completely random. In addition, the economic and social development of these cities may have different effects on the employment situation of enterprises over time, which may lead to the deviation of the estimated results. In order to avoid the impact of the above factors, this paper adds the interaction term between provincial capitals and municipalities directly under the central government (capital) and time trend (trend) on the basis of Model (1) to alleviate the impact of nonrandom selection of pilot cities. As shown in Table 5, after adding the interactive term of city and time trends, low-carbon city pilot policies still significantly promote enterprise employment and adjust the employment structure of enterprises. The estimated coefficients are significantly positive at least 10% level, which proves that the baseline regression results are robust.
Table 5.
Robustness test results: influence of non-random selection in pilot cities.
4.2.4. Eliminating Interference from Other Policies
In order to avoid the impact of other policies on enterprise employment during the sample period, it is necessary to eliminate the interference of relevant policies. We chose the new energy demonstration city policy implemented in 2014. According to the list of new energy demonstration cities published by the National Energy Administration, enterprises in 81 cities are selected as the experimental group, the policy time point is set as 2014, and the virtual interaction term between the above policy and time trend is constructed and added to Model (1) for regression. The results are shown in Table 6. After excluding the influence of the above policies, the regression coefficients mostly are still significantly positive at the level of at least 10%, indicating that the benchmark regression results are robust.
Table 6.
Robustness test results: eliminate other policy interference.
4.2.5. Changing Sample Interval
In order to exclude the possible impact of the implementation of the Environmental Protection Law, we eliminate the samples after 2018 for regression. As shown in Table 7, after excluding the samples after 2018, the regression coefficients are significantly positive at least on a 5% level, indicating that the pilot policy of low-carbon cities can indeed promote enterprise employment and adjust the employment structure of enterprises, which once again proves that the results of this paper are relatively stable.
Table 7.
Robustness test results: change sample interval.
5. Mechanism Analysis
5.1. Analysis on Capital Integration
In order to reveal the mechanism of capital integration in promoting the employment level in the process of the low-carbon transformation of enterprises, this paper further constructs the interaction term between policy variable treated and mechanism variable GMerge on the basis of Model (1) and returns it to the model to test the regulatory effect of capital integration on enterprise employment. The model is set as follows.
where GMergeit represents enterprise capital integration, and the other variables are set the same as in Model (1). This article refers to the definition methods of Lu [23] and Liu et al. [26] and uses green mergers and acquisitions as a proxy variable for capital integration. We manually collect merger and acquisition announcements from listed companies and use text content analysis to identify merger and acquisition events that contain keywords such as “environmental protection”, “green”, “low-carbon”, and “emission reduction” in the disclosure of transaction targets, transaction overview, and transaction impact as green M&A. If it is a green M&A event, the GMerge value is 1; otherwise, it is 0. Table 8 reports the estimated results of Equation (3). The results in Column (1) show that capital integration has a positive moderating effect on the promotion of the overall employment level of enterprises by the pilot policies of low-carbon cities, and the interaction coefficient is 0.055, which is significantly positive at the level of 5%. Most of the interaction coefficients in the regression results in Columns (2)–(6) are significantly positive at the level of 5%, indicating that capital integration mainly plays a positive regulating role in the transformation process. From the perspective of employment skill structure, it also improves the employment of high- and low-skilled workers in enterprises. From the perspective of employment position structure, it promotes the employment of production operators and technical research and development personnel but has no significant impact on the employment of service managers. The possible reason for this is that green M&A events mainly occur in heavy polluters, while the employment of sales, management, and other service personnel is mainly concentrated in the financial, education, and life service industries, which are relatively less affected by capital consolidation. At the same time, mergers and acquisitions are mainly adjustments to production processes and technology, with no significant direct impact on service managers. In general, enterprises can fully utilize capital market tools to empower their sustainable development and boost low-carbon transformation through green M&A, which further expands the scale of corporate employment and adjusts the employment structure. Hypothesis 1 is tested.
Table 8.
Mechanism analysis 1: capital integration.
5.2. Analysis on Green Investment
Effectively playing the pivotal role of green investment in guiding and allocating corporate green funds is an important measure to deal with the lack of funds and the erosion of profits by green governance costs in the green transformation of enterprises. Referring to the practices of Zhang et al. [31] and Cao et al. [34], we add up the expenses directly related to environmental protection in the annual reports of listed companies, such as investment expenses for desulfurization and denitrification, sewage treatment, energy conservation, dust removal, and waste gas treatment in the construction in progress account, as well as expenses for drainage, environmental protection, and vegetation restoration in the management expense account, and all the data are summed up to obtain the data on the green investment expenditures of enterprises and finally divided by the total assets at the end of the period for normalization. After interacting the green investment GreenInv with the policy variable treated and regressing the interaction and level terms into Equation (3), the results are shown in Table 9. The results in Column (1) show that the interaction coefficient is 0.079, which is significantly positive at the 5% level, indicating that the low-carbon city pilot policy drives enterprises to make green investments, the multiplier effect of investment amplifies the promoting effect of policy on employment, and green investment plays a positive regulating role. The interaction coefficients of Columns (2)–(6) are mostly significantly positive at the level of 10%, but the impact on low-skilled labor is not significant. The results indicate that green investment mainly promotes the employment-driving effect of policy implementation on high-skilled, production personnel, technology research and development personnel, and service management personnel, especially the stronger absorption effect on high-skilled talents such as technology research and development and production process improvement, and adjusts the employment structure of enterprises to achieve high-quality employment. Hypothesis 2 is verified.
Table 9.
Mechanism analysis 2: green investment.
5.3. Analysis on Technological Innovation
According to Porter’s hypothesis, reasonable environmental regulation will increase the innovation activities of enterprises, and the implementation of pilot policies of low-carbon cities will affect the employment of enterprises through technological innovation in various aspects. In this paper, we construct the following mechanism-testing model with reference to the suggestions made by Jiang [43] for mechanism analysis.
where M represents the mechanism variable, and the remaining variables are set as in Model (1). In this paper, the number of green patent applications of listed companies is used to measure enterprise technological innovation [11]. The number of green patent applications includes three types: total green patents (GPatent), green invention patents (GInvPatent), and green utility patents (GUtyPatent). All quantity indexes are logarithmically processed by adding 1. Based on the studies of Wang et al. [8], the environmental governance strategies adopted by enterprises are further investigated from the perspectives of front-end governance (FG) and end governance (EG). Front-end governance is measured by “whether the company has developed or applied innovative products, equipment or technologies that are beneficial to the environment”. FG is 1 if it has, and 0 if it has not. End governance is measured by “whether the company has adopted policies, measures or technologies to reduce emissions of waste gas, wastewater, waste residue, and greenhouse gases”. If it has, the value of EG is 1; otherwise, it is 0. The above data are from the China Research Data Service Platform (CNRDS) database. The regression results are shown in Table 10. Columns (1)–(3), respectively, show the regression results of the number of green patent applications, green invention patent applications, and green practical patent applications treated by the policy variables. It is found that only green invention patents maintain a positive significance at the level of 5%, while the regression results of green patents and green practical patents are not significant. It shows that compared with green practical patents, the pilot policy focuses more on promoting green invention patent innovation with higher technical content and added value [44], thus directly driving the employment of high-skilled talents and promoting the employment of workers in other positions through the production scale expansion effect of technological innovation, and improving the overall employment level of enterprises. The results in Columns (4) and (5) show that the impact coefficient of pilot policies on front-end governance is positively significant at the level of 10%, while the impact on end governance is not significant, which means that the pilot policies of low-carbon cities mainly encourage enterprises to adopt front-end environmental governance strategies and create green employment opportunities. The above analysis indicates that the pilot policy of low-carbon cities will force enterprises to carry out technological innovation activities, and more enterprises will choose the environmental strategy of front-end governance to expand employment capacity and stimulate employment vitality through the compensation effect of technological innovation. Hypothesis 3 has been verified.
Table 10.
Mechanism analysis 3 and 4: technological innovation and vertical specialization.
5.4. Analysis on Vertical Specialization
Low-carbon transformation drives enterprises to change the mode of production organization and makes use of the professional ability of external suppliers in the professional division of labor so that enterprises can reduce production costs and focus on the development of their own core advantages. Referring to the practice of Pan et al. [37], this paper first uses the modified value-added value method to calculate the degree of vertical integration (VAS) of enterprises and then defines its reverse indicator as the degree of vertical specialization (VSI) of enterprises. The specific calculation method is as follows:
Among them, the value added is calculated by subtracting the purchase amount from the sales volume of the enterprise, and the average return on equity is measured by the average of the industry in which the enterprise is located. The higher the value of VAS is, the higher the degree of vertical integration of enterprises is. The reverse indicator of VAS is defined as the degree of vertical specialization of enterprises (VSI), as follows:
The higher the VSI value, the higher the degree of vertical specialization of the enterprise. In order to ensure the validity of the measurement, samples with VSI deviating from the reasonable range of [0, 1] are presented. The variable VSI was included in Equation (4) for regression, and the result is shown in Column (6) of Table 10. The treated coefficient was significantly positive at the 5% level, indicating that the implementation of the low-carbon city pilot policy would reduce external transaction costs such as information search costs and supervision costs of enterprises and promote enterprises to deepen the degree of vertical specialization. Outsourcing the intermediate product allocation process to more efficient suppliers will promote the expansion of production scale and increase labor demand. Learning advanced technologies from high-level suppliers will attract more highly skilled R&D talents. Deepening industrial linkages and expanding products and services will increase the demand for related product production, service, and sales personnel. Hypothesis 4 is verified.
6. Further Analysis
6.1. Heterogeneity Analysis
6.1.1. Heterogeneity of Enterprise Ownership
Due to the different ownership attributes of enterprises, state-owned enterprises usually bear the social responsibility of “stabilizing employment”. Meanwhile, due to their ownership advantages and special status, state-owned enterprises can obtain more policy support and financial support, which may be easier to improve the overall employment level [11]. In this paper, enterprises are divided into state-owned enterprises and non-state-owned enterprises according to their ownership rights, so as to analyze the impact of low-carbon city pilot policies on the employment of enterprises with different ownership. The regression results based on Model (1) are shown in Table 11. The results show that the treated coefficient is significantly positive in the corresponding Columns (1), (3), and (9) of the state-owned sub-samples and significantly positive in the corresponding Columns (6) and (12) of the non-state-owned sub-samples. This indicates that the pilot policy on the whole will more significantly promote the employment of state-owned enterprises, the employment promotion effect of high-skilled and technology research and development personnel in state-owned enterprises is more significant, and the employment promotion effect of low-skilled and service management personnel in non-state-owned enterprises is more significant. The possible reason is that under the background of low-carbon transformation, state-owned enterprises have greater advantages in obtaining policy and information resources, are capable of absorbing more highly skilled talents, and actively assume the social responsibility of stabilizing employment and protecting the environment. In contrast, non-state-owned enterprises will face more transformation constraints, such as funds and policies, and have less impact on overall employment. In the process of production transformation, scale effects are more likely to create jobs for low-skilled workers and service managers.
Table 11.
Heterogeneity test 1: enterprise ownership.
6.1.2. Heterogeneity of Firm Size
Considering that the effect of policies on employment is affected by the size of enterprises, this paper uses asset size as the metric of enterprise size and divides enterprises into large-scale enterprises and small and medium-sized enterprises according to the median annual total asset size in order to investigate the impact of pilot policies of low-carbon cities on the employment of enterprises of different sizes. As shown in Table 12, the treated coefficient was significantly positive in Columns (1), (7), and (9), corresponding to the large-scale enterprise subsample, and significantly positive in Columns (2), (4), and (6), corresponding to the moderate and small-scale enterprise subsample. It shows that the pilot policy has improved the overall employment level of both large-scale and small and medium-sized enterprises and has a more significant role in promoting the employment of production operators and technology research and development personnel in large-scale enterprises and a more significant role in promoting the employment of high-skilled and low-skilled workers in small and medium-sized enterprises. This may be because after the implementation of the policy, in order to cope with technology upgrading and market competition, large-scale enterprises need more technology R&D personnel and production operators to promote technological innovation and product upgrading, while small and medium-sized enterprises have higher flexibility to adjust their business strategies and employment structure to cope with low-carbon transformation and promote the employment of high-skilled workers.
Table 12.
Heterogeneity test 2: firm size.
6.1.3. Heterogeneity of Industrial Pollution Degree
Because of their high pollution emissions and significant negative impact on the environment, heavily polluting enterprises have become the main concern and standard object of environmental regulation policies. Referring to the research of Guo et al. [45], this paper matches the 14 heavily polluting industries listed in the Industry Classification Management List of Listed Companies for Environmental Protection Verification issued by the Ministry of Environmental Protection in 2008 and the Guidelines on Industry Classification of Listed Companies issued by the China Securities Regulatory Commission in 2012. The listed companies in heavy pollution industries are obtained, and the remaining enterprises are classified as listed companies in non-heavy pollution industries. According to the regression results in Table 13, the treated coefficient was significantly positive in Columns (1), (3), (7), and (9), corresponding to the subsample of heavily polluting enterprises, and significantly positive in Column (6), corresponding to the subsample of non-heavily polluting enterprises. It shows that the pilot policy of low-carbon cities has significantly improved the overall employment level of heavily polluting enterprises and has a more significant role in promoting the employment of high-skilled workers, production operators, and technology research and development personnel in heavily polluting enterprises and a more significant role in promoting the employment of low-skilled workers in non-heavily polluting enterprises. This means that under the pressure of low-carbon transformation, the technology upgrading and equipment transformation needs of heavily polluting enterprises are more urgent, and the demand for highly skilled personnel who master environmental protection technologies and production operators of environmental protection processes has surged, while low-carbon policies provide more green diversified development opportunities and employment opportunities for non-heavily polluting enterprises, and these positions have greater demand for low-skilled workers.
Table 13.
Heterogeneity test 3: industry pollution degree.
6.1.4. Heterogeneity of Regional Environmental Regulation
As a comprehensive environmental regulation policy, the pilot policy of low-carbon cities gives local governments greater autonomy. Local governments initiate incentive-led or compulsory-led environmental regulations based on regional industrial characteristics and regional development conditions. The impact of pilot policies on employment will vary according to the intensity of regional environmental regulations. In this paper, according to the practice of Wang [46], the environmental regulation intensity index of prefecture-level cities is constructed according to the word frequency related to environmental protection in the municipal government work report. First, 27 words reflecting the environmental regulation intensity and governance policies of local governments were selected, including low-carbon, environmental protection, air, and PM2.5. Then, word frequency analysis was used to calculate the number of relevant word frequencies in the government work report, and the ratio of relevant word frequencies in the total number of words in the government work report was used to quantify the environmental regulation intensity of each region. Finally, based on the median environmental regulation intensity of prefecture-level cities each year, enterprises are divided into a high environmental regulation group and a low environmental regulation group for regression, and the results are shown in Table 14. It can be seen that the results of the treated coefficient in the high environmental regulation group are not significant, and most of the results in the low environmental regulation group are significantly positive, except for the coefficient of technical R&D personnel in Column (6). This shows that enterprises in the high environmental regulation group will face higher environmental protection standards and cost pressure, and the increase in production costs caused by enterprise transformation will temporarily restrain the employment growth of enterprises, while enterprises in the low environmental regulation group may be more concentrated in the light industry or service industry with low sensitivity to environmental regulation. It is easier for firms in these industries to respond quickly to policy changes and promote employment growth by adjusting their production methods.
Table 14.
Heterogeneity test 4: regional environmental regulation.
Under the low-carbon policy, the government guides enterprises to develop in the low-carbon direction by setting emission standards and providing green financial support, which further intensifies the fierce market competition. In this paper, the Herfindahl Index (HHI) is used to describe the degree of market competition, and the HHI of each industry in each year is calculated through the sales revenue of enterprises. The higher the HHI, the higher the concentration degree of the market or industry, and the relatively smaller the competition. The group is grouped based on the median of the HHI. If the Herfindahl index of the industry in which the enterprise is located is greater than the median, the value is 1; otherwise, the value is 0. Based on the benchmark Model (1), the interaction terms treated and Herfindahl index (HHI) were added for analysis, and the results are shown in Table 15. Most of the interaction terms’ coefficients were significantly negative. It shows that compared with enterprises with high market concentration, enterprises with low market concentration have better employment promotion effects, that is, the higher the degree of market competition, the more the enterprises can maximize employment potential. The possible reason is that the highly competitive market makes it difficult for enterprises to directly transfer the emission reduction cost to the market consumers, and the emission reduction incentive formed by the policy forces enterprises to carry out industrial upgrading and technological innovation and absorb a large number of workers.
Table 15.
Heterogeneity test 5: market competition.
6.2. The Impact on Employee Salary
In the face of stringent environmental regulations, companies may pass on the cost of pollution control to employees by reducing their wages. This practice will seriously damage the welfare of enterprise employees, inhibit the wage growth of workers, and further widen the income gap between skilled and unskilled labor [47]. On the one hand, the implementation of low-carbon policies will enable enterprises to incorporate pollution control into their production decisions. In operation, enterprises will include specific cleaning processes such as pollutant washing, precipitation, and extraction, which will directly increase marginal production cost and destroy the optimal combination of original input-output factors. Enterprises may maintain the original employment level by laying off employees or reducing employees’ wages. On the other hand, according to the Porter hypothesis, pilot policies can encourage enterprises to actively introduce cleaner production equipment, optimize production technology, improve the utilization rate of raw materials, by-products, and other resources and the efficiency of waste conversion, which is conducive to reducing the marginal cost of production of enterprises but will lead to the substitution of capital for labor factors and reduce the labor income share. In general, according to the theory of rent sharing determined by wages, the increase in production costs caused by the implementation of low-carbon policies leads to a decline in corporate profits, and the deepening development of corporate capital eventually leads to a decline in the real wages of workers [48]. In view of this, based on Model (1), this paper examines the impact of low-carbon city pilot policies on employee compensation. The explained variable is the employee salary (LS), which is calculated as the cash paid by the enterprise for the employees in the current period/(the cash paid by the enterprise for the employees in the current period + the employee salary payable at the end of the period—the employee salary payable at the beginning of the period), and the control variables are selected again for regression.
The regression results are shown in Table 16, and the benchmark regression coefficient in Column (1) is not significant, and it is still not significant after the control variable is added to the regression in Column (2), indicating that the low-carbon city pilot policy does not have a significant impact on the overall income level of workers in enterprises. Columns (3) and (4) divide the samples into enterprises in heavily polluting industries and enterprises in non-heavily polluting industries and find that only the treated coefficient in Column (3) is −0.070, which is significantly negative at the level of 1%, indicating that the low-carbon city pilot policy will significantly reduce the wage income of workers in heavily polluting enterprises. Heavily polluting enterprises with greater pressure of environmental regulation will transfer the cost of pollution control to employees, and the welfare of employees will be lost.
Table 16.
The impact of low-carbon policy on employee salary.
7. Conclusions
Affected by domestic and international factors such as the slow recovery of the global economy and the turbulence of the world situation, China is faced with prominent structural problems in employment and a grim employment situation. As an important micro-entity in the job market, whether enterprises can simultaneously achieve low-carbon transformation and high-quality employment goals has attracted attention from all sectors of society. Based on the quasi-natural experiment of the implementation of the low-carbon city pilot policy, this paper empirically examines the impact of the low-carbon city pilot policy on the labor market of enterprises by constructing a time-varying DID model using data from China’s A-share listed companies from 2008–2021. The conclusions of this study are as follows:
- (1)
- The low-carbon city pilot policies significantly expand the scale of employment of enterprises and promote the average increase of employment of enterprises in pilot areas by about 6.77% compared with that in non-pilot areas. From the perspective of the employment skill structure, it can promote the employment of high-skilled and low-skilled workers and play a greater role in promoting the employment of low-skilled workers. From the perspective of employment position structure, it can promote the employment of production operations personnel, technology research and development personnel, and service and management personnel and play a greater role in promoting the employment of service and management personnel. These results are still valid after the parallel trend test and a series of robustness tests.
- (2)
- Low-carbon city pilot policies mainly improve the employment level of enterprises by promoting capital integration, green investment, technological innovation, and deepening the degree of vertical specialization.
- (3)
- The impact of pilot low-carbon city policies on enterprise employment is heterogeneous. In different ownership enterprises, the pilot policy has a greater role in promoting the employment of high-skilled and technology research and development personnel in state-owned enterprises and a greater role in promoting the employment of low-skilled and service management personnel in non-state-owned enterprises. In enterprises of different sizes, the pilot policy has a greater role in promoting the employment of production operators and technology research and development personnel in large-scale enterprises and has a greater role in promoting the employment of high-skilled and low-skilled workers in small and medium-sized enterprises. In enterprises with different levels of pollution in different industries, the pilot policy has a greater role in promoting the employment of high-skilled workers, production operators, and technical research and development personnel in heavily polluting enterprises and a greater role in promoting the employment of low-skilled workers in non-heavily polluting enterprises. In the difference of environmental regulation in different regions, compared with the areas with high environmental regulation, the pilot policy will significantly improve the employment level in the areas with low environmental regulation; in different market competition degrees, enterprises with high market competition degrees can better exert their employment potential.
- (4)
- Further analysis shows that the pilot policy of low-carbon cities will significantly reduce the labor income share of employees in heavily polluting enterprises, and heavily polluting enterprises will transfer the pollution control cost to employees, resulting in a loss of employee welfare.
8. Policy Recommendations
Based on the theoretical analysis and empirical results of this paper, the following policy recommendations are proposed.
First, strengthen the policy design of the coordinated development of low-carbon transition and employment. The low-carbon city pilot policy is an important starting point to realize the green development strategy, which needs to achieve the low-carbon transition and high-quality employment goals. The research results of this paper emphasize the positive role of low-carbon city pilot policies in promoting enterprise employment. Therefore, the design of low-carbon policies in the future should pay more attention to coordination with employment policies, ensuring that while promoting green transformation, the dual dividends of energy conservation, emission reduction, and employment promotion are achieved without sacrificing the healthy development of the labor market. Based on the monitoring and evaluation of low-carbon cities, the government will gradually promote advanced experience models and replicable successful cases nationwide, and formulate a series of employment plans, including providing vocational training, skill upgrading projects, as well as special recruitment and subsidy policies for green positions to alleviate the structural contradictions in employment during the transformation process.
Second, optimize the allocation of resources and stimulate the vitality of green investment and innovation of enterprises. The low-carbon city pilot policy has deepened the level of enterprise employment by promoting capital integration, green investment, technological innovation, and specialized division of labor, which requires further optimizing the market resource allocation mechanism and increasing financial support for green technology and low-carbon projects. At the same time, technological innovation is mainly reflected in green invention patents, but the impact on green practical patents is not significant. It is necessary to further induce green practical patent innovation and improve the utilization rate of technology. Therefore, the government should establish diversified green financing channels, such as green bonds and green funds, to reduce the financing cost of enterprises’ green transformation. At the same time, through tax incentives, research and development subsidies, and other incentives, it should encourage enterprises to increase research and development investment in clean energy, energy conservation, and emission reduction technologies and form a virtuous cycle of innovation-driven green employment.
Third, adopt targeted policies in accordance with local conditions and implement differentiated policy support. Enterprises with different ownership, scales, industrial pollution degrees, and regional environmental regulation market competition have significant differences in the impact of low-carbon policies on employment. Policy formulation should fully consider the heterogeneous characteristics of enterprises and implement more precise and differentiated support measures. For state-owned enterprises and large-scale enterprises, the focus should be on supporting the development of technology research and development and production operation positions; for non-state-owned enterprises and small and medium-sized enterprises, it is necessary to pay attention to their service management and the employment demand of low-skilled labor. For areas with high environmental regulations, we should continue to optimize environmental policies and improve the efficiency of environmental governance. For areas with low environmental regulations, it is necessary to increase policy support to guide them to accelerate the pace of green transformation and achieve balanced development among regions. In addition, for heavily polluting industries, environmental supervision should be strengthened, and a sound mechanism for safeguarding employee rights and interests should be established. We should ensure that enterprises pursue green development without harming the legitimate rights and interests of employees and avoid excessive transfer of pollution control costs to employees.
This paper examines the employment effects of pilot policies in low-carbon cities. However, there are still some limitations. First, the paper primarily examines the policy’s effect on employee numbers, without exploring labor market dynamics. For example, with the promotion of the low-carbon policy, employment in certain traditional industries may decrease, while employment in emerging green industries may increase, and the effects of labor mobility and career change have not been fully considered. Future research could further analyze the mobility of different types of labor, career changes, and their impact on the employment structure after the implementation of low-carbon policies. In addition, the article mainly focuses on changes in employment scale and employment structure, but relatively little analysis has been done on employment quality, such as working conditions and job satisfaction. In the future, analyses of employment quality should be strengthened to more comprehensively assess the impact of the pilot low-carbon city policy on corporate employment.
Author Contributions
Conceptualization, N.H. and Y.F.; methodology, N.H. and Y.F.; software, Y.F.; formal analysis, N.H. and Y.F.; resources, N.H.; data curation, Y.F.; writing—original draft preparation, Y.F.; writing—review and editing, N.H.; supervision, N.H. All authors have read and agreed to the published version of the manuscript.
Funding
This research was funded by the Anhui Federation of Social Sciences (No. 2022CX052) and the Economics School of Anhui University Summit Discipline Research Project (No. Z010111018).
Institutional Review Board Statement
Not applicable.
Informed Consent Statement
Not applicable.
Data Availability Statement
The datasets used and analyzed during the current study are available from the corresponding author upon reasonable request.
Conflicts of Interest
The authors declare no conflicts of interest.
References
- Wu, G. How Does the New Environmental Protection Law Affect the Environmental Social Responsibility of Enterprises in Chinese Heavily Polluting Industries? Humanit. Soc. Sci. Commun. 2024, 11, 168. [Google Scholar]
- Wei, C.; Zhang, Y.; Lan, M.; Su, Z.; Du, H.; Wang, K. How Could We Benefit from a Low-Carbon Economy? Evidence from Chinese Regional Labor Markets. Struct. Change Econ. Dyn. 2024, 71, 523–537. [Google Scholar] [CrossRef]
- Xu, Y.; Xu, F.; Wang, H. Low-Carbon Pilot Policy and Development Path in Urban Agglomerations of China: Mechanism Analysis and Stage Identification. J. Environ. Manag. 2024, 368, 122147. [Google Scholar] [CrossRef] [PubMed]
- Yang, Z.; Yuan, Y.; Tan, Y. The Impact and Nonlinear Relationship of Low-Carbon City Construction on Air Quality: Evidence from a Quasi-Natural Experiment in China. J. Clean. Prod. 2023, 422, 138588. [Google Scholar] [CrossRef]
- Song, M.; Zhao, X.; Shang, Y. The Impact of Low-Carbon City Construction on Ecological Efficiency: Empirical Evidence from Quasi-Natural Experiments. Resour. Conserv. Recycl. 2020, 157, 104777. [Google Scholar] [CrossRef]
- Chen, H.; Guo, W.; Feng, X.; Wei, W.; Liu, H.; Feng, Y.; Gong, W. The Impact of Low-Carbon City Pilot Policy on the Total Factor Productivity of Listed Enterprises in China. Resour. Conserv. Recycl. 2021, 169, 105457. [Google Scholar] [CrossRef]
- Porter, M.E.; Linde, C.V.D. Toward a New Conception of the Environment-Competitiveness Relationship. J. Econ. Perspect. 1995, 9, 97–118. [Google Scholar] [CrossRef]
- Wang, C.; Liu, X.; Li, H.; Yang, C. Analyzing the Impact of Low-Carbon City Pilot Policy on Enterprises’ Labor Demand: Evidence from China. Energy Econ. 2023, 124, 106676. [Google Scholar] [CrossRef]
- Wang, J.; Liu, Z.; Shi, L.; Tan, J. The Impact of Low-Carbon Pilot City Policy on Corporate Green Technology Innovation in a Sustainable Development Context—Evidence from Chinese Listed Companies. Sustainability 2022, 14, 10953. [Google Scholar] [CrossRef]
- Xie, R.; Yuan, Y.; Huang, J. Different Types of Environmental Regulations and Heterogeneous Influence on “Green” Productivity: Evidence from China. Ecol. Econ. 2017, 132, 104–112. [Google Scholar] [CrossRef]
- Xu, J.; Cui, J. Low-carbon Cities and Firms’ Green Technological Innovation. China Ind. Econ. 2020, 12, 178–196. [Google Scholar]
- Zheng, J.; Shao, X.; Liu, W.; Kong, J.; Zuo, G. The Impact of the Pilot Program on Industrial Structure Upgrading in Low-Carbon Cities. J. Clean. Prod. 2021, 290, 125868. [Google Scholar] [CrossRef]
- Liu, Y.; Dong, X.; Dong, K. Pathway to Prosperity? The Impact of Low-Carbon Energy Transition on China’s Common Prosperity. Energy Econ. 2023, 124, 106819. [Google Scholar] [CrossRef]
- Dou, J.; Han, X. How Does the Industry Mobility Affect Pollution Industry Transfer in China: Empirical Test on Pollution Haven Hypothesis and Porter Hypothesis. J. Clean. Prod. 2019, 217, 105–115. [Google Scholar] [CrossRef]
- Jiang, Z.; Lyu, P. Stimulate or Inhibit? Multiple Environmental Regulations and Pollution-Intensive Industries’ Transfer in China. J. Clean. Prod. 2021, 328, 129528. [Google Scholar] [CrossRef]
- Berman, E.; Bui, L.T.M. Environmental Regulation and Labor Demand: Evidence from the South Coast Air Basin. J. Public Econ. 2001, 79, 265–295. [Google Scholar] [CrossRef]
- Perrier, Q.; Quirion, P. How Shifting Investment towards Low-Carbon Sectors Impacts Employment: Three Determinants under Scrutiny. Energy Econ. 2018, 75, 464–483. [Google Scholar] [CrossRef]
- Yamazaki, A. Jobs and Climate Policy: Evidence from British Columbia’s Revenue-Neutral Carbon Tax. J. Environ. Econ. Manag. 2017, 83, 197–216. [Google Scholar] [CrossRef]
- Marin, G.; Vona, F. The Impact of Energy Prices on Socioeconomic and Environmental Performance: Evidence from French Manufacturing Establishments, 1997–2015. Eur. Econ. Rev. 2021, 135, 103739. [Google Scholar] [CrossRef]
- Chen, Y. Environmental Regulation, Local Labor Market, and Skill Heterogeneity. Reg. Sci. Urban Econ. 2023, 101, 103898. [Google Scholar] [CrossRef]
- Wang, F.; Ge, X. Can Low-carbon Transition Impact Employment: Empirical Evidence from Low-carbon City Pilot Policy. China Ind. Econ. 2022, 5, 81–99. [Google Scholar]
- Shi, D.; Luo, C.; Zhang, K.; Bu, C. Does Stringent Environmental Regulation Improve Labor Force Employment? Evidence from China. Environ. Dev. Sustain. 2024. [Google Scholar] [CrossRef]
- Lu, J. Can the Green Merger and Acquisition Strategy Improve the Environmental Protection Investment of Listed Company? Environ. Impact Assess. Rev. 2021, 86, 106470. [Google Scholar] [CrossRef]
- Li, Z.; Li, R.Y.M.; Malik, M.Y.; Murshed, M.; Khan, Z.; Umar, M. Determinants of Carbon Emission in China: How Good Is Green Investment? Sustain. Prod. Consum. 2021, 27, 392–401. [Google Scholar] [CrossRef]
- Li, K. Transaction Cost, Corporate Governance and Division of Labor—A General Equilibrium Analysis of Professional Managers and Its Implication to China’s Practice. Res. Int. Bus. Financ. 2007, 21, 447–468. [Google Scholar] [CrossRef]
- Liu, G.; Liu, G.; Chao, Y. Green Credit and Low Carbon Transformation: Capital Integration or Technological Innovation: Evidence from Quasi Natural Experiments. J. Quant. Technol. Econ. 2024, 41, 151–171. [Google Scholar]
- Liu, G.; Wu, Q.; Zhou, H.; Wang, Y. The Catering Effect of Green Mergers and Acquisitions in Heavy Pollution Industries. Emerg. Mark. Financ. Trade 2023, 59, 1865–1881. [Google Scholar] [CrossRef]
- Li, B.; Xu, L.; McIver, R.; Wu, Q.; Pan, A. Green M&A, Legitimacy and Risk-taking: Evidence from China’s Heavy Polluters. Account. Amp. Financ. 2020, 60, 97–127. [Google Scholar]
- Stucki, T. How Different Policy Instruments Affect Green Product Innovation: A Differentiated Perspective. Energy Policy 2018, 114, 245–261. [Google Scholar] [CrossRef]
- Shi, P.; Huang, Q. Green Mergers and Acquisitions and Corporate Environmental Responsibility: Substantial Transformation or Strategic Arbitrage? Econ. Anal. Policy 2024, 83, 1023–1040. [Google Scholar] [CrossRef]
- Zhang, X.; Song, Y.; Zhang, M. Exploring the Relationship of Green Investment and Green Innovation: Evidence from Chinese Corporate Performance. J. Clean. Prod. 2023, 412, 137444. [Google Scholar] [CrossRef]
- Xie, Y.; Jiang, J.; Wang, D. Green Finance Policy and Labor Demand: Evidence from China. Pac.-Basin Financ. J. 2024, 86, 102434. [Google Scholar] [CrossRef]
- Hua, M.; Li, Z.; Zhang, Y.; Wei, X. Does Green Finance Promote Green Transformation of the Real Economy? Res. Int. Bus. Financ. 2024, 67, 102090. [Google Scholar] [CrossRef]
- Cao, M.; Duan, K.; Ibrahim, H. Green Investments and Their Impact on ESG Ratings: An Evidence from China. Econ. Lett. 2023, 232, 111365. [Google Scholar] [CrossRef]
- Xu, H.; Liu, X. Urban Environmental Regulation, Firms’ Emission Reduction Strategies and Labor Demand: Evidence from China. Econ. Anal. Policy 2024, 84, 589–609. [Google Scholar] [CrossRef]
- Wang, Z.; Chu, E. Shifting Focus from End-of-Pipe Treatment to Source Control: ESG Ratings’ Impact on Corporate Green Innovation. J. Environ. Manag. 2024, 354, 120409. [Google Scholar] [CrossRef]
- Pan, C.; Huang, Y.; Jin, L. Market Entry Deregulation and Corporate Vertical Specialization: Evidence from China. Econ. Model. 2023, 129, 106534. [Google Scholar] [CrossRef]
- Sun, L.; Cao, X.; Alharthi, M.; Zhang, J.; Taghizadeh-Hesary, F.; Mohsin, M. Carbon Emission Transfer Strategies in Supply Chain with Lag Time of Emission Reduction Technologies and Low-Carbon Preference of Consumers. J. Clean. Prod. 2020, 264, 121664. [Google Scholar] [CrossRef]
- Dong, Z.; Liu, H.; Zhang, W. The Effect of Information Disclosure on Low-Carbon Innovation. Energy 2024, 288, 129819. [Google Scholar] [CrossRef]
- Qin, S.; Liu, Z.; Wang, J.; Wu, Y. The Impact of Digital Transformation on Labour Demand Quantity and Structure: Evidence from China. Econ. Anal. Policy 2024, 84, 1452–1469. [Google Scholar] [CrossRef]
- Yu, D.; Li, J. Evaluating the Employment Effect of China’s Carbon Emission Trading Policy: Based on the Perspective of Spatial Spillover. J. Clean. Prod. 2021, 292, 126052. [Google Scholar] [CrossRef]
- Wu, B.; Yang, W. Empirical Test of the Impact of the Digital Economy on China’s Employment Structure. Financ. Res. Lett. 2022, 49, 103047. [Google Scholar] [CrossRef]
- Jiang, T. Mediating Effects and Moderating Effects in Causal Inference. China Ind. Econ. 2022, 5, 100–120. [Google Scholar]
- Liu, B.; Gan, L.; Huang, K.; Hu, S. The Impact of Low-Carbon City Pilot Policy on Corporate Green Innovation: Evidence from China. Financ. Res. Lett. 2023, 58, 104055. [Google Scholar] [CrossRef]
- Guo, M.; Wang, H.; Kuai, Y. Environmental Regulation and Green Innovation: Evidence from Heavily Polluting Firms in China. Financ. Res. Lett. 2023, 53, 103624. [Google Scholar] [CrossRef]
- Wang, Y. Impact of Environmental Information Disclosure on Environmental Regulation Intensity: Evidence from 113 Cities in China. Sci. Rep. 2024, 14, 25357. [Google Scholar] [CrossRef]
- Qin, M.; Fan, L.; Li, J.; Li, Y. The Income Distribution Effects of Environmental Regulation in China: The Case of Binding SO2 Reduction Targets. J. Asian Econ. 2021, 73, 101272. [Google Scholar] [CrossRef]
- Chen, T.; Zhang, Z. Can the Low-Carbon Transition Impact the Urban–Rural Income Gap? Empirical Evidence from the Low-Carbon City Pilot Policy. Sustainability 2023, 15, 5726. [Google Scholar] [CrossRef]
Disclaimer/Publisher’s Note: The statements, opinions and data contained in all publications are solely those of the individual author(s) and contributor(s) and not of MDPI and/or the editor(s). MDPI and/or the editor(s) disclaim responsibility for any injury to people or property resulting from any ideas, methods, instructions or products referred to in the content. |
© 2025 by the authors. Licensee MDPI, Basel, Switzerland. This article is an open access article distributed under the terms and conditions of the Creative Commons Attribution (CC BY) license (https://creativecommons.org/licenses/by/4.0/).