
Configuration Paths for High-Quality Development of Listed Companies Based on the TOE Framework: Evidence from China’s High-Tech Enterprises


Abstract
1. Introduction
2. Literature Review and Analytical Framework
2.1. High-Quality Development
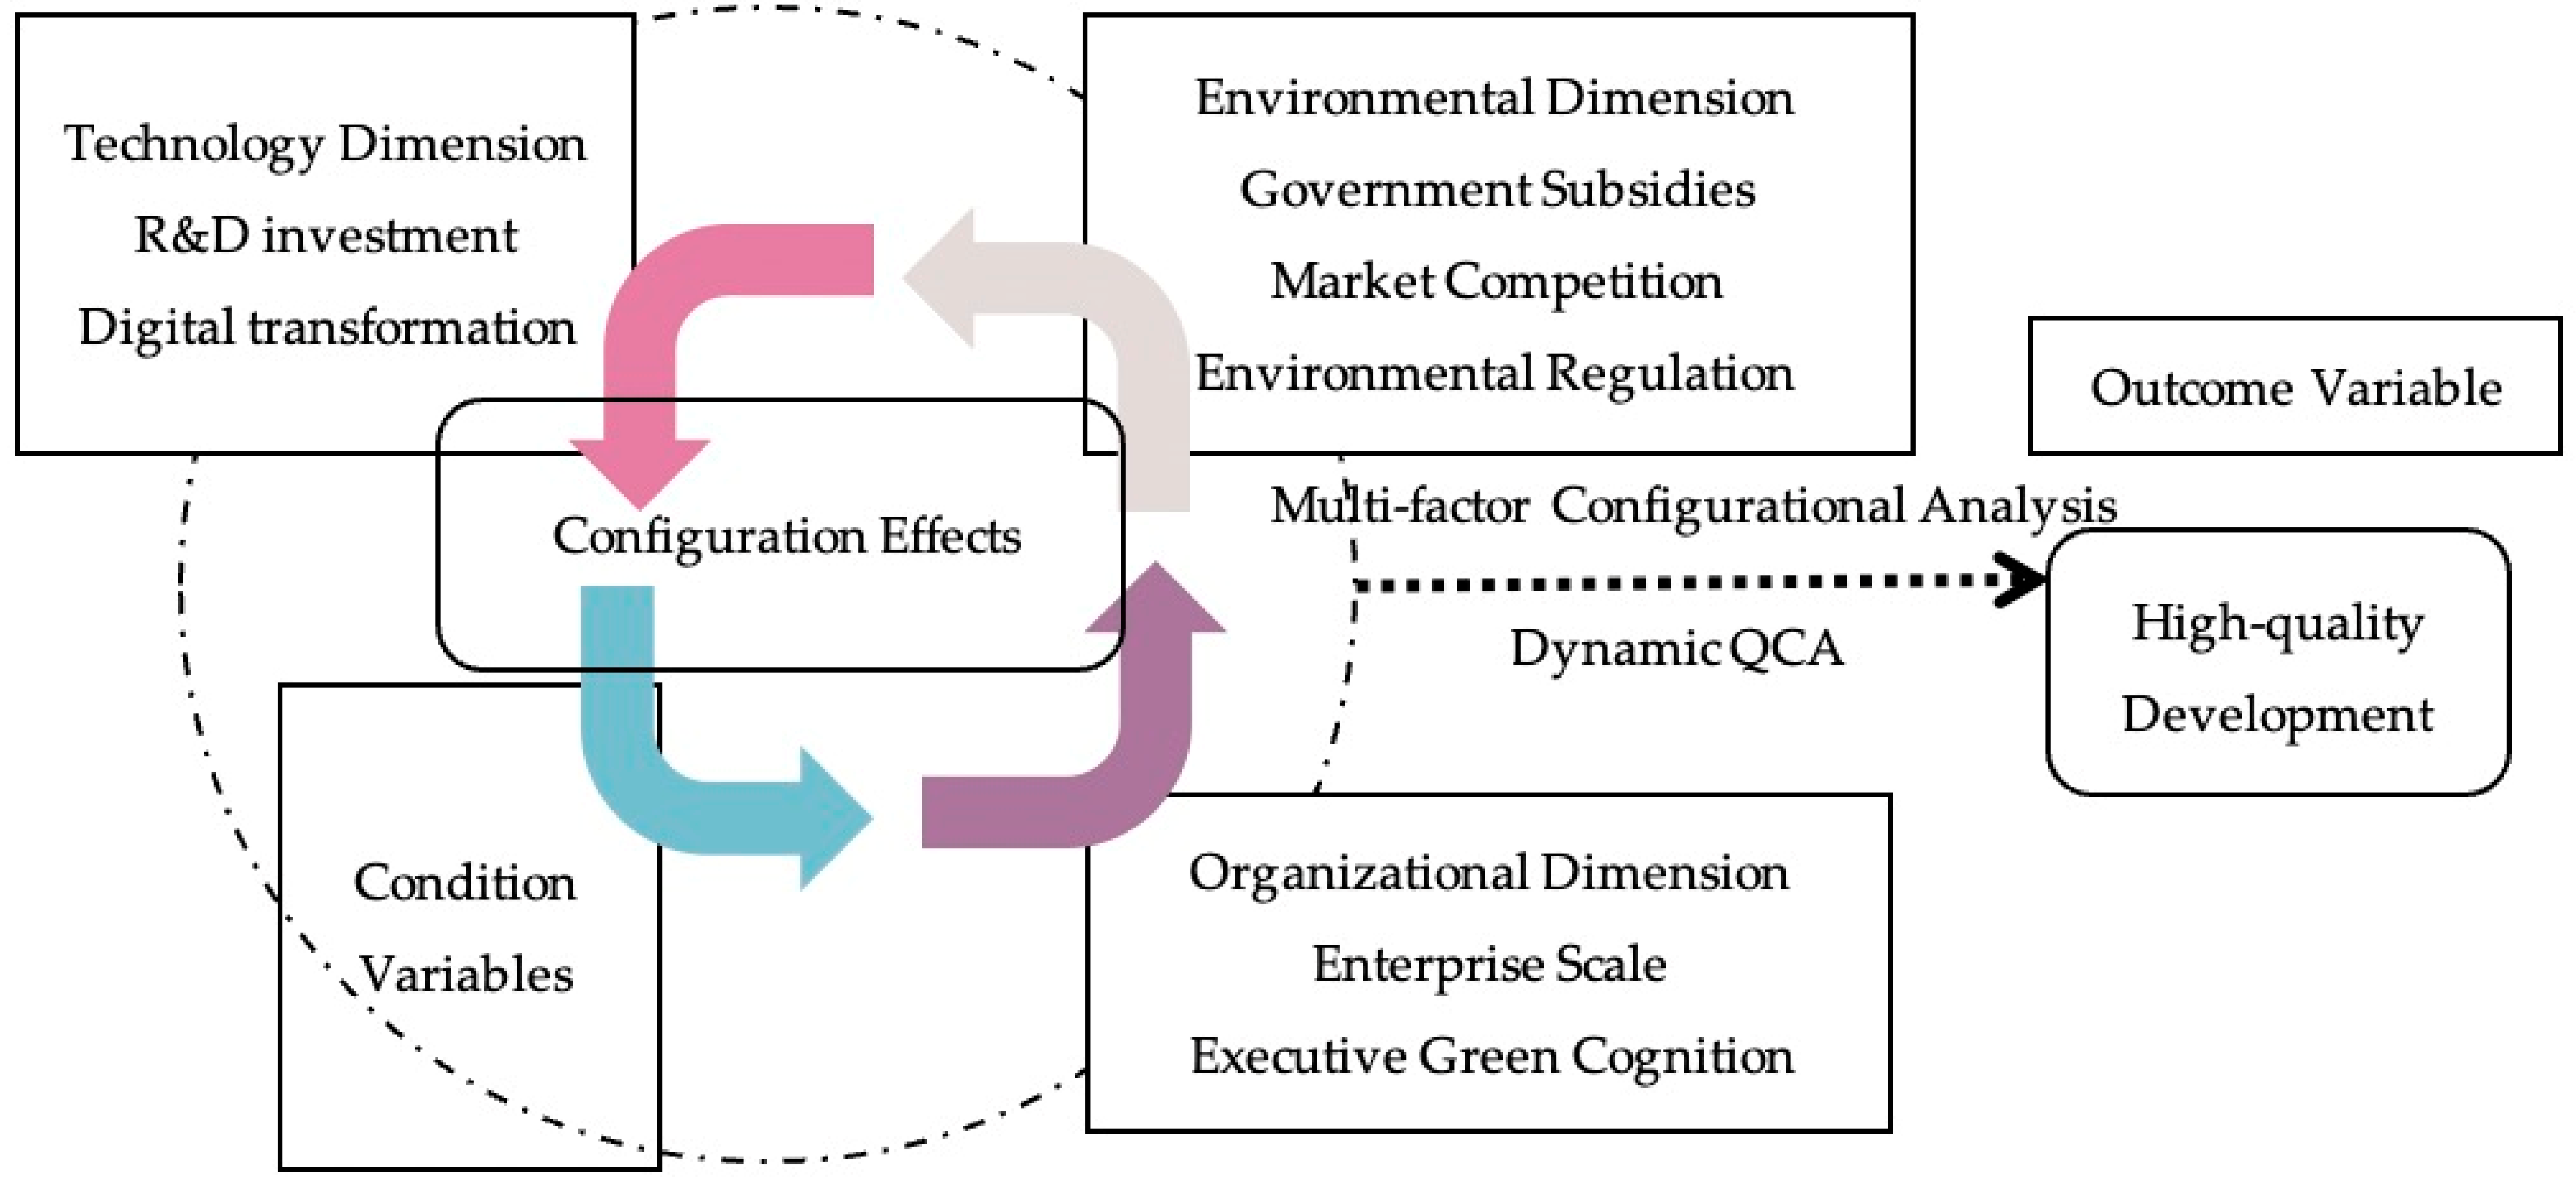
2.2. TOE Analysis Framework
2.3. TOE Analysis Framework for Driving Factors of High-Quality Development in Listed High- and New-Technology Enterprises
2.3.1. Technological Dimension
2.3.2. Organizational Dimension
2.3.3. Environmental Dimension
3. Research Design
3.1. Research Method
3.2. Data Sources
3.3. Variable Selection and Measurement
3.4. Variable Calibration
4. Empirical Analysis
4.1. Necessary Condition Analysis
4.2. Configurational Analysis
4.3. Analysis of Between- and Within-Group Results
4.4. Robustness Test
5. Conclusions and Outlook of This Study
6. Policy Recommendations
Author Contributions
Funding
Institutional Review Board Statement
Informed Consent Statement
Data Availability Statement
Conflicts of Interest
Appendix A
Appendix A.1. LP Method for Calculating Total Factor Productivity (TFP) Code
Appendix A.2. Executive Green Cognition Code
References
- Bu, H.B.; Bu, J.Q.; Ou Yang, L.L.; Shi, N.F.; Wang, J.Y. Research on the high-quality development of “new generation” high-tech enterprises in Hengyang under the background of “Three High and Four New”. Int. J. Econ. Financ. 2021, 13, 127–138. [Google Scholar] [CrossRef]
- Du, Y.; Li, J.; Liu, Q.; Zhao, S.; Chen, K. Configurational theory and QCA method from a complex dynamic perspective: Research progress and future directions. J. Manag. World 2021, 37, 180. [Google Scholar] [CrossRef]
- Zhu, N.; Wang, J. Tax incentives and high-quality development of high-tech enterprises. Friends Account. 2024, 12, 99–106. [Google Scholar]
- Gao, P.; Yuan, F.; Hu, H.; Liu, X. Motivation, mechanism and governance in high-quality development. Econ. Res. J. 2020, 55, 4–19. [Google Scholar]
- Lei, X.; Wu, S. Improvement of different types of environmental regulations on total factor productivity: A threshold effect analysis. Discrete Dyn. Nat. Soc. 2019, 2019, 9790545. [Google Scholar] [CrossRef]
- Xie, J.; Nozawa, W.; Yagi, M.; Fujii, H.; Managi, S. Do environmental, social, and governance activities improve corporate financial performance? Bus. Strategy Environ. 2019, 28, 286–300. [Google Scholar] [CrossRef]
- Xiao, W.; Deng, Q.; Yuan, W.; Wu, N. Financial frictions, capital misallocation, and total factor productivity: Evidence from China. Appl. Econ. 2023, 55, 4853–4870. [Google Scholar] [CrossRef]
- Chen, J.; Zhang, L.; Deng, G. Has the wind power price policy promoted the high-quality development of China’s wind power industry?—Analysis based on total factor productivity. Sustainability 2023, 15, 8878. [Google Scholar] [CrossRef]
- Wei, S.; Jiang, F.; Pan, J.; Cai, Q. Financial innovation, government auditing and corporate high-quality development: Evidence from China. Financ. Res. Lett. 2023, 58, 104567. [Google Scholar] [CrossRef]
- Zhao, Z. Research on the impact of new quality productive forces on the high-quality development of enterprises. Xinjiang State Farms Econ. 2024, 2024, 81–92. [Google Scholar]
- Zhang, S.; Xu, M.; Zhu, Y.; Wang, Z. Technological innovation, organizational resilience and high-quality development of manufacturing enterprises. Sci. Technol. Progress Policy 2023, 40, 81–92. [Google Scholar] [CrossRef]
- Sun, W.; Fang, J. Does environmental governance matter to the relationship between digital transformation and high-quality development? Evidence from the manufacturing sector in China. Environ. Sci. Pollut. Res. 2023, 30, 97005–97024. [Google Scholar] [CrossRef]
- Healy, P.M.; Palepu, K.G. Information asymmetry, corporate disclosure, and the capital markets: A review of the empirical disclosure literature. J. Account. Econ. 2001, 31, 405–440. [Google Scholar] [CrossRef]
- Chen, Z.; Liu, Y. Government subsidies, enterprise innovation and high-quality development of manufacturing enterprises. Reform 2019, 8, 140–151. [Google Scholar]
- Zhang, N.; Ma, R. The impact of business environment optimization on the high-quality development of manufacturing enterprises. J. Univ. Jinan Social Sci. Ed. 2023, 33, 87–100. [Google Scholar] [CrossRef]
- Wang, J.; Gao, X.; Jia, R.; Zhao, L. Evaluation index system construction of high-quality development of Chinese real enterprises based on factor analysis and AHP. Discret. Dyn. Nat. Soc. 2022, 2022, 8733002. [Google Scholar] [CrossRef]
- Zhang, Y.; Liu, M. Paths and mechanisms for high-quality accounting information to promote high-quality development: Based on NCA and QCA of provincial economies. Friends Account. 2024, 5, 10–19. [Google Scholar]
- Li, J.; Yao, Y.; Ye, Z. The determinants and development paths of provincial governmental big data under TOE framework—Based on empirical research of fsQCA. J. Intell. 2022, 41, 200–207. [Google Scholar] [CrossRef]
- Qiao, H.; Li, Z.; Huang, C. Influencing factors and accelerating paths of data element marketization: Analysis of configuration effect from the perspective of complex economic system management. Foreign Econ. Manag. 2023, 45, 38–54. [Google Scholar] [CrossRef]
- Arthur, W.B. Complexity and the Economy, 1st ed.; Oxford University Press: Oxford, UK, 2014; Available online: https://kns.cnki.net/kcms2/article/abstract?v=Sx3iFXVSxlLZqfT2cV-R5Rs-2DPXHqyPUs-1WzzlekZWyLZ_y_bDRi5uSrmMyBEBFn03F_imWTgwaZhnoWQRek00WQx8KH965fwRei8GzWQc-fPtoNLwsn1SyrJAuuO_xGR3dkjufVPSIEHUExJp0m6dtoGXkUSxnA5Ro5g1qOQLnQ4i1TxvXchOMVYMwL3W&uniplatform=NZKPT&language=CHS (accessed on 10 January 2025).
- Sheng, Z.; Yu, J. Complex systems management: An emerging management science with Chinese characteristics. J. Manag. World, 2021; 37, 36–50+2. [Google Scholar] [CrossRef]
- Zhang, Z.; Feng, H.; Wang, L.; Yang, L. How to achieve high-quality development of SRDI enterprises—A study of the TOE framework-based configuration. PLoS ONE 2024, 19, e0304688. [Google Scholar] [CrossRef]
- Ma, L.; Wang, T. The impact of digital economy on the high quality development of agricultural enterprises: Evidence from listed agricultural enterprises in China. SAGE Open 2024, 14, 2. [Google Scholar] [CrossRef]
- Xu, P.; Chen, L.; Dai, H. Pathways to sustainable development: Corporate digital transformation and environmental performance in China. Sustainability 2023, 15, 256. [Google Scholar] [CrossRef]
- Saberi, S.; Kouhizadeh, M.; Sarkis, J.; Shen, L. Blockchain technology and its relationships to sustainable supply chain management. Int. J. Prod. Res. 2018, 57, 2117–2135. [Google Scholar] [CrossRef]
- Ghasemaghaei, M.; Calic, G. Assessing the impact of big data on firm innovation performance: Big data is not always better data. J. Bus. Res. 2020, 108, 147–162. [Google Scholar] [CrossRef]
- Wu, F.; Hu, H.; Lin, H.; Ren, X. Enterprise digital transformation and capital market performance: Empirical evidence from stock liquidity. J. Manag. World 2021, 37, 130–144+10. [Google Scholar] [CrossRef]
- Li, W.; Li, N. Green technology innovation, intelligent transformation and Manufacturing companies’ environmental performance: Empirical research based on threshold effect. Manag. Rev. 2023, 35, 90–101. [Google Scholar] [CrossRef]
- Kong, D.; Shi, Z. Environmental regulation optimization of Chinese enterprises’ green technology innovation under the cabon peaking and carbon neutrality goals. Tax. Econ. 2022, 6, 1–7. [Google Scholar]
- Yao, J.; Ju, D.; Zhang, J. Do enterprises become corrupted by association: Enterprise size, government importance, and corporate political behavior. J. Manag. World 2015, 7, 98–108. Available online: https://kns.cnki.net/kcms2/article/abstract?v=Sx3iFXVSxlKc4Ut_00Ggum8cMOfJvty3jT5d6QIg-QyCBcRl-CUXP4As9n0SWB308HgkiWCLhPvlL1ydxvpz0lkaqVMNf4s_8O6SxC7Zp8ooi_pXrFdX1uDe77zfDTdXQ64MN2yIx99LMMayz5pM91UME1ei1bd3AXz8maiJfCQ6l7__kcll9guDS0jl42sby&uniplatform=NZKPT&language=CHS (accessed on 10 January 2025).
- Li, Y.; Xia, Y.; Zhao, Z. The relationship between executives’ green perception and firm performance in heavy-pollution industries: A moderated mediating effect model. Sci. Technol. Prog. Policy 2023, 40, 113–123. [Google Scholar] [CrossRef]
- Xing, L.; Yu, H. Research on the impact of green dynamic ability on environmental innovation—The moderating effect of environmental regulation and top managers’ environmental awareness. Soft Sci. 2020, 34, 26–32. [Google Scholar] [CrossRef]
- Orazalin, N.; Baydauletov, M. Corporate social responsibility strategy and corporate environmental and social performance: The moderating role of board gender diversity. Corp. Soc. Responsib. Environ. Manag. 2020, 27, 1664–1676. [Google Scholar] [CrossRef]
- Xue, Y.; Jiang, C.; Guo, Y.; Liu, J.; Wu, H.; Hao, Y. Corporate social responsibility and high-quality development: Do green innovation, environmental investment and corporate governance matter? Emerg. Mark. Financ. Trade. 2022, 58, 3191–3214. [Google Scholar] [CrossRef]
- Wu, L.; Jin, S. Corporate social responsibility and sustainability: From a corporate governance perspective. Sustainability 2022, 4, 15457. [Google Scholar] [CrossRef]
- Wang, K.; Liu, L.; Deng, M.; Feng, Y. Internal control, environmental uncertainty and total factor productivity of firms—Evidence from Chinese capital market. Sustainability 2022, 15, 736. [Google Scholar] [CrossRef]
- Hussey, D.M.; Eagan, P.D. Using structural equation modeling to test environmental performance in small and medium-sized manufacturers: Can SEM help SMEs? J. Clean. Prod. 2007, 15, 303–312. [Google Scholar] [CrossRef]
- Țăpurică, O.C.; Ispășoiu, C.E. Analyzing the influence of environmental leadership on pollution abatement costs. Rev. Tinerilor Econ. 2013, 20, 117–126. [Google Scholar]
- Wu, Y.; Song, Y.; Deng, G. Institutional environment, OFDI, and TFP growth: Evidence from China. Emerg. Mark. Financ. Trade 2017, 53, 2020–2038. [Google Scholar] [CrossRef]
- Dong, Z.; Wang, H. Local-neighborhood effect of green technology of environmental regulation. China Ind. Econ. 2019, 1, 100–118. [Google Scholar] [CrossRef]
- Blinova, E.; Ponomarenko, T.; Knysh, V. Analyzing the concept of corporate sustainability in the context of sustainable business development in the mining sector with elements of circular economy. Sustainability 2022, 14, 8163. [Google Scholar] [CrossRef]
- Xue, D.; Ding, Y.; Yu, L.; Deng, X. The impact of green institutional pressure from local governments on corporate innovation: An empirical evidence from foreign-invested enterprises in China. Sustainability 2023, 15, 11678. [Google Scholar] [CrossRef]
- Liu, X.; Li, S. The impact of criminal law regulation-based business environment optimization on entrepreneurial spirit and enterprise development. Front. Psychol. 2022, 13, 944146. [Google Scholar] [CrossRef]
- Sun, L. Enterprise green technology transformation: Demand, competition, and policy: Based on a multi-stage game model. Sci. Technol. Manag. Res. 2022, 42, 179–187. [Google Scholar] [CrossRef]
- Liu, J.; Xia, Q.; Xu, Y.; Hou, X. Industrial technological complexity, government subsidies and corporate green technology innovation incentives. Nankai Bus. Rev. 2024, 27, 94–103+149+104–105. Available online: https://kns.cnki.net/kcms2/article/abstract?v=Sx3iFXVSxlKy5aKYKODaZL3h1BqKAYF59dU18BApUxXGkh09P33uapmuYhRfrVfu15UANXemZO1QLg2DICXRpKogbueI6Jh7Xqmyq4HSPoQA4JvIXgSz4mfnqglBFwbnnY4qASmMUP2IMDHbE8KTwy3hW (accessed on 10 January 2025).
- Drăgan, G.B.; Vasilache, R.O.; Schin, G.C. Exploring eco-label industry actors’ perceptions on the capabilities of a forthcoming multiple project management software—An fsQCA approach. J. Bus. Res. 2020, 115, 281–288. [Google Scholar] [CrossRef]
- Furnari, S.; Crilly, D.; Misangyi, V.F.; Greckhamer, T.; Fiss, P.C.; Aguilera, R.V. Capturing causal complexity: Heuristics for configurational theorizing. Acad. Manag. Rev. 2021, 46, 778–799. [Google Scholar] [CrossRef]
- Greckhamer, T.; Furnari, S.; Fiss, P.C.; Aguilera, R.V. Studying configurations with qualitative comparative analysis: Best practices in strategy and organization research. Strateg. Organ. 2018, 16, 482–495. [Google Scholar] [CrossRef]
- Douglas, E.J.; Shepherd, D.A.; Prentice, C. Using fuzzy-set qualitative comparative analysis for a finer-grained understanding of entrepreneurship. J. Bus. Ventur. 2020, 35, 105970. [Google Scholar] [CrossRef]
- Park, Y.K.; Mithas, S. Organized complexity of digital business strategy: A configurational perspective. MIS Q. 2020, 44, 85–127. [Google Scholar] [CrossRef]
- Ragin, C.C. Redesigning Social Inquiry; Du, Y., Translator; China Machine Press: Beijing, China, 2019. [Google Scholar]
- Seawright, J.; Gerring, J. Case selection techniques in case study research: A menu of qualitative and quantitative options. Political Res. Q. 2008, 61, 294–308. [Google Scholar] [CrossRef]
- Ragin, C.C. Fuzzy-Set Social Science, 1st ed.; University of Chicago Press: Chicago, IL, USA, 2000. [Google Scholar]
- Fainshmidt, S.; Witt, M.A.; Aguilera, R.V.; Verbeke, A. The contributions of qualitative comparative analysis (QCA) to international business research. J. Int. Bus. Stud. 2020, 51, 455–466. [Google Scholar] [CrossRef]
- Castro, R.G.; Ariño, M.A. A general approach to panel data set—Theoretic research. J. Adv. Manag. Sci. Inf. Syst. 2016, 2, 63–76. [Google Scholar] [CrossRef]
- Beynon, M.J.; Jones, P.; Pickernell, D. Country-level entrepreneurial attitudes and activity through the years: A panel data analysis using fsQCA. J. Bus. Res. 2020, 115, 443–455. [Google Scholar] [CrossRef]
- Zhen, M.; Liu, R. Research on the path of high-quality development of manufacturing enterprises—Based on NCA and dynamic QCA methods. Financ. Account. Mon. 2024, 45, 123–128. [Google Scholar] [CrossRef]
- Xu, X.; Han, P. Digital economy and high-quality development of manufacturing industry. In Proceedings of the International Conference on Business Intelligence and Information Technology BIIT 2021, Harbin, China, 18–20 December 2021; Hassanien, A.E., Xu, Y., Zhao, Z., Mohammed, S., Fan, Z., Eds.; Springer: Cham, Switzerland, 2022. [Google Scholar] [CrossRef]
- Chen, H.M.; Kuo, T.C.; Chen, J.L. Impacts on the ESG and financial performances of companies in the manufacturing industry based on the climate change related risks. J. Clean. Prod. 2022, 380, 134951. [Google Scholar] [CrossRef]
- Zhou, R.; Yang, X.; Han, Y. Cleaner production and total factor productivity of polluting enterprises. J. Clean. Prod. 2023, 423, 138827. [Google Scholar] [CrossRef]
- Petrin, A.; Poi, B.P.; Levinsohn, J. Production function estimation in Stata using inputs to control for unobservables. Stata J. 2004, 4, 113–123. [Google Scholar] [CrossRef]
- Liu, Z.; Xiong, X.; Hu, S. Market competitive power, green behavior of enterprises, and improvement of green performance level of listed logistics enterprises configuration analysis of the base TOE framework. J. Chongqing Jiaotong Univ. Soc. Sci. Ed. 2024, pp. 1–11. Available online: https://kns.cnki.net/kcms2/article/abstract?v=Sx3iFXVSxlJP-ffQ-ouCGrSMQP_bKb4EOQOraezlxVtIIq-fV5-qY-cu26xQ6ZBKvQ4bpGiyC7m0BGHWpPSeeFdrE1NgM30a_ciV8gxsisfO5xn82L7MG_dBwCQ_zoCuVGI6VWyastb1eKOtxDh- (accessed on 10 January 2025).
- Chen, Y.; Masron, T.A.; Yuan, R. Impact of enterprise digital transformation on high-quality economic development in China. Appl. Econ. Lett. 2023, 1–4. [Google Scholar] [CrossRef]
- Zhao, C.; Wang, W.; Li, X. How does digital transformation affect the total factor productivity of enterprises? Financ. Trade Econ. 2021, 42, 114–129. [Google Scholar] [CrossRef]
- Cheng, Y.; Duan, Y. Research on the influence of financial subsidy policy on enterprise innovation performance—Empirical thinking based on resource acquisition ability. J. Ind. Technol. Econ. 2022, 41, 104–112. [Google Scholar] [CrossRef]
- Yu, J.; Wang, Y. Senior managers’ academic background and innovation investment from the perspective of market competitive position: An evidence from resource-based listed companies. J. Nanjing Univ. Financ. Econ. 2021, 6, 56–65. [Google Scholar]
- Deng, H.; Yang, L. Haze governance, local competition and industrial green transformation. China Ind. Econ. 2019, 10, 118–136. [Google Scholar]
- Du, Y.; Liu, Q.; Cheng, J. What kind of ecosystem for doing business will contribute to city-level high entrepreneurial activity? A research based on institutional configurations. J. Manag. World. 2020, 36, 141–155. [Google Scholar] [CrossRef]
- Zhang, M.; Du, Y. Qualitative comparative analysis (QCA) in management and organization research: Position, tactics, and directions. China J. Manag. 2019, 16, 1312–1323. [Google Scholar] [CrossRef]
- Huang, W.; Xu, S. Research on intelligent management accounting enabling high quality development of enterprises in the context of digital economy. Account. Corp. Manag. 2024, 6, 174–178. [Google Scholar] [CrossRef]
- Schneider, C.Q.; Wagemann, C. Set-Theoretic Methods for the Social Sciences: A Guide to Qualitative Comparative Analysis, 2nd ed.; Cambridge University Press: Cambridge, UK, 2012. [Google Scholar] [CrossRef]
- Judge, W.Q.; Fainshmidt, S.; Brown, J.L. Institutional systems for equitable wealth creation: Replication and an update of Judge et al. (2014). Manag. Organ. Rev. 2020, 16, 5–31. [Google Scholar] [CrossRef]
- Olley, G.S.; Pakes, A. The dynamics of productivity in the telecommunications equipment industry. Econometrica 1996, 64, 1263–1297. [Google Scholar] [CrossRef]

| Perspective | Representative Scholars | Influencing Factors | Methods | Effects | Purpose |
|---|---|---|---|---|---|
| Internal Factors External Factors | Zhang et al. [11] | Technological innovation | Improve organizational resilience and operational efficiency, promote production process and product upgrade | Reduce costs and transaction fees, inject vitality into enterprises bringing competitive advantages, meet consumer differentiation | Promote high-quality development |
| Sun and Fang [12] | Digital transformation | Enhance resource collection and utilization, comprehensively empower production operations, organizational management, and technological innovation | Improve corporate social responsibility performance, perfect corporate governance | ||
| Complex Factors Perspective Internal Factors | Healy and Palepu [13] | Information disclosure | High-quality information disclosure, obtain better financing conditions | Reduce information asymmetry, increase market value | |
| Chen and Liu [14] | Government subsidies | Provide subsidies, release positive signals, etc. | Alleviate enterprise financing constraints, improve performance | ||
| Zhang and Ma [15] | Business environment | Incentivize enterprise innovation, reduce non-productive expenditures, etc. | Provide differentiated services and products | ||
| External Factors | Wang et al. [16] | Capabilities, technology, government, etc. | Enhance capability and technological progress, improve factor allocation efficiency, government support, etc. | Joint efforts from multiple parties |
| Variable Classification | Variable Name | Measurement Method | Full Membership | Crossover Point | Full Non-Membership | Average Value | Standard Deviation | Maximum Value | Minimum Value |
|---|---|---|---|---|---|---|---|---|---|
| Outcome Variable | Total Factor Productivity | Measured by LP method | 10.320 | 8.349 | 6.909 | 8.432 | 1.005 | 11.144 | 6.352 |
| Condition Variables | R&D Investment | The amount of R&D investment is increased by 1, and then the natural logarithm is taken. | 20.989 | 18.371 | 16.494 | 18.501 | 1.348 | 22.665 | 15.689 |
| Digital Transformation | Digital transformation (comprehensive index) | 217.000 | 25.000 | 2.000 | 52.365 | 73.466 | 395.000 | 0.000 | |
| Enterprise Scale | Total assets (natural logarithm) | 24.728 | 22.204 | 20.623 | 22.372 | 1.237 | 26.406 | 20.127 | |
| Executive Green Cognition | Frequency of relevant words in annual reports | 12.000 | 1.000 | 0.000 | 3.064 | 4.626 | 25.000 | 0.000 | |
| Government Subsidies | Government subsidies received in the current year are increased by 1, and then the natural logarithm is taken. | 19.443 | 16.791 | 14.479 | 16.841 | 1.467 | 20.653 | 12.930 | |
| Market Competition | Lerner index | 0.289 | 0.102 | −0.047 | 0.108 | 0.107 | 0.402 | −0.283 | |
| Environmental Regulation | Frequency of relevant words in provincial government work reports | 89.000 | 60.000 | 33.000 | 60.565 | 18.146 | 116.000 | 28.000 |
| Antecedent Variables | High-Quality Development | ~ High-Quality Development | ||||||
|---|---|---|---|---|---|---|---|---|
| Aggregate Consistency | Aggregate Coverage | Between-Group Consistency | Within-Group Consistency | Aggregate Consistency | Aggregate Coverage | Between-Group Consistency | Within-Group Consistency | |
| R&D Investment | 0.858 | 0.856 | 0.051 | 0.259 | 0.519 | 0.545 | 0.218 | 0.486 |
| ~ R&D Investment | 0.544 | 0.518 | 0.174 | 0.486 | 0.863 | 0.865 | 0.051 | 0.227 |
| Digital transformation | 0.620 | 0.706 | 0.185 | 0.486 | 0.556 | 0.666 | 0.247 | 0.486 |
| ~ Digital transformation | 0.706 | 0.602 | 0.163 | 0.454 | 0.754 | 0.677 | 0.073 | 0.454 |
| Enterprise Scale | 0.868 | 0.875 | 0.054 | 0.227 | 0.504 | 0.535 | 0.218 | 0.519 |
| ~ Enterprise Scale | 0.539 | 0.508 | 0.149 | 0.486 | 0.882 | 0.876 | 0.036 | 0.227 |
| Executive Green Cognition | 0.603 | 0.657 | 0.338 | 0.389 | 0.570 | 0.655 | 0.323 | 0.454 |
| ~ Executive Green Cognition | 0.683 | 0.602 | 0.214 | 0.324 | 0.701 | 0.650 | 0.163 | 0.324 |
| Government Subsidies | 0.811 | 0.797 | 0.062 | 0.227 | 0.552 | 0.571 | 0.182 | 0.389 |
| ~ Government Subsidies | 0.564 | 0.545 | 0.145 | 0.421 | 0.804 | 0.817 | 0.036 | 0.259 |
| Market Competition | 0.673 | 0.656 | 0.047 | 0.357 | 0.677 | 0.694 | 0.091 | 0.324 |
| ~ Market Competition | 0.686 | 0.668 | 0.091 | 0.357 | 0.664 | 0.681 | 0.058 | 0.357 |
| Environmental Regulation | 0.645 | 0.644 | 0.185 | 0.324 | 0.649 | 0.682 | 0.185 | 0.357 |
| ~ Environmental Regulation | 0.858 | 0.856 | 0.051 | 0.259 | 0.519 | 0.545 | 0.218 | 0.486 |
| Causal Combination | Dimension | 2013 | 2014 | 2015 | 2016 | 2017 | 2018 | 2019 | 2020 | 2021 | 2022 |
|---|---|---|---|---|---|---|---|---|---|---|---|
| R&D Investment–~ TFP | Between-Group Consistency | 0.358 | 0.393 | 0.435 | 0.496 | 0.551 | 0.589 | 0.615 | 0.613 | 0.645 | 0.633 |
| Between-Group Coverage | 0.655 | 0.638 | 0.634 | 0.609 | 0.563 | 0.529 | 0.521 | 0.504 | 0.464 | 0.457 | |
| Enterprise Scale–~ TFP | Between-Group Consistency | 0.341 | 0.408 | 0.482 | 0.532 | 0.586 | 0.627 | 0.640 | 0.677 | 0.723 | 0.713 |
| Between-Group Coverage | 0.858 | 0.818 | 0.778 | 0.732 | 0.677 | 0.640 | 0.624 | 0.607 | 0.571 | 0.570 | |
| Executive Green Cognition–TFP | Between-Group Consistency | 0.32 | 0.373 | 0.441 | 0.508 | 0.561 | 0.582 | 0.587 | 0.595 | 0.611 | 0.595 |
| Between-Group Coverage | 0.612 | 0.615 | 0.626 | 0.600 | 0.552 | 0.524 | 0.512 | 0.496 | 0.459 | 0.450 | |
| Executive Green Cognition–~ TFP | Between-Group Consistency | 0.655 | 0.636 | 0.619 | 0.609 | 0.669 | 0.690 | 0.686 | 0.675 | 0.088 | 0.764 |
| Between-Group Coverage | 0.527 | 0.549 | 0.612 | 0.626 | 0.670 | 0.694 | 0.705 | 0.711 | 0.975 | 0.741 | |
| ~ Executive Green Cognition–TFP | Between-Group Consistency | 0.596 | 0.596 | 0.514 | 0.551 | 0.620 | 0.651 | 0.653 | 0.658 | 0.116 | 0.719 |
| Between-Group Coverage | 0.795 | 0.782 | 0.732 | 0.707 | 0.630 | 0.590 | 0.585 | 0.585 | 0.947 | 0.526 | |
| ~ Environmental Regulation–TFP | Between-Group Consistency | 0.746 | 0.747 | 0.729 | 0.715 | 0.630 | 0.593 | 0.597 | 0.605 | 0.895 | 0.512 |
| Between-Group Coverage | 0.527 | 0.549 | 0.510 | 0.560 | 0.621 | 0.653 | 0.664 | 0.677 | 0.604 | 0.707 | |
| ~ Environmental Regulation–~ TFP | Between-Group Consistency | 0.358 | 0.393 | 0.435 | 0.496 | 0.551 | 0.589 | 0.615 | 0.613 | 0.645 | 0.633 |
| Between-Group Coverage | 0.358 | 0.393 | 0.435 | 0.496 | 0.551 | 0.589 | 0.615 | 0.613 | 0.645 | 0.633 |
| Antecedent Conditions | High-Quality Development | ~ High-Quality Development | ||||||
|---|---|---|---|---|---|---|---|---|
| H1 | H2 | H3 | NH1 | NH2 | NH3 | NH4 | NH5 | |
| R&D Investment |  | | |  | | | | |
| Digital Transformation | | | ||||||
| Enterprise Scale | | | | | | | | |
| Executive Green Cognition | | | ||||||
| Government Subsidies | | | ||||||
| Market Competition | | | ||||||
| Environmental Regulation | | | ||||||
| Consistency Level | 0.933 | 0.958 | 0.949 | 0.941 | 0.946 | 0.935 | 0.956 | 0.941 |
| PRI | 0.864 | 0.876 | 0.856 | 0.872 | 0.872 | 0.871 | 0.886 | 0.858 |
| Coverage | 0.717 | 0.41 | 0.382 | 0.651 | 0.491 | 0.73 | 0.57 | 0.558 |
| Unique Coverage | 0.205 | 0.012 | 0.019 | 0.008 | 0.002 | 0.024 | 0.005 | 0.004 |
| Between-Group Consistency Adjustment Distance | 0.011 | 0.011 | 0.018 | 0.007 | 0.018 | 0.011 | 0.011 | 0.007 |
| Within-Group Consistency Adjustment Distance | 0.162 | 0.130 | 0.130 | 0.130 | 0.032 | 0.065 | 0.097 | 0.130 |
| Overall Consistency Level | 0.930 | 0.927 | ||||||
| Overall PRI | 0.858 | 0.861 | ||||||
| Overall Coverage | 0.757 | 0.800 | ||||||
 = core condition present; = core condition absent; = peripheral condition present;
  = peripheral condition absent; blank = no impact in the configuration.
| Year | H1 | H2 | H3 |
|---|---|---|---|
| 2013 | 0.944 | 0.956 | 0.946 |
| 2014 | 0.941 | 0.959 | 0.946 |
| 2015 | 0.920 | 0.944 | 0.941 |
| 2016 | 0.915 | 0.945 | 0.944 |
| 2017 | 0.931 | 0.952 | 0.942 |
| 2018 | 0.934 | 0.968 | 0.965 |
| 2019 | 0.932 | 0.962 | 0.949 |
| 2020 | 0.928 | 0.965 | 0.945 |
| 2021 | 0.942 | 0.964 | 0.994 |
| 2022 | 0.940 | 0.961 | 0.955 |
| Mean value | 0.933 | 0.958 | 0.953 |
| Standard deviation | 0.010 | 0.008 | 0.016 |
| Antecedent Conditions | Adjusting Consistency Level Threshold to 0.9 | Adjusting Frequency Threshold to 30 | ||||
|---|---|---|---|---|---|---|
| H1 | H2 | H3 | H1 | H2 | H3 | |
| R&D Investment | | | | | | |
| Digital Transformation | | | ||||
| Enterprise Scale | | | | | | |
| Executive Green Cognition | | | ||||
| Government Subsidies | | | ||||
| Market Competition | | | | |||
| Environmental Regulation | | | | |||
| Consistency Level | 0.933 | 0.958 | 0.949 | 0.933 | 0.949 | 0.963 |
| PRI | 0.864 | 0.876 | 0.856 | 0.864 | 0.856 | 0.865 |
| Coverage | 0.717 | 0.41 | 0.382 | 0.717 | 0.382 | 0.331 |
| Unique Coverage | 0.205 | 0.012 | 0.019 | 0.205 | 0.019 | 0.010 |
| Between-Group Consistency Adjustment Distance | 0.011 | 0.011 | 0.018 | 0.011 | 0.018 | 0.011 |
| Within-Group Consistency Adjustment Distance | 0.162 | 0.130 | 0.130 | 0.162 | 0.130 | 0.130 |
| Overall Consistency Level | 0.930 | 0.930 | ||||
| Overall PRI | 0.858 | 0.858 | ||||
| Overall Coverage | 0.757 | 0.755 | ||||
| Antecedent Conditions | Change the explained variable | |||||
| H1 | H2 | H3 | H4 | |||
| R&D Investment | | | | | ||
| Digital Transformation | | | ||||
| Enterprise Scale | | | | | ||
| Executive Green Cognition | | |||||
| Government Subsidies | | |||||
| Market Competition | | | ||||
| Environmental Regulation | | | ||||
| Consistency Level | 0.900 | 0.939 | 0.933 | 0.944 | ||
| PRI | 0.798 | 0.83 | 0.813 | 0.818 | ||
| Coverage | 0.692 | 0.383 | 0.376 | 0.373 | ||
| Unique Coverage | 0.193 | 0.009 | 0.008 | 0.009 | ||
| Between-Group Consistency Adjustment Distance | 0.022 | 0.029 | 0.029 | 0.029 | ||
| Within-Group Consistency Adjustment Distance | 0.162 | 0.227 | 0.195 | 0.259 | ||
| Overall Consistency Level | 0.897 | |||||
| Overall PRI | 0.794 | |||||
| Overall Coverage | 0.738 | |||||
= core condition present; = core condition absent; = peripheral condition present; = peripheral condition absent; blank = no impact in the configuration.Disclaimer/Publisher’s Note: The statements, opinions and data contained in all publications are solely those of the individual author(s) and contributor(s) and not of MDPI and/or the editor(s). MDPI and/or the editor(s) disclaim responsibility for any injury to people or property resulting from any ideas, methods, instructions or products referred to in the content. |
© 2025 by the authors. Licensee MDPI, Basel, Switzerland. This article is an open access article distributed under the terms and conditions of the Creative Commons Attribution (CC BY) license (https://creativecommons.org/licenses/by/4.0/).
Share and Cite
Qian, M.; Yang, J.; Qiu, M. Configuration Paths for High-Quality Development of Listed Companies Based on the TOE Framework: Evidence from China’s High-Tech Enterprises. Sustainability 2025, 17, 1082. https://doi.org/10.3390/su17031082
Qian M, Yang J, Qiu M. Configuration Paths for High-Quality Development of Listed Companies Based on the TOE Framework: Evidence from China’s High-Tech Enterprises. Sustainability. 2025; 17(3):1082. https://doi.org/10.3390/su17031082
Chicago/Turabian StyleQian, Min, Jiameng Yang, and Mengyuan Qiu. 2025. "Configuration Paths for High-Quality Development of Listed Companies Based on the TOE Framework: Evidence from China’s High-Tech Enterprises" Sustainability 17, no. 3: 1082. https://doi.org/10.3390/su17031082
APA StyleQian, M., Yang, J., & Qiu, M. (2025). Configuration Paths for High-Quality Development of Listed Companies Based on the TOE Framework: Evidence from China’s High-Tech Enterprises. Sustainability, 17(3), 1082. https://doi.org/10.3390/su17031082