1. Introduction
Demand Responsive Transit (DRT) was initially introduced as a supplemental transportation service for areas with limited access to public transit. Following the implementation of the Americans with Disabilities Act (ADA) in the United States (1960), DRT began serving as an option in transit-deprived areas. Over time, it expanded to meet various needs, including rural transportation policy support, student transportation, and corporate commuter shuttles. Given its versatile role, DRT is now also being considered for metropolitan areas as a complementary system within the urban transit network, particularly for connecting transit hubs and major transport modes [
1,
2,
3,
4,
5].
Urban feeder buses typically operate at a financial loss when run on fixed routes due to operating costs exceeding revenues, posing a significant financial burden on transit providers. DRT presents a potential solution to this issue by offering demand-responsive services as feeder routes. Operating DRT flexibly based on passenger demand rather than fixed schedules allows for a more balanced approach between ridership and operating costs, potentially leading to cost savings. While DRT implementation has traditionally focused on transit-deprived areas, its application for connecting urban transit hubs is now gaining attention. Research on DRT’s effectiveness as a connected transit rather than a standalone transit option is also increasing [
6].
Transit-connected DRT has the potential to enhance connectivity between transit hubs, thereby promoting the use of major public transportation modes, such as rail. Connected DRT can be categorized into three forms: first-mile, middle-mile, and last-mile services [
1,
2,
5,
7]. First-mile DRT begins from a transit hub, last-mile DRT concludes at a transit hub, and middle-mile DRT operates primarily to facilitate transfers between two hubs. Punctuality is crucial for all three forms; for instance, without timely arrival and departure synchronization between first- and last-mile DRT and other transit modes, transfer wait times increase, resulting in passenger inconvenience. In the case of middle-mile DRT, a lack of punctuality diminishes the effectiveness of transfers, potentially impacting the efficiency of the entire system.
Ensuring punctuality in trips, including transfers, is essential to the convenience of public transit usage, significantly affecting passenger wait times and level of service. The current DRT system’s variability in travel time creates challenges in coordinating transfers. When passengers use an access mode to transfer to another mode, uncertainty in the arrival time at the transfer point can cause them to depart earlier, increasing the transfer waiting time. It is necessary to establish strategies to mitigate arrival-time uncertainties and reduce waiting times during transfers.
This study aims to address this by applying a robust optimization that considers punctuality to reduce uncertainties in arrival times. Through this approach, DRT can maintain reliable operations despite timing uncertainties, thus minimizing transfer waiting times. Robust optimization allows for route planning that adapts to varying travel speeds, effectively reducing waiting times for users within the transfer network.
The primary objective of this study is to develop an optimization model for implementing connected DRT with a focus on minimizing user costs and operator costs while ensuring punctuality. Daganzo proposed an optimization model for implementing a many-to-many DRT system that minimizes the combined user and operator costs. However, overemphasis on service quality for users can excessively burden operators [
8]. This study seeks to present an optimization approach that balances user and operator costs. Specifically, by focusing on ensuring punctuality for middle-mile DRT in urban areas through robust optimization, this study aims to minimize transfer waiting times, thereby enhancing user convenience.
2. Literature Reviews
2.1. Development and Implementation of Operational Strategies for Demand Responsive Transit (DRT)
Research on DRT originated from the Pickup and Delivery Problem with Time Windows (PDPTW) [
9]. Initially studied for efficient freight transportation [
10] and for accommodating vulnerable groups [
11,
12], the early work on dial-a-ride systems was conducted by Wilson et al. (1971), with modeling studies for Demand Responsive Transit beginning with Flusberg and Wilson [
13]. Daganzo et al. developed a mathematical model for a many-to-one DRT route [
14], which was later expanded to a many-to-many DRT system model by Daganzo [
8]. This model aimed to minimize total costs, including user wait times and travel times. However, due to time and cost constraints in solving the model, a simplified version was proposed [
8]. Research on DRT resumed in the 2000s, primarily in a many-to-many form, focusing on areas with low demand or off-peak times. Traditional public transit is planned to handle general demand but lacks strategies for scenarios where demand spikes sharply [
15]. Consequently, DRT has gained renewed interest as a research focus.
Unlike the early dial-a-ride systems used for rural transport and social services, DRT’s utility in urban areas has also been recognized, with studies exploring its potential to mitigate issues such as road congestion and emissions caused by excessive private vehicle use in cities [
16]. Ma et al. evaluated DRT to reduce environmental costs in urban areas, designing it to operate with lower CO₂ emissions [
17]. Other studies have focused on DRT’s social impact by examining the shift from private cars to public transit rather than solely focusing on accessibility for vulnerable groups and underserved areas [
18,
19,
20].
Alongside standalone DRT implementation studies, there is research on integrating DRT with other transit modes to enhance effectiveness. These studies examine DRT as a feeder service to high-capacity public transit, forming part of broader public transit policies [
6,
21]. This integration aids accessibility in suburban areas and serves urban regions. Contrary to earlier studies suggesting limited urban DRT effectiveness, Calabrò argued that, in high-demand urban areas, implementing DRT as a feeder service linked to large-capacity transit, such as rail, can yield significant benefits [
3]. This study differentiated peak and off-peak periods, realistically incorporating variables such as average wait time and travel time. A multi-objective optimization model was developed, balancing user and operator costs, and experiments were conducted in a simulated network. Results indicated that fixed-route DRT alone was limited in high-demand areas, advocating instead for a feeder configuration to reduce operator costs.
Similarly, Costa analyzed DRT’s potential as a feeder service to rail transit, applying the model to São Paulo, Brazil, with the aim of addressing first-mile/last-mile challenges for rail passengers. The study assessed the impacts of operating characteristics on user service levels, vehicle fleet size, and travel distance. Findings suggested that DRT, when used as a feeder service, could complement existing bus routes and encourage mode shift from other modes [
22,
23].
For feeder-type DRT, seamless integration with other modes of transportation is crucial, and minimizing transfer travel time is essential for the level of service. In this context, ensuring the reliability of punctuality for the modes is of significant importance. Carl designed a mathematical model for Integrated Dial-a-Ride, a type of DRT connected with conventional public transportation [
24]. This study focused on route planning for DRT, including transfers with fixed-route public transportation, by optimizing transfers through an objective function that minimizes costs using OD data that accounts for transfer trip costs. Similarly, Xia (2024) conducted research on timetabling and scheduling to integrate modular vehicles (MV), an emerging mode of future transportation, with existing public transportation systems [
25]. This study proposed a context of distributional robust optimization for MV, incorporating the cost of passenger waiting time during transfers. By applying this context to Beijing’s network and comparing it with the current scheduling system, a 6% reduction in operating costs was observed. This approach demonstrated a method to improve punctuality by minimizing transfer waiting times, unlike traditional timetables.
Effective DRT implementation requires well-planned operational strategies, as inadequate strategies can lead to significant operating deficits [
26,
27]. Critical operational strategies identified include optimal vehicle size, fleet dispatching, and vehicle detour rates, without which uniform operation plans can exacerbate inefficiencies. Various studies have noted that DRT’s efficiency improves considerably with effective operational planning. However, there remains a lack of focus on operational strategies in existing research, posing challenges for practical implementation [
28,
29].
Research on DRT initially began as a welfare-oriented study of Dial-a-Ride services under the American Disability Act (ADA). Over time, these studies have evolved to focus on enhancing the utility of DRT, primarily examining its implementation in suburban areas. Subsequently, research on urban DRT gained momentum.
The concept of the model proposed in the present study differs from previous contributions in several aspects. First, it emphasizes the integration of DRT within urban contexts, focusing on connections with existing transportation modes. This approach considers users’ mode choice in mixed-use scenarios, taking into account factors such as headway, travel time, and average waiting time of existing public transportation systems. Second, this study places greater emphasis on punctuality. While prior studies have aimed to minimize transfer times to facilitate connectivity, few have addressed the low reliability of travel times inherent to DRT operations. This study seeks to incorporate such characteristics, albeit imperfectly, into the model design.
In previous research, optimization functions have commonly incorporated constant commercial speeds. In contrast, our model accounts for the probabilistic variability of link travel times during DRT operations. Using robust optimization, the model ensures that DRT can reliably arrive at stations on time across various scenarios, addressing the critical issue of punctuality in DRT systems.
2.2. Heuristic Algorithms
To solve optimization functions in route planning, mathematical and heuristic methodologies are commonly employed. Historically, heuristic methods have been widely used in designing public transit networks due to the high complexity and time-consuming nature of multi-objective optimization problems in transit planning, making conventional mathematical solutions ineffective [
30]. As Newell noted, selecting an optimal route in such complex problems involves an astronomically large combination of possibilities [
31]. Various heuristic methodologies have been developed to approach these optimization models, with notable examples including genetic algorithms (GAs), Simulated Annealing, Tabu Search, and Ant Colony Optimization (ACO).
Research has been conducted in Nanjing, China, on integrating feeder DRT with railway hubs. This study utilized a genetic algorithm (GA) to solve the vehicle routing problem, which is a mixed-integer problem. Additionally, the study proposed a hybrid approach combining the genetic algorithm with an exact algorithm, referred to as GA-EA. The results analyzed a two-phase DRT routing system consisting of a static phase and a dynamic phase [
4].
In another study conducted in Fuzhou City, research focused on resolving the last-mile connection to the central business district (CBD) through DRT within regions that included rail transit stations. Unlike the previous study, this research employed an Ant Colony Optimization (ACO) algorithm to establish a bus scheduling strategy. This approach also developed a carpooling station planning model, which successfully addressed the problem of determining the locations of 25 carpooling stations and formulating 22 DRT bus schedules connecting these stations with four rail transit stations [
32].
Genetic algorithms, first introduced by Holland, are inspired by biological evolution and Darwin’s theory of natural selection, making them an evolutionary computation method. A GA has the advantage of exploring a broad solution space and is highly scalable for large-scale optimization problems [
33]. Due to these strengths, GAs have been extensively used in route planning research, and this study will also utilize a GA for its optimization model [
34,
35,
36].
Additionally, most studies have analyzed DRT assuming fixed vehicle travel speeds. For DRT intended to connect with other modes, punctuality is critical, and maintaining it in congested conditions is essential. Robust optimization, an approach that accounts for uncertainties, enables the development of optimization models that can sustain performance even in unexpected situations. In transportation planning, robust optimization is often used in network design, route selection, and scheduling. To ensure punctuality in DRT services despite uncertain traffic conditions, Molenbrunch proposed an operational strategy using a robust optimization model to minimize service delays [
37]. Similarly, Stiglic applied robust optimization to optimize passenger pickup and drop-off times within uncertain traffic flows [
38]. As Ho argued, using robust optimization can effectively reduce passenger wait times and improve operational efficiency even under variable travel speeds [
39].
3. Optimization Model Development and Validation
To implement DRT effectively, it is essential to consider the various environmental and conditional changes that impact its operation. However, most research has focused solely on the introduction of DRT systems, overlooking the development of operational strategies, which is crucial for successful implementation, as evidenced in domestic case studies in South Korea. User costs and operator costs are interdependent; when operator costs increase, the quality of service for users declines, leading to higher user costs. This indicates that operational strategies play a critical role in service quality, yet research in this area remains insufficient.
To address these limitations in existing studies, this research aims to establish efficient operational strategies for DRT that account for the influencing conditions and contexts. To achieve this, the authors have employed a multi-objective optimization model as the objective function, incorporating user costs, operator costs, and the processing costs of non-service passengers. Additionally, to ensure the effectiveness of linked DRT, the authors have designed routes that maintain punctuality within variable travel speeds. To further analyze the model’s responsiveness across different environments, a sensitivity analysis has been conducted on factors such as the number of passengers, vehicle capacity, fleet size, and maximum detour rate.
3.1. Development of Multi-Objective Optimization DRT Model
The model used in this study is a multi-objective optimization function aimed at minimizing the combined operation and user costs. Most previous studies have similarly employed a hybrid approach, analyzing a combination of operation and user costs, and this study also sets its objective function to minimize the sum of these two components. However, unlike most previous research, this study’s objective function focuses on minimizing travel costs within the network (Equation (1)). Consequently, user costs are composed of the costs for passengers using DRT within the network as well as the costs incurred by those who cannot use DRT and must rely on alternative modes of transport. This approach was chosen to evaluate the impact of DRT implementation in a multi-modal environment, where existing transportation modes are available, rather than assessing the effects of DRT in isolation.
Operational costs, denoted as F1, include both fixed and variable costs incurred during DRT operations. Fixed costs consist of vehicle acquisition costs based on vehicle size, labor, vehicle depreciation, maintenance, and DRT platform operation costs, while variable costs primarily consist of fuel expenses (Equation (2)). User costs, denoted as F2, encompass the passenger waiting time cost, the travel time cost from boarding to alighting, and the transfer waiting time cost for transferring to trunk lines, making up the total travel time cost. This is calculated as the combined user costs for both DRT passengers and passengers using existing modes (Equation (3)).
The DRT optimization model is subject to constraints on vehicle capacity, maximum travel time, and maximum detour rate. Given the flexible routing nature of DRT, unexpected detours can increase arrival time uncertainties, complicating punctuality for transfers. Additionally, a high detour rate can degrade the level of service provided by DRT, thus justifying its inclusion as a constraint [
40]. The maximum travel time constraint ensures that linked DRT operates in alignment with the headways of other modes, thereby enhancing transfer convenience. Therefore, this study designs a multi-objective optimization model aimed at minimizing the sum of operator costs, waiting time costs, and travel time costs as components of user costs.
Equation (4a) imposes a decision restriction where each vehicle k must reach the terminal d and can only arrive at the terminal once, preventing repeated returns to the endpoint. Equation (4b) applies to passengers, ensuring that each passenger m boards at exactly one station i. Equation (4c) pertains to vehicle capacity, ensuring that the onboard number of passengers does not exceed vehicle capacity. Equation (4d) addresses travel time, while Equation (4e) accounts for travel speed variability. Due to the punctuality requirement for linked DRT, the model incorporates this constraint to design routes that meet total travel time requirements even with variable travel speeds. Specifically, the constraint models a situation where speeds are maintained at the scheduled rate 80% of the time, but congestion results in lower speeds 20% of the time.
Equation (4f) ensures that total travel time meets punctuality requirements under variable scheduled speeds. Total travel time consists of the travel time between stops and the service time at each stop. Given the study’s focus on integration with rail services, this constraint is designed to synchronize with rail departure times. Equation (4g) represents a hard time-window requirement, where the passenger’s arrival time at a stop must precede the vehicle’s arrival at that stop. The hard time window is a strict time constraint, meaning that if the vehicle does not arrive within the passenger’s specified time window, the passenger cannot board. Equation (4h) specifies vehicle arrival times, while Equation (4i) addresses detour time, defined as the difference between the shortest time to the passenger’s destination and the actual arrival time, which cannot exceed a maximum detour limit.
The proposed model represents a multi-objective optimization problem with mixed decision variables, making it a Nondeterministic Polynomial-time hard (NP-hard) problem that complicates the search for an exact global solution [
41]. As many studies on NP-hard problems have used heuristic methodologies, this study similarly employs a genetic algorithm, a type of heuristic approach.
Genetic algorithms are iterative experimental methodologies aimed at improving optimal solutions. The individuals in the initial generation’s population consist of a set of randomly ordered genes, where a gene represents a passenger, and the collection of genes is referred to as an individual. The genes are input sequentially in random order to generate routes based on the sequences of these genes. Among the generated routes, those that satisfy the constraints are grouped as the solution set.
At this stage, constraints are verified for all genes within the individual. For instance, if the structure of an individual is [
1,
5,
9], and [
1] satisfies the constraints while [
1,
5] violates them, the algorithm proceeds to check the constraints for [
1,
9]. This process continues until the last gene in the individual has been checked, and the total cost of the individuals that pass the constraints is calculated.
The individual with the lowest calculated cost is selected as the optimal solution within the solution set. The genetic algorithm then refines this solution through improvement processes, ultimately determining the optimal solution.
3.2. Experimental Design
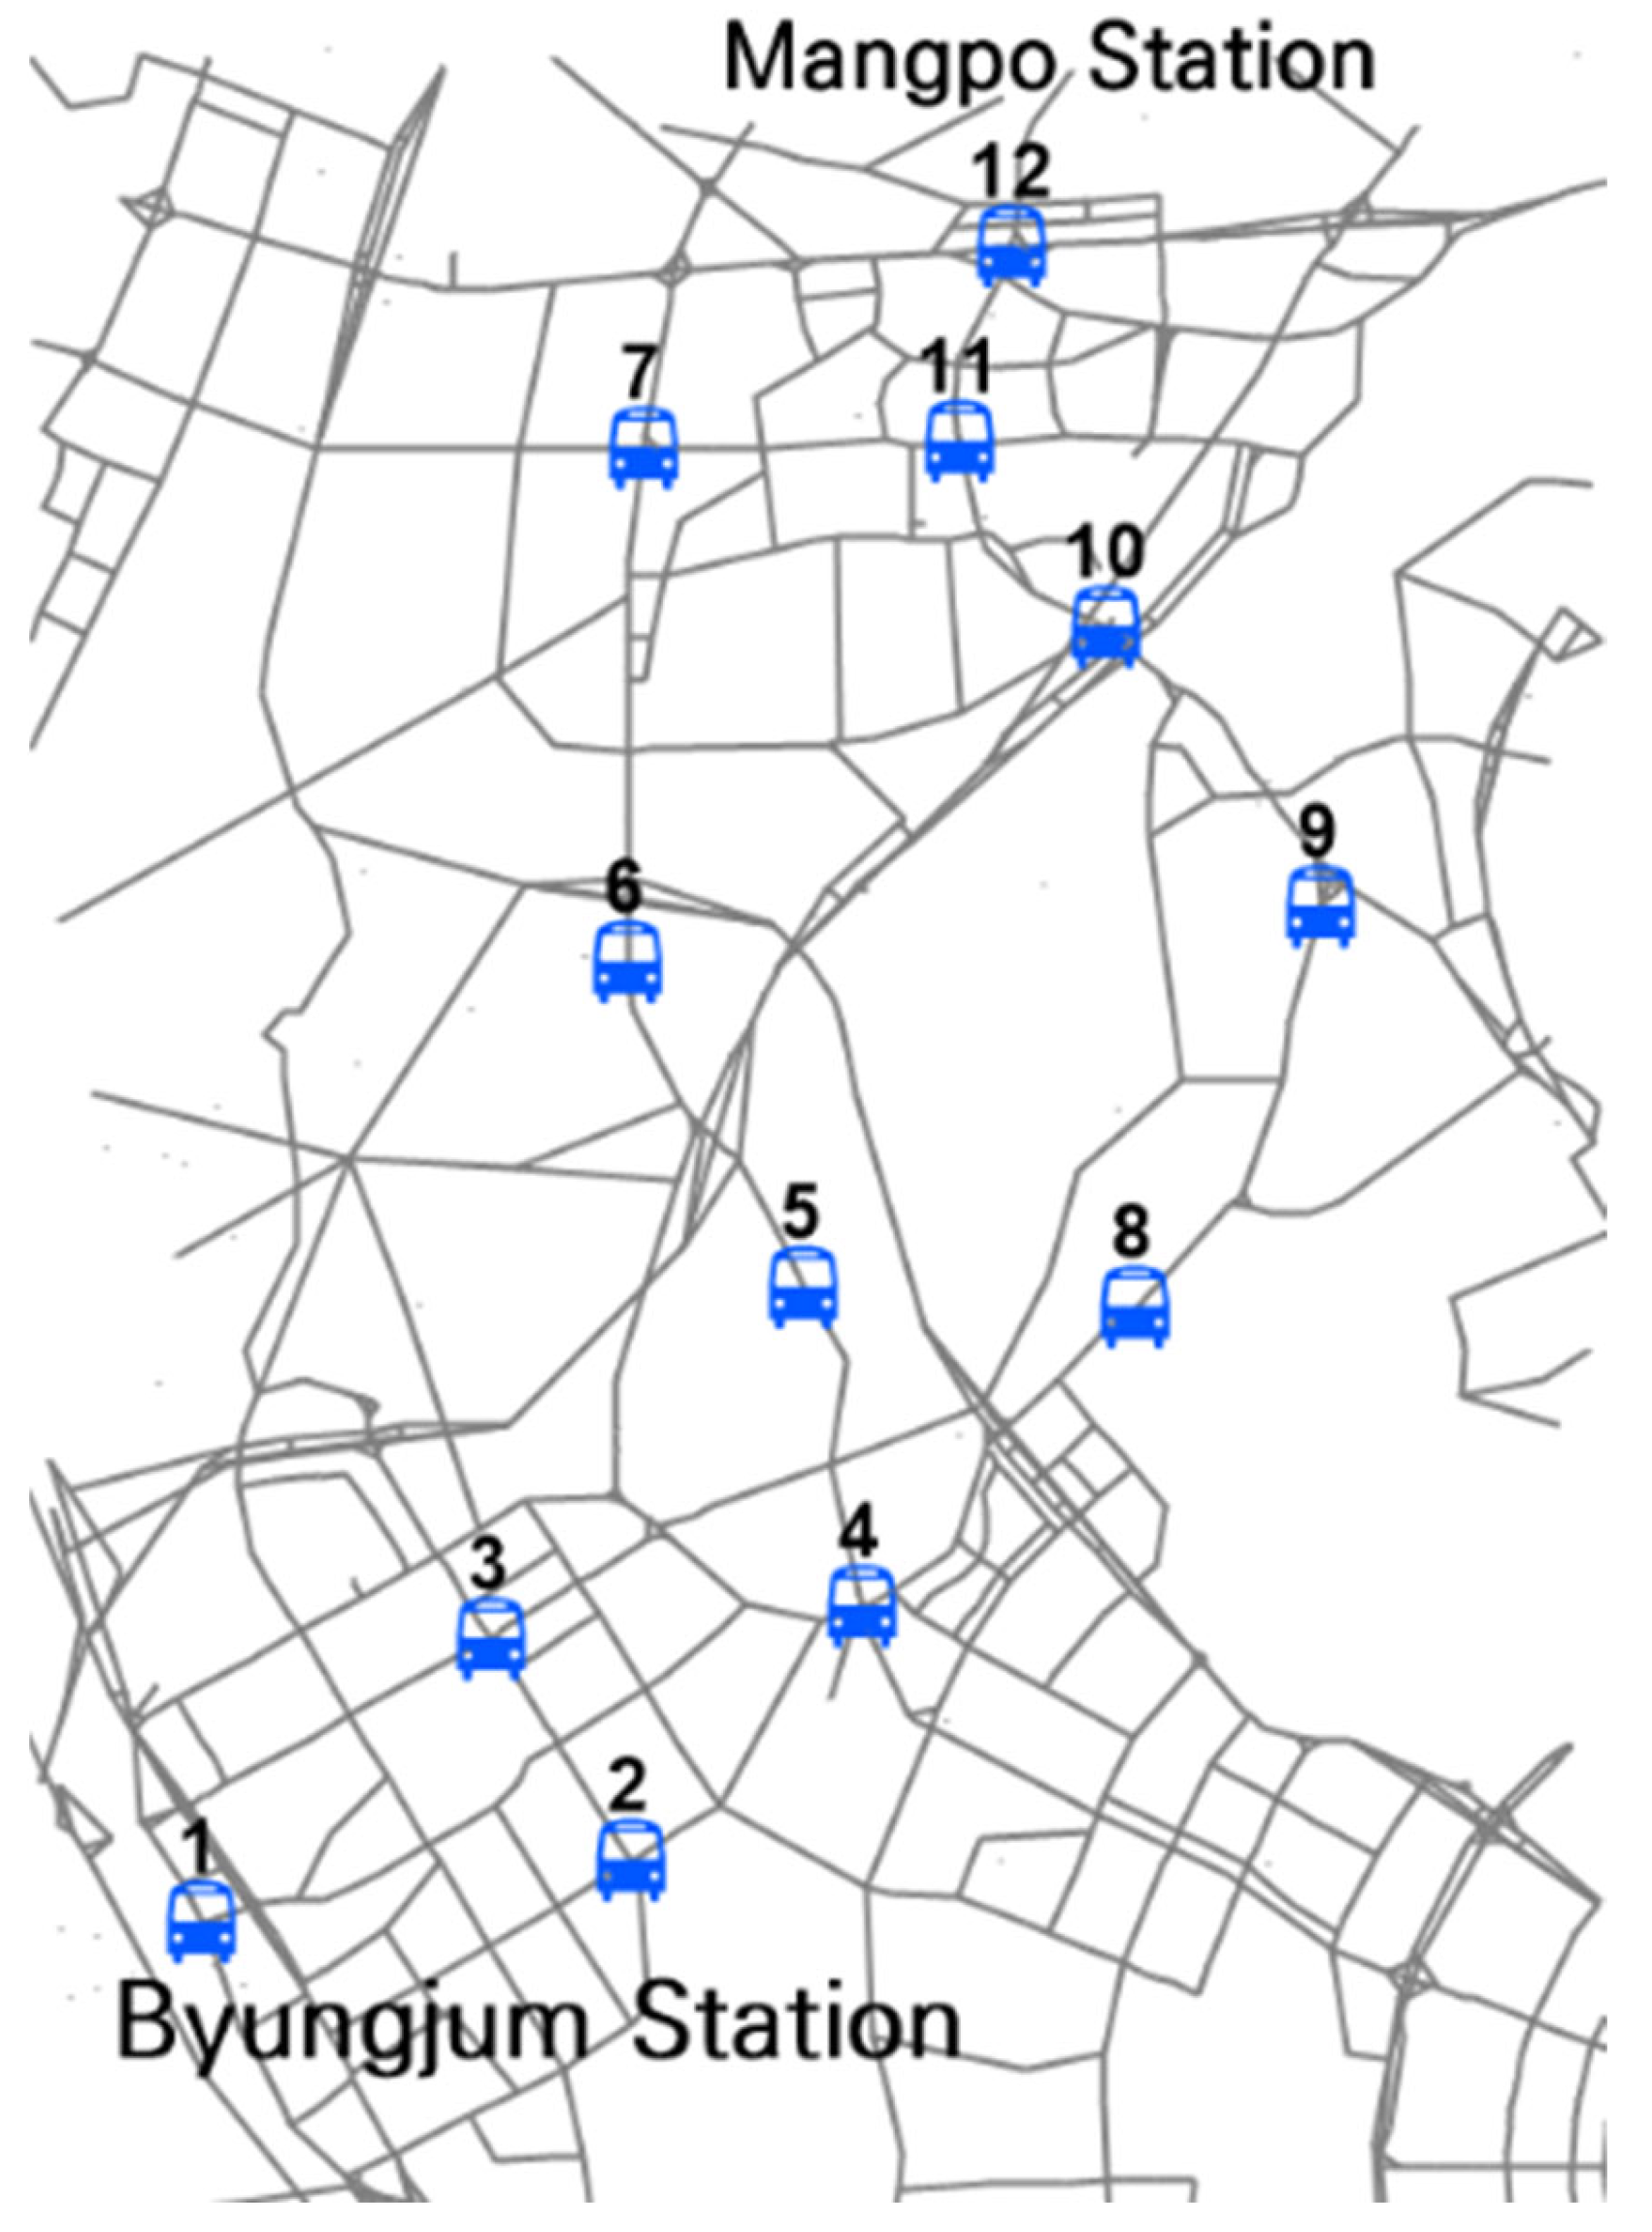
This chapter describes the experimental area where the designed algorithm was applied, as well as the assumptions made to ensure smooth testing. The experimental area is Hwaseong, Gyeonggi Province, South Korea, which contains two urban rail stations. Although there are 67 nearby bus routes passing through the area, the roads where bus stops are located are limited to two lanes, creating a narrow transit environment. Additionally, while the two rail stations serve approximately 30,000 daily passengers, only four bus routes connect these stations. These conditions indicate a lack of transit options between the subway stations, making this area suitable for experimentation. The number of DRT-accessible stops in the network was reduced from the actual number using K-means clustering, resulting in a total of 12 selected stops (
Figure 1).
To evaluate the impact of linked DRT implementation, Origin–Destination (OD) data were constructed using actual bus payment card data for analysis. The dataset includes one-minute interval OD data for passengers boarding within the experimental area and alighting at the rail stations. A minimum walking and transfer wait time of 3 min was set for passengers after alighting, based on the distance from the DRT drop-off point to the station platform (200 m) and an average walking speed of 1.2 m/s, which aligns with Level D service standards for rail stations [
42]. The boarding time for passengers was set at 3 s for door operation plus 3.2 s per passenger for boarding and alighting. The standard travel speed for vehicles was set at 20 km/h, with additional variability to reflect road congestion. Vehicles were assumed to travel at standard speed 80% of the time, with 20% of trips occurring at lower speeds. For these slower trips, a 70% probability was assigned to 90% of standard speed and a 30% probability to 80% of standard speed. The operation period was limited to the morning peak hour from 07:00 am to 08:00 am, with dispatch intervals of 10 min.
3.3. Selection Process and Analysis for Essential Factors in DRT Implementation
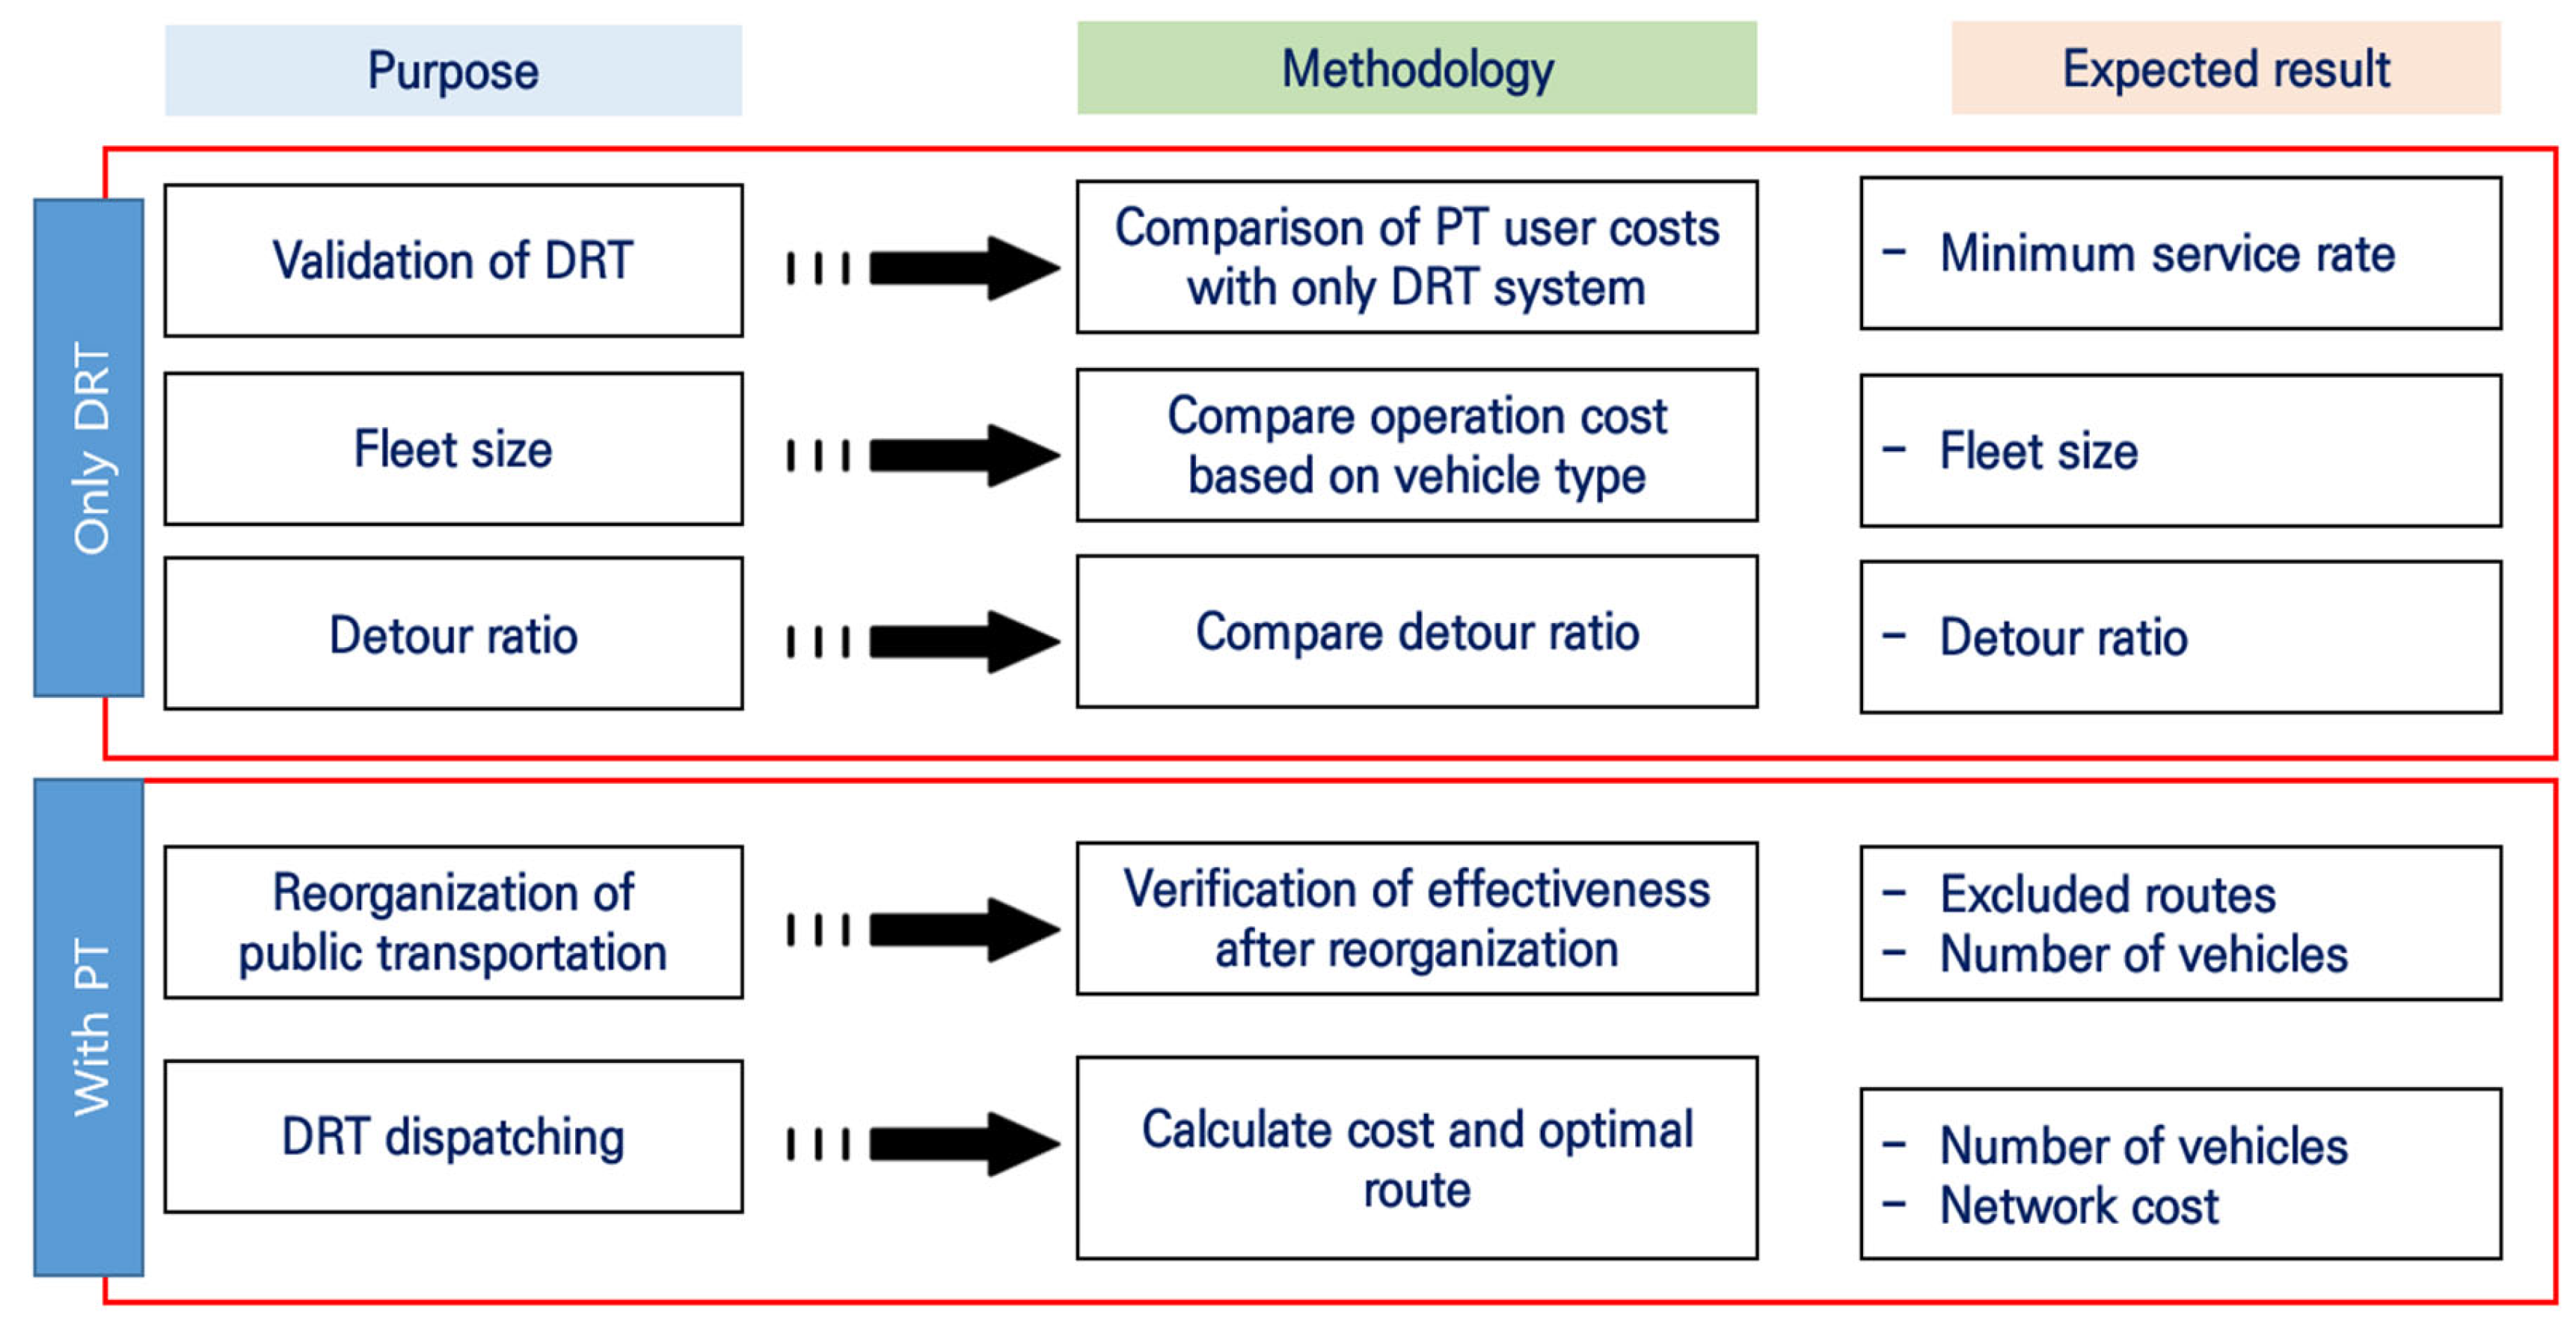
This section describes the selection process for essential factors in implementing DRT, as illustrated in
Figure 2. To optimize DRT implementation, the main operational factors are sequentially assessed, and optimal values are calculated at each step. These values are then applied to subsequent steps to derive the optimal values for all factors.
3.3.1. Step 1. Validation of DRT
First, the authors evaluated the justification for implementing linked DRT by comparing user costs within the existing public transit system with those in an environment lacking such a system. This analysis aimed to determine the feasibility of DRT implementation by distinguishing the minimum service ratio for DRT. The analysis was conducted with minimum service rates set at 100%, 90%, and 80%. Passengers unable to board DRT were assumed to use taxis to reach their destinations. This approach allowed for assessing DRT’s viability even in an unrealistic scenario with only DRT and taxis in the network. Additionally, as shown in the literature review in [
36], providing services to all passengers may increase overall costs, and this study seeks to identify the minimum service rate that minimizes network costs.
3.3.2. Step 2. Calculating Fleet Size
In this step, DRT vehicle capacity was analyzed with distinctions between 20-seat and 40-seat vehicles. The prior analysis used 20-seat DRT vehicles, and here, the introduction of 40-seat vehicles allows for evaluating changes in user and operator costs, thus determining the optimal vehicle size. Differences in required fleet size and total passenger boarding and alighting times, based on vehicle capacity, were also assessed to understand their impact on optimization outcomes.
3.3.3. Step 3. Calculating Detour Ratio
Some studies have identified the maximum detour ratio as a critical metric for DRT [
7,
43]. Detour ratios are important in route planning for public transit, as increased route curvature can lead to longer travel times and reduced punctuality [
44]. However, most studies have not addressed maximum detour ratios in detail. The mean detour ratio of the buses in the experimental area is about 1.53, and the maximum detour ratio is about 1.8. In this study, the authors examine changes in service level and cost under maximum detour ratios of 1.2, 1.4, and 1.6.
3.3.4. Step 4. Reorganization of Public Transportation
When introducing a new mode of transit, it is essential to assess its effectiveness within the existing public transit system. Accordingly, the authors examined the impact of DRT implementation following a reorganization of existing transit routes under three conditions: (1) excluding routes with high detour ratios within the experimental area, (2) excluding routes with long headways, and (3) excluding routes covering most of the experimental area that would compete with DRT. Decision variables for this analysis were based on prior results. In this analysis, passengers could choose between the existing route system and DRT based on total travel time, which includes waiting time, in-vehicle time, and transfer waiting time. Passengers who do not board DRT are considered no-show passengers, preventing new DRT route planning based on their absence. To accurately determine DRT schedules and ridership, repeated trip assignments would be necessary. However, this process, being part of traffic demand analysis, is excluded from this study. The purpose of this step is to verify whether DRT can replace the existing public transportation system.
3.3.5. Step 5. DRT Dispatching
Increasing the number of deployed vehicles improves user service levels but also increases operator deficits. To determine an efficient fleet size, the authors tested various scenarios by deploying 2 to 5 vehicles per dispatch to identify the most efficient fleet size. In the process of using a genetic algorithm, there are many sets of routes. In the process of calculating the optimal route using the genetic algorithm, a set of routes is calculated. Among these, the values within the set are based on the maximum and minimum number of routes.
4. Summary
The experiment was conducted through several sequential procedures, with each step calculating and selecting the optimal values for key variables in DRT operation. In each step, the optimal value identified in the previous stage was fixed for use in the next stage. The objective function used in this study aims to minimize the total network cost, so in each step, the variable with the lowest cost was selected as the optimal value.
For example, as shown in
Table 1, in Step 1, when the service rates were set at 70%, 80%, 90%, and 100%, each yielded different costs. From a cost optimization perspective, 80% was found to be the minimum cost, and thus, 80% was selected as an optimal service rate. In Step 2, the previously selected 80% minimum service rate was used to determine the optimal vehicle capacity.
As a result, the following optimal variable values were established: (1) minimum service rate of 80%, (2) 20-passenger vehicle capacity, (3) maximum detour ratio of 1.2, (4) exclusion of routes with high detour ratios, routes with headways of 60 min or more, and routes covering most of the experimental area, and (5) operation of 2 vehicles per time interval. The cost results calculated from each optimization model are presented in
Figure 3 and
Table 1.
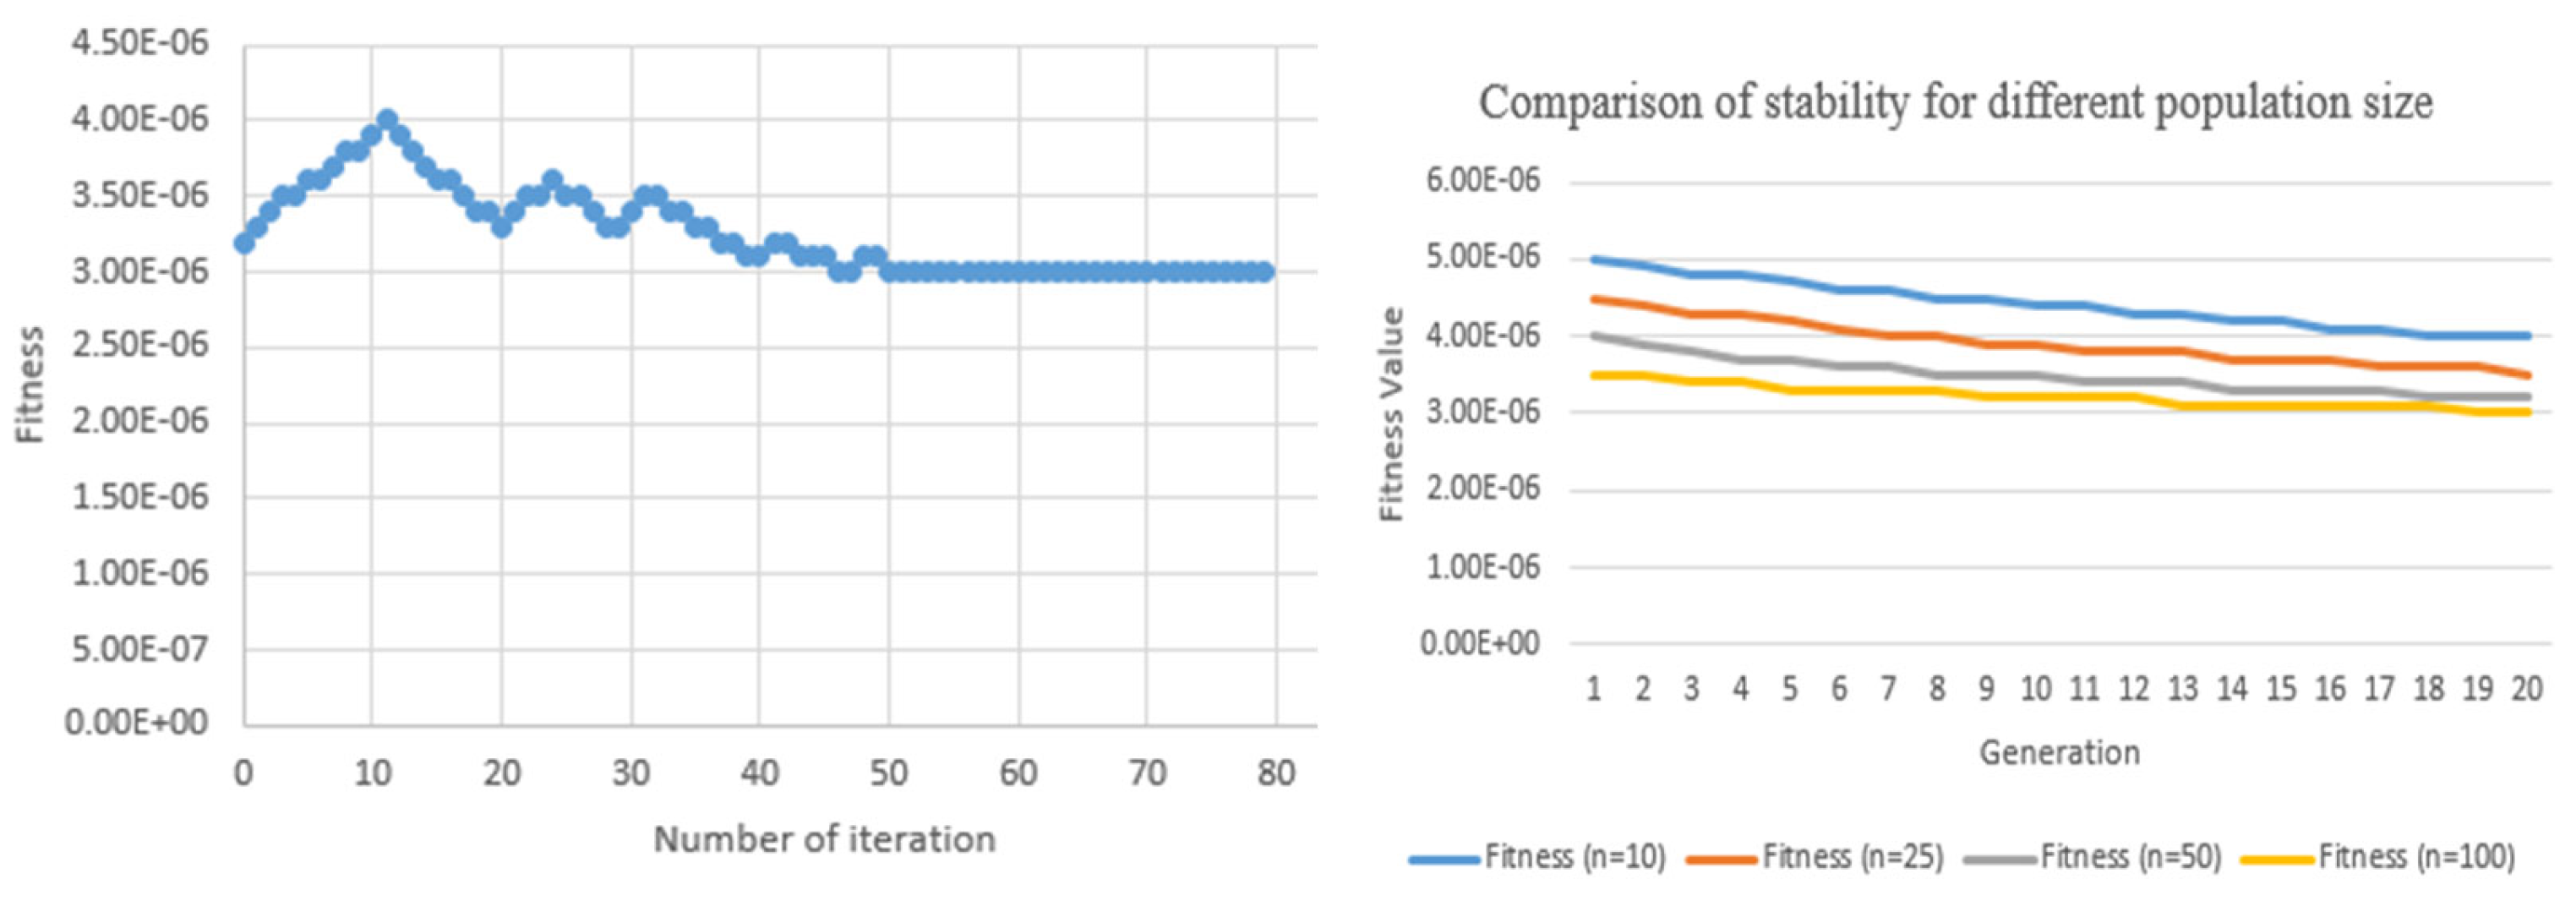
The parameters used for the genetic algorithm in deriving the optimal solution were as follows: population size,
n = 100; iteration number,
i = 50; crossover probability
Pc = 0.3; and mutation probability
Pm = 0.05. The proposed optimization function was implemented in Python 3.11. The computing environment included 32 GB of memory and an AMD Ryzen 7 Pro 4750G 3.6 GHz CPU, with a total solution time of approximately 321.5 s. The parameter of the genetic algorithm is set by iterative simulation for stability (
Figure 4)
To assess the impact of DRT implementation with punctuality constraints on reducing waiting times, additional analysis was conducted on changes in vehicle waiting times and transfer waiting times. This allowed for comparison among the existing public transit system, DRT with punctuality constraints, and DRT without punctuality constraints. The average vehicle waiting time decreased when punctuality constraints were not applied; however, transfer waiting time increased significantly. This is likely due to the ability to design cost-efficient routes without constraints, reducing average waiting time. Additionally, when punctuality is not maintained, passengers may miss their train connections, leading to increased transfer waiting times. Implementing DRT with punctuality constraints resulted in a 14% and 36% reduction in total travel time compared to the existing subway and bus systems, respectively (
Table 2)
5. Discussion
Through DRT, it was determined that achieving an 80% service rate is the most cost-effective, rather than aiming to serve all passengers. A higher service rate requires vehicles to take detours to pick up additional passengers, leading to increased travel time for onboard passengers and higher operational costs. Conversely, a service rate that is too low increases the cost of serving non-DRT passengers, resulting in a higher total network cost. In Step 1, passengers who could not board DRT were assumed to take taxis to their destinations. The analysis showed that a minimum service rate of 80% resulted in the lowest total network cost when these taxi costs were included.
The results of Step 2 indicated that operating a fleet of 20-passenger vehicles was more effective. Although 40-passenger vehicles were considered, the 20-passenger option was found to be more efficient due to the detours required and lower re-boarding rates associated with larger vehicles. Even with peak-hour demand, larger vehicles similar in size to those in the existing public transit system were unnecessary. Limiting the maximum detour ratio to 1.2 was found to be the most cost-effective, aligning with findings by Kim, which showed that a higher detour ratio affects user cost reduction [
40]. Notably, this limit was effective in reducing transfer wait times for intermodal transfers. However, while the maximum detour ratio should also consider policy perspectives, this study focused on cost efficiency as the basis for its selection.
The analysis was conducted assuming standalone DRT operation, allowing for the identification of optimal variable values for DRT. Based on these values, strategies were explored for implementing DRT effectively within a real-world network with existing public transit. When analyzed without reorganizing the existing routes, DRT operation was found to be more effective than standalone operation. From a system perspective, implementing DRT had approximately 8% higher utility compared to introducing a new fixed route, similar to the findings of Calabrò [
3] that fixed routes and standalone DRT have limitations during peak demand periods. Currie and Fournier pointed out that high per-passenger costs contributed to DRT failures, which could be mitigated through concurrent operation with the existing transit network [
41]. However, as noted by Calabrò [
3], the effectiveness of DRT and fixed routes may vary based on environmental factors.
Adding new transit modes to the existing network improves user service levels, but it does not necessarily optimize the network. Therefore, a reorganization of the existing bus system was conducted in three stages to enhance network efficiency: (1) excluding bus routes with high detour ratios within the experimental area, (2) excluding routes with headways longer than 60 min, and (3) excluding routes that largely overlap with the experimental area and compete with DRT. Even after removing approximately 50% of the bus routes across these stages, user costs only increased by about 12%. This demonstrated the effectiveness of DRT implementation, even with bus route reorganization.
Finally, cost optimization was conducted by adjusting the fleet size and analyzing the costs associated with deploying between 2 and 5 vehicles on each route. The results indicated that total costs decreased as the number of vehicles was reduced; however, user costs increased with a smaller fleet size. Despite this, the presence of the existing public transit system as an alternative to DRT meant that the increase in user costs did not outweigh the savings in operating costs.
6. Conclusions
Research on linked Demand Responsive Transit (DRT) involves complex mathematical problems that must account for each passenger’s time, vehicle routes and stop locations, capacity constraints, and punctuality under uncertain speeds. Additionally, policy considerations are essential for practical implementation. This study addresses these challenges by designing a robust multi-objective optimization function based on actual bus payment card data. The model follows a structured framework to solve the problem, aiding in the assessment of DRT implementation in real-world scenarios. Unlike previous studies that fixed travel speeds for optimization, this research incorporates variable travel speeds, ensuring that linked DRT routes maintain punctuality even when travel speeds decrease. This approach supports integration not only with train stations but also with other facilities requiring punctuality, enabling potential last-mile or first-mile solutions and broader applicability in different areas.
Unlike studies that end with model design, this research goes further, considering various factors for efficient operation and integrating operational and policy elements to optimize vehicle dispatching and route planning. The study also analyzes concurrent operation with existing public transit based on total travel time, demonstrating the value of the approach. By reflecting the travel behaviors of actual passengers and their mode choices, this research differs from previous studies. The proposed framework is expected to provide practitioners considering DRT implementation with a clear pathway for effective deployment.
The DRT implementation model includes numerous parameters and assumptions that can be adapted based on the network structure, travel behaviors, and existing public transit levels in the target area to improve outcomes. However, this study assumed that all passengers transfer, potentially leading to inflated cost estimates by including transfer waiting times even for non-transferring passengers. As a result, it was challenging to distinguish between transfer passengers and alighting passengers accurately. Additionally, while the model considers situations where passengers may choose conventional transit over DRT based on travel time, it does not account for route adjustments post-mode choice, which may lead to inaccuracies in determining the optimal fleet size. Future studies should incorporate iterative trip assignment processes, where route redesign occurs based on passenger mode choice, ultimately leading to a final optimized route design. Also, the variability of travel speeds could not be generalized beyond the specific probabilities applied. While the study defined the likelihood of reduced travel speeds using fixed probabilities and that probabilities were not exact, the reduced speed in each probability should be more accurate. Future research could expand upon this by incorporating dynamic variability in travel speeds across different time periods. This approach would allow for a more generalized and comprehensive representation of speed fluctuations, improving the model’s applicability to real-world conditions.
In this study, the optimal function was solved by applying the genetic algorithm. However, there are various heuristic methods that can solve np-hard, and there may be algorithms that show better performance. In future studies, a discussion should be made on the comparison between heuristic methods that can obtain better results.
Finally, this study does not explore policy elements from multiple perspectives. The analysis includes policy factors such as minimum service ratio, maximum detour ratio, and route restructuring criteria, which could influence route design based on service level expectations and decision-maker preferences. While this study focused solely on cost efficiency, future research should examine the selection process for these policy factors and compare outcomes from a policy-oriented perspective.


