

Towards Environmental Sustainability: An Input–Output Analysis to Measure Industry-Level Carbon Dioxide Emissions in Egypt


Abstract
1. Introduction
2. Research Context
2.1. Conceptual Framework
2.2. Empirical Literature
3. Materials and Methods
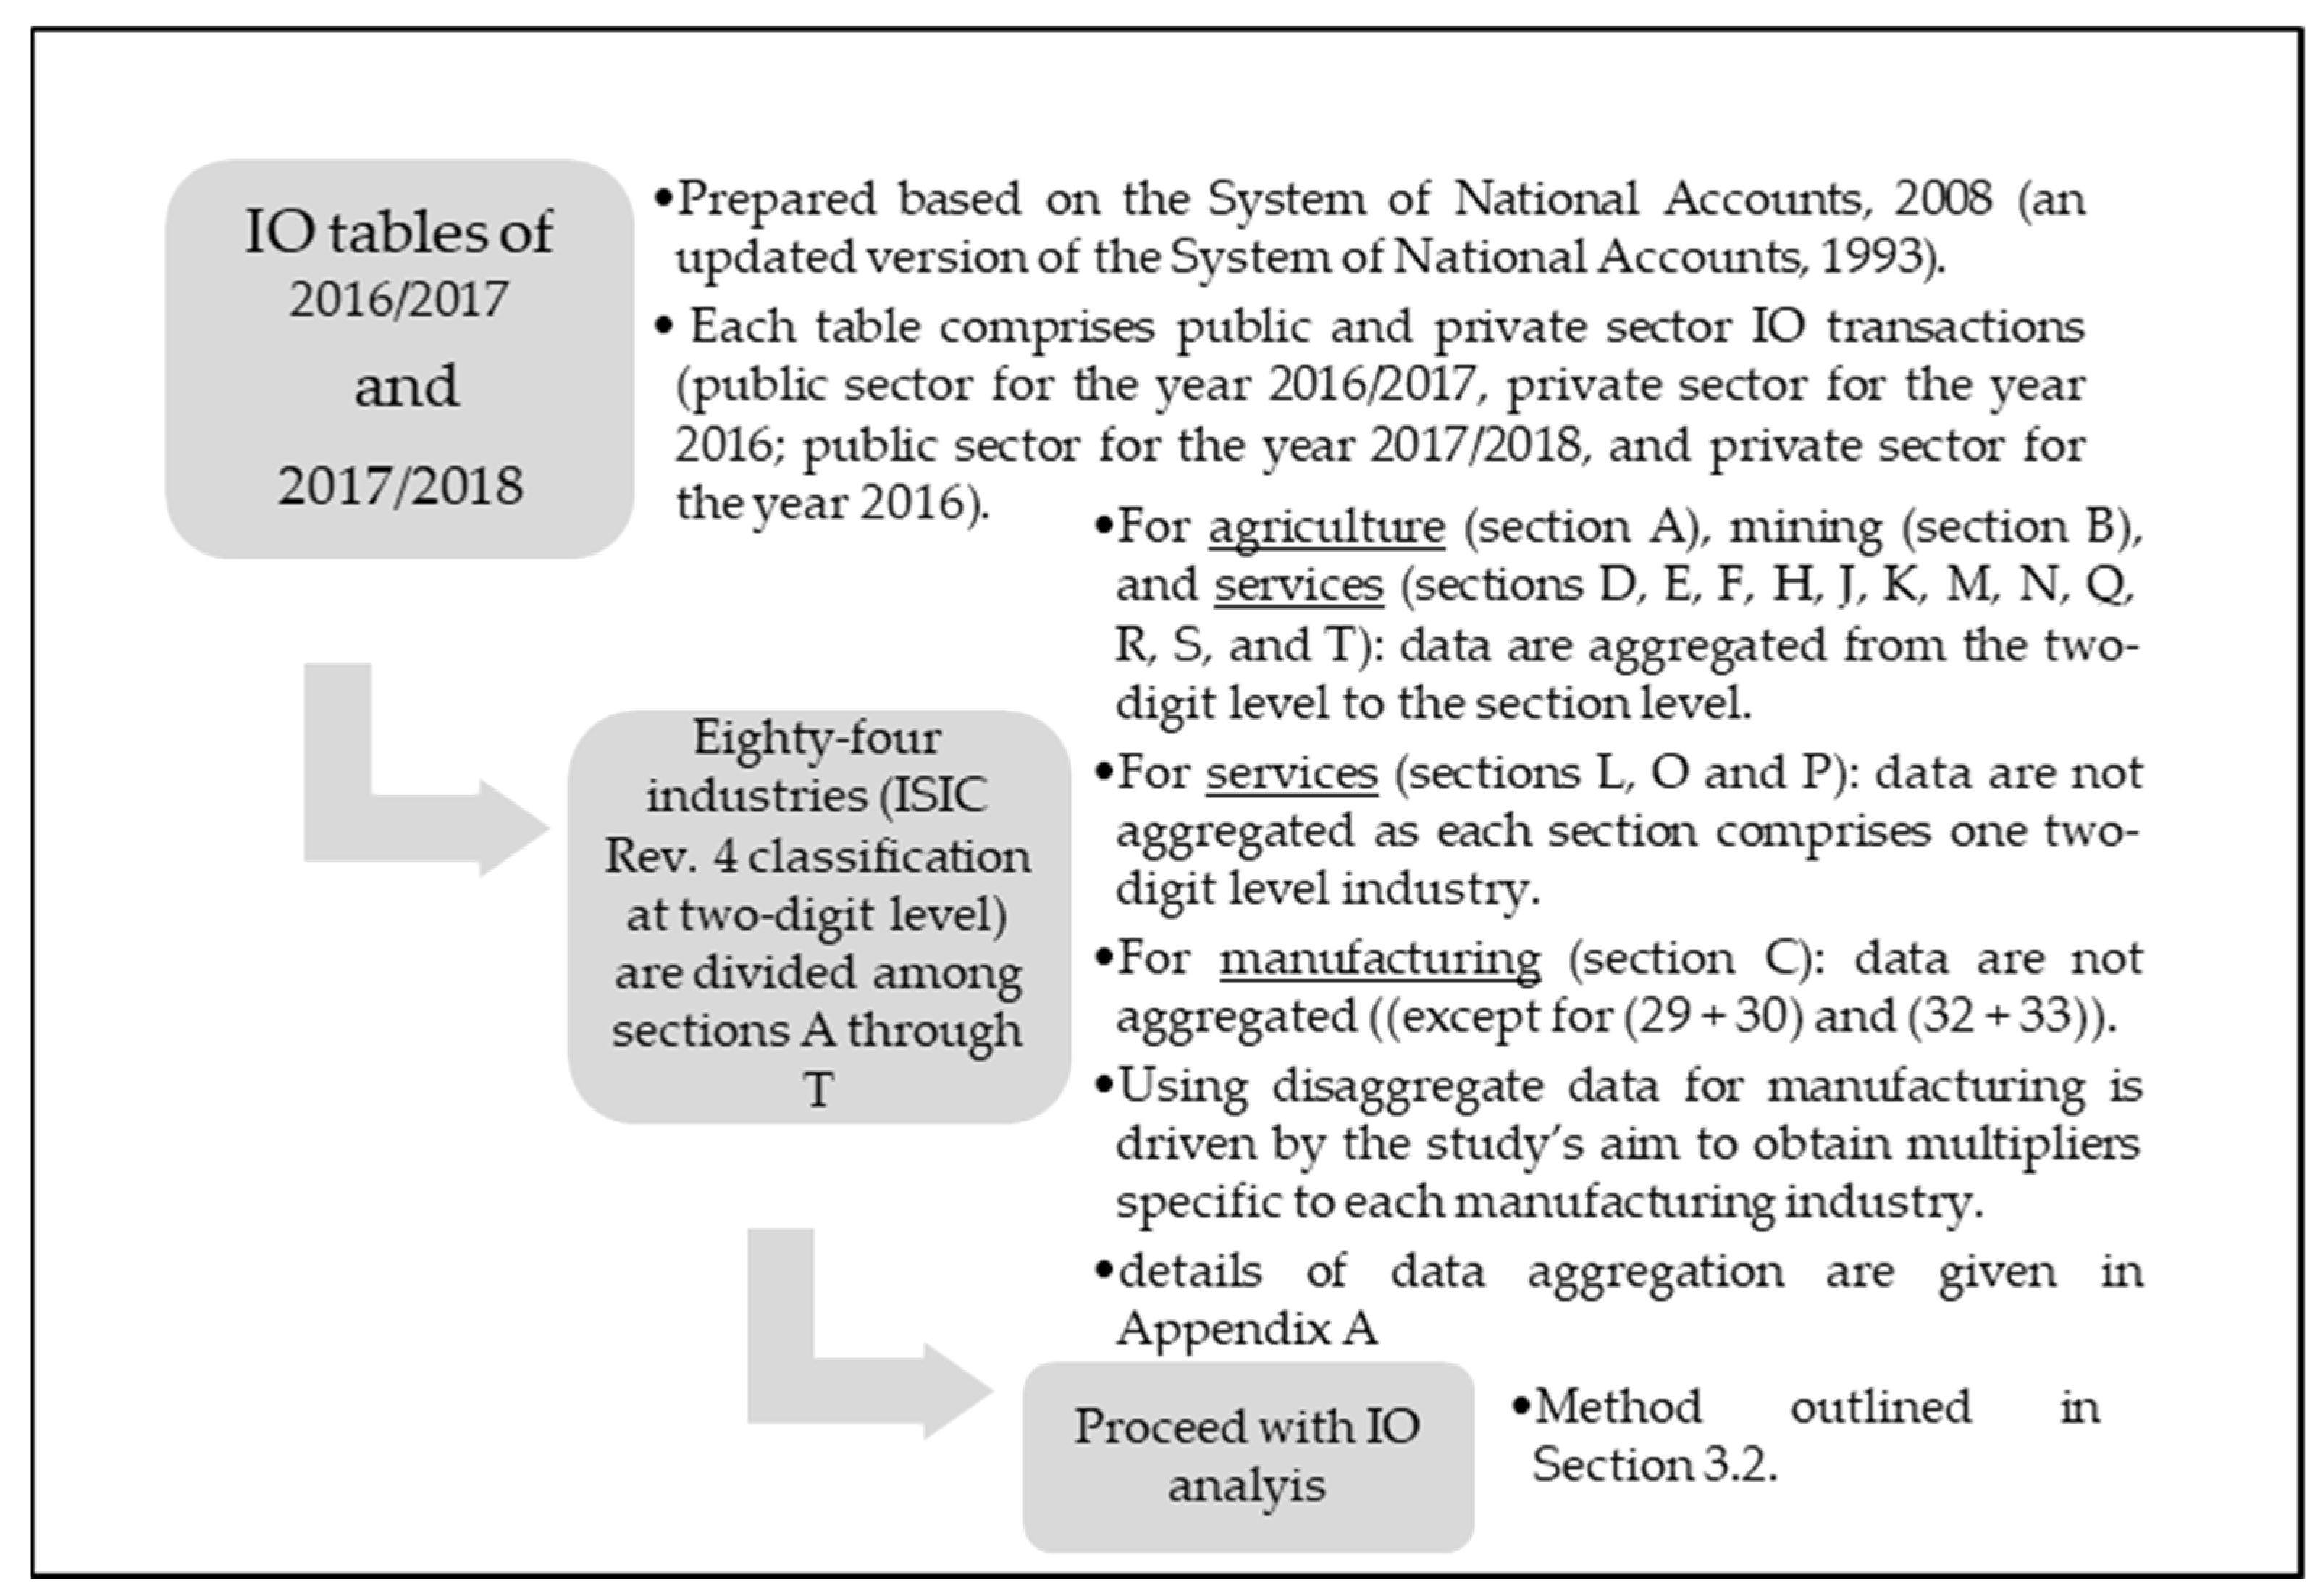
3.1. Data
3.2. Method
- Using data on the value of energy use by industry (in the form of oils; natural gas; coal; hydro; and biofuels) and the value of the industry’s final product, I obtain the ratio of energy use to the final product as a measure of energy intensity by industry.
- Using data for the nationwide energy use of Egypt in the two calendar years (2017 and 2018), I obtain a simple average to measure energy use for the fiscal year 2017/2018 (the year of the IO table).
- Energy use in Egypt comprises oil, natural gas, coal, hydro, and biofuels (measured in tetra joules). Accordingly, the share of each type of energy in total energy use is measured. This provides a measure of the energy mix for Egypt for 2017/2018: oil (37.8%); natural gas (54.5%); coal (2.7%); and hydro, biofuels, wind, and solar (5%).
- Using the standard tons of CO2 emitted per petajoule (PJ) of each type of energy, (73,300 tons of CO2/PJ from oil, 55,800 tons of CO2/PJ from natural gas, and 93,900 tons of CO2/PJ coal), I obtain the level of CO2 emitted from energy use with the given energy mix of Egypt (obtained in step 3). This is converted into millions of tons of CO2 per tetra joule (TJ).
- The levels of CO2 emitted from energy use (obtained in step 4) are multiplied by the energy intensity of each industry (obtained in step 1) to yield a measure of the direct level of CO2 emitted for that specific industry based on its energy intensity and the energy mix of Egypt with the associated CO2/TJ emissions.
- The calculated level of CO2 emitted by industry (obtained in 5) is multiplied by the output multiplier calculated for each industry “j” (OMj) to yield a measure of the direct and indirect levels of CO2 emitted for industry “j” (i.e., total emissions for industry “j”).
4. Results
5. Discussion
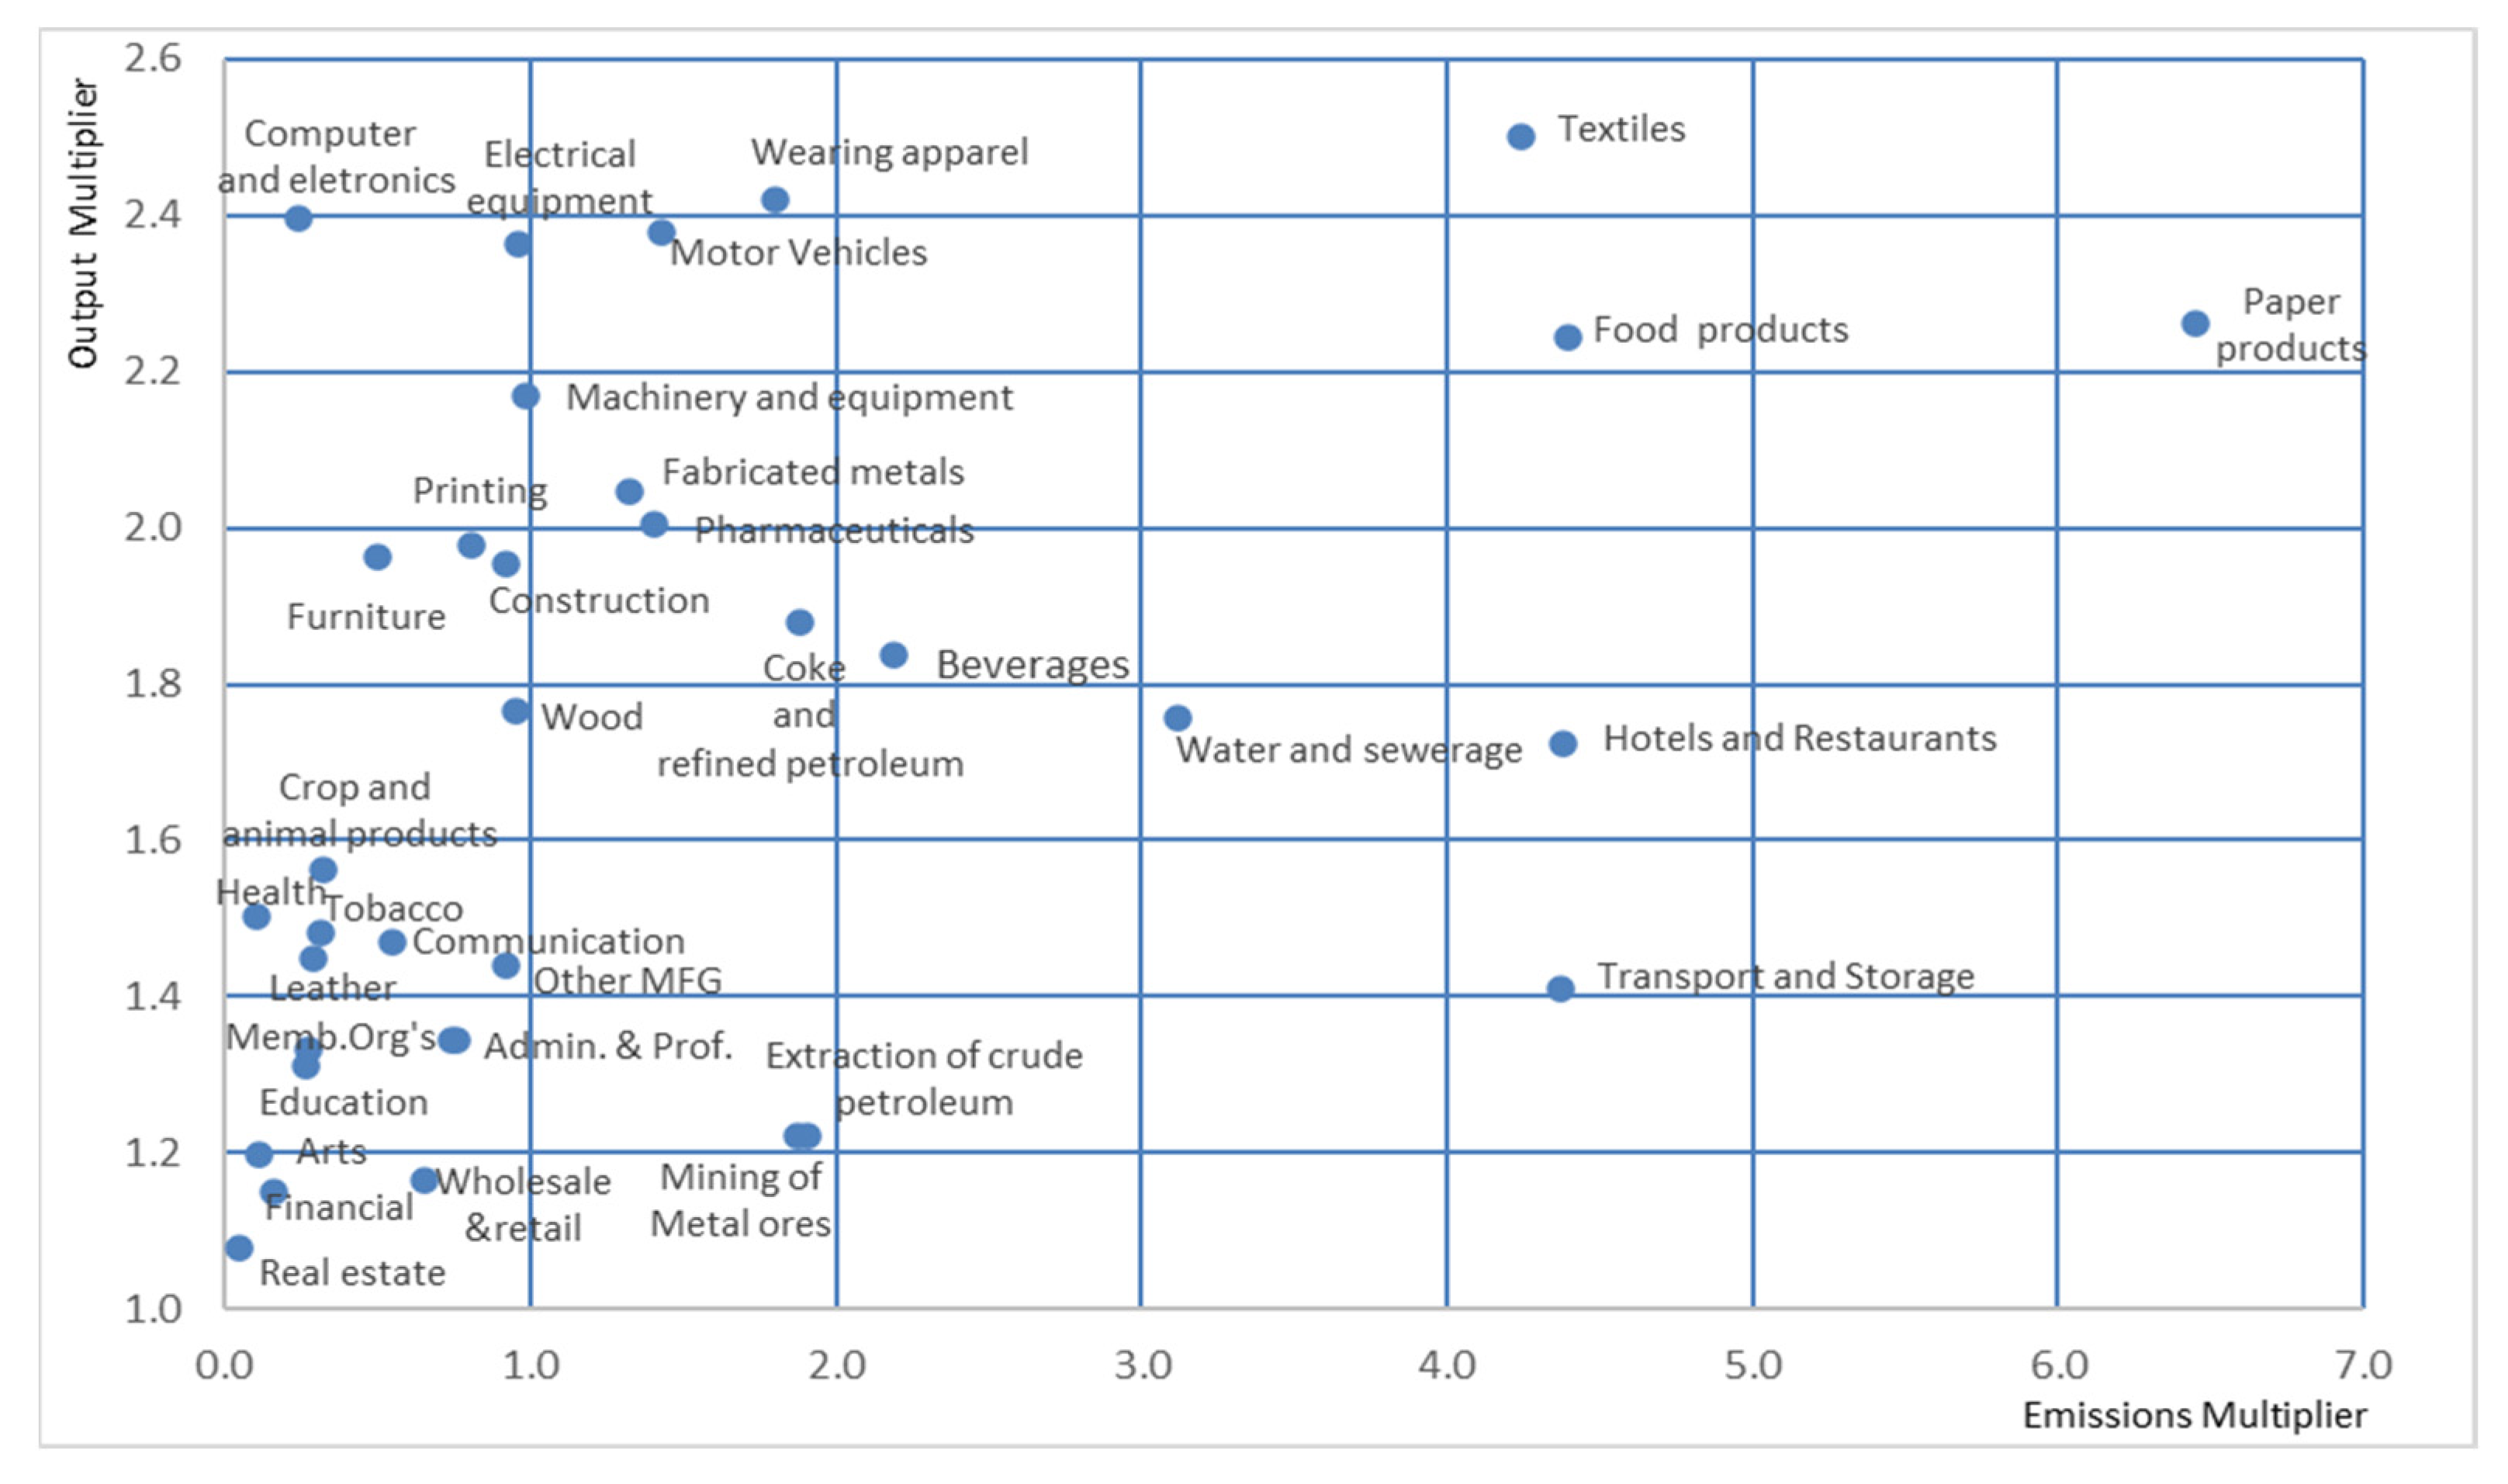
- Ten industries (of which five did not appear in Figure 2 because they were emission outliers) were found to be the most environmentally-degrading (dirty) (arranged in descending order of emissions): electricity, gas, and water; non-metallic mineral products; basic metals; rubber and plastic products; chemicals and chemical products; paper and paper products; food products; hotels and restaurants; transportation and storage; and textiles.
- Eight of the above ten industries should be of particular concern to policymakers for possessing both high output and high emission multiplier effects. These industries are electricity, gas, and water; non-metallic mineral products; basic metals; rubber and plastic products; chemicals and chemical products; paper products; food products; and textiles.
- The following five industries are ranked as the next highest ones in terms of environmental concern, with emission multiplier effects greater than 1.9: water and sewerage; beverages; coke and refined petroleum products; extraction of crude petroleum; and mining of metal ores.
- Ten industries that qualify as environmentally non-degrading (clean) (in descending order of cleanliness) are (1) computers and electronic and optical equipment; (2) electrical equipment; (3) motor vehicles and trailers; (4) wearing apparel; (5) furniture; (6) printing; (7) machinery and equipment; (8) construction; (9) fabricated metal products; and (10) pharmaceuticals. All these industries have low emission multipliers coupled with high output multipliers (more than 1.8).
- The remaining industries are environmentally non-degrading, mostly service-related, and clustered in low-emission and low-to-intermediate output multiplier zones.
6. Conclusions
Funding
Data Availability Statement
Conflicts of Interest
Appendix A
| Agriculture: | Section A |
| Growing of cereals (except rice), leguminous crops, and oil seeds (Division 01) | |
| Forestry and logging (02) | |
| Fishing and aquaculture (03) (Divisions 01 + 02 + 03 are aggregated under ‘Crop and animal production and hunting’ and ‘Fishing and aquaculture’) | |
| Industry: | Section B |
| Extraction of crude petroleum (06) | |
| Mining of metal ores (07) | |
| Other mining and quarrying (08) | |
| Mining support service activities (09) (Divisions 07 + 08 + 09 are aggregated under ‘Mining of metal ores’). | |
| Section C | |
| Food products (10) | |
| Beverages (11) | |
| Tobacco Products (12) | |
| Textiles (13) | |
| Wearing apparel (14) | |
| Leather and related products (15) | |
| Wood and cork, except furniture (16) | |
| Paper and paper products (17) | |
| Printing and reproduction of recorded media (18) | |
| Coke and refined petroleum (19) | |
| Chemicals and chemical products (20) | |
| Pharmaceuticals (21) | |
| Rubber and plastic products (22) | |
| Non-metallic mineral products (23) | |
| Basic metals (24) | |
| Fabricated metal products except machinery (25) | |
| Computer, electronic and optical products (26) | |
| Electrical equipment (27) | |
| Machinery and equipment (28) | |
| Motor vehicles, trailers, and semitrailers (29) | |
| Other transport equipment (30) (Divisions 29+30 are aggregated under ‘Motor vehicles, trailers, and semitrailers’ and ‘Other transport equipment’). | |
| Furniture (31) | |
| Other manufacturing (32) | |
| Repair of machinery and equipment (33) (Divisions 32 + 33 are aggregated under ‘Other manufacturing’ and ‘Repair of machinery and equipment’) | |
| Services: | Section D |
| Electricity and gas (35) | |
| Section E | |
| Water collection, treatment, and supply (36) | |
| Sewerage (37) | |
| Waste collection, treatment, and disposal activities; Materials recovery (38) (Divisions 36 + 37 + 38 aggregated under ‘Water and sewerage’, and corresponding multiplier values are given in Appendix B). | |
| Construction of building (41) | |
| Civil engineering (42) | |
| Specialized construction activities (43) (Divisions 41 + 42 + 43 are aggregated under ‘Construction’). | |
| Wholesale and retail trade and repair of motor vehicles and motorcycles (45) | |
| Wholesale trade, except for motor vehicles and motorcycles (46) | |
| Retail trade, except for motor vehicles and motorcycles (47) (Divisions 44 + 46 + 47 are aggregated under ‘Wholesale and retail’ and ‘Repair of motor vehicles’). | |
| Land transport and transport via pipelines (49) | |
| Water transport (50) | |
| Air transport (51) | |
| Warehousing and support activities for transportation (52) | |
| Postal and courier activities (53) (Divisions 49 + 50 + 51 + 52 + 53 are aggregated under ‘Transport and storage’). | |
| Accommodation (55) | |
| Food and beverage service activities (56) (Divisions 55 + 56 are aggregated under ‘Hotels and restaurants’, and corresponding multiplier values are given in Appendix B). | |
| Publishing activities (58) | |
| Motion picture, video, and television program production and sound recording and music publishing activities (59) | |
| Programming and broadcasting activities (60) | |
| Telecommunications (61) | |
| Computer programming, consultancy, and related activities (62) | |
| Information service activities (63) (Divisions 58 + 59 + 60 + 61 + 62 + 63 are aggregated under ‘Communication’) | |
| Financial service activities, except insurance and pension funding (64) | |
| Insurance, reinsurance, and pension funding, except compulsory social security (65) | |
| Activities auxiliary to financial service and insurance activities (66) (Divisions 64 + 65 + 66 are aggregated under ‘Financial services and insurance’). | |
| Real estate activities (68) | |
| Legal and accounting activities (69) | |
| Activities of head offices; Management consultancy activities (70) | |
| Architectural and engineering activities; Technical testing and analysis (71) | |
| Scientific research and development (72) | |
| Advertising and market research (73) | |
| Other professional, scientific, and technical activities (74) | |
| Veterinary activities (75) (Divisions 69 + 70 + 71 + 72 + 73 + 74 + 75 are aggregated under ‘Professional services’) | |
| Rental and leasing activities (77) | |
| Employment activities (78) | |
| Travel agency, tour operator, reservation service, and related activities (79) | |
| Security and investigation activities (80) | |
| Services to buildings and landscape activities (81) | |
| Office administrative, office support, and other business support activities (82) (Divisions 77 + 78 + 79 + 80 + 81 + 82 are aggregated under ‘Administrative and support services’) | |
| Public administration and defense; Compulsory social security (84) | |
| Education (85) | |
| Government human health activities (86) | |
| Residential care activities (87) | |
| Social work activities without accommodation (88) (Divisions 86 + 87 + 88 are aggregated under ‘Health and social work’). | |
| Creative arts and entertainment activities (90) | |
| Libraries, archives, museums, and other cultural activities (91) | |
| Gambling and betting activities (92) | |
| Government sports activities and amusement and recreation activities (93) (Divisions 90 + 91 + 92 + 93 are aggregated under ‘Arts and entertainment’) | |
| Activities of membership organizations (94) | |
| Repair of computers and personal and household goods (95) | |
| Other personal service activities (96) (Divisions 94 + 95 + 96 are aggregated under ‘Membership organization services’) | |
| Domestic services (97) |
Appendix B

| Industry (ISIC Revision 4 Code) | Direct CO2 Emissions (Millions of Metric Tons) | Total (Direct and Indirect CO2 Emissions) Emission Multiplier in Millions of Metric Tons | Output Multiplier | |||
|---|---|---|---|---|---|---|
| 2016/2017 | 2017/2018 | 2016/2017 | 2017/2018 | 2016/2017 | 2017/2018 | |
| Agriculture, forestry, and fishing (01–03) | ||||||
| Crop and animal production and hunting; Fishing and aquaculture (01 + 02 + 03) (1) | 1.121 | 0.2034 | 1.753 | 0.318 | 1.564 | 1.5628 |
| Industry (Extraction and Mining) (06–09) | ||||||
| Extraction of crude petroleum (06) | 1.716 | 1.5609 | 1.856 | 1.9077 | 1.082 | 1.2222 |
| Mining of metal ores (07–09) | 5.607 | 1.5380 | 7.873 | 1.8771 | 1.404 | 1.2205 |
| Industry (Manufacturing) (10–33) | ||||||
| Food products (10) (1) | 2.482 | 1.9573 | 5.238 | 4.3927 | 2.111 | 2.2443 |
| Beverages (11) | 1.166 | 1.1887 | 1.978 | 2.1860 | 1.696 | 1.8390 |
| Tobacco products (12) | 0.070 | 0.2110 | 0.109 | 0.3128 | 1.567 | 1.4827 |
| Textiles (13) | 1.809 | 1.6945 | 3.910 | 4.2383 | 2.161 | 2.5013 |
| Wearing apparel (14) | 0.829 | 0.7437 | 1.239 | 1.8005 | 1.494 | 2.4208 |
| Leather and related products (15) | 0.310 | 0.2000 | 0.598 | 0.2899 | 1.928 | 1.4491 |
| Wood and cork, except furniture (16) | 0.648 | 0.5374 | 0.723 | 0.9494 | 1.115 | 1.7665 |
| Paper and paper products (17) | 2.831 | 2.8515 | 5.654 | 6.4509 | 1.997 | 2.2623 |
| Printing and reproduction of recorded media (18) | 0.525 | 0.4088 | 0.573 | 0.8092 | 1.092 | 1.9794 |
| Coke and refined petroleum (19) | 1.549 | 1.0008 | 2.618 | 1.8804 | 1.690 | 1.8789 |
| Chemicals and chemical products (20) | 4.024 | 3.9003 | 6.944 | 7.8823 | 1.726 | 2.0209 |
| Pharmaceuticals (21) | 0.698 | 0.6996 | 1.310 | 1.4032 | 1.877 | 2.0057 |
| Rubber and plastic products (22) | 6.212 | 6.2580 | 12.076 | 13.2728 | 1.944 | 2.1210 |
| Non-metallic mineral products (23) | 16.024 | 15.8084 | 30.749 | 33.5035 | 1.919 | 2.1193 |
| Basic metals (24) | 6.746 | 6.6865 | 12.009 | 14.3954 | 1.780 | 2.1529 |
| Fabricated metal products, except machinery (25) | 0.728 | 0.6469 | 1.221 | 1.3247 | 1.677 | 2.0477 |
| Computer, electronic and optical products (26) | 0.101 | 0.1004 | 0.219 | 0.2404 | 2.172 | 2.3957 |
| Electrical equipment (27) | 0.419 | 0.4053 | 0.878 | 0.9576 | 2.098 | 2.3623 |
| Machinery and equipment (28) | 0.465 | 0.4527 | 0.954 | 0.9822 | 2.053 | 2.1697 |
| Motor vehicles, trailers and semitrailers; Other transport equipment (29 + 30) | 0.611 | 0.6018 | 1.325 | 1.4311 | 2.171 | 2.3781 |
| Furniture (31) | 0.311 | 0.2547 | 0.418 | 0.4997 | 1.3427 | 1.9616 |
| Other manufacturing; Repair of machinery and equipment (32 + 33) | 0.877 | 0.6400 | 0.897 | 0.9208 | 1.023 | 1.4389 |
| Services (35–97) | ||||||
| Electricity and gas (35) | 72.452 | 45.7810 | 126.911 | 108.8872 | 1.752 | 2.3784 |
| Water and sewerage (36–38) | 3.059 | 1.7761 | 4.967 | 3.1183 | 1.624 | 1.7557 |
| Construction (41–43) | 1.056 | 0.4689 | 1.640 | 0.9161 | 1.554 | 1.9537 |
| Wholesale and retail; Repair of motor vehicles (45–47) | 0.694 | 0.5586 | 0.835 | 0.6507 | 1.204 | 1.1649 |
| Transport and storage (49–53) | 14.110 | 3.1015 | 19.475 | 4.3707 | 1.380 | 1.4092 |
| Hotels and restaurants (55 + 56) | 2.590 | 2.5376 | 4.059 | 4.3784 | 1.568 | 1.7254 |
| Communication (58 + 59 + 60 + 61 + 62 + 63) | 0.840 | 0.3714 | 1.210 | 0.5465 | 1.440 | 1.4712 |
| Financial services and insurance (64 + 65 + 66) | 0.246 | 0.1386 | 0.279 | 0.1594 | 1.135 | 1.1497 |
| Real estate (68) | 0.441 | 0.0420 | 0.542 | 0.0453 | 1.228 | 1.0796 |
| Professional services (69–75) | 1.013 | 0.5513 | 1.299 | 0.7413 | 1.282 | 1.3446 |
| Administrative and support services (77–82) | 1.084 | 0.5618 | 1.662 | 0.7544 | 1.532 | 1.3429 |
| Public administration and defense (84) (2) | NA | NA | NA | NA | 1.3122 | 1.2948 |
| Education (85) | 1.031 | 0.2014 | 1.137 | 0.2641 | 1.103 | 1.3110 |
| Human health activities; residential care; and social work activities (86–88) | 0.227 | 0.0657 | 0.332 | 0.0988 | 1.462 | 1.5030 |
| Arts and entertainment (90–93) | 0.493 | 0.0944 | 0.601 | 0.1129 | 1.220 | 1.1964 |
| Membership organization services (94–96) | 0.411 | 0.2043 | 0.547 | 0.2723 | 1.331 | 1.3325 |
References
- The Conversation. COP28: Five Major Outcomes from the Latest UN Climate Summit. Available online: https://theconversation.com/cop28-five-major-outcomes-from-the-latest-un-climate-summit-219655 (accessed on 6 November 2024).
- Miller, R.E.; Blair, P.D. Input-Output Analysis: Foundations and Extensions; Cambridge University Press: Cambridge, UK, 2013. [Google Scholar]
- Worldometer. Available online: https://www.worldometers.info/co2-emissions/egypt-co2-emissions (accessed on 15 March 2024).
- Gớmez-Paredes, J.; Malik, A. Tracking the Sustainable Development Goals with input-output: A commentary and example. In Proceedings of the 26th International Input-Output Association Conference, Juiz de Fora, Brazil, 25–29 June 2018; Available online: https://www.iioa.org/conferences/26th/papers/files/3409_Gmez-ParedesandMalik(2018)TrackingtheSustainableDevelopmentGoalswithInput-OutputAnalysis.pdf (accessed on 15 July 2024).
- Lenzen, M.; Murray, S.A.; Korte, B.; Dey, C.J. Environmental impact assessment including indirect effects—A case study using input–output analysis. Environ. Impact Assess. Rev. 2003, 23, 263–282. [Google Scholar] [CrossRef]
- Lester, W.T.; Little, M.G.; Jolley, G.J. Assessing the economic impact of alternative biomass uses: Biofuels, wood pellets, and energy production. J. Reg. Anal. Policy 2015, 45, 36–46. [Google Scholar]
- Leontief, W. Environmental Repercussions and the Economic Structure: An Input-Output Approach. Rev. Econ. Stat. 1970, 52, 262–271. [Google Scholar] [CrossRef]
- Llop, M. Economic structure and pollution intensity within the environmental input–output framework. Energy Policy 2006, 35, 3410–3417. [Google Scholar] [CrossRef]
- Munksgaard, J.; Wier, M.; Lenzen, M.; Dey, C. Using Input-Output Analysis to Measure the Environmental Pressure of Consumption at Different Spatial Levels. J. Ind. Ecol. 2005, 9, 169–185. [Google Scholar] [CrossRef]
- Gajos, E.; Prandecki, K. National accounting twith environmental accounts (NAMEA)—An overview of environmentally extended input-output analysis. Economía 2016, 15, 65–74. [Google Scholar]
- Ribeiro, L.C.; Pereira, E.; Freitas, L. Greenhouse Gases Emissions and Economic Performance of Livestock, an Environmental Input-Output Analysis. Rev. Econ. Sociol. Rural. 2018, 56, 225–238. [Google Scholar] [CrossRef]
- Sassanelli, C.; Rosa, P.; Rocca, R.; Terzi, S. Circular economy performance assessment methods: A systematic literature review. J. Clean. Prod. 2019, 229, 440–453. [Google Scholar] [CrossRef]
- Calgar, A.E.; Gönenç, S.; Destek, A. Toward a sustainable environment within the framework of carbon neutrality scenarios: Evidence from the novel Fourier-NARDL approach. J. Sustain. Dev. 2024, 32, 6643–6655. [Google Scholar] [CrossRef]
- Littlewood, D.; Decelis, R.; Hillenbrand, C.; Holt, D. Examining the drivers and outcomes of corporate commitment to climate change action in European high emitting industry. Bus. Strategy Environ. 2018, 27, 1437–1449. [Google Scholar] [CrossRef]
- Karim, A.E.; Albitar, K.; Elmarzouky, M. A novel measure of corporate carbon emission disclosure, the effect of capital expenditures and corporate governance. J. Environ. Manag. 2021, 290, 112581. [Google Scholar] [CrossRef] [PubMed]
- Moussa, A.S.; Elmarzouky, M. Beyond Compliance: How ESG Reporting Influences the Cost of Capital in UK Firms. J. Risk Financial Manag. 2024, 17, 326. [Google Scholar] [CrossRef]
- Chen, W.; Wu, F.; Geng, W.; Yu, G. Carbon emissions in China’s industrial sectors. Resour. Conserv. Recycl. 2017, 117, 264–273. [Google Scholar] [CrossRef]
- Meng, L.; Sager, J. Energy consumption and energy-related CO2 emissions from China’s petrochemical industry based on an environmental input-output life cycle assessment. Energies 2017, 10, 1585. [Google Scholar] [CrossRef]
- Moll, S.; Acosta, J. Environmental implications of resource use: Environmental input-output analyses for Germany. J. Ind. Ecol. 2006, 10, 25–40. [Google Scholar] [CrossRef]
- Loizou, S.; Mattas, K.; Tzouvelekas, V.; Fotopoulos, C.; Galanopoulos, K. Regional Economic Development and Environmental Repercussions: An Environmental Input-Output Approach. Int. Adv. Econ. Res. 2000, 6, 373–386. [Google Scholar] [CrossRef]
- Mani, M.; Wheeler, D. In Search of Pollution Havens? Dirty Industry in the World Economy, 1960 to 1995. J. Environ. Dev. 1998, 7, 215–247. [Google Scholar] [CrossRef]
- D’Hernoncourt, J.; Cordier, M.; Hadley, D. Input-output multipliers–Specification sheet and supporting. In Spicosa Project Report; Université Libre de Bruxelles–CEESE: Brussels, Belgium, 2011; Available online: http://www.coastal-saf.eu/output-step/pdf/Specification%20sheet%20I_O_final.pdf (accessed on 15 December 2021).
- CAPMAS. Input Output Tables for the Year 2017/2018 Within the Framework of National Income Accounts. 2021. Available online: https://www.capmas.gov.eg/Pages/Publications.aspx?page_id=5109&Year=23540 (accessed on 30 December 2024). (In Arabic)
- IEA. Energy System of Egypt. Available online: https://www.iea.org/countries/egypt (accessed on 30 December 2024).
- Umweltbundesamt. Kohlendioxid-Emissionsfaktoren für die Deutsche Berichterstattung Atmosphärischer Emissionen. 2022. Available online: https://www.volker-quaschning.de/datserv/CO2-spez/index_e.php (accessed on 15 April 2023).
- Garrett-Peltier, H. Green versus brown: Comparing the employment impacts of energy efficiency, renewable energy, and fossil fuels using an input-output model. Econ. Model. 2017, 61, 439–447. [Google Scholar] [CrossRef]
- Perman, R.; Ma, Y.; Common, M.; Maddison, D.; Mcgilvray, J. Natural Resource and Environmental Economics, 3rd ed.; Pearson Education Limited: London, UK, 2003. [Google Scholar]
- Al-Ayouty, I. The Effect of Energy Consumption on Output: A Panel Data Study of Manufacturing Industries in Egypt. Eur. J. Sustain. Dev. 2020, 9, 490–502. [Google Scholar] [CrossRef]
- Worrell, E.; Boyd, G. Bottom-up estimates of deep decarbonization of U.S. manufacturing in 2050. J. Clean. Prod. 2022, 330, 129758–129773. [Google Scholar] [CrossRef]
- Panerali, K.; Jamison, S. Industrial Clusters Are Critical to Getting to Net-Zero: Here’s Why. World Economic Forum Climate Action. 2020. Available online: https://www.weforum.org/stories/2020/10/industrial-clusters-can-be-a-key-lever-for-decarbonization-heres-why/ (accessed on 18 December 2024).
- Acerbi, F.; Sassanelli, C.; Taisch, M.; Despeisse, M. Exploiting Information Systems for Circular Manufacturing Transition: A Guiding Tool. In Advances in Production Management Systems. Production Management Systems for Responsible Manufacturing, Service, and Logistics Futures. In Proceedings of the IFIP WG 5.7 International Conference, Trondheim, Norway, 17–21 September 2023; Alfnes, E., Romsdal, A., Strandhagen, J.O., von Cieminski, G., Romero, D., Eds.; IFIP Advances in Information and Communication Technology. Springer Nature: Geneva, Switzerland, 2023; pp. 129–143. [Google Scholar]
- Acerbi, F.; Sassanelli, C.; Taisch, M. A maturity model enhancing data-driven circular manufacturing. Prod. Plan. Control. 2024, 1–19. [Google Scholar] [CrossRef]
| SDG | Industry | |
|---|---|---|
| Clean: Industry Growth May Contribute to Achieving the Goal | Dirty: Industry Growth May Hinder Achieving the Goal | |
| Goal 7: ensure access to affordable, reliable, sustainable, and modern energy for all. | - computers and electronic and optical equipment; - electrical equipment; - motor vehicles and trailers; - wearing apparel; - furniture; - printing; - machinery and equipment; - construction; - fabricated metal products; - pharmaceuticals | - electricity, gas, and water; - non-metallic mineral products; - basic metals, - rubber and plastic products; - chemicals and chemical products; - paper and paper products; - food products; - hotels and restaurants; - transportation and storage; - textiles. |
| Goal 8: promotion of sustainable and inclusive economic growth. | ||
| Goal 9: build resilient infrastructure, promote inclusive and sustainable industrialization, and foster innovation. | ||
| Goal 12: ensure sustainable consumption and production patterns. | ||
| Goal 13: take urgent action to combat climate change and its impacts. | ||
Disclaimer/Publisher’s Note: The statements, opinions and data contained in all publications are solely those of the individual author(s) and contributor(s) and not of MDPI and/or the editor(s). MDPI and/or the editor(s) disclaim responsibility for any injury to people or property resulting from any ideas, methods, instructions or products referred to in the content. |
© 2025 by the author. Licensee MDPI, Basel, Switzerland. This article is an open access article distributed under the terms and conditions of the Creative Commons Attribution (CC BY) license (https://creativecommons.org/licenses/by/4.0/).
Share and Cite
Al-Ayouty, I. Towards Environmental Sustainability: An Input–Output Analysis to Measure Industry-Level Carbon Dioxide Emissions in Egypt. Sustainability 2025, 17, 1035. https://doi.org/10.3390/su17031035
Al-Ayouty I. Towards Environmental Sustainability: An Input–Output Analysis to Measure Industry-Level Carbon Dioxide Emissions in Egypt. Sustainability. 2025; 17(3):1035. https://doi.org/10.3390/su17031035
Chicago/Turabian StyleAl-Ayouty, Iman. 2025. "Towards Environmental Sustainability: An Input–Output Analysis to Measure Industry-Level Carbon Dioxide Emissions in Egypt" Sustainability 17, no. 3: 1035. https://doi.org/10.3390/su17031035
APA StyleAl-Ayouty, I. (2025). Towards Environmental Sustainability: An Input–Output Analysis to Measure Industry-Level Carbon Dioxide Emissions in Egypt. Sustainability, 17(3), 1035. https://doi.org/10.3390/su17031035