Abstract
The urgent global mandate for carbon neutrality necessitates a shift from traditional product-centric models towards Digital Twin (DT)-driven low-carbon service solutions, particularly in Central Air Conditioning (CAC) systems. This paper proposes a novel DT-driven framework for systematic low-carbon service design and modularization in CAC ecosystems. The framework first facilitates a comprehensive demand analysis, informed by a three-dimensional Energy Scenario Intelligence model and quantified using robust multi-criteria methods. The framework then introduces a novel methodology for the quantitative analysis of co-intelligence relationships, which provides the foundation for an advanced service module generation and optimization approach that leverages an improved Girvan Newman algorithm and Interval Type-2 Fuzzy TOPSIS to handle high-level uncertainties. A key contribution is the explicit elucidation of DT’s pivotal role in enabling predictive and systemic low-carbon capabilities. The framework’s effectiveness was verified in an intelligent office building, achieving a 74.29% integrated energy saving rate and an annual carbon reduction of 618.5 tCO2. The findings offer valuable theoretical insights and a practical methodology for designing and implementing sustainable CAC service ecosystems.
1. Introduction
The urgent global mandate for carbon neutrality positions energy conservation and emission reduction as paramount objectives across all sectors [1,2]. Within this context, the building industry emerges as a significant contributor to global energy consumption and greenhouse gas emissions, with Central Air Conditioning (CAC) systems accounting for a substantial portion of this expenditure [3]. The conventional product-centric business model in the CAC industry, historically focused on equipment sales, increasingly conflicts with stringent carbon reduction targets and the evolving demands from diverse stakeholders for sustainable and intelligent solutions [4]. This necessitates a fundamental paradigm shift towards comprehensive, full-life-cycle low-carbon service provision, fostering enhanced efficiency and value creation through advanced digital technologies [5].
The successful transition towards low-carbon service ecosystems for CAC critically depends on the ability to holistically design and modularize complex service systems [4]. Modular design, in particular, offers significant advantages by reducing design redundancy and costs, enhancing resource efficiency, and streamlining configuration. It enables increased diversity of low-carbon services and caters to varied user demands by promoting system adaptability and flexibility. However, current modularization efforts for CAC low-carbon service systems face challenges, including technical immaturity and a lack of standardization. Insufficient systematic component recognition and under-utilization of inter-module synergy lead to increased complexity and cost in adapting systems to diverse requirements.
Such design processes inherently face challenges stemming from the multi-faceted nature of stakeholder demands, the intricate interdependencies among service components, and the prevalence of various forms of uncertainty in expert judgments and real-world data. Traditional design and analysis methods often fall short in comprehensively addressing these complexities, leading to sub-optimal solutions and inefficient resource allocation. Digital Twin (DT) technology offers a robust and innovative foundation to overcome these limitations and enable the precise, adaptive, and sustainable design of low-carbon services [6,7,8,9].
However, despite its potential and extensive research in related fields such as Product Service Systems (PSS) design, sustainability assessment, and Multi-Criteria Decision-Making (MCDM), the holistic low-carbon service design for CAC ecosystems still faces multifaceted challenges that are not fully addressed by any single domain. For instance, while extensive research exists on carbon-constrained operational strategies such as optimal pricing and supply chain coordination in various industries [10,11,12], these models seldom translate to the granular level of service component modularization within a complex building ecosystem. Similarly, although advanced optimization methods under uncertainty have been developed for integrated energy systems [13,14], their application is often focused on grid-level scheduling rather than on the dynamic, co-intelligent relationships among cyber physical service components. Furthermore, while MCDM frameworks are widely used in the construction sector for strategic evaluation [15,16,17], they often rely on methods that do not fully capture the high-order, hybrid uncertainties inherent in a DT-driven environment.
Consequently, several notable research gaps persist in the holistic low-carbon service design and modularization for CAC ecosystems:
- (1)
- Lack of Integrated Value-Driven Framework: Existing approaches lack a systemic framework to comprehensively integrate multi-dimensional value propositions and diverse stakeholder demands throughout the entire service system design lifecycle, from conceptualization to solution evaluation.
- (2)
- Insufficient Handling of Hybrid Uncertainty in Evaluation: There is a pronounced lack of robust methodologies capable of effectively handling diverse forms of hybrid uncertainty (e.g., linguistic vagueness, group preference randomness) in the evaluation and optimization of complex service module solutions.
- (3)
- Limited DT-enabled Co-intelligence Modeling and Modularization: Critical exploration is lacking on how DT and cyber physical concepts can be fully leveraged for intelligent service system modeling, quantitative component co-intelligence relationship analysis, and dynamic module generation/optimization, particularly for low-carbon objectives.
- (4)
- Absence of Comprehensive Framework Validation: A holistic framework systematically linking multi-stakeholder value propositions, demand analysis, and DT-enabled modular design for low-carbon CAC services, along with integrated mathematical methods and practical validation, remains underexplored.
Addressing these aforementioned research gaps and challenges, this paper proposes a novel DT-driven framework for low-carbon service design and modularization in central air conditioning ecosystems. Its main contributions are:
- (1)
- A Novel Integrated Framework: Proposing a comprehensive and novel DT-driven framework for low-carbon service system design and modularization in CAC ecosystems, systematically integrating value proposition identification, quantified demand analysis, and innovative module generation towards low-carbon design objectives.
- (2)
- Novel Methodological Innovations for Robust Design and Evaluation: Building upon established concepts of system synergy [18] and collaborative intelligence [19], this research introduces a novel quantitative co-intelligence relationship analysis methodology. This approach is designed to characterize the complex synergistic interactions among cyber physical service elements, providing a quantifiable basis for modular design. Building upon this, an improved Girvan Newman (GN) algorithm is proposed for co-intelligence driven service module generation, specifically enhancing modularity and low-carbon alignment. Finally, a robust Interval Type-2 Fuzzy TOPSIS algorithm is applied for comprehensive multi-criteria evaluation of the generated service module solutions, effectively handling higher-order uncertainties and expert disagreement in the decision-making process.
- (3)
- Explicit Elucidation of DT’s Enabling Role: Clearly demonstrating DT technology’s critical and underexplored enabling role across the entire low-carbon service design and modularization lifecycle within CAC ecosystems, from advanced demand analysis to dynamic module generation and predictive solution validation.
- (4)
- Comprehensive Validation: Demonstrating the framework’s systematic application and practical utility in an intelligent office building case study, offering replicable pathways for sustainable building management.
The remainder of this paper is organized as follows: Section 2 provides a comprehensive literature review. Section 3 details the proposed DT-driven low-carbon service design and modularization framework, including its novel methodologies. Section 4 presents a comprehensive case study to validate the framework. Section 5 discusses the key findings, theoretical implications, practical implications, and the generalizability of the framework. Finally, Section 6 concludes the paper and outlines future research directions.
2. Literature Review
2.1. Sustainable and Low-Carbon Product–Service Systems (SPSS)
Product–Service Systems (PSS) represent a transformative business model that shifts focus from mere product sales to delivering comprehensive solutions by integrating products and services to create higher value throughout the entire product lifecycle [20,21]. The advent of digital technologies, encompassing digitalization, networking, and intelligence, has further propelled PSS into Smart Product Service Systems (SPSS), which are characterized by the systematic integration of tangible products with intangible services, moving towards integrated, platform-based solutions [22,23].
SPSS inherently function as complex, adaptive, and evolving ecosystems [24]. These systems are built upon the integration of smart products and services, primarily driven by user requirements and the imperative of value co-creation, and necessitate the involvement of a diverse array of stakeholders [21]. Key attributes of SPSS encompass high flexibility, inherent variability, business model innovation, and robust scalability. Furthermore, their data-driven and cross-boundary capabilities facilitate dynamic adaptation to evolving environmental conditions and continuous user feedback [25]. Operationally, SPSS critically leverage advanced intelligent technologies, including deep sensing, intelligent analytics, proactive decision-making, dynamic interaction, and adaptive control [26]. Smart platforms serve as critical infrastructure, interconnecting various service systems and stakeholders to enable value co-creation [27]. Ultimately, the objective of SPSS is to optimize holistic ecosystem benefits, extending beyond maximizing individual user value [28,29].
Driven by the imperative of sustainable development, the integration of low-carbon strategies into SPSS design is intrinsically aligned with the Triple Bottom Line (TBL) framework [30], requiring a holistic balance of economic, environmental, and social objectives. While product level low-carbon design has seen advancements focusing on optimizing material, structure, and manufacturing processes to reduce life-cycle carbon footprints [31,32,33,34], optimizing the carbon footprint of comprehensive service systems demands a more holistic approach. This approach must consider not only product attributes but also service delivery mechanisms, user behavior, operational strategies, resource allocation efficiency, and the effective integration of green energy sources.
Existing low-carbon design methodologies and tools often lack the systematic integration required to address the complexity, dynamism, and multi-stakeholder characteristics inherent in SPSS throughout their entire lifecycle. Specifically, research on how service elements, such as service processes, modules, and interaction modes, are driven and constrained by low-carbon objectives for comprehensive system design remains insufficient.
Furthermore, many existing SPSS frameworks do not fully engage with the broader economic and strategic dimensions of sustainability. For instance, a significant body of research in sustainability scholarship has explored the critical role of pricing strategies and competitive dynamics under carbon constraints. Using game-theoretic models, researchers have analyzed optimal pricing and coordination in sectors like automotive and apparel, demonstrating how government interventions and carbon policies shape corporate low-carbon strategies [11,12]. The role of capacity sharing and delayed decisions in such competitive environments has also been shown to be critical for achieving win-win outcomes [10]. Even service offerings, such as extended warranties, have been modeled as strategic variables that influence product pricing in competitive markets [35]. These findings highlight that an effective low-carbon service system must be not only technically sound but also economically strategic and responsive to market and policy signals. However, how to integrate such strategic decision-making into the granular, cyber physical design of service modules is a question that has not been adequately addressed.
2.2. Digital Twin in Product Service Systems and Building Applications
DT technology, fundamentally a dynamic virtual representation of a physical entity rooted in the Cyber Physical System (CPS) paradigm, enables real-time interaction and data exchange between physical and digital domains [36,37]. With core capabilities in high-fidelity modeling, real-time data integration, multi-physics simulation, predictive analytics, intelligent diagnosis, and optimization, DT is pivotal for enabling advanced service functionalities within SPSS [38,39]. It empowers SPSS to deliver higher-level services such as remote monitoring, predictive maintenance, intelligent scheduling, and comprehensive life-cycle management, crucially encompassing carbon emission tracking and optimization [9,38,40]. This increasing demand for system-level autonomous optimization and predictive control inherently drives the application of DT and analogous modeling and simulation technologies.
Specifically, within CAC systems and broader intelligent building operation management, DT demonstrates substantial potential for enhancing operational efficiency, fault diagnosis, and energy optimization [41,42,43]. Its applications, however, extend far beyond HVAC. For instance, recent studies have explored the use of DTs for optimizing smart lighting systems based on real-time occupancy data [44], developing sophisticated models for predicting and managing occupant comfort [45], and facilitating the seamless integration of buildings with smart grids for demand response and energy flexibility [46]. By enabling real-time monitoring and predictive maintenance, DT facilitates precise fault diagnosis and extends equipment lifespan, consequently reducing operational and maintenance costs. Furthermore, its simulation capabilities allow for assessing the impact of various operational strategies on system energy consumption and indoor environmental quality, leading to optimized energy usage and improved user comfort [29,45,47]. The integration of DT with other intelligent technologies (e.g., AI, IoT) thus forms a comprehensive CPS framework for advanced energy management, environmental control, and asset optimization.
Research has explored various architectural layers for DT-enabled SPS and building systems. These typically comprise physical resource layers, which encompass intelligent products, sensors, and environmental elements serving as data entry points and material carriers [48,49]. Beyond this, cyber layers are responsible for virtual mapping, data perception, management, and application, with an emphasis on efficient data flow and processing [29,50]. Finally, service layers focus on value realization, service execution, and application delivery [22,51]. Across these frameworks, data is consistently recognized as a critical asset for real-time monitoring, simulation, and optimization, with its efficient management being paramount for system performance. Furthermore, user-centricity is a core aspect, with various frameworks emphasizing the user’s pivotal role in service delivery and value co-creation [25,28,52].
Despite these advancements, a systematic and deep integration of DT technology for holistic low-carbon service design and modularization for CAC ecosystems remains underexplored, particularly regarding how DT facilitates the modeling of complex service component interactions and the generation of optimized service modules.
2.3. Multi-Criteria Decision-Making (MCDM) for Demand Analysis and Prioritization
Multi-Criteria Decision-Making (MCDM) methodologies serve as a foundational approach for the design and development of complex systems, effectively addressing the identification, analysis, and prioritization of various, often conflicting, demands and diverse stakeholder preferences [53,54]. While MCDM is broadly applicable to service demand analysis, its systematic application within nascent domains like low-carbon service ecosystems presents unique challenges due to their inherent complexity, dynamism, and the multi-dimensional nature of sustainability objectives.
In the context of demand analysis, various MCDM methods are widely employed. Key traditional approaches such as the Analytical Hierarchy Process (AHP) [55,56], Analytic Network Process (ANP) [57], Decision-Making Trial and Evaluation Laboratory (DEMATEL) [58,59], and the Best-Worst Method (BWM) [60] are frequently used for ranking, weighting, and elucidating causal relationships among criteria. A comparative summary of these methods, detailing their respective strengths and weaknesses, is presented in Table 1.

Table 1.
Comparison of Key MCDM Methods.
As highlighted in Table 1, however, these traditional methods often fall short in robustly handling inherent uncertainties, such as linguistic vagueness from individual judgments and randomness in group preferences. To address these hybrid uncertainties, integrating advanced theories like rough set theory and fuzzy set theory with MCDM offers a more robust approach. Various hybrid rough fuzzy MCDM approaches, such as rough-DEMATEL [61,62], fuzzy-DEMATEL [63,64], rough fuzzy DEMATEL [65], and rough–fuzzy BWM [66], have been successfully developed, demonstrating efficacy in handling hybrid uncertainties. Despite their proven capability in demand analysis and prioritization under uncertainty, the integration of these methodologies within a comprehensive cyber physical service design framework for CAC ecosystems remains underexplored.
2.4. Service System Cyber Physical Modeling and Modularization
Service system design, especially for complex contexts like low-carbon CAC, increasingly leverages modularization to enhance system flexibility, reusability, and maintainability [4,33]. Effective modularization requires robust methods for identifying service components, modeling their intricate interactions, and generating optimal modular structures. Cyber physical modeling, underpinned by DT and CPS concepts, offers a powerful paradigm for representing these complex systems through real-time data integration and virtual simulation [37]. While traditional service blueprinting provides a process-centric view, there is a growing need for methodologies that capture the multi-dimensional interactions and dependencies among service components in a cyber physical environment.
In the realm of service component identification, current research primarily adopts two technical approaches. One approach is centered on service blueprint-based methods, which utilize product service blueprints to visually identify key components within service processes [67]. The other approach involves tool-based identification, leveraging specific tools such as Quality Function Deployment (QFD) [68] or directed graphs for component identification [69,70]. However, the application of these methods in emerging smart service scenarios, such as low-carbon CAC, remains limited. Specifically, these conventional methods often overlook the intangible service processes and the unique characteristics introduced by intelligent technologies in low-carbon CAC, such as the smart capabilities of service components (e.g., perceptibility, diagnosability, predictability, cognitive ability) and their complex interaction relationships (e.g., material flow, functional relevance, data flow, intelligence flow). This makes traditional component identification methods unsuitable for low-carbon CAC service components.
Regarding service component relatedness evaluation, research primarily employs three quantitative methods: relatedness matrices, fuzzy equivalence matrices, and relatedness strength matrices [70]. Design Structure Matrix (DSM) [71] and its fuzzy variants have also been widely applied to analyze inter-component dependencies. While some existing studies have incorporated fuzzy logic to handle individual linguistic vagueness, they generally fail to simultaneously consider the randomness in group preferences. This oversight leads to inaccurate relatedness evaluations and, consequently, imprecise module division schemes.
For service module division, common methods include mapping matrices, fuzzy numerical diagrams, fuzzy clustering algorithms, transitive closure methods, and morphological matrices [70,72]. More complex approaches, such as graph theory combined with multi-objective optimization algorithms and axiomatic design theory [71,73], are also utilized for optimizing modular design.
Crucially, a significant gap exists in quantitatively modeling co-intelligence relationships among service components, which refer to their complex, multi-faceted, and synergistic interactions (e.g., data sharing, functional synergy, resource dependency) that drive overall system performance, especially in intelligent, low-carbon contexts. Current approaches often lack mathematically rigorous models for quantifying these intricate interactions and integrating them effectively into modularization algorithms to optimize specific design objectives like low-carbon efficiency.
Furthermore, after service modules are generated, their comprehensive evaluation and optimization become critical. MCDM methods are applied to evaluate these design alternatives. However, evaluating complex modular solutions, particularly under conditions of high-level uncertainty (e.g., severe expert disagreement or data scarcity), poses unique challenges. While Type-1 fuzzy sets have been used, there is a strong need for robust decision-making approaches, such as Interval Type-2 Fuzzy Sets (IT2FS) based methods (e.g., TOPSIS), that can handle higher-order uncertainties and provide more reliable evaluations of modular service solutions. The explicit application and adaptation of such advanced evaluation methods for low-carbon service module optimization remain an underexplored area.
To address this gap and justify the advanced methodologies adopted in this study, it is valuable to draw parallels from adjacent fields. In the construction industry, for instance, integrated AHP-TOPSIS approaches have been effectively used to prioritize strategies for adopting sustainable energy technologies and transforming construction waste [15,16,17]. Similarly, in integrated energy systems, robust optimization and collaborative scheduling are standard practices for managing shared resources under uncertainty [13,14,74].
While these applications validate the power of systematic decision-making, they also highlight the necessity for methodological advancements when faced with the unique challenges of a DT-driven environment. The hybrid uncertainties in our context—stemming from both the linguistic vagueness of expert judgments and the cognitive incompleteness of group decisions—require a more sophisticated approach. Therefore, this study integrates rough set theory with fuzzy set theory (e.g., in rough fuzzy DEMATEL) to handle this duality. Furthermore, the potential for high-level expert disagreement necessitates the use of IT2FS for the final module evaluation, as they are specifically designed to model such higher-order uncertainties. This methodological progression is a central contribution of our framework, moving beyond the capabilities of traditional MCDM tools.
3. Method
3.1. Overall Framework Architecture
As illustrated in Figure 1, the proposed DT-driven Low-Carbon Service System Design and Modularization Framework systematically transforms macroscopic low-carbon objectives and multi-stakeholder value propositions into quantifiable design inputs, progressively deriving specific, prioritizable service demands, and subsequently generating and evaluating optimal modular service solutions. The framework is structured into three main phases: (1) Low-Carbon Value Proposition and Demand Analysis; (2) Cyber Physical Service Component Modeling and Co-Intelligence Relationship Analysis; and (3) Co-Intelligence Driven Service Module Generation and Optimization. The DT enabling layer serves as the technological foundation, facilitating real-time data acquisition, high-fidelity modeling, predictive analytics, and intelligent decision support across all stages. The proposed architecture, therefore, elucidates a systematic process for translating high-level sustainability objectives into tangible, optimized, and modular service solutions.
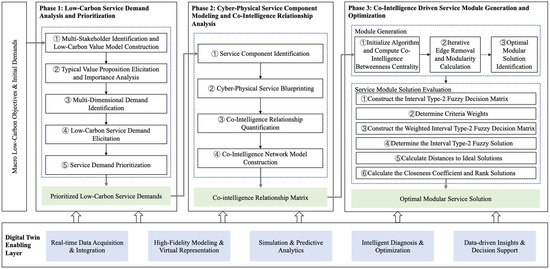
Figure 1.
Overall Framework Architecture for Digital Twin-Driven Low-Carbon Service Design and Modularization.
3.2. Digital Twin Enabling Layer Architecture
A DT enabling layer architecture is constructed within this framework, grounded in the Cyber Physical System (CPS) paradigm. This architecture is pivotal for the precise identification of low-carbon service demands, facilitating profound analytical insights, and enabling the realization of advanced service functionalities. Distinct from conventional product or service models, this architecture transcends traditional boundaries through the deep integration of intelligent technologies and platforms, thereby fostering a dynamic, open, and adaptive low-carbon service ecosystem. Its theoretical underpinning lies in establishing real-time, high-fidelity mapping and synergistic interaction between the physical and cyber realms, thereby providing data-driven insights and optimization capabilities across the entire life cycle of low-carbon services.
This DT enabling layer architecture, illustrated in Figure 2, is systematically categorized into a multi-tiered structure, broadly comprising five principal layers:
- (1)
- Physical Resource Layer: This foundational layer encompasses all physical entities and environmental elements within the low-carbon service ecosystem. It integrates intelligent products, sensor networks, traditional equipment interfaces, and edge monitoring devices, serving as the primary interface for real-time data acquisition and physical operations. The layer primarily focuses on the operational status of physical equipment, environmental parameters, energy consumption, and physical interactions.
- (2)
- Cyber Layer: This layer provides the virtual mapping and logical processing capabilities for the physical world, functionally segmented into three sub-layers:
- Data Perception: Responsible for the real-time acquisition, transmission, preliminary preprocessing, and feature extraction of multi-source, heterogeneous data from the Physical Resource Layer.
- Data Management: Focuses on data storage, cleansing, integration, and standardization, establishing a unified data value chain to ensure timeliness and consistency across diverse data sources.
- Data Application: Transforms processed data into actionable insights and decision support through descriptive, diagnostic, predictive, and prescriptive analytics modules, providing foundational intelligence for advanced service functionalities.
 Figure 2. DT-Enabled Layered Architecture for Low-Carbon CAC Services.Figure 2. DT-Enabled Layered Architecture for Low-Carbon CAC Services.
- (3)
- Process Integration Layer: This layer defines and orchestrates the operational processes of low-carbon services. It transforms static resource templates into dynamic, executable workflows, enabling the customization and dynamization of service process templates and ensuring seamless integration between physical and cyber realities in service delivery.
- (4)
- Service Function Encapsulation Layer: This layer modularizes complex low-carbon service functionalities into independent, interface-standardized, and reusable service units. These units can be flexibly composed to meet specific demands, thereby reducing service development costs and enhancing system adaptability. Encapsulated functions typically include equipment operational status monitoring, data analysis, fault diagnosis, performance prediction, asset tracking, log management, and energy optimization.
- (5)
- Application and User Management Layer: As the uppermost layer, this layer presents encapsulated service functionalities as end-user applications and solutions. It provides intuitive user interfaces, comprehensive reports, and interactive visualization dashboards, alongside robust user group management capabilities and support for energy consumption optimization strategies, ensuring the effective alignment of low-carbon services with diverse user requirements.
The core of this architecture lies in the synergistic connectivity and closed-loop data- and model-driven approach of DT entities across distinct operational domains, as illustrated in Figure 3. Specifically, the figure diagrams the cyber physical operational mechanism, illustrating the flow of data and control commands across the physical resource, physical scenario, cyber scenario, and cyber service domains to achieve closed-loop optimization.
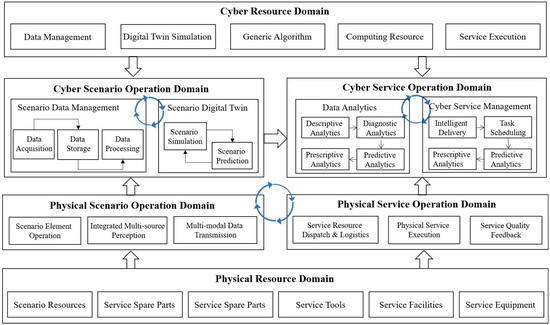
Figure 3.
DT-Driven Cyber Physical Operational Mechanism with Closed-Loop Optimization for CAC Services.
- Physical-Cyber Interaction: The physical scenario operation domain, via sensing elements and multi-modal data transmission, continuously acquires real-time operational status from physical resources and scenario elements. This data is then conveyed to the cyber scenario operation domain. Here, the data management module performs data acquisition, processing, and storage, serving as the foundation for constructing DT models of physical entities within the scenario DT module, which facilitates scenario simulation and prediction.
- Data and Knowledge Flow: Within the cyber scenario operation domain, the processed data forms the basis for knowledge generation. This knowledge then flows to the cyber service operation domain, specifically to the data analytics module. This module performs comprehensive analytics, including descriptive, diagnostic, predictive, and prescriptive analysis, transforming raw data into actionable insights. These insights drive the intelligent delivery and task scheduling within the cyber service management module, providing critical decision support for the entire service lifecycle.
- Virtual-Physical Closed-Loop Optimization: A key advantage of this DT framework is its integrated predictive and simulation-based optimization capability. By performing high-fidelity simulations and predictions of physical system states (e.g., energy consumption, equipment lifespan, carbon emissions), multi-objective optimization strategies are derived in the virtual environment. These optimized strategies and task commands are subsequently transmitted from the cyber service management module (specifically resource orchestration and intelligent delivery) to the physical service operation domain for physical service execution and resource dispatch. The service quality feedback from the physical layer then completes a robust sense-analyze-decide-execute-feedback closed-loop optimization cycle. This mechanism enables, for instance, collaborative management of multi-energy flows (e.g., electricity, gas, heat, water), optimized new energy integration, dynamic energy allocation, and real-time carbon footprint tracking for systemic optimization.
- Service Modularization and Collaboration: The architecture promotes the modularization of complex low-carbon services (e.g., intelligent diagnosis, predictive maintenance, energy optimization). These services, once managed and analyzed in the cyber service operation domain, leverage the physical resources (scenario resources, service spare parts, personnel, tools, facilities, equipment) from the physical resource domain. The physical service operation domain oversees the practical execution of services, including resource dispatch and logistics, physical service operations, and service quality feedback, ensuring efficient and effective service delivery.
This comprehensive DT framework provides a robust technical foundation for the intelligent, predictive, and systemic optimization of central air conditioning low-carbon service ecosystems. It ensures seamless, end-to-end integration from data acquisition to intelligent decision-making and physical execution, significantly enhancing the adaptability, efficiency, and value of low-carbon services in complex and dynamic environments.
3.3. Low-Carbon Service Demand Analysis and Prioritization
This initial stage translates the building’s low-carbon objectives into quantifiable and prioritizable demands. This is achieved through an integrated, multi-stage approach. The process begins by constructing a low-carbon service value model, grounded in the Triple Bottom Line (TBL) theory (as shown in Figure 4). A key aspect of this model is the explicit inclusion of a social dimension that is fundamentally occupant-centric, capturing value propositions related to human comfort, health, and satisfaction. Subsequently, to handle the hybrid uncertainties in expert judgments, the rough fuzzy DEMATEL method [66] is employed to quantify the importance of these value propositions. They are then decomposed into actionable service demands using a three-dimensional (Energy Scenario Intelligence) model, which systematically captures the intricate elements of low-carbon service demands (Figure 5). This model defines operational scenarios as dynamic contexts influenced by both internal factors (e.g., user behavior) and external variables, such as weather variations and fluctuating energy prices, which the DT layer is designed to monitor and predict. Finally, following a systematic elicitation pathway (illustrated in Figure 6), the elicited demands are prioritized using the rough fuzzy Best Worst Method (BWM) [67], selected for its robustness. The output is a rigorously derived set of prioritized demands that forms the scientific basis for the subsequent design.

Figure 4.
Low-Carbon Value Model for Central Air Conditioning Services.
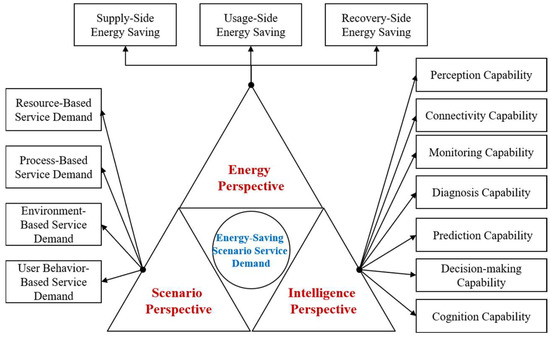
Figure 5.
Demand Elements of Low-Carbon Central Air Conditioning Service Ecosystem.
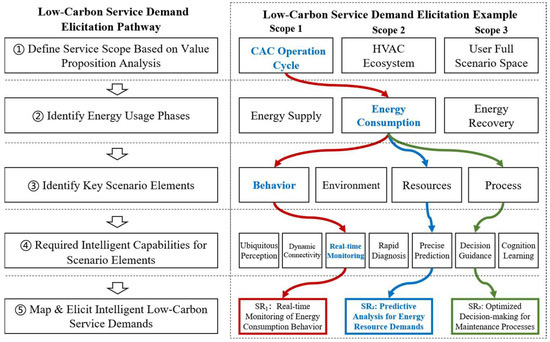
Figure 6.
Low-Carbon Service Demand Elicitation Pathway and example.
3.4. Cyber Physical Service Component Modeling and Co-Intelligence Relationship Analysis
This stage, representing Phase 2 of the overall framework (Figure 1), focuses on modeling the intricate structure of low-carbon service systems by identifying their constituent components and quantifying their interdependencies through a novel co-intelligence relationship analysis, all within a cyber physical service blueprinting framework. This process comprises the following steps:
Step 1: Service Component Identification.
Based on the prioritized low-carbon service demands derived in Section 3.3, individual service components within the low-carbon CAC ecosystem are identified. These components include both physical assets (e.g., HVAC units, sensors, control devices) and cyber entities (e.g., AI algorithms, data platforms, user interfaces), essential for delivering low-carbon service functions.
Step 2: Cyber–Physical Service Blueprinting.
To comprehensively represent the low-carbon service system, a cyber physical service blueprinting methodology is employed. This approach extends traditional service blueprinting by explicitly integrating cyber physical elements (e.g., smart devices, DTs, data flows, algorithms) alongside physical resources, service processes, and customer interactions. This multi-dimensional blueprint allows for a holistic understanding of how service components, residing in both physical and cyber spaces, interact to deliver low-carbon value. It serves as a visual tool to map service nodes, resource flows, data exchange, and dynamic scene data, crucial for identifying and analyzing component relationships.
Step 3: Co-Intelligence Relationship Quantification.
Within complex low-carbon service systems, the interactions among service components (e.g., sensors, control algorithms, HVAC units) extend beyond simple data exchange or structural dependency. Drawing inspiration from the concepts of system synergy [18] and collaborative intelligence [19], this study posits the existence of intricate co-intelligence relationships. These relationships are defined as the synergistic, multi-dimensional interactions that drive emergent system-level performance toward low-carbon objectives.
To move beyond qualitative interdependency analysis, a novel quantitative methodology is proposed to measure the co-intelligence relationship () between any two service components i and j. This metric is not a mere relabeling but a specific operationalization of synergy in a cyber physical context. It is formulated as a weighted sum of three primary relationship types: Resource Dependency (), Directed Overlap in Processes (), and Direct Functional Correlation (). This quantification is crucial, as it provides the weighted inputs necessary for the network-based modularization algorithms that follow. The overall co-intelligence relationship is defined as:
where , and are weighting coefficients determined through expert judgment (e.g., AHP or Entropy method), satisfying .
This quantitative model is critical, as it transforms qualitative system knowledge into a mathematical construct—a weighted adjacency matrix—that enables the application of network theory for modularization. (The detailed quantification scales for each relationship type are provided in Supplementary Materials S1, Tables S1–S3).
Step 4: Co-Intelligence Network Model Construction.
By systematically evaluating and assigning values to these three types of relationships for all pairs of service components, a comprehensive co-intelligence relationship matrix is constructed. This matrix forms the weighted adjacency matrix for the subsequent network analysis, representing the strength of synergistic interactions between components. The network representation, denoted as , effectively captures the intricate interdependencies:
Here, is the set of service component nodes, is the set of edges representing interactions between components, and is the set of weights corresponding to the strength of these interactions, where . This step results in the co-intelligence relationship matrix (), which serves as the fundamental input for subsequent module generation.
3.5. Co-Intelligence Driven Service Module Generation and Optimization
This stage, representing Phase 3 of the overall framework (Figure 1), leverages the quantified co-intelligence relationships to generate optimal service modules and subsequently evaluate their performance. This process integrates network representation, an improved module generation algorithm, and a robust solution evaluation methodology.
3.5.1. Network Representation and Improved Module Generation
The generation of optimal service modules is achieved by constructing a weighted complex network model based on quantified co-intelligence relationships and applying an improved clustering algorithm. This process involves the following steps:
Step 1: Network Model Application and Algorithm Initialization.
Service components and their co-intelligence relationships are represented as a weighted complex network. In this model, individual service components are represented as nodes, and their synergistic ‘co-intelligence’ interactions are represented as edges. The weights of these edges signify the strength of these relationships (), crucial for subsequent modularization. The network representation, , effectively captures the intricate interdependencies.
Step 2: Initialize Algorithm and Compute Co-Intelligence Betweenness Centrality.
The co-intelligence network model () serves as the input for module generation. The improved Girvan Newman (GN) algorithm is applied to this network. The algorithm begins by identifying natural communities by iteratively removing edges with the highest betweenness centrality [75]. For a given edge connecting nodes and , its betweenness centrality is classically defined as:
where is the total number of shortest paths from node to node , and is the number of those paths that pass through edge .
A significant limitation of the standard GN algorithm is that it is purely topology-driven, calculating shortest paths without considering edge weights. This makes it suboptimal for networks where edge weights carry important semantic meaning, such as the functional synergy represented in the co-intelligence network.
To address this limitation, a key innovation of the proposed approach is to adapt the algorithm to be semantically driven. This is achieved by incorporating the co-intelligence relationship as the inverse of the edge weight () in the shortest path calculations. Consequently, paths with higher co-intelligence are treated as shorter. This adaptation ensures that the iterative removal process prioritizes edges that may be structurally central but are functionally weak. The resulting partitions are therefore more likely to represent functionally cohesive modules rather than merely structurally dense clusters, making the approach theoretically more suitable for the specific problem context of this study.
Step 3: Iterative Edge Removal and Modularity Calculation.
Edges are iteratively removed from the network based on their computed co-intelligence betweenness centrality (e.g., removing the edge(s) with the highest centrality at each step, or applying specific rules incorporating co-intelligence values). After each removal, the modularity () of the current network partition is calculated. Modularity quantifies the strength of a division of a network into modules. For a network with modules and edges, is defined as:
where is the weight of the edge between and (corresponding to from ), is the sum of weights of edges attached to node , and represents module . The process continues until all edges are removed, generating a hierarchy of network partitions.
Step 4: Optimal Modular Solution Identification.
The partition with the maximum value is identified as the optimal modular solution. This solution represents the best balance between internal component synergy and external module independence, leading to optimal low-carbon service module generation. This optimal modularity point is often found by analyzing the value curve over iteration steps. The result of this process is a set of generated service module solutions (partitions), representing various possible ways to modularize the low-carbon service system, which are then subject to evaluation.
3.5.2. Service Module Solution Evaluation
Following the generation of service modules, a comprehensive evaluation is performed to identify the optimal solution under uncertainty. This is a significant challenge due to the conflicting nature of evaluation criteria. To address this, the Interval Type-2 Fuzzy TOPSIS (IT2FS-TOPSIS) algorithm is employed for its theoretical capacity to model higher-order uncertainties.
The evaluation is conducted against five critical dimensions derived from the prioritized low-carbon demands: Service Adaptability (SA), measuring flexibility; Inter-module Independence (IMI), quantifying decoupling; Intra-module Synergy (IMS), assessing internal cohesiveness; Deployment Simplicity (DS), reflecting ease of implementation; and Economic Efficiency (EE), evaluating lifecycle cost-effectiveness.
The IT2FS-TOPSIS evaluation process for low-carbon service modularization solutions is systematically performed through the following steps:
Step 1: Construct the Interval Type-2 Fuzzy Decision Matrix.
For each modular solution and each evaluation criterion , expert judgments are collected using linguistic terms. These linguistic terms are then mapped to specific Interval Type-2 Fuzzy Numbers (IT2 FNs) according to a pre-defined scale, as presented in Table 2. An IT2 FN, denoted as , is typically represented as a trapezoidal or triangular fuzzy number with fuzzy boundaries, often simplified as:
where is the lower triangular or trapezoidal membership function and is the upper triangular or trapezoidal membership function.
Table 2.
Linguistic Evaluation Terms for Solutions and Corresponding Interval Type-2 Fuzzy Numbers (IT2 FNs).
The decision matrix is then constructed, where each element represents the performance of solution under criterion as an IT2 FN:
Each itself is an IT2 FN, for example,
Step 2: Determine Criteria Weights.
The weights for each criterion are determined by integrating subjective expert judgments and objective data-driven insights. For the subjective determination of criteria weights, experts also provide linguistic judgments on the importance of each criterion. These judgments are then translated into IT2 FNs based on the scale provided in Table 3. Subjective weights can be derived using methods like Interval Type-2 Fuzzy AHP to account for expert vagueness.
Table 3.
Linguistic Importance Terms for Weights and Corresponding Interval Type-2 Fuzzy Numbers (IT2 FNs).
Objective weights, denoted as , can be quantified using the Information Gain Ratio, which assesses a criterion’s discriminative power based on the entropy of the dataset (all solutions):
where is the entropy:
Here, is the proportion of samples belonging to class . For objective weighting of modularization criteria, information gain ratio is particularly suitable as it counters the bias of standard information gain towards attributes with many values.
The final combined weight for each criterion is then obtained by fusing the subjective weight (as an IT2 FN from IT2F-AHP) and the objective weight :
This normalization ensures is also an IT2 FN or a defuzzified value.
Step 3: Normalize and Construct the Weighted Interval Type-2 Fuzzy Decision Matrix.
The decision matrix is normalized using an appropriate normalization method for IT2 FNs. The normalized matrix norm is then weighted by the criterion weights to form the weighted decision matrix :
where denotes fuzzy multiplication.
Step 4: Determine the Interval Type-2 Fuzzy Positive Ideal Solution (IT2FPIS) and Negative Ideal Solution (IT2FNIS).
The IT2FPIS () and IT2FNIS () are determined for each criterion. For benefit criteria (larger values are better), the IT2FPIS is the maximum IT2 FN, and for cost criteria (smaller values are better), it is the minimum. The opposite holds for IT2FNIS.
where for benefit criteria, and cost criteria.
where for benefit criteria, and cost criteria.
Step 5: Calculate Distances to Ideal Solutions.
The distance of each solution from the IT2FPIS () and IT2FNIS () is calculated using a distance metric for IT2 FNs, such as a modified Hausdorff distance. For two IT2 FNs and , their simplified distance can be calculated as:
Then, the distances for each solution are:
Step 6: Calculate the Closeness Coefficient and Rank Solutions.
The Closeness Coefficient () for each solution is calculated based on its distances to the IT2FPIS and IT2FNIS:
A higher value indicates that the solution is closer to the IT2FPIS and further from the IT2FNIS, signifying a better performing low-carbon service module solution. The solutions are then ranked in descending order of their values to identify the optimal modular configuration.
The outcome of this comprehensive evaluation is the optimal modular service solution, which represents the most suitable low-carbon service system architecture based on its performance across defined criteria under uncertainty.
4. Case Study: Intelligent Office Building
To rigorously validate the effectiveness and generalizability of the proposed DT-driven framework for low-carbon service design and modularization, a comprehensive case study was conducted in a newly constructed intelligent office building. This study meticulously demonstrates the framework’s application within a complex building environment, focusing on systematically identifying and quantifying its low-carbon value propositions and specific service demands. Furthermore, the derived design solutions, informed by the framework, are analyzed to showcase how they achieve projected low-carbon objectives and optimize performance. This case study specifically highlights the pivotal role of DT technology as a core enabler in such complex building contexts, supporting pervasive sensing, intelligent control, and optimized decision-making to realize advanced low-carbon service demands.
4.1. Office Building Overview and Low-Carbon Objectives
The proposed framework was validated in a newly constructed intelligent R&D office building in Zhuhai, China (120,000 m2), which is designed as a nearly zero-carbon building. The building’s energy profile is dominated by the Central Air Conditioning (CAC) system (approx. 65% of electricity load). The project’s low-carbon objectives are rigorously defined by the national standard GB/T 51350-2019, mandating a total equivalent electricity consumption below 35 kWh/(m2·a) and an integrated building energy saving rate of ≥60%.
4.2. Framework Application and Results
4.2.1. Low-Carbon Value Proposition and Service Demand Analysis
In the initial phase, the methodology from Section 3.3 was applied to derive prioritized service demands for the intelligent office building. A multi-stakeholder engagement process, involving workshops and interviews with asset owners, facility managers, and tenants, was conducted to identify key low-carbon value propositions. This process captured diverse needs, from the facility managers’ emphasis on predictive maintenance to the tenants’ desire for enhanced comfort and air quality. These multi-faceted inputs formed the foundation for the demand analysis.
The subsequent application of the three-dimensional (Energy Scenario Intelligence) model and the rough fuzzy Best Worst Method [66] yielded the top-priority service demands for the building. The analysis identified advanced predictive analytics for energy consumption and holistic, cross-system diagnostic capabilities as the highest-priority service demands. This data-driven result ensured that all subsequent design and modularization efforts were strategically focused on objectives with the highest potential impact.
4.2.2. Cyber–Physical Service Component Modeling and Co-Intelligence Relationship Analysis Results
Following the demand analysis, the constituent components of the building’s low-carbon service system were identified. A comprehensive set of 32 distinct service components, spanning both physical devices (e.g., HVAC units, sensors) and cyber functionalities (e.g., control algorithms, analytics modules), were cataloged. The overall system architecture, illustrating the integration of these components, is conceptualized in Figure 7.
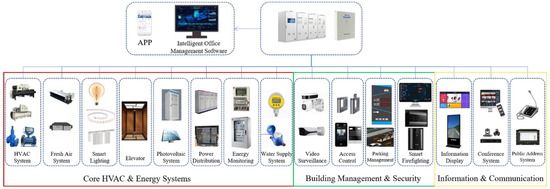
Figure 7.
System Architecture of the Intelligent Office Building Low-Carbon Service Ecosystem for Demand Realization. The Chinese characters are for illustration only.
To facilitate a focused co-intelligence analysis, a representative subset of 20 key components was strategically selected. This subset, detailed in Table 4, prioritizes components central to the building’s low-carbon performance and exhibiting diverse interaction types.
Table 4.
Selected Office Building Service Components for Co-Intelligence Analysis.
The co-intelligence relationships () between these selected components were then quantitatively determined using the methodology from Section 3.4. This analysis revealed critical interactions. For instance:
Resource Dependency: A high dependency was quantified between the HVAC Control Algorithm (OBC_C5) and physical units like the Chiller (OBC_C1).
Directed Overlap in Processes: The output from the CO2 Sensor (OBC_C10) was found to directly influence the control logic of the Air Handling Unit (OBC_C3).
Direct Functional Correlation: An inherent functional link was identified between the Fault Diagnosis System (OBC_C16) and the Predictive Maintenance Module (OBC_C15).
These quantified relationships formed the comprehensive weighted adjacency matrix, which serves as the direct input for the subsequent network analysis and modularization. A representative excerpt of this matrix is presented in Table 5.
Table 5.
Illustrative Co-Intelligence Relationship Matrix () for Selected Office Building Components.
4.2.3. Co-Intelligence Driven Service Module Generation and Optimization Results
The co-intelligence relationship matrix was transformed into a weighted complex network and analyzed using the improved GN algorithm (as detailed in Section 3.5.1). The analysis identified a robust modular partition with a maximum Q value of 0.62, yielding four distinct service module solutions for evaluation, which are detailed in Table 6.
Table 6.
Selected Low-Carbon Service Module Solutions for the Intelligent Office Building.
These candidate solutions were then evaluated using the Interval Type-2 Fuzzy TOPSIS (IT2FS-TOPSIS) algorithm against the five predefined critical dimensions. Four domain experts provided linguistic judgments for each solution. These qualitative judgments were subsequently converted into Interval Type-2 Fuzzy Numbers (IT2 FNs) to form the fuzzy decision matrix, the full details of which are presented in Supplementary Materials S2. After the criteria weights were determined through a hybrid approach, the standard IT2FS-TOPSIS procedure was followed to calculate the final ranking.
The evaluation results, summarized in Table 7, show that Solution A4 (partitioning the system into five modules) achieved the highest Closeness Coefficient (0.9137). This quantitative outcome indicates that Solution A4 represents the most desirable modular architecture, as it optimally balances the trade-offs across all defined objectives under uncertainty. This result demonstrates the framework’s capability to provide a clear, data-driven ranking of complex modular design alternatives.
Table 7.
Results of IT2FS-TOPSIS Evaluation for Office Building Modular Solutions.
4.3. Digital Twin-Powered Low-Carbon Service Ecosystem Realization and Key Performance
The design and optimization outcomes of the intelligent office building’s low-carbon service ecosystem are presented, showcasing the practical application and realization of the high-priority low-carbon service demands identified in Section 4.2.1. The selected A4 modular solution directly guided the architectural design of the DT platform, translating abstract modules into concrete, interoperable functionalities within the building’s digital mirror.
The Digital Twin platform serves as the central dispatch and control center, representing the comprehensive realization of the low-carbon service framework. The primary interface for this integrated DT platform is a comprehensive dashboard, visually represented in Figure 8. This multi-screen overview showcases the platform’s capability to provide real-time monitoring, intelligent control, and data analytics across all key domains of the building, including energy, environment, and operations. This centralized cockpit directly reflects the integrated nature of the service modules derived from our framework, enabling facility managers to holistically visualize and manage the building’s low-carbon performance.
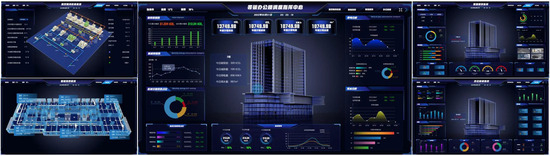
Figure 8.
Integrated Digital Twin Dispatch and Control Center for Intelligent Office Buildings. The Chinese characters are for illustration only.
This system directly realizes the optimized service modules identified by our framework, translating the theoretical modular structure into tangible operational functionalities. For example:
- Smart HVAC & Indoor Environment Module (from A4): Realized through dedicated dashboards for HVAC system overview, chiller plant efficiency monitoring, distributed fresh air system control, and real-time display of temperature, humidity, and CO2 concentrations by zone.
- Energy & Carbon Management Module (from A4): Implemented via comprehensive energy monitoring interfaces for total energy, electricity, and water consumption, along with detailed solar PV generation and carbon reduction dashboards.
- Smart Occupant Experience Module (from A4): Supported by smart lighting control interfaces, including dimming and scene linkages, and elevator monitoring with energy recovery visualization. This module directly materializes the human-centered design principles integrated into the framework’s value model, translating abstract demands for comfort and satisfaction into tangible, adaptive environmental controls for the end-users.
- Integrated Operations & Security Module (from A4): Managed through a unified O&M cockpit for work orders, inspections, and fault diagnosis, alongside integrated security and fire safety monitoring dashboards.
Further demonstrating the platform’s advanced capabilities and the achievement of low-carbon objectives, Figure 9 displays the 3D building model overlaid with real-time energy consumption data and a detailed side panel. This visualization highlights specific energy performance metrics, such as monthly consumption trends, regional energy costs, and breakdown by system, allowing for granular analysis and verification of energy saving strategies. This direct, visual validation confirms how the DT facilitates data-driven decision-making and operational optimization.
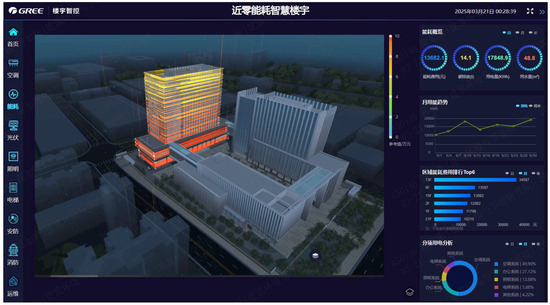
Figure 9.
Three-Dimensional Visualized Digital Twin Interface for Building Energy Management and Monitoring. The Chinese characters are for illustration only.
The successful implementation of the modular DT-driven framework is validated by the quantitative achievement of the project’s predefined low-carbon objectives. The key performance indicators (KPIs), derived from the actual operation of the intelligent office building and continuously verified through the DT platform, demonstrate the system’s efficacy and are summarized in Table 8.
Table 8.
Summary of Key Performance Indicators (KPIs) in the Zhuhai Office Building Case Study.
As shown in Table 8, the implemented system not only met but substantially surpassed its design targets, most notably achieving an integrated building energy saving rate of 74.29% against a goal of ≥60%. These performance achievements translate directly into significant environmental and economic benefits, including an estimated annual electricity saving of 1.173 million kWh and a carbon reduction of 618.5 tCO2. This quantitative evidence, continuously monitored by the DT platform, provides strong validation for the practical effectiveness of the proposed framework in a real-world scenario.
5. Discussion
5.1. Digital Twin’s Enabling Role in Advanced Low-Carbon Services
A central finding of this research is the indispensable role of DT technology in enabling advanced low-carbon services, transcending the limitations of conventional systems in several critical aspects:
- From Real-time Sensing to Data-Driven Decision Support and Prediction: While traditional sensor networks and IoT platforms primarily provide real-time data, the DT framework elevates this data to a core component of the decision-making process itself (as illustrated in Figure 3). During the initial stages of demand analysis and prioritization, real-time data on energy consumption, occupancy, and environmental parameters are not merely sensed but are integrated to dynamically inform the identification and weighting of service demands. This transforms the inputs for MCDM methods like rough fuzzy BWM from being reliant on static expert opinion to being continuously validated by objective operational evidence. Furthermore, by constructing accurate digital models, the DT enables precise prediction of not only internal system dynamics such as equipment degradation and energy consumption trends, but also the system’s response to external volatilities like weather variations and energy price fluctuations. This comprehensive predictive understanding ensures that design decisions are robust and forward-looking.
- From Localized to System-Level Synergy: Conventional systems typically perform optimization at the level of individual equipment or subsystems. DT, however, facilitates global synergistic optimization across multiple subsystems (e.g., HVAC, lighting, elevators) through multi-energy flow modeling and simulation. This holistic view is crucial for defining co-intelligence relationships and forming efficient service modules that optimize overall system performance, far exceeding the capabilities of traditional isolated controls.
- From Ambiguous Judgment to Predictive and Quantitative Evaluation: Assessing low-carbon performance frequently involves complex and uncertain factors, often reliant on ambiguous expert judgments. The DT addresses this by providing precise quantitative metrics through high-fidelity mapping and real-time tracking. More critically, during the module evaluation stage, the DT functions as a predictive simulation engine. Instead of depending solely on abstract linguistic ratings for the IT2FS-TOPSIS analysis, each candidate modular solution can be virtually implemented and tested. The platform simulates their performance to generate predictive quantitative metrics (e.g., lifecycle energy cost, carbon emissions). These metrics then serve as robust, data-driven inputs for the decision matrix, directly enhancing the objectivity and robustness of the final multi-criteria decision. This transition from subjective judgment to data-driven, predictive evaluation is a key mechanism through which DT enhances the entire decision-making lifecycle.
5.2. Generalizability of the Proposed Framework
The DT-driven framework for low-carbon service design and modularization proposed in this study, its effectiveness verified through the case study of an intelligent office building, offers the potential for broad applicability to diverse central air conditioning user scenarios. This adaptability stems from its:
Universal Methodological Foundation: The framework is built upon established theoretical foundations and quantitative tools, including the TBL theory, MCDM methods, and the novel co-intelligence approach. These methodological principles are independent of specific application scenarios and can be flexibly applied to any decision problem requiring the balancing of multiple objectives and the handling of uncertainties and complex relationships, particularly in service system design and modularization.
Adaptable Service Design and Modularization Model: The framework’s approach, encompassing value proposition and demand analysis, component modeling, co-intelligence analysis, and the full cycle of module generation and evaluation, is universally applicable. While specific energy flows, physical space layouts, component types, and user behavior patterns may vary across different scenarios, the framework can be adapted by adjusting specific input elements and parameters. The emphasis of the framework would simply shift based on the context: in residential settings, it would prioritize personalized comfort and occupant schedules; in hospitals, the focus would move to critical parameters like stringent indoor air quality and energy reliability; and in industrial parks, the co-intelligence analysis would center on the synergy between manufacturing process loads and the central HVAC system. This inherent adaptability ensures that the framework can deliver tailored, context-specific low-carbon service solutions across a diverse range of building typologies.
Generic Enabling Capability of DT Technology: As the core enabling technology of the framework, DT’s capabilities for constructing digital replicas of physical entities, real-time monitoring, predictive simulation, and optimized decision-making are universal. Regardless of the building type or service domain, DT can provide foundational data support and intelligent decision-making capabilities; it merely requires tailored modeling and data integration specific to the particular physical system and its operational context. This generic capability allows the framework to leverage DT for diverse low-carbon service design and modularization challenges.
5.3. Economic and Policy Implications
The findings of this study, while primarily technical, offer significant practical implications for both business stakeholders and policymakers, particularly in translating long-term carbon neutrality goals into actionable strategies.
From an economic perspective, the rigorous validation in the case study substantiates the tangible financial benefits derived from the proposed modularization. The inclusion of EE as a primary evaluation criterion is justified by the outcomes: the estimated annual electricity saving of 1.173 million kWh directly translates into significant reductions in operational expenditure (as shown in Table 8). While a full life-cycle cost analysis was beyond the scope of this study’s validation, these findings strongly reinforce the business case for adopting such advanced service design frameworks, demonstrating that data-driven modularization yields substantial financial returns alongside its carbon reduction benefits.
These demonstrable economic benefits, in turn, provide a strong foundation for several policy implications. First, the framework’s dynamic, performance-based approach highlights a potential limitation in current green building codes, which often rely on static design metrics. The results suggest that policies could evolve to incentivize DT-based lifecycle carbon performance monitoring. Second, the proposed modularization methodology offers a conceptual basis for developing new CAC industry standards that could accelerate the sector’s transition to a service-oriented model, aligning with broader industrial policies [12]. Finally, the framework’s quantitative nature could enhance the efficacy of market-based instruments like carbon trading. The ability to provide verifiable, granular data on carbon reductions offers a more robust basis for carbon credit allocation, thereby more accurately rewarding investments in high-efficiency service solutions [10,74].
6. Conclusions
This study presented and validated a novel DT-driven framework for low-carbon service design and modularization in CAC ecosystems. The main contribution is a comprehensive methodology that systematically translates high-level sustainability objectives into optimal service modules.
Methodologically, the framework makes two key innovations. First, it introduces a quantitative co-intelligence relationship analysis to model the complex synergistic interactions among cyber physical service components, which provides a semantic basis for an improved GN algorithm for module generation. Second, it employs a robust Interval Type-2 Fuzzy TOPSIS algorithm for the comprehensive evaluation of module solutions, effectively handling the high-level uncertainties inherent in the decision-making process. The framework also explicitly elucidates the critical enabling role of DT technology across the entire service design lifecycle.
The framework’s effectiveness and generalizability were verified through a comprehensive case study. This validation demonstrated its capability to deliver significant energy savings and carbon reductions. The findings offer valuable theoretical insights for sustainable service system design. Furthermore, they provide practical guidance for engineers and managers developing advanced low-carbon service ecosystems.
7. Limitations and Future Research
Despite the contributions of this study, several limitations delineate a clear roadmap for future research. First, while the framework was demonstrated on a sophisticated, real-time DT platform, the application was confined to a single case study during its initial operational phase. This limits the generalizability of the findings. Future research should therefore focus on long-term performance tracking of the current system and on extending the framework’s application to diverse building types (e.g., hospitals, industrial parks) to verify its scalability and adaptability.
Second, the current implementation relies on expert judgments for the MCDM models, representing a limited and static dataset. A formal sensitivity analysis was also not conducted. Future work should aim to enhance the framework’s autonomy by applying machine learning for predictive and dynamic modularization. For instance, leveraging algorithms like Reinforcement Learning (RL) could enable the framework to learn directly from the DT platform’s data streams and autonomously adapt modular configurations over time [45]. This methodological enhancement should also be complemented by a rigorous quantitative comparison of the improved GN algorithm against other clustering methods.
Finally, broader research is needed to address barriers to industrial adoption. This includes tackling technical issues like data governance and standardization for multi-building DT deployments and extending the framework to district-level energy systems. Such an extension would also require integrating more sophisticated dynamic models to account for external factors like renewable energy intermittency and evolving market and policy regulations.
Supplementary Materials
The following supporting information can be downloaded at: https://www.mdpi.com/article/10.3390/su17219877/s1, Supplementary Material S1: Quantification Scales for Co-Intelligence Relationships; Table S1: Quantification Scale for Resource Dependency; Table S2: Quantification Scale for Directed Overlap in Processes; Table S3: Quantification Scale for Direct Functional Correlation; Supplementary Material S2: IT2 Fuzzy Decision Matrix; Table S4: IT2 Fuzzy Decision Matrix for Office Building Modular Solutions.
Author Contributions
Y.C.: Methodology, Software, Validation, Formal Analysis, Investigation, Data Curation, Writing—Original Draft Preparation, Visualization. X.M.: Conceptualization, Validation, Resources, Writing—Review and Editing, Supervision, Project Administration. All authors have read and agreed to the published version of the manuscript.
Funding
This research received no external funding.
Institutional Review Board Statement
This study is waived for ethical review as it involved expert interviews on non-sensitive, professional topics, where participants were not from a vulnerable population and no personal data was collected according to relevant Chinese regulations.
Informed Consent Statement
Informed consent for participation was obtained from all subjects involved in the study.
Data Availability Statement
The original contributions presented in this study are included in the article/supplementary material. Further inquiries can be directed to the corresponding author.
Conflicts of Interest
Yong Cao was employed by the company GREE Electric Appliances, Inc. of Zhuhai. The remaining author (Xinguo Ming) declare that the research was conducted in the absence of any commercial or financial relationships that could be construed as a potential conflict of interest.
References
- Zhao, X.; Ma, X.; Chen, B.; Shang, Y.; Song, M. Challenges toward carbon neutrality in China: Strategies and countermeasures. Resour. Conserv. Recycl. 2022, 176, 105959. [Google Scholar] [CrossRef]
- Zhang, S.; Cai, W.; Zheng, X.; Lv, X.; An, K.; Cao, Y.; Cheng, H.S.; Dai, J.; Dong, X.; Fan, S. Global readiness for carbon neutrality: From targets to action. Environ. Sci. Ecotechnol. 2025, 25, 100546. [Google Scholar] [CrossRef] [PubMed]
- Pitre, V.; La, H.; Bergerson, J.A. Impacts of alternative fuel combustion in cement manufacturing: Life cycle greenhouse gas, biogenic carbon, and criteria air contaminant emissions. J. Clean. Prod. 2024, 475, 143717. [Google Scholar] [CrossRef]
- Palafox-Alcantar, P.; McElroy, C.; Trotter, P.; Khosla, R.; Thomas, A.; Karutz, R. Servitization for the energy transition: The case of enabling cooling-as-a-service (CaaS). J. Clean. Prod. 2024, 482, 144190. [Google Scholar] [CrossRef]
- Speich, M.; Ulli-Beer, S. Applying an ecosystem lens to low-carbon energy transitions: A conceptual framework. J. Clean. Prod. 2023, 398, 136429. [Google Scholar] [CrossRef]
- Wang, Q.; Yin, Y.; Chen, Y.; Liu, Y. Carbon peak management strategies for achieving net-zero emissions in smart buildings: Advances and modeling in digital twin. Sustain. Energy Technol. Assess. 2024, 64, 103661. [Google Scholar] [CrossRef]
- He, B.; Mao, H. Digital twin-driven product sustainable design for low carbon footprint. J. Comput. Inf. Sci. Eng. 2023, 23, 60805. [Google Scholar] [CrossRef]
- He, B.; Mao, H.; Li, T.; Xiao, J. A closed-loop digital twin modeling method integrated with carbon footprint analysis. Comput. Ind. Eng. 2023, 182, 109389. [Google Scholar] [CrossRef]
- Liao, H.; Zhou, Z.; Liu, N.; Zhang, Y.; Xu, G.; Wang, Z.; Mumtaz, S. Cloud-edge-device collaborative reliable and communication-efficient digital twin for low-carbon electrical equipment management. IEEE Trans. Ind. Inform. 2022, 19, 1715–1724. [Google Scholar] [CrossRef]
- Ma, J.; Si, F.; Zhang, Q.; Huijiang. Evolution delayed decision game based on carbon emission and capacity sharing in the Chinese market. Int. J. Prod. Res. 2022, 61, 6675–6690. [Google Scholar] [CrossRef]
- Ma, J.; Wang, Z. Optimal pricing and complex analysis for low-carbon apparel supply chains. Appl. Math. Model. 2022, 111, 610–629. [Google Scholar] [CrossRef]
- Ma, J.; Hou, Y.; Wang, Z.; Yang, W. Pricing strategy and coordination of automobile manufacturers based on government intervention and carbon emission reduction. Energy Policy 2021, 148, 111919. [Google Scholar] [CrossRef]
- Wang, Y.X.; Chen, J.J.; Zhao, Y.L.; Xu, B.Y. Incorporate robust optimization and demand defense for optimal planning of shared rental energy storage in multi-user industrial park. Energy 2024, 301, 131721. [Google Scholar] [CrossRef]
- Meng, Q.; Xu, J.; Luo, F.; Jin, X.; Xu, L.; Yao, W.; Jin, S. Collaborative and effective scheduling of integrated energy systems with consideration of carbon restrictions. IET Gener. Transm. Distrib. 2023, 17, 4134–4145. [Google Scholar] [CrossRef]
- Iqbal, M.; Ma, J.; Ahmad, N.; Ullah, Z.; Ahmed, R.I. Uptake and Adoption of Sustainable Energy Technologies: Prioritizing Strategies to Overcome Barriers in the Construction Industry by Using an Integrated AHP-TOPSIS Approach. Adv. Sustain. Syst. 2021, 5, 2100026. [Google Scholar] [CrossRef]
- Iqbal, M.; Fan, Y.; Ahmad, N.; Ullah, I. Circular economy solutions for net-zero carbon in China’s construction sector: A strategic evaluation. J. Clean. Prod. 2025, 504, 145398. [Google Scholar] [CrossRef]
- Iqbal, M.; Wang, Z.; Ahmed, N.; Ahmad, M. From waste to treasure: Transforming construction waste into concrete masonry blocks: Challenges and solutions for environmental sustainability in emerging economies. Eng. Constr. Archit. Manag. 2025, 1–28, ahead-of-print. [Google Scholar] [CrossRef]
- Chunhua, C.; Li, Z.; Chao, L.; Shi, X. The Synergetic & Symbiosis Theory: A New Management Paradigm in the Digital Age. Foreign Econ. Manag. 2022, 44, 68–83. [Google Scholar]
- Schleiger, E.; Mason, C.; Naughtin, C.; Reeson, A.; Paris, C. Collaborative Intelligence: A scoping review of current applications. Appl. Artif. Intell. 2024, 38, 2327890. [Google Scholar] [CrossRef]
- Chiu, M.-C.; Chu, C.-Y.; Kuo, T.C. Product service system transition method: Building firm’s core competence of enterprise. Int. J. Prod. Res. 2019, 57, 6452–6472. [Google Scholar] [CrossRef]
- Li, H.; Zhao, J.; Cao, Y.; Su, L.; Zhao, Z.; Zhang, Y. Servitization and product service system: A literature review on value creation. Technol. Forecast. Soc. Change 2024, 208, 123724. [Google Scholar] [CrossRef]
- Zheng, P.; Wang, Z.; Chen, C.-H.; Pheng Khoo, L. A survey of smart product-service systems: Key aspects, challenges and future perspectives. Adv. Eng. Inform. 2019, 42, 100973. [Google Scholar] [CrossRef]
- Ren, M.; Zheng, P. Towards smart product-service systems 2.0: A retrospect and prospect. Adv. Eng. Inform. 2024, 61, 102466. [Google Scholar] [CrossRef]
- Kuhlenkötter, B.; Wilkens, U.; Bender, B.; Abramovici, M.; Süße, T.; Göbel, J.; Herzog, M.; Hypki, A.; Lenkenhoff, K. New Perspectives for Generating Smart PSS Solutions—Life Cycle, Methodologies and Transformation. Procedia CIRP 2017, 64, 217–222. [Google Scholar] [CrossRef]
- Wang, Z.; Chen, C.-H.; Li, X.; Zheng, P.; Khoo, L.P. A context-aware concept evaluation approach based on user experiences for smart product-service systems design iteration. Adv. Eng. Inform. 2021, 50, 101394. [Google Scholar] [CrossRef]
- Cui, H.; Gong, L.; Huang, S.; Leng, J.; Zheng, P.; Yan, Y. Cognitive intelligence-enabled requirements elicitation for design optimisation of smart product-service system. J. Eng. Des. 2024, 36, 1982–2006. [Google Scholar] [CrossRef]
- Teigiserova, D.A.; Schraven, D.F. A comprehensive framework for circular product-service systems in infrastructure: Enhancing customer-contractor collaboration. J. Clean. Prod. 2024, 479, 144010. [Google Scholar] [CrossRef]
- Fang, C.; Liu, W.; Lin, H.; Qi, Y.; Tian, X.; Huang, Y.; Wang, S.J. A user-centred collective system design approach for Smart Product-Service Systems: A case study on fitness product design. Des. J. 2024, 27, 410–432. [Google Scholar] [CrossRef]
- Bu, L.; Chen, C.-H.; Ng, K.K.H.; Zheng, P.; Dong, G.; Liu, H. A user-centric design approach for smart product-service systems using virtual reality: A case study. J. Clean. Prod. 2021, 280, 124413. [Google Scholar] [CrossRef]
- Elkington, J. Partnerships from cannibals with forks: The triple bottom line of 21st-century business. Environ. Qual. Manag. 1998, 8, 37–51. [Google Scholar] [CrossRef]
- Ai, X.; Jiang, Z.; Zhang, H.; Wang, Y. Low-carbon product conceptual design from the perspectives of technical system and human use. J. Clean. Prod. 2020, 244, 118819. [Google Scholar] [CrossRef]
- He, B.; Wang, W.; Zhu, X.; Qian, S. Integrate design structure matrix with carbon footprint for product low carbon design. Adv. Eng. Inform. 2023, 56, 102021. [Google Scholar] [CrossRef]
- Xiang, H.; Li, W.; Li, C.; Ling, S.; Wang, H. Optimization configuration model and application of product service system based on low-carbon design. Sustain. Prod. Consum. 2023, 36, 354–368. [Google Scholar] [CrossRef]
- Peng, J.; Li, W.; Li, Y.; Xie, Y.; Xu, Z. Innovative product design method for low-carbon footprint based on multi-layer carbon footprint information. J. Clean. Prod. 2019, 228, 729–745. [Google Scholar] [CrossRef]
- Ma, J.; Si, F.; Zhang, Q.; Wang, Z. Impact of extended warranty service on product pricing in online direct retailers’ competitive market. Energy Econ. 2024, 129, 107217. [Google Scholar] [CrossRef]
- Acharya, S.; Khan, A.A.; Päivärinta, T. Interoperability levels and challenges of digital twins in cyber–physical systems. J. Ind. Inf. Integr. 2024, 42, 100714. [Google Scholar] [CrossRef]
- Groshev, M.; Guimaraes, C.; Martín-Pérez, J.; de la Oliva, A. Toward intelligent cyber-physical systems: Digital twin meets artificial intelligence. IEEE Commun. Mag. 2021, 59, 14–20. [Google Scholar] [CrossRef]
- Wu, C.; Chen, T.; Li, Z.; Liu, W. A function-oriented optimising approach for smart product service systems at the conceptual design stage: A perspective from the digital twin framework. J. Clean. Prod. 2021, 297, 126597. [Google Scholar] [CrossRef]
- Bertoni, M.; Bertoni, A. Designing solutions with the product-service systems digital twin: What is now and what is next? Comput. Ind. 2022, 138, 103629. [Google Scholar] [CrossRef]
- Winter, S.; Quernheim, N.; Arnemann, L.; Bausch, P.; Frick, N.; Metternich, J.; Schleich, B. Using the Integral Digital Twin for Product Carbon Footprint calculation. Clean. Environ. Syst. 2025, 16, 100258. [Google Scholar] [CrossRef]
- Ma, N.; Li, W.; Jiang, C.; Sun, X.; Zhang, J. Development of Digital Twin System for Central Air-Conditioning Based on BIM. J. Build. Eng. 2025, 111, 113171. [Google Scholar] [CrossRef]
- Chen, K.; Zhu, X.; Anduv, B.; Jin, X.; Du, Z. Digital twins model and its updating method for heating, ventilation and air conditioning system using broad learning system algorithm. Energy 2022, 251, 124040. [Google Scholar] [CrossRef]
- Guo, H.; Chen, M.; Mohamed, K.; Qu, T.; Wang, S.; Li, J. A digital twin-based flexible cellular manufacturing for optimization of air conditioner line. J. Manuf. Syst. 2021, 58, 65–78. [Google Scholar] [CrossRef]
- Shang, W.; Liu, J.; Meng, H.; Jia, L.; Dai, X. A RL-based human behavior oriented optimal ventilation strategy for better energy efficiency and indoor air quality. Energy Build. 2025, 345, 116072. [Google Scholar] [CrossRef]
- ElArwady, Z.; Kandil, A.; Afiffy, M.; Marzouk, M. Modeling indoor thermal comfort in buildings using digital twin and machine learning. Dev. Built Environ. 2024, 19, 100480. [Google Scholar] [CrossRef]
- Zhao, X.; Zhang, Y. Integrated management of urban resources toward Net-Zero smart cities considering renewable energies uncertainty and modeling in Digital Twin. Sustain. Energy Technol. Assess. 2024, 64, 103656. [Google Scholar] [CrossRef]
- Hakimi, O.; Liu, H.; Abudayyeh, O. Digital twin-enabled smart facility management: A bibliometric review. Front. Eng. Manag. 2024, 11, 32–49. [Google Scholar] [CrossRef]
- Liu, B.; Zhang, Y.; Zhang, G.; Zheng, P. Edge-cloud orchestration driven industrial smart product-service systems solution design based on CPS and IIoT. Adv. Eng. Inform. 2019, 42, 100984. [Google Scholar] [CrossRef]
- Maleki, E.; Belkadi, F.; Bernard, A. Industrial Product-Service System modelling base on Systems Engineering: Application of sensor integration to support smart services. IFAC Pap. 2018, 51, 1586–1591. [Google Scholar] [CrossRef]
- Shao, S.; Xu, G.; Li, M. The design of an IoT-based route optimization system: A smart product-service system (SPSS) approach. Adv. Eng. Inform. 2019, 42, 101006. [Google Scholar] [CrossRef]
- Mittag, T.; Rabe, M.; Gradert, T.; Kühn, A.; Dumitrescu, R. Building blocks for planning and implementation of smart services based on existing products. Procedia CIRP 2018, 73, 102–107. [Google Scholar] [CrossRef]
- Chang, D.; Gu, Z.; Li, F.; Jiang, R. A user-centric smart product-service system development approach: A case study on medication management for the elderly. Adv. Eng. Inform. 2019, 42, 100979. [Google Scholar] [CrossRef]
- Sahoo, S.K.; Goswami, S.S. A comprehensive review of multiple criteria decision-making (MCDM) methods: Advancements, applications, and future directions. Decis. Mak. Adv. 2023, 1, 25–48. [Google Scholar] [CrossRef]
- Rachman, A.P.; Ichwania, C.; Mangkuto, R.A.; Pradipta, J.; Koerniawan, M.D.; Sarwono, J. Comparison of multi-criteria decision-making methods for selection of optimum passive design strategy. Energy Build. 2024, 314, 114285. [Google Scholar] [CrossRef]
- Felice, F.D.; Petrillo, A. A multiple choice decision analysis: An integrated QFD—AHP model for the assessment of customer needs. Int. J. Eng. Sci. Technol. 2010, 2, 25–38. [Google Scholar] [CrossRef]
- Allen Hu, H.; Chen, S.H.; Hsu, C.W.; Wang, C.; Wu, C.L. Development of sustainability evaluation model for implementing product service systems. Int. J. Environ. Sci. Technol. 2012, 9, 343–354. [Google Scholar] [CrossRef]
- Zhou, L.; Xu, X.; Deng, S. An analytic model for measuring customer’s service preferences in manufacturing supply chain. In Proceedings of the 2008 IEEE International Conference on Service Operations and Logistics, and Informatics, Beijing, China, 12–15 October 2008. [Google Scholar]
- Shimomura, Y.; Sakao, T. A service evaluation method for service/product engineering. In Proceedings of the DS 42: Proceedings of ICED 2007, the 16th International Conference on Engineering Design, Paris, France, 28–31 July 2007. [Google Scholar]
- Pan, J.-N.; Nguyen, H.T.N. Achieving customer satisfaction through product–service systems. Eur. J. Oper. Res. 2015, 247, 179–190. [Google Scholar] [CrossRef]
- Rezaei, J. Best-worst multi-criteria decision-making method. Omega 2015, 53, 49–57. [Google Scholar] [CrossRef]
- Song, W.; Cao, J. A rough DEMATEL-based approach for evaluating interaction between requirements of product-service system. Comput. Ind. Eng. 2017, 110, 353–363. [Google Scholar] [CrossRef]
- Liu, Z.; Ming, X. A framework with revised rough-DEMATEL to capture and evaluate requirements for smart industrial product-service system of systems. Int. J. Prod. Res. 2019, 57, 7104–7122. [Google Scholar] [CrossRef]
- Liu, Z.; Ming, X.; Song, W. A framework integrating interval-valued hesitant fuzzy DEMATEL method to capture and evaluate co-creative value propositions for smart PSS. J. Clean. Prod. 2019, 215, 611–625. [Google Scholar] [CrossRef]
- Zhou, T.; Ming, X.; Han, T.; Bao, Y.; Liao, X.; Tong, Q.; Liu, S.; Guan, H.; Chen, Z. Smart experience-oriented customer requirement analysis for smart product service system: A novel hesitant fuzzy linguistic cloud DEMATEL method. Adv. Eng. Inform. 2023, 56, 101917. [Google Scholar] [CrossRef]
- Chen, Z.; Lu, M.; Ming, X.; Zhang, X.; Zhou, T. Explore and evaluate innovative value propositions for smart product service system: A novel graphics-based rough-fuzzy DEMATEL method. J. Clean. Prod. 2020, 243, 118672. [Google Scholar] [CrossRef]
- Chen, Z.; Ming, X. A rough–fuzzy approach integrating best–worst method and data envelopment analysis to multi-criteria selection of smart product service module. Appl. Soft Comput. 2020, 94, 106479. [Google Scholar] [CrossRef]
- Geum, Y.; Park, Y. Designing the sustainable product-service integration: A product-service blueprint approach. J. Clean. Prod. 2011, 19, 1601–1614. [Google Scholar] [CrossRef]
- Kulcsar, E.; Gyurika, I.G.; Csiszer, T. Network-based–Quality Function Deployment (NB-QFD): The combination of traditional QFD with network science approach and techniques. Comput. Ind. 2022, 136, 103592. [Google Scholar] [CrossRef]
- Barravecchia, F.; Franceschini, F.; Mastrogiacomo, L.; Zaki, M. Research on product-service systems: Topic landscape and future trends. J. Manuf. Technol. Manag. 2021, 32, 208–238. [Google Scholar] [CrossRef]
- Song, W.; Wu, Z.; Li, X.; Xu, Z. Modularizing product extension services: An approach based on modified service blueprint and fuzzy graph. Comput. Ind. Eng. 2015, 85, 186–195. [Google Scholar] [CrossRef]
- Zheng, P.; Chen, C.-H.; Shang, S. Towards an automatic engineering change management in smart product-service systems–A DSM-based learning approach. Adv. Eng. Inform. 2019, 39, 203–213. [Google Scholar] [CrossRef]
- Li, H.; Ji, Y.; Chen, L.; Jiao, R.J. Bi-level coordinated configuration optimization for product-service system modular design. IEEE Trans. Syst. Man Cybern. Syst. 2015, 47, 537–554. [Google Scholar] [CrossRef]
- Fargnoli, M.; Haber, N.; Sakao, T. PSS modularisation: A customer-driven integrated approach. Int. J. Prod. Res. 2019, 57, 4061–4077. [Google Scholar] [CrossRef]
- Zhang, Y.; Qi, H.; Zhou, Y.; Zhang, Z.; Wang, X. Exploring the Impact of a District Sharing Strategy on Application Capacity and Carbon Emissions for Heating and Cooling with GSHP Systems. Appl. Sci. 2020, 10, 5543. [Google Scholar] [CrossRef]
- Girvan, M.; Newman, M.E. Community structure in social and biological networks. Proc. Natl. Acad. Sci. USA 2002, 99, 7821–7826. [Google Scholar] [CrossRef] [PubMed]


Disclaimer/Publisher’s Note: The statements, opinions and data contained in all publications are solely those of the individual author(s) and contributor(s) and not of MDPI and/or the editor(s). MDPI and/or the editor(s) disclaim responsibility for any injury to people or property resulting from any ideas, methods, instructions or products referred to in the content. |
© 2025 by the authors. Licensee MDPI, Basel, Switzerland. This article is an open access article distributed under the terms and conditions of the Creative Commons Attribution (CC BY) license (https://creativecommons.org/licenses/by/4.0/).