Article

Cloud Computing and Green Total Factor Productivity in Urban China: Evidence from a Spatial Difference-in-Differences Approach

1
School of Economics, Xiamen University, Xiamen 361005, China
2
Institute of Western China Economic Research, Southwestern University of Finance and Economics, Chengdu 611130, China
3
Logistics and Management Engineering College, Yunnan University of Finance and Economics, Kunming 650221, China
*
Author to whom correspondence should be addressed.
Sustainability 2025, 17(21), 9828; https://doi.org/10.3390/su17219828
Submission received: 22 September 2025 / Revised: 25 October 2025 / Accepted: 31 October 2025 / Published: 4 November 2025
(This article belongs to the Special Issue Green Economy and Sustainable Economic Development)

Abstract

The rapid development of new-generation information technologies, such as cloud computing, artificial intelligence, big data, and blockchain, is profoundly reshaping production and lifestyles, with regional development patterns. This study employs text analysis to extract the policy adoption timeline of cloud computing from official documents and constructs a quasi-natural experiment framework. First, spatial autocorrelation and hotspot analysis reveal significant spatial dependence in the urban green total factor productivity (GTFP). Accordingly, using panel data of 284 Chinese cities from 2000 to 2023, we apply a spatial difference-in-differences (SDID) model to empirically examine the impact of cloud computing on the urban GTFP. The results show that, first, the adoption of cloud computing significantly enhances the local GTFP, but simultaneously suppresses neighboring cities’ GTFP through the siphon effect, thereby generating negative spatial spillover effects. These findings remain robust across parallel trend tests, placebo tests, and multiple robustness tests. Second, mechanism analysis indicates that improved resource allocation efficiency and strengthened green innovation are the two core channels through which cloud computing promotes GTFP. Third, heterogeneity analysis reveals that cloud computing exhibits stronger siphon effects in smaller cities, generates significant positive spatial spillover effects in coastal regions, and effectively fosters GTFP growth within urban agglomerations, while exerting limited influence on non-agglomerated areas. Moreover, industrial agglomeration further amplifies the positive impact of cloud computing on GTFP. Additionally, from the perspective of regional policies, this study finds that promoting the integrated development of urban agglomerations, reducing administrative monopoly, facilitating free factor mobility, and advancing urban international economic activities are effective pathways to mitigate the siphon effect of cloud computing on the urban GTFP. Based on these findings, this study offers targeted policy recommendations to leverage cloud computing for advancing green and high-quality urban development.

1. Introduction

China is currently advancing into a critical stage of deeply integrating its “dual carbon” goals with new-type urbanization, where green total factor productivity (GTFP) has emerged as one of the critical metrics for high-quality development and green transformation [1,2,3]. Unlike traditional total factor productivity, which focuses solely on economic output efficiency, GTFP incorporates environmental costs such as resource consumption and carbon emissions into its accounting framework [4], making it more aligned with urban green and low-carbon development. Therefore, enhancing the urban GTFP not only alleviates constraints from scarce factors such as land and energy and promotes the upgrading of industrial structures toward low-carbon and green orientations, but also provides sustainable momentum for new-type urbanization. It represents a core pathway to achieving green and low-carbon economic transformation and advancing high-quality economic development [5].
Given the significance of the GTFP, numerous studies have analyzed its influencing factors. On the one hand, the existing literature has identified the promotional effects on the GTFP of tourism industry development [6], environmental regulation [7], industry agglomeration [8], transportation infrastructure [9], climate risk [10], green credit [11], climate policy uncertainty [12], and green bonds [13]. On the other hand, with the development of new-generation information technologies such as artificial intelligence, big data, cloud computing, and blockchain, unprecedented changes have occurred in technology breakthroughs, people’s lives, and economic and social development [14,15,16,17]. Therefore, many scholars have emphasized the promotional role of the digital economy on the GTFP [18,19]. Specifically, existing research has indicated that digital finance [20], input digitalization [21], artificial intelligence adoption [22], government digital governance [23], FinTech [24], the integration of digital and real economies [5], big data [2], digital transformation [25,26], digital trade [1], and digital inclusive finance [27] can enhance the GTFP.
With the rapid development of cloud computing over the past decade, research on cloud computing has become a topic of significant interest [28]. Cloud computing has evolved alongside the gradual development of the internet and related technologies, encompassing past technologies and concepts such as grid computing, parallel computing, virtualization technology, and service-oriented architecture [29]. It can also reduce enterprise data storage costs, increase storage capacity, and provide a highly scalable computing model [30]. Overall, cloud computing has exerted a profound impact on socioeconomic development. For instance, Katz and Jung (2024) [31] highlighted the positive impact of cloud computing adoption on the economic output in OECD countries. Al-Azzawi and Kaya (2021) [32] determine that cloud computing offers significant advantages in improving firm performance, with such improvements achieved through enhanced organizational agility and human resource development. Floerecke et al. (2021) [33] evaluated the role of cloud computing in ecosystem models. Hasimi Sallehudin et al. (2021) [28] investigate the key factors in the implementation of cloud computing in the public sector and determine that its practical application remains at a low level. Moreover, some studies demonstrates the positive effect of cloud computing on firms’ learning capabilities [29], expected performance [34], and innovative activities [35].
To summarize, on the one hand, the existing literature has extensively discussed the impacts of new-generation information technologies on various aspects of socioeconomic development and identified multiple factors influencing the development of green total factor productivity (GTFP). However, related research on how cloud computing specifically affects urban GTFP remains insufficient, and the literature exploring the internal mechanisms through which new information technologies such as cloud computing influence GTFP remains inadequate. By analyzing the impact of cloud computing on urban GTFP and its underlying mechanisms from the perspective of the development of new-generation information technologies, this study not only enriches the relevant theories on “digital information technology and urban green development” but also provides a scientific basis for cities to formulate practices for digital development and green transformation, thus holding significant theoretical and practical importance.
This study develops a quasi-natural experimental framework based on the timing of cloud computing adoption across 284 Chinese cities from 2000 to 2023, employing a spatial difference-in-differences model to assess its impact on urban green total factor productivity (GTFP). The results indicate that cloud computing not only enhances the GTFP, but also generates a siphoning effect that negatively influences neighboring cities. Mechanism analysis shows that improved resource allocation efficiency and strengthened green innovation are the key pathways through which cloud computing fosters GTFP. Heterogeneity analysis further reveals that the impacts are more pronounced in small cities, coastal regions, and urban agglomerations, with industrial agglomeration amplifying the positive role of cloud computing. Furthermore, from the perspective of regional policies, this study demonstrates that promoting the integrated development of urban agglomerations, reducing administrative monopoly, facilitating free factor mobility, and advancing urban international economic activities are effective pathways to mitigate the siphon effect of cloud computing on urban GTFP.
This study contributes to the literature in three ways. First, it incorporates cloud computing into the analytical framework of the GTFP, and by applying a spatial difference-in-differences (SDID) model to panel data, it identifies the causal impact of cloud computing on urban green development from a spatial perspective, thereby advancing research on the integration of digital technologies and green growth. Compared to existing studies that often use composite indicators to measure the level of the digital economy, this study focuses on specific information technology applications and accurately identifies the unique role of cloud computing in the development of the digital economy. This study advances the analysis of the digital economy at a more granular level, not only revealing the mechanism through which cloud computing affects economic operations but also providing an important complement to research on the relationship between new-generation information technology applications and environmental economics. By examining cloud computing at the city level, this study explores the internal pathways through which the digital economy affects environmental economics, offering new insights for the construction of urban cloud computing and providing useful references for unraveling the “black box” of the interaction mechanism between cloud computing and environmental economics. Second, the digital economy has systematic and complex impacts on economic development. This study not only analyzes the direct effect of cloud computing on local city GTFP but also incorporates spatial interaction effects into the analytical framework, comprehensively measuring the integrated impact of new-generation information technology on environmental economics. By introducing spatial spillover mechanisms, this study reveals the externality effects of cloud computing in promoting the improvement of the regional GTFP, indicating that new-generation information technology can not only optimize local resource allocation efficiency but also facilitate coordinated development in surrounding areas through the diffusion of information and technology. Further, combining spatial econometric models, this study examines the spatiotemporal coupling relationship between cloud computing applications and environmental economic performance from a dynamic evolution perspective, providing new empirical evidence and policy implications for understanding the mechanism through which the digital economy functions in regional green transformation. Third, it identifies resource allocation efficiency and green innovation as the core transmission channels, while highlighting the heterogeneous impacts shaped by the city size, locational conditions, and industrial agglomeration. These findings provide practical insights for formulating place-based strategies that leverage digital technologies to promote green development.
The remaining sections of this paper are structured as follows: in Section 2, we present the theoretical framework; Section 3 includes the research design; Section 4 provides the empirical results; Section 5 presents the mechanism analysis and further discussion; Section 6 concludes with the main findings and policy recommendations.

2. Theoretical Framework

2.1. Cloud Computing and Urban Green Total Factor Productivity

Under the dual constraints of the digital economy, cloud computing technology has exerted a long-term and nonlinear “butterfly effect” on the low-carbon economy, with its environmental incentive effects emerging as a key driver of fluctuations in ecosystem carbon emissions [36]. On the one hand, due to the efficient data processing capabilities of cloud computing [37], it can facilitate the data-driven intelligent management of energy systems. Through real-time data analysis and demand forecasting, it optimizes the allocation efficiency of energy factors, further constraining energy consumption and reducing carbon emission intensity [38,39]. On the other hand, cloud computing provides critical support for clean energy development, enhancing the dispatching capabilities of solar and wind power generation and reducing grid integration difficulty and utilization costs [40,41]. This accelerates the substitution of traditional fossil energy sources, thereby reducing carbon emissions and achieving green and low-carbon development. Meanwhile, cloud computing facilitates the gradual evolution of the industrial structure in a low-energy-consumption direction, promoting low-carbon economic growth [42]. Over the long term, the diffusion of cloud computing can promote the green and low-carbon transformation of manufacturing industries and green economic development through transforming production patterns, reshaping employment structures, and driving technological innovation [43,44,45]. In summary, leveraging its advantages in information processing, cloud computing not only alleviates energy consumption challenges but also promotes low-carbon industrial transformation and drives green and sustainable economic development, emerging as a digital enabler for low-carbon transformation. By advancing the green and low-carbon development of the economy, cloud computing can directly enhance urban green total factor productivity. Therefore, this study proposes Hypothesis 1.
Hypothesis 1. 
Cloud computing exerts a promotional effect on urban green total factor productivity.

2.2. Cloud Computing and Green Innovation

The existing literature indicates that the digital economy exerts a significant promoting role in green technological innovation [23,46,47]. First, by constructing open and shared digital infrastructure, cloud computing has significantly reduced knowledge acquisition barriers and collaboration costs for technological innovation [48]. On the other hand, cloud computing possesses capabilities in aggregating and intelligently analyzing data resources; through cloud platforms, it can integrate scattered data resources, achieve the factorization of data, and promote enterprise innovation [17]. Additionally, cloud computing features cross-domain collaborative functions [37]. By leveraging collaborative development environments and open-source algorithm libraries, this approach facilitates knowledge sharing among industry, academia, and research institutions, accelerates technology diffusion, and enables knowledge spillovers [3]. Meanwhile, with the development of artificial intelligence and the digital economy, there is an increasing need for coordinated development between the economy, society, ecology, and energy [49]. As a critical component of innovation, low-carbon green technological innovation enables the collaborative R&D of green innovation and technologies via cloud computing-based platforms. This accelerates the iteration and diffusion of green technologies, driving breakthroughs in and the application of urban green technologies such as clean energy technologies [40,41]. Therefore, cloud computing enables diverse economic entities to access green technologies at low cost, breaking through information silos and resource constraints in green innovation, and promoting the output of green patents and the application of green technologies. By converting the hardware investments required for enterprise innovation into variable costs [48], cloud computing significantly lowers the R&D thresholds for green technologies among small enterprises and research institutions. Enterprises can utilize cloud computing power to conduct carbon emission simulations and clean energy optimization experiments, advancing substantive innovation without the need to build high-performance computing centers, thereby directly improving the efficiency of green technology R&D. Through green innovation and green technologies, resource conservation and efficient utilization are facilitated, thereby improving the green total factor productivity (GTFP) [50]. Overall, cloud computing facilitates the dissemination and collaboration of knowledge, enables knowledge spillovers, and promotes green innovation. Knowledge spillovers and green technological innovation, in turn, further enhance urban green total factor productivity. Thus, this work proposes Hypothesis 2.
Hypothesis 2. 
Cloud computing can promote knowledge spillovers, drive breakthroughs in green innovation, and thereby enhance green total factor productivity.

2.3. Cloud Computing and Resource Allocation Efficiency

The digital economy enhances labor skill levels and promotes factor productivity improvement [21]. The efficient computational capabilities of cloud computing, through optimizing factor allocation and promoting intensive factor use, establish a critical pathway for enhancing green total factor productivity. By leveraging distributed data processing capabilities, cloud computing breaks through spatiotemporal constraints on traditional factor flows, enabling cross-entity and cross-process matching of capital, labor, and data. Enterprises no longer need to allocate substantial capital to computer hardware resources, which reduces capital expenditure and improves capital utilization efficiency [49]. Meanwhile, cloud computing and other information technologies optimize production processes [51], monitor and refine the input structure of various factors in real time [14], and enhance the effective allocation of factors. At the labor and human capital level, cloud computing drives the agglomeration of labor in high-efficiency sectors. Automated computing power can be substituted for repetitive labor, promote the accumulation of human capital, and optimizes the structure of the workforce. Through cloud-based R&D platforms, enterprises can share employees’ knowledge, skills, and experiences, facilitating talent development and enhancing efficient communication among human resources [32]. Employees can access platforms anytime to boost work efficiency [31]. On the other hand, cloud computing collaboration platforms can reduce knowledge transfer costs [49]., accelerate the diffusion of environmental protection technologies and energy-saving processes, and elevate the green production skills of the overall workforce. This resource allocation efficiency not only improves labor productivity but also reduces resource waste and pollution emissions, thereby promoting green and low-carbon economic growth. In summary, by enhancing the precision of resource allocation efficiency, cloud computing improves production efficiency while reducing environmental burdens, ultimately driving systemic enhancements in green total factor productivity. Thus, this study proposes Hypothesis 3.
Hypothesis 3. 
Cloud computing can enhance the resource allocation efficiency, thereby improving urban green total factor productivity.
First, Figure 1 illustrates the diagram of the intrinsic relationship among the three hypotheses. On the one hand, Hypothesis 1 presents the main argument of this study, positing that urban cloud computing can enhance urban GTFP. Then, through Hypotheses 2 and 3, this study proposes two primary pathways through which cloud computing affects GTFP. Consequently, after empirically validating Hypothesis 1, this study examines whether the proposed mechanisms in Hypotheses 2 and 3 explain how cloud computing influences GTFP.
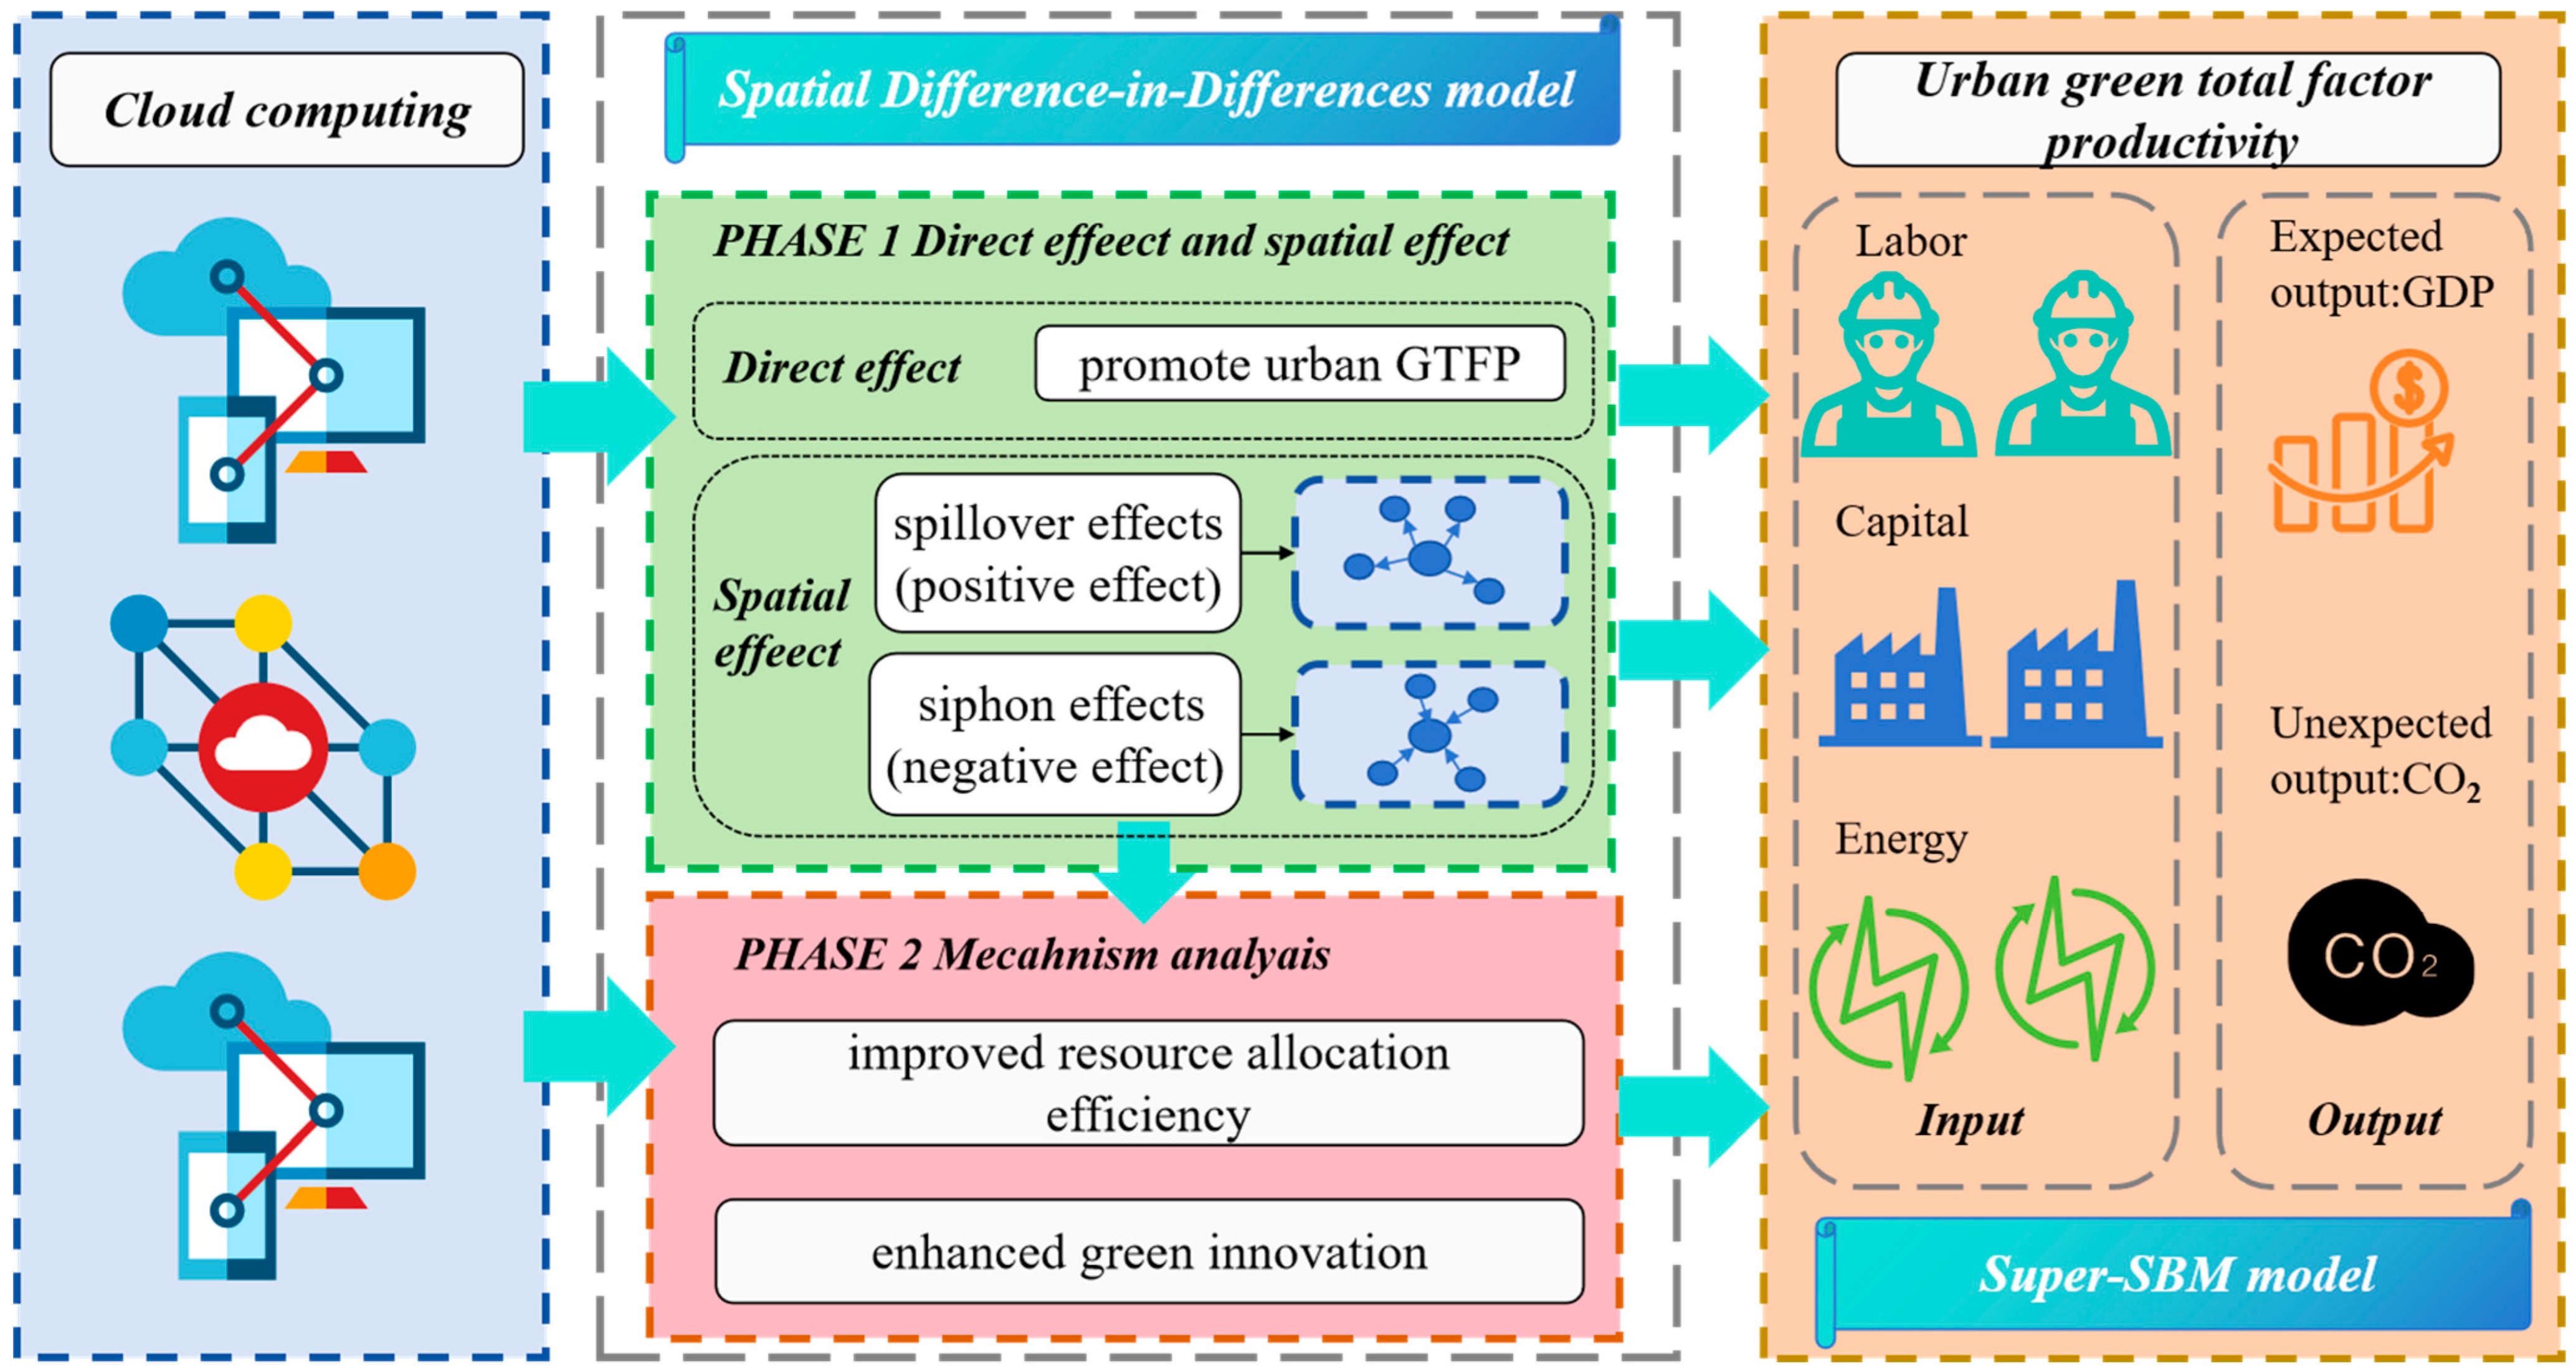
Second, Figure 2 presents the overall research framework diagram. As shown in Figure 2, in phase 1, this study uses spatial DID to analyze the direct effects and spatial effects of cloud computing on urban GTFP. Additionally, in phase 2, it examines the main mechanisms through which cloud computing promotes GTFP by improving resource allocation efficiency and enhancing green innovation.

3. Research Design

3.1. Green Total Factor Productivity

In the studies of GTFP, scholars typically use labor, capital, and energy as input factors, with economic output as the desirable output, while also accounting for undesirable outputs such as pollution emissions. For example, some studies treat carbon emissions or pollutant emissions as an undesirable output [3,12,52,53]. Currently, DEA models that account for undesirable outputs include the Slacks-Based Model (SBM), the Super-Slacks-Based Model (SSBM), and other variants. In the SBM model, situations may arise where the efficiencies of multiple decision-making units (DMUs) are simultaneously scored as 1, which complicates the evaluation of efficiency differences among DMUs. In contrast, the super-efficiency SBM model allows efficiency scores to exceed 1, enabling comparable results across different DMUs. Therefore, this paper employs the super-efficiency SBM model with undesirable outputs to measure the GTFP of 284 Chinese cities. For the k-th decision-making unit, the objective function is formulated as:
ρ = min 1 + 1 m i = 1 m s i x x i 0 1 1 s 1 + s 2 k = 1 s 1 s k y y k 0 + l = 1 s 2 s l z z l 0
s.t.
x i 0 t j = 1 n λ j x j s i x , i y k 0 t j = 1 n λ j y j + s k y , k   z t 0 t j = 1 n λ j z j s l z ,   l 1 1 s 1 + s 2 k = 1 s 1 s k y y k 0 + l = 1 s 2 s l z z l 0 > 0 s i x 0 ,   s k y 0 ,   s l z 0 ,   λ j 0 , i , j , k , l
where ρ represents the efficiency value; x i 0 , z l 0 and y i 0 denote the input, undesirable output, and desirable output vector elements of the decision-making unit (DMU), respectively; s i x , s k y and s l z represent the slack variables for inputs, desirable outputs, and undesirable outputs; and λ serves as the weight variable. m, s1, and s2 denote the number of input, desirable output, and undesirable output variables, respectively. In this study, the input factors include labor input, capital input, and energy input. The desirable output is measured as real GDP output with 2000 as the base year, and the undesirable output is carbon dioxide emissions.
With reference to existing studies, the measurement of capital stock employs the perpetual inventory method, using a depreciation rate of 10.96% [54,55,56]. The current period’s capital stock is calculated as follows:
K i , t = 1 σ K i , t 1 + I i , t P i , t
where σ represents the depreciation rate, K i , t denotes the current period’s capital stock, K i , t 1 represents the capital stock of the previous year, I i , t denotes the current investment, and P i , t represents the price index.
Since there are no unified energy statistical data for prefecture-level cities, and municipal bureaus of statistics do not disclose energy consumption information according to standardized criteria, this study, following the research of Fullerton Jr and Walke (2019) [57], S. Yang et al. (2025) [3] and Alhamwi et al. (2018) [58], uses total social electricity consumption to represent the energy input of cities.

3.2. Spatial Statistic Method

3.2.1. Spatial Weight Matrix

The spatial weight matrix, W , captures the interconnections between urban entities and is structured as an n × n matrix:
W = w 11 w 21 w n 1 w 12 w 22 w n 2 w 1 n w 2 n w n n
where N denotes the number of cities, and it represents a time-invariant spatial weight matrix. To analyze the impact of cloud computing on neighboring cities, this paper uses a spatially proximate spatial weight matrix. The elements w i j of the spatial proximity matrix W 01 are defined as follows:
w i j = 1 ,           If   city   i   and   city   j   are   geographically   adjacent 0 ,   If   city   i   and   city   j   are   not   geographically   adjacent
Additionally, this study further incorporates an economic weight matrix and adopts a time-varying spatial weight matrix, building upon the spatial proximity matrix. Considering the time-varying characteristics of economic and population changes, the element w i j t in the spatial proximity matrix at time t is defined as follows:
w i j t = 1 | Y i t Y j t | ,           If   city   i   and   city   j   are   geographically   adjacent 0 ,   If   city   i   and   city   j   are   not   geographically   adjacent
where Y i t and Y j t represent the economic variables of city i and city j, respectively; in this study, the time-varying spatial weight matrices are calculated separately as W t G D P and W t P O P using city GDP and city population.

3.2.2. Hot Spot Analysis

To examine spatial dependencies among economic variables, this study employs the Getis-Ord Gi hot-spot analysis to identify clustering patterns in spatial data. This method allows for visual observation of the spatial agglomeration of GTFP across cities. For a given city i, we first calculate the spatial term of j w i j x j with its neighboring cities. Next, standardized calculations are performed.
G i * = j w i j x j X ¯ j w i j S n j w i j 2 j w i j 2 n 1
where x j represents the GTFP of city j; X ¯ = x i n denotes the mean of the GTFP, and S represents the standard deviation of GTFP. w i j is the spatial adjacency weight matrix, and n is the number of cities. The computed score of G i * indicates: if G i * > 0, it signifies a hot spot, meaning there is a positive spatial correlation between the local GTFP and the GTFP of neighboring cities, where cities with the higher GTFP values cluster together. If G i * < 0, it indicates a cold spot, where cities with the lower GTFP values cluster together.

3.2.3. Moran Index

The Moran index is an important indicator for measuring spatial correlation, which can be used to characterize the spatial autocorrelation of the GTFP. The measurement method is as follows:
M o r a n s   I = n i = 1 n i = 1 n w i j i = 1 n j = 1 n w i j ( x i X ¯ ) ( x j X ¯ ) i = 1 n x i X ¯ n
Here, x i and x j denote the GTFP of city i and city j, respectively; n represents the number of cities; w i j represents the spatial linkage between city i and city j, which is an element of the spatial weight matrix; and X ¯ denotes the mean value of the urban GTFP. Moran’s I > 0 indicates a positive spatial autocorrelation of the urban GTFP; Moran’s I < 0 indicates a negative spatial autocorrelation of the urban GTFP; and Moran’s I ≈ 0 suggests no significant spatial correlation of urban GTFP.

3.3. Spatial Difference-in-Differences Approach

3.3.1. Spatial Durbin Difference-in-Differences Model

With the implementation of cloud computing across various cities, this process has gradually evolved into a quasi-natural experiment. To analyze the impact of cloud computing on the urban green total factor productivity (GTFP), this study constructs a difference-in-differences (DID) model. The implementation of urban policies generates not only direct impacts on the host city but also induces significant spillover effects on neighboring regions. For instance, Polyviou et al. (2024) [59] demonstrate that geographic proximity constitutes a critical determinant during cloud computing adoption processes. C. Chen et al. (2023) [46] further identify the spillover mechanisms of digital economy development. Recent empirical studies also highlight the spatial diffusion effects of the digital economy on GTFP [3,18]. Consequently, the spatial spillover effects on GTFP cannot not be ignored [9]. Hence, considering the spillover effects of urban cloud computing, this study incorporates spatial factors into the DID model and constructs the Spatial Durbin difference-in-differences model (SDM-DID):
G T F P i t = α + ρ W G T F P i t + β T r e a t i × P o s t t + l = 1 m γ l X l i t + β W W T r e a t i × P o s t t + l = 1 m γ l w W X l i t + u i + v t + ε i t
where u i , v t , and ε i t denote the city-level individual effect, time effect, and random error term, respectively; W is the spatial weight matrix.
G T F P i t denotes the green total factor productivity of city i at time t. W G T F P i t represents the spatial lag term of the independent variables, capturing the influence of GTFP from other cities on city i.
T r e a t i × P o s t t is the core policy variable. This paper employs text analysis to extract the policy adoption timeline of cloud computing from official documents and constructs a quasi-natural experiment framework. As cloud computing continues to proliferate, this study defines the establishment of a city’s first cloud computing service center as the policy timing for cloud computing adoption, classifying cities that established such centers as the treatment group. For example, Beijing established the Beijing Super-computing Cloud Center in 2011, which provides cloud computing services. Therefore, we designated 2011 as the policy timing for Beijing’s cloud computing implementation. The earliest cloud computing service center in Tianjin is the National Super-computing Center Tianjin, which officially launched commercial computing power services in 2012. Therefore, we designated 2012 as the policy timing for Tianjin’s cloud computing. Specifically, if city i belongs to the treated group (i.e., adopts cloud computing), T r e a t i = 1; otherwise, T r e a t i = 0 . If city i deploys cloud computing in year t, P o s t t = 1 for year t and all subsequent years. Thus, T r e a t i × P o s t t = 1 indicates that cloud computing was adopted in city i in year t. W T r e a t i × P o s t t represents the impact of cloud computing adoption in other cities on city i, capturing the spatial spillover effects of cloud computing policies. The coefficient of β W quantifies the magnitude of these spatial spillover effects.
l = 1 m γ l X l i t denotes a series of control variables, including: Government behavior (gove, the proportion of government expenditure to GDP); Industrial development (R2, the proportion of secondary industry); Urbanization rate (urban, the proportion of urban population to total population); Labor-capital ratio (LK, the logarithm of the ratio of labor to capital); Demographic factor (lnpop, the logarithm of population size); Regional consumption level (consump, the logarithm of urban retail sales of consumer goods); Educational development (lnedu, the logarithm of the number of secondary schools in the city). Additionally, this paper uses the big data comprehensive pilot zone policy (Dbigdata) to control for the impact of big data infrastructure development and the sponge city construction pilot policy (Dsponge) to account for the effects of urban construction. l = 1 m γ l w W X l i t represents the impact of explanatory variables from other cities on the current city.
If the model excludes the spatial terms of the l = 1 m γ l w W X l i t and W T r e a t i × P o s t t , Equation (8) is referred to as a spatial autoregressive model (SAR).

3.3.2. Spatial Autoregressive Event-Study Model

In this study, we use the Spatial autoregressive event-study model (SAR-event-study) to analyze the dynamic effect of cloud computing [60]:
G T F P i t = α + ρ W G T F P i t + j m , , 2 , 1,0 , 1,2 , , n Θ j T r e a t i × P o s t t j + l = 1 m γ l X l i t + u i + v t + ε i t
If j > 0, T r e a t i × P o s t t j denotes that city i is in the j-th year before the policy implementation; if j < 0, it indicates that city i is in the j-th year after experiencing the policy shock.

3.3.3. The Model of Mechanism Analysis

This study employs the Spatial Autoregressive difference-in-differences (SAR-DID) model to conduct mechanism analysis:
M i t = α + ρ W G T F P i t + β T r e a t i × P o s t t + l = 1 m γ l X l i t + u i + v t + ε i t
M i t is the mechanism variable, primarily comprising urban knowledge spillover ( s p i l l o v e r c t ), green invention patents (Green_Inno1, the logarithm of the value after incrementing by 1) and green new-type utility model patent innovations (Green_Inno2, the logarithm of the value after incrementing by 1), labor factor distortion (Labor_Miss), capital factor distortion (Capital_Miss), and overall factor distortion (Miss_All).
For the level of urban knowledge spillover, this study uses listed company data to measure the knowledge spillover level of each enterprise within the city, then aggregates these firm-level measures to the urban level to derive the urban-level knowledge spillover. spillove it represents the knowledge spillover received by firm i. The measurement method is:
spillove it = j = 1 , j i N ct R D jt d i j
where N c denotes the number of enterprises in city c at time t, R D jt represents the number of R&D personnel in enterprise j, and d i j denotes the geographical distance between enterprise i and enterprise j. Using Equation (10), we measure the level of knowledge spillover exposure for enterprises within the city. Next, we aggregate and sum the firm-level data at the city level to obtain the knowledge spillover level for city c:
s p i l l o v e r c t = l n i C j = 1 , j i N ct R D jt dij
Second, this study employs factor misallocation to measure factor allocation efficiency, where greater factor distortion indicates lower factor allocation efficiency. Following the approaches of previous studies [61,62,63,64], we measure urban labor factor distortion (Labor_Miss), capital factor distortion (Capital_Miss), and overall factor distortion (Miss_All).

3.4. Data

First, this study manually compiles policy variables related to the implementation of urban cloud computing. Using authoritative documents such as reports and announcements published on government websites, we manually collected the timing of urban cloud computing deployment and developed a difference-in-differences (DID) policy dummy variable. Second, this study is based on the panel dataset of 284 Chinese cities from 2000 to 2023. Raw data sources comprise the China City Statistical Yearbook and statistical bureaus of various regions. Third, urban green innovation data were sourced from the CNRD research data service platform. Fourth, raw data of listed companies used in this study is obtained from the CSMAR database. Table 1 presents the descriptive statistics of the variables.

4. Result

4.1. Spatial and Temporal Distribution of GTFP

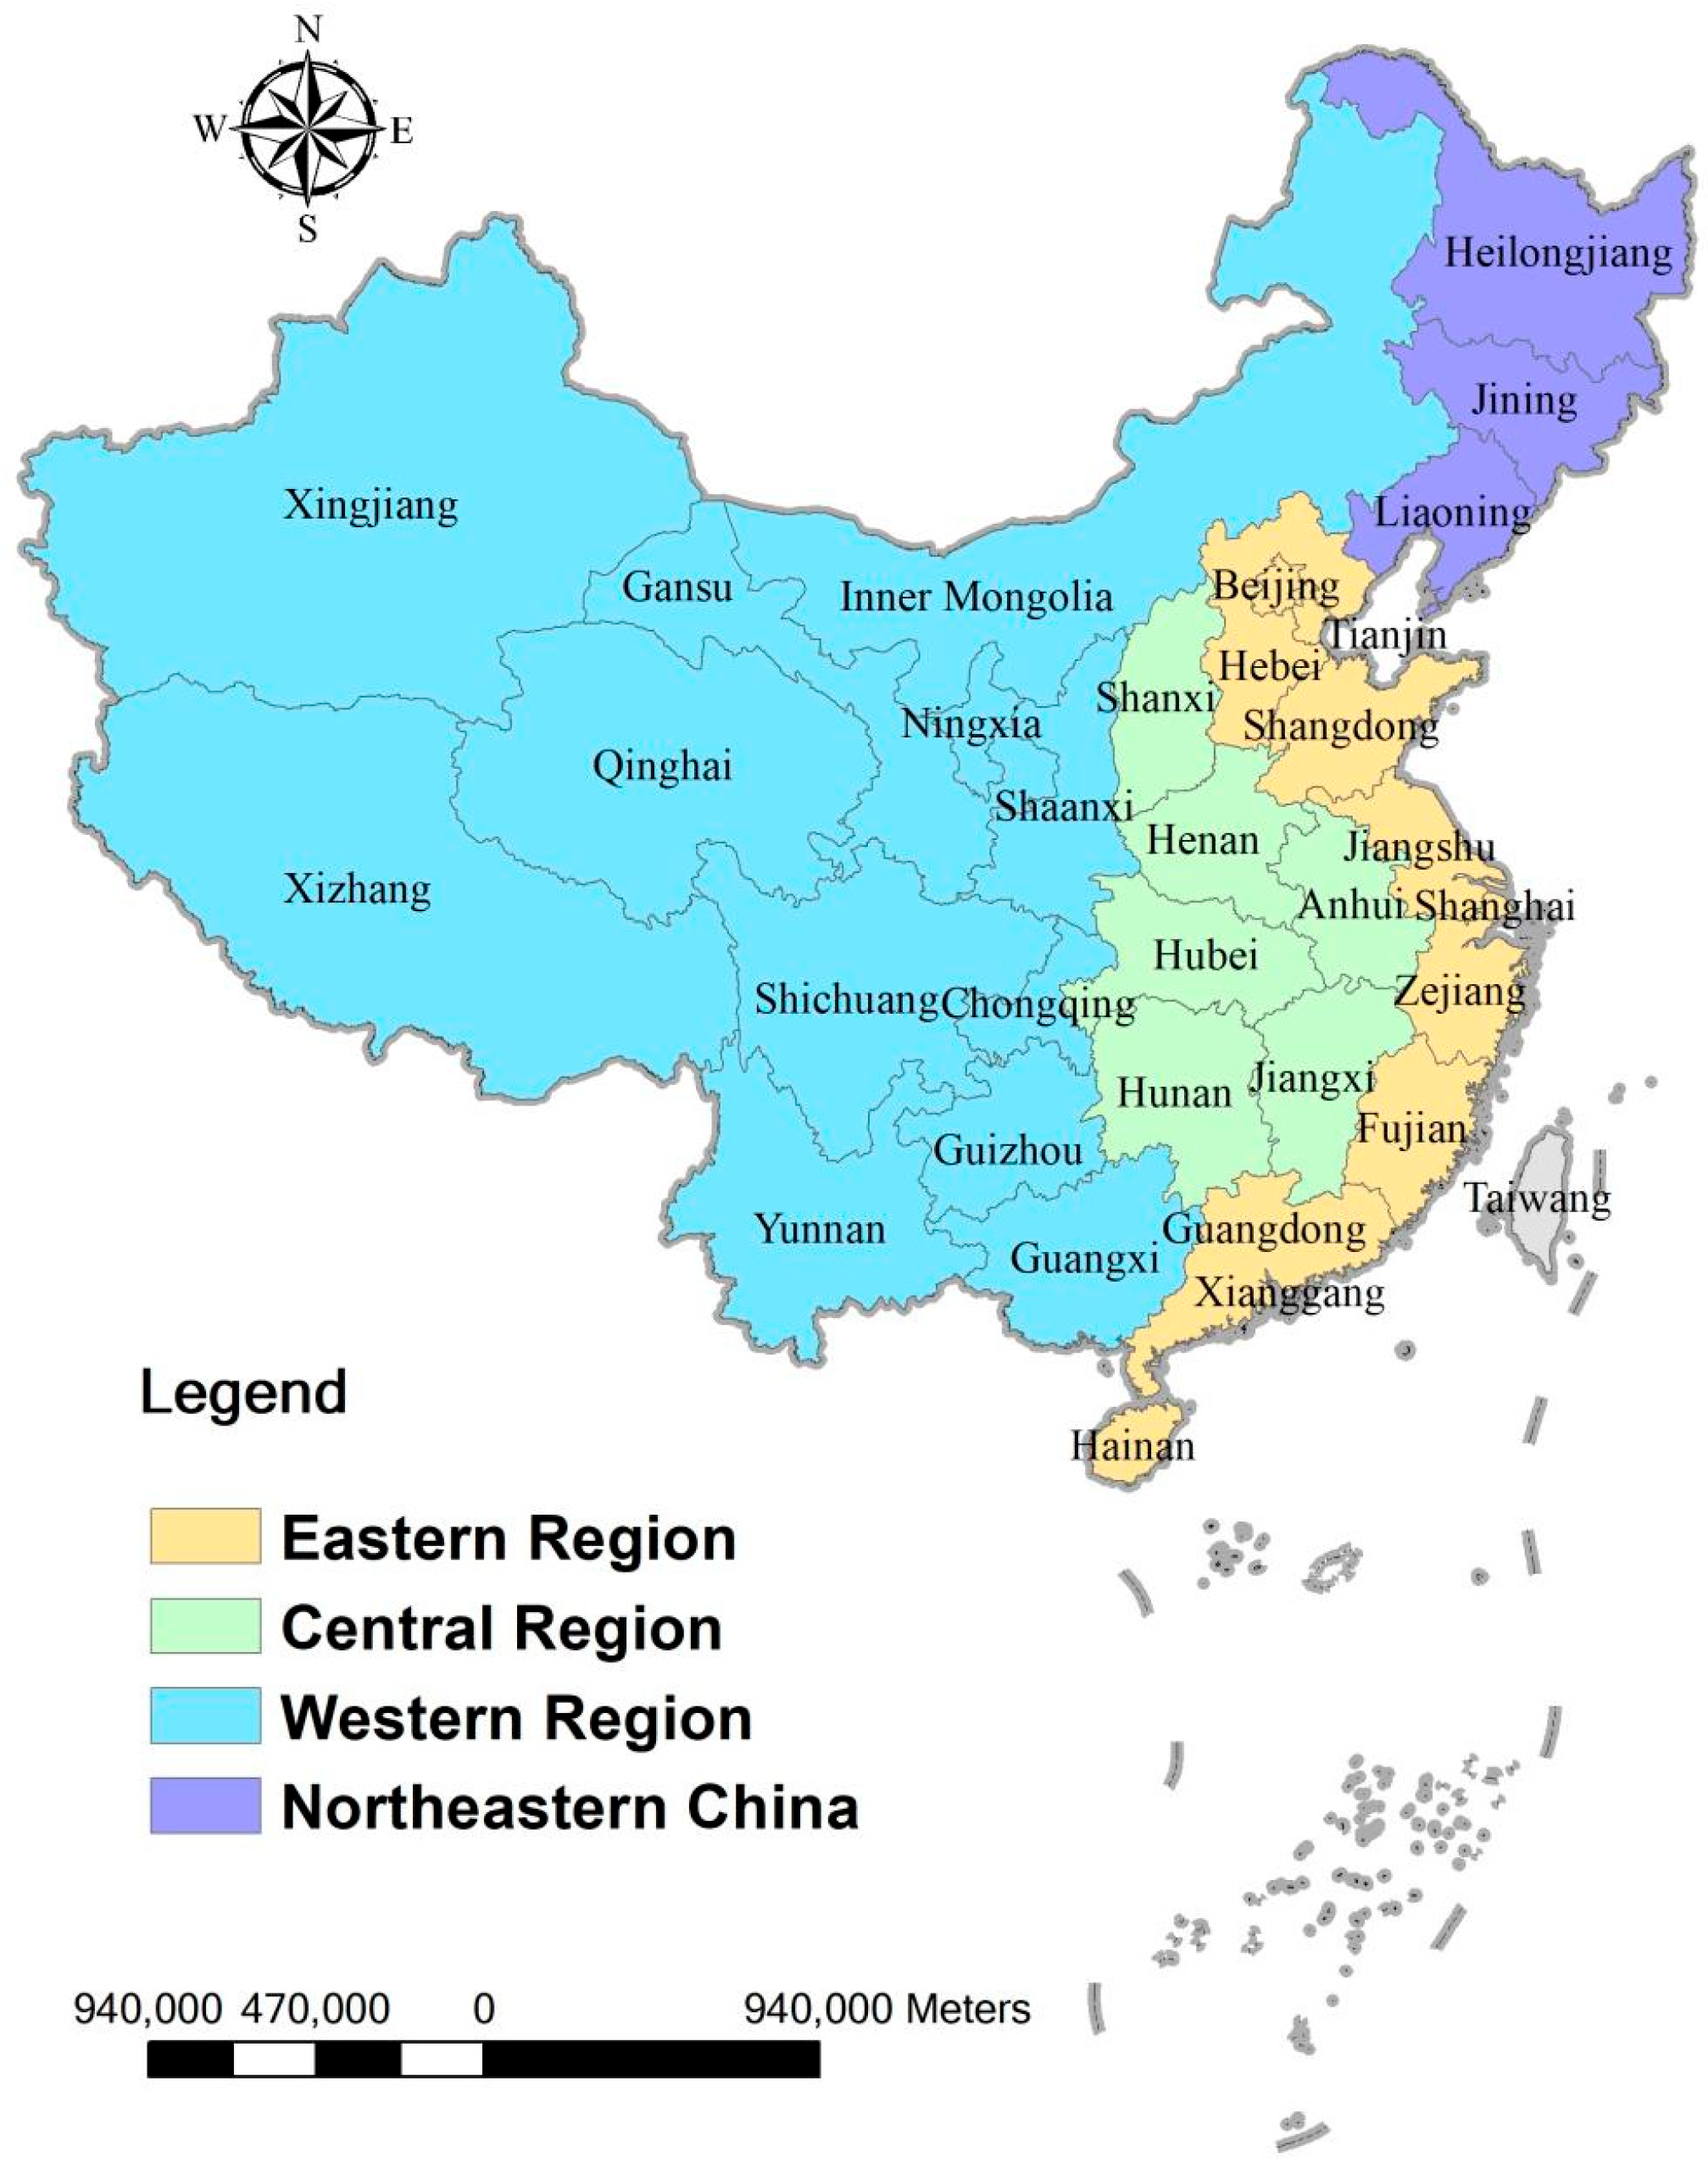
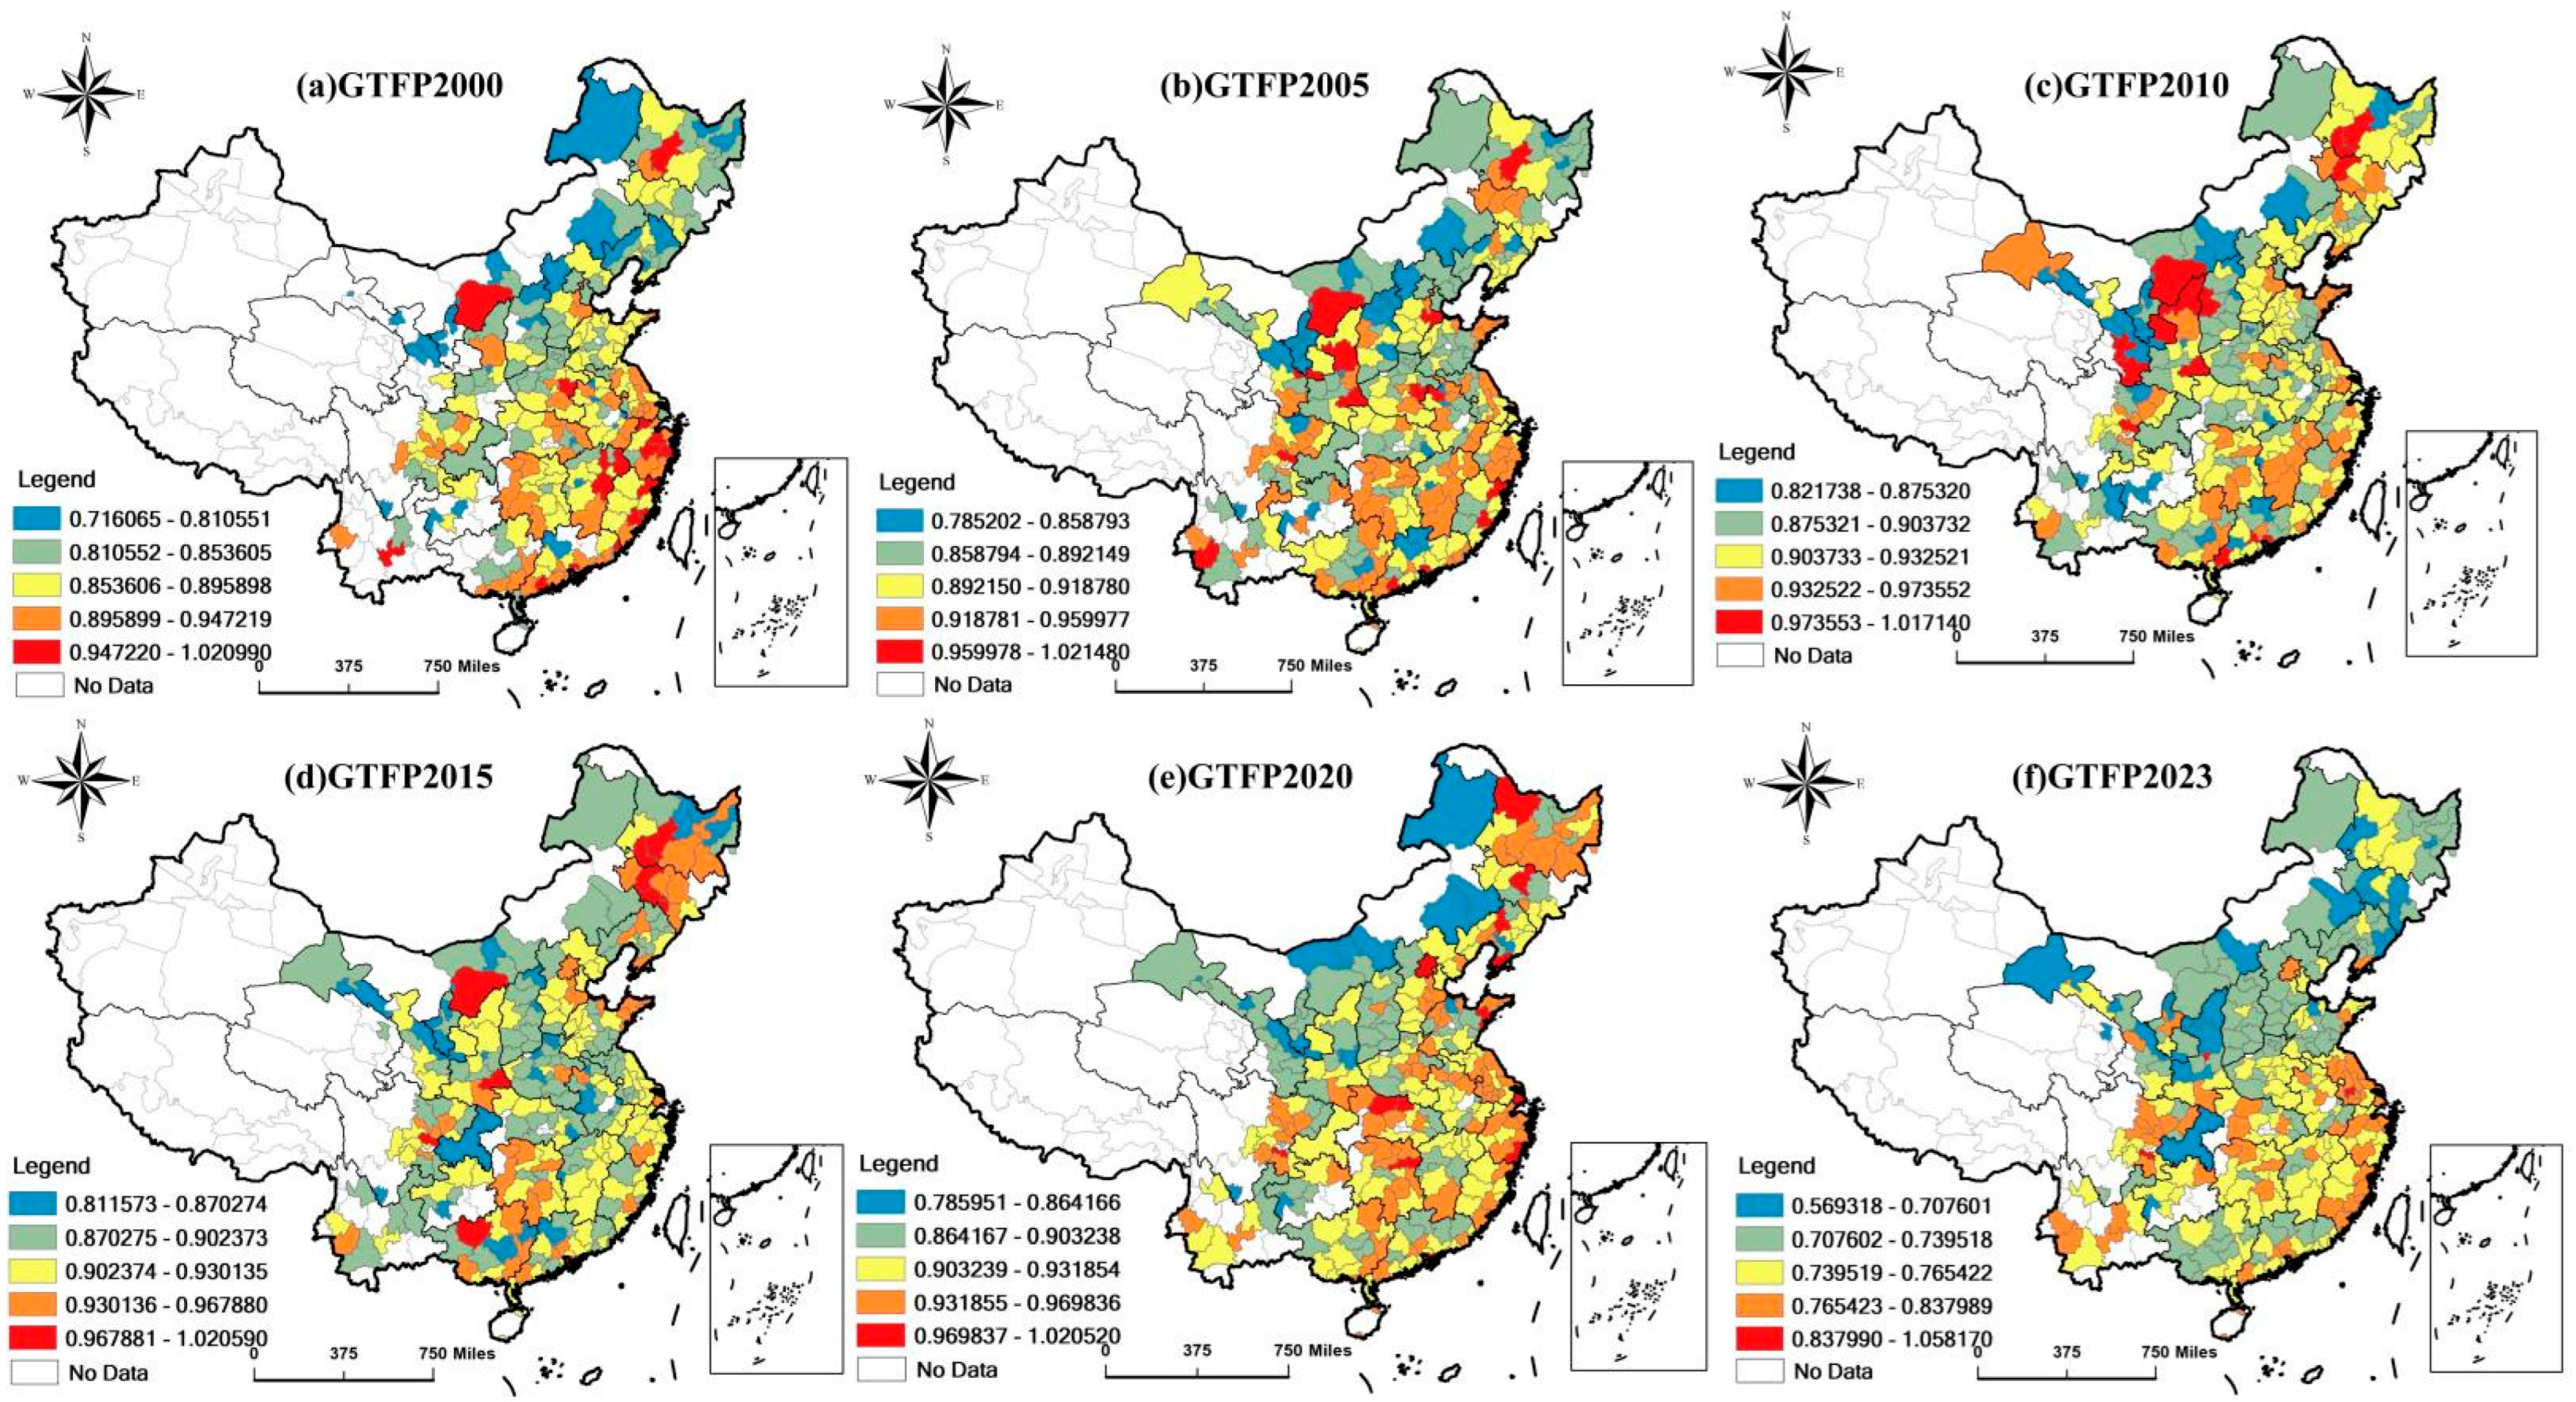
Figure 3 illustrates the spatiotemporal change trends of urban GTFP in China. First, the distribution of urban GTFP in China exhibits a characteristic of being higher in southern cities than in northern cities. From the perspective of the spatial change trends of urban GTFP over the years, cities in so uthern regions, such as Zhejiang, Jiangsu, Fujian, and Guangdong, generally maintain higher GTFP levels. In contrast, cities in northern regions, including Inner Mongolia, Gansu, and Shanxi, have comparatively lower GTFP (See the detailed map of China’s administrative divisions in Figure A1). Second, urban GTFP shows a certain degree of attenuation from east to west. Cities in eastern regions have higher GTFP levels, whereas those in western regions, such as Inner Mongolia, Gansu, Guizhou, Sichuan, and Yunnan, exhibit lower GTFP compared to their eastern counterparts. Third, GTFP levels in different cities display certain fluctuations over time. For instance, GTFP in some cities in Heilongjiang and Jilin (Northeast China) remained relatively high from 2000 to 2020 but declined after 2023. Similarly, GTFP in some cities in Inner Mongolia and Shaanxi was relatively high from 2000 to 2015 but dropped to lower levels after 2020. Overall, urban GTFP in China demonstrates three key characteristics: higher values in the south than in the north, higher values in the east than in the west, and certain temporal fluctuations.

4.2. Spatial Statistic Analysis of Green Total Factor Productivity

4.2.1. Hot Spots Analysis of Green Total Factor Productivity

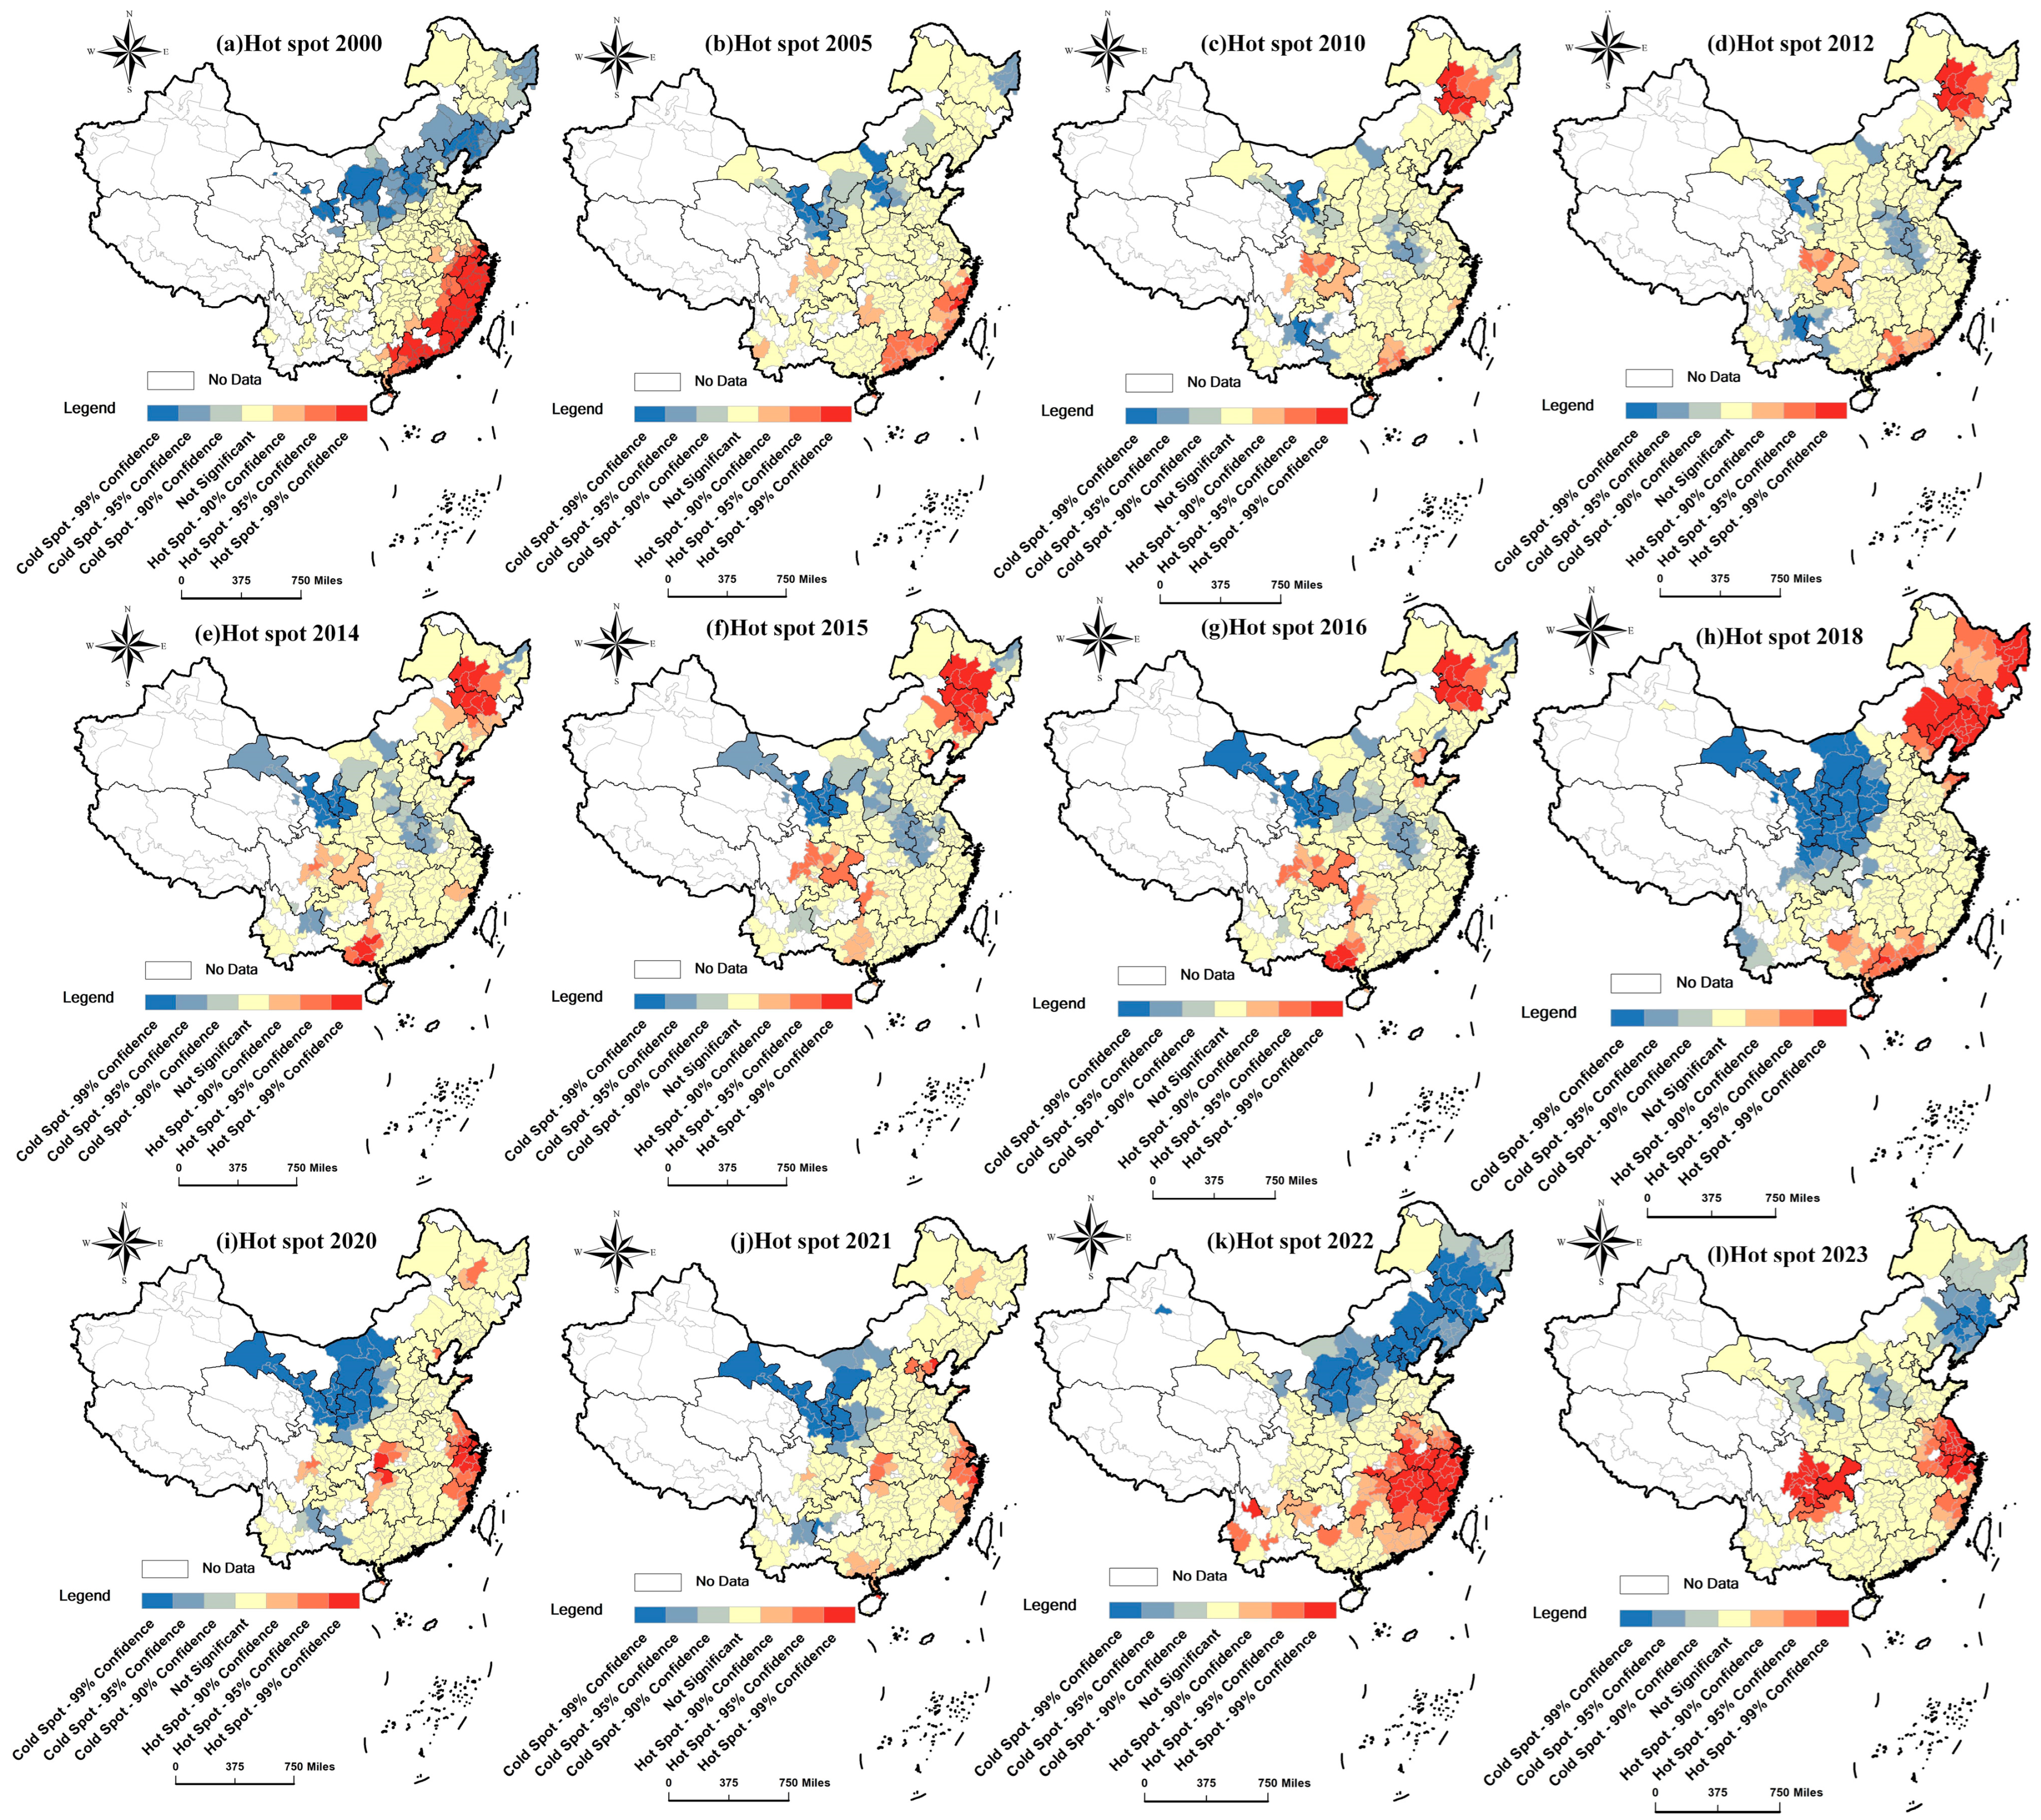
Figure 4 presents the spatiotemporal change trend of the hot-spot analysis of GTFP over the years using the spatial proximity matrix. From Figure 4, it can be observed that between 2000 and 2005, the GTFP exhibited significant hot-spot clusters in southern coastal regions such as Zhejiang, Fujian, and Guangdong Provinces. In these areas, cities with high GTFP were surrounded by neighboring cities with relatively high GTFP. Subsequently, from 2005 to 2018, the clustering pattern of high GTFP cities in southern regions gradually weakened, while significant hot-spot clusters emerged in northeastern regions. Between 2020 and 2023, these high GTFP clusters primarily appeared in parts of Anhui, Jiangsu, Zhejiang, Fujian, Guangdong, Jiangxi, as well as Sichuan, Chongqing, Hunan, Guizhou, Yunnan, and Guangxi, where significant high GTFP agglomeration was observed. However, significant cold-spot clusters emerged in Hebei, Shanxi, Inner Mongolia, and Gansu, where cities with low GTFP were clustered together, forming a spatial pattern of mutual agglomeration of low-GTFP cities. During the period 2020–2023, northeastern regions transitioned from hot spots to cold spots, with cities in these areas exhibiting lower GTFP levels. Notably, in 2022, the cold-spot coverage extended across broader northern regions. Additionally, certain trends in the clustering patterns of urban GTFP can be identified: extensive cold- and hot-spot clusters were observed in 2000, 2018, 2022, and 2023, whereas the scope of these clusters decreased to some extent in 2005, 2010, and 2021.
It can be noted that urban GTFP in southern coastal provinces displayed a pattern of mutual agglomeration of high-GTFP cities, while northern cities formed clusters of low-GTFP cities. Meanwhile, the spatial clustering patterns of urban GTFP exhibited certain fluctuations, with transitions from hot-spot clusters to cold-spot clusters occurring in different regions. Overall, urban GTFP across different years consistently demonstrated spatial clustering patterns, indicating spatial correlations and mutual influences among cities. Therefore, spatial factors will be further incorporated into the analytical framework in the baseline regression of this paper.

4.2.2. The Moran’s Index of Green Total Factor Productivity

Table 2 reports the Moran’s I index for GTFP based on the spatial proximity matrix. The estimation results indicate that Moran’s I values for GTFP are consistently positive, with most being statistically significant at the 1% level. This demonstrates a significant positive spatial autocorrelation in urban GTFP, suggesting that a city’s GTFP level is closely related to those of neighboring cities.
To analyze temporal variations, the Moran’s I index exhibited a moderate decline during 2000–2004. Then, except for relatively low values in 2008 and 2009, it fluctuated between 0.1 and 0.15 from 2005 to 2014. Subsequently, between 2015 and 2018, the index gradually increased from 0.154 to 0.214, reflecting strengthened spatial correlations among cities’ GTFP. From 2019 to 2023, the index first decreased to 0.1 before rising to 0.143. Overall, while the Moran’s I index displays certain fluctuations, it consistently demonstrates significant spatial autocorrelation throughout the study period.

4.3. Baseline Results

Table 3 presents the impact of cloud computing on urban green total factor productivity (GTFP). The spatial Durbin-DID (SDM-DID) model is estimated with a binary spatial matrix in Columns (1) to (4), a time-varying economic weight matrix in Column (5), and a time-varying population weight matrix in Column (6). Column (1) reports the results of SDM-DID without controlling for time and city fixed effects, showing that the coefficient of the spatial term W T r e a t i × P o s t t is significantly negative. Column (2) includes city fixed effects, while Columns (3) and (4) control for both time and city-level fixed effects. In Column (4), the coefficient of T r e a t i × P o s t t for cloud computing is 0.004 and statistically significant at the 1% level, and the the spatial term W T r e a t i × P o s t t is −0.0069, also significant at the 1% level. In Columns (5) and (6), the time-varying economic and population weight matrices show that the coefficient of T r e a t i × P o s t t remains statistically significant and positive, while the coefficient of W T r e a t i × P o s t t remains statistically significant and negative. In terms of the economic interpretation of the coefficient, the average growth of urban GTFP during the sample period is 0.056. Meanwhile, the results in Columns (4)–(6) show that the positive effects of cloud computing on urban GTFP are 0.00357, 0.0035368, and 0.00374, respectively, accounting for 6.4%, 6.3%, and 6.7% of the total change in urban GTFP. Urban GTFP is a holistic measure of intra-urban factor inputs, economic outputs, and environmental performance, and its fluctuations are influenced by numerous economic factors. The empirical results indicate that urban cloud computing adoption explains over 6% of the variation in urban GTFP, suggesting significant economic implications and establishing it as an import determinant of GTFP. In policy formulation aimed at promoting urban GTFP growth, the impact of new-generation information technology must be fully considered. Overall, the estimation results indicate two key findings: First, the coefficients of non-spatial terms are all significantly positive, indicating that urban cloud computing significantly enhances GTFP. Therefore, using the spatial DID model, the construction of urban cloud computing significantly promotes urban GTFP, and the results remain robust under different spatial weight estimations. The findings from the baseline regression of this paper fully support the argument of Hypothesis 1.
Second, the spatial term of W T r e a t i × P o s t t captures the impact of cloud computing development in neighboring cities on the local city. The significantly negative coefficient indicates that the deployment of cloud computing in adjacent cities exerts a significant negative spatial effect on the local region. The negative coefficient of W T r e a t i × P o s t t suggests that cloud computing development in neighboring cities generates a significant competitive effect (siphon effect). The construction of cloud computing within a city can further absorb surrounding resources, and intensifies inter-city competition, leading to a siphon effect. Finally, the spatial autoregressive coefficient ρ is positive and statistically significant at the 1% level, indicating significant spatial effects in urban GTFP. This further validates the findings from the hot-spot analysis and Moran’s I index.

4.4. Parallel Trends Test

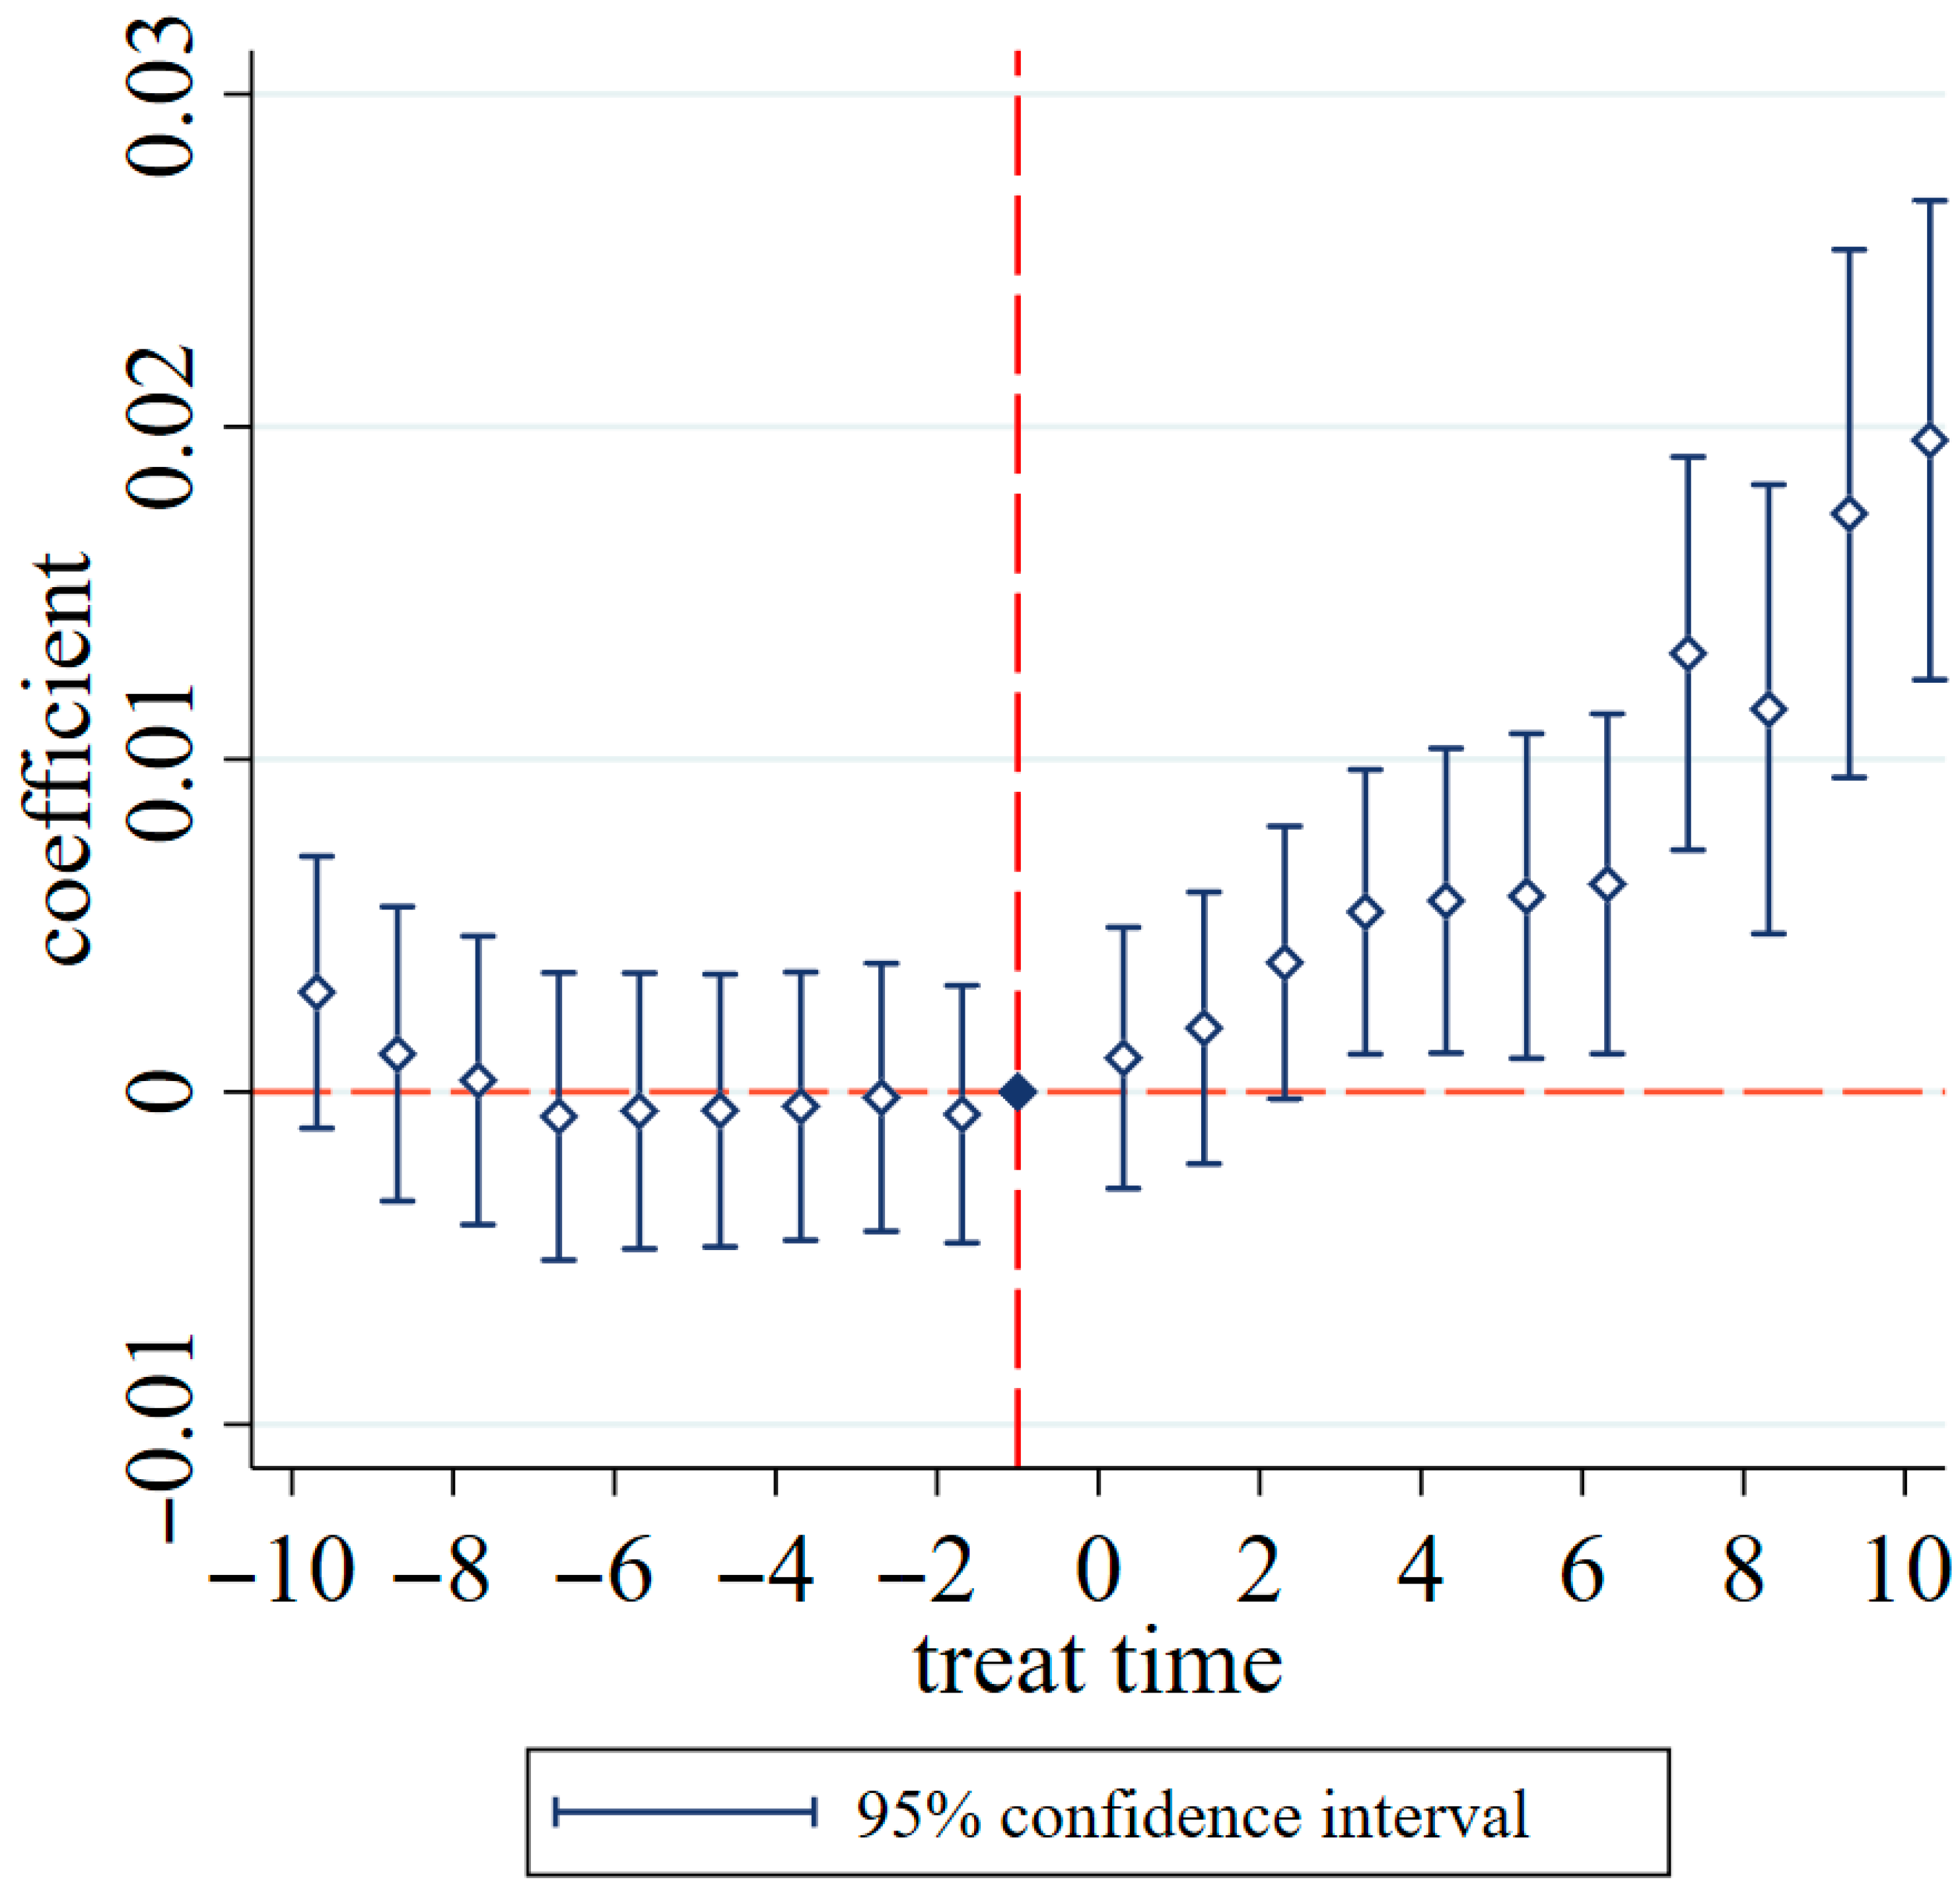
The parallel trend test is a prerequisite for the credibility of the DID method, requiring that no significant differences exist between the treated and control groups before policy implementation. This paper uses a SAR-event-study method to analyze parallel trends. Figure 5 presents the SAR-event-study results using the binary spatial matrix (the estimation results using the time-varying economic weight matrix and time-varying population weight matrix are provided in Figure A2). As shown in Figure 5, before the deployment of cloud computing in cities, the estimated coefficients are close to zero and statistically insignificant, indicating no significant systematic differences between the treated and control groups before the policy intervention. As cloud computing development progresses in cities, the estimated coefficients gradually increase, suggesting that cloud computing construction has a sustained positive effect on the GTFP. Therefore, the overall results indicate that the DID model satisfies the parallel trend assumption.

4.5. Placebo Test

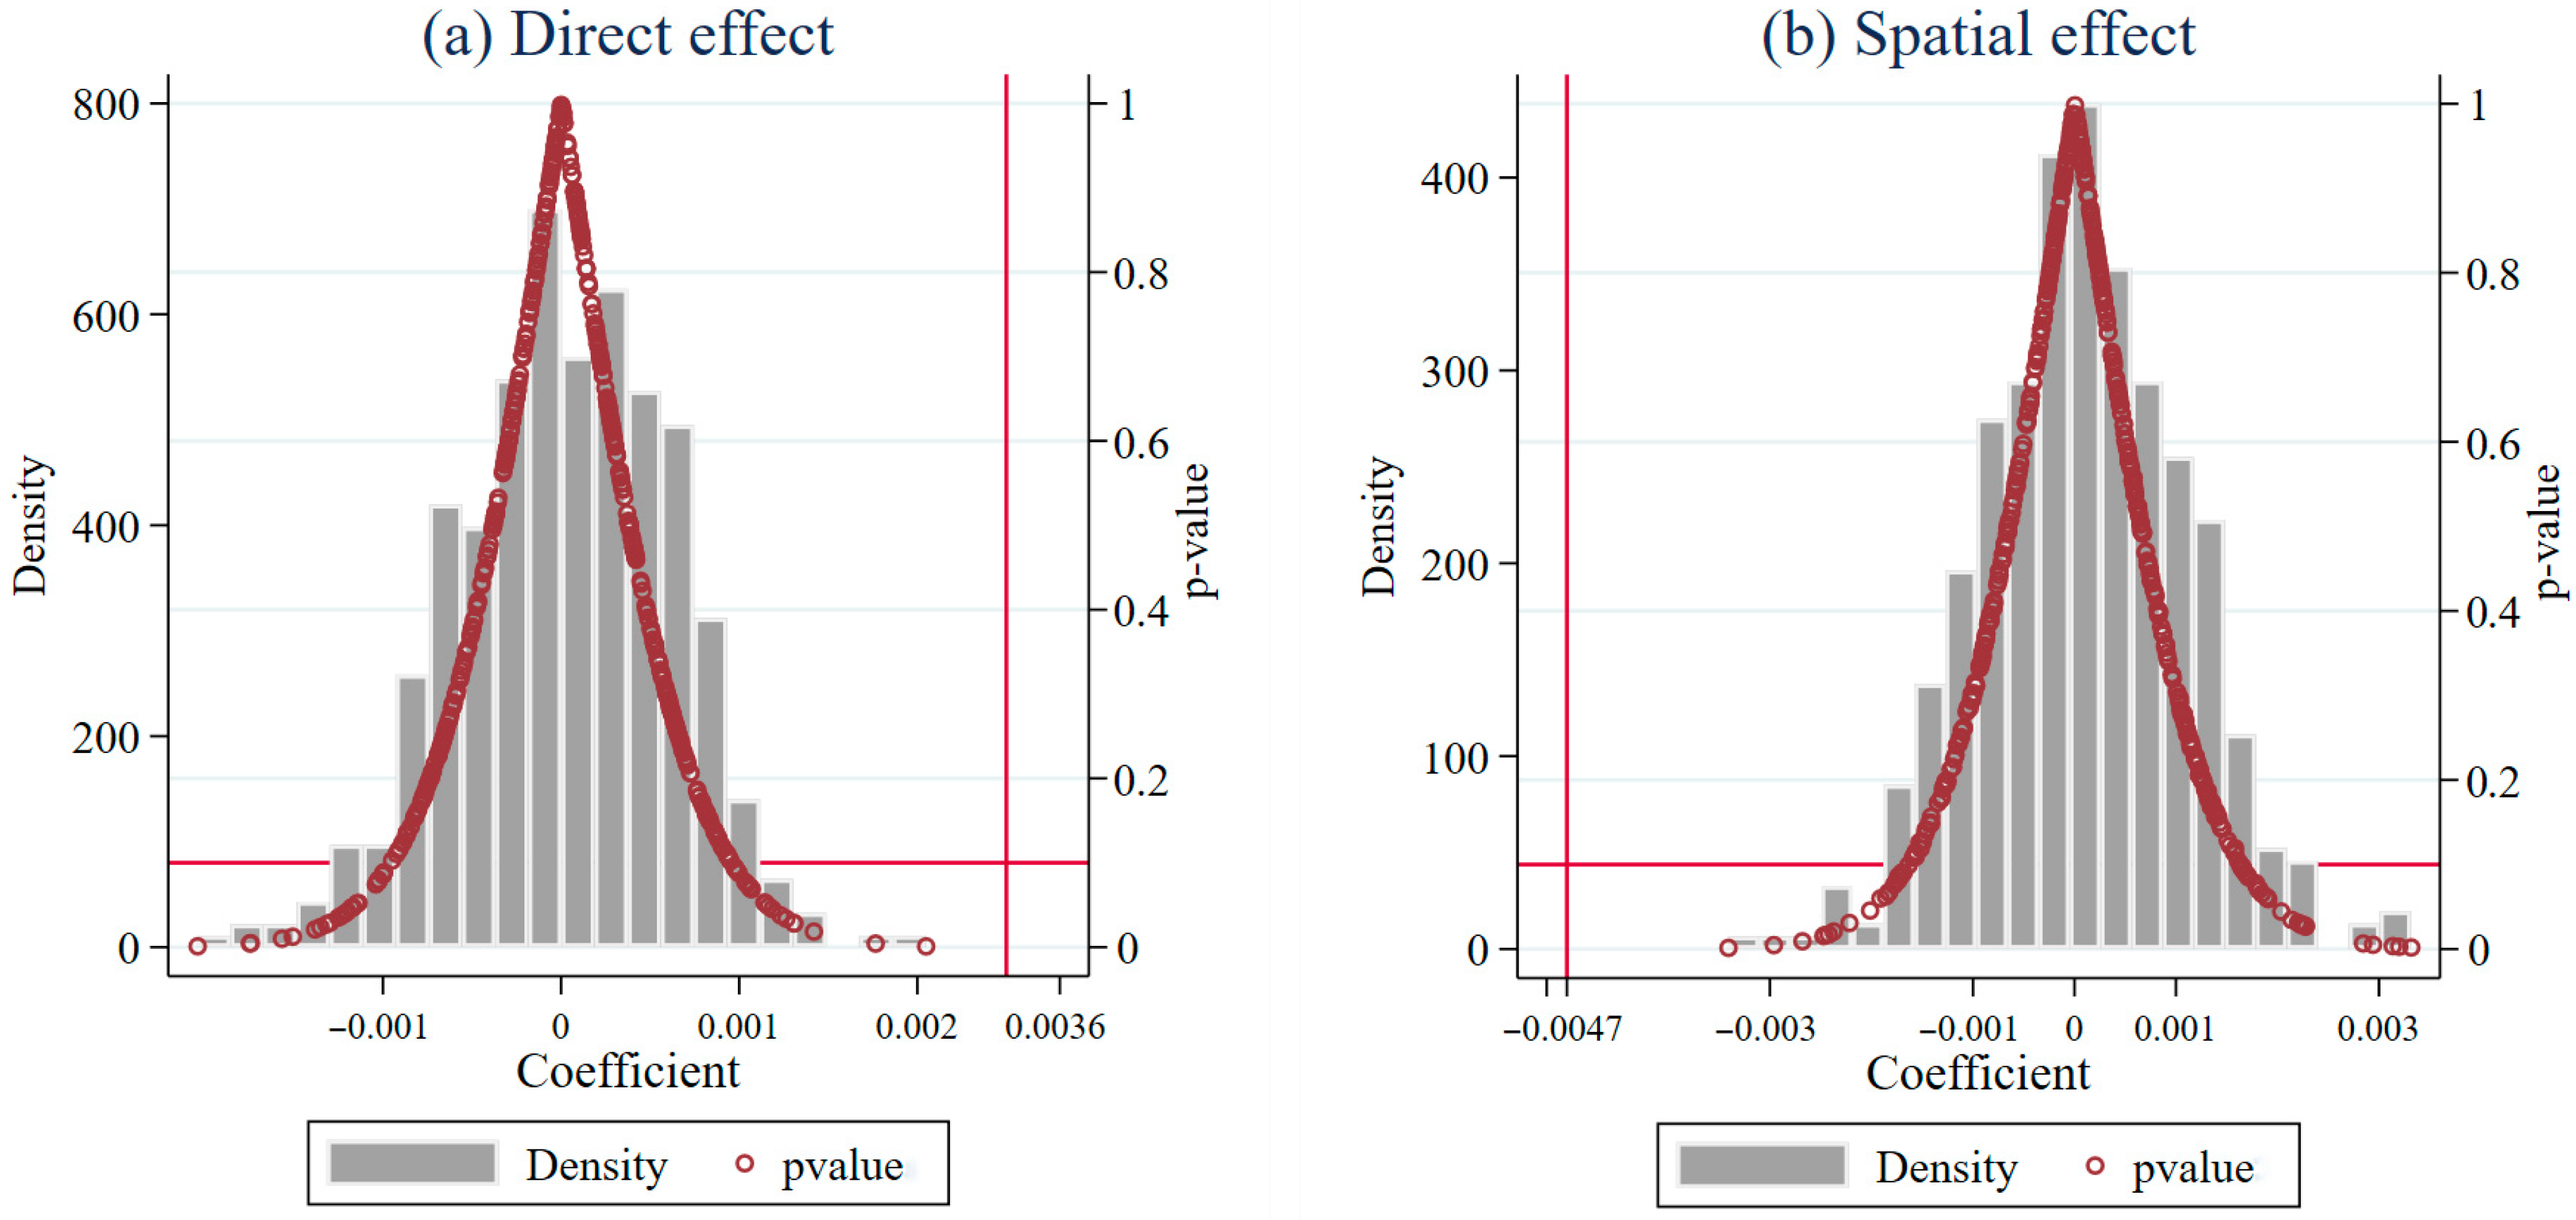
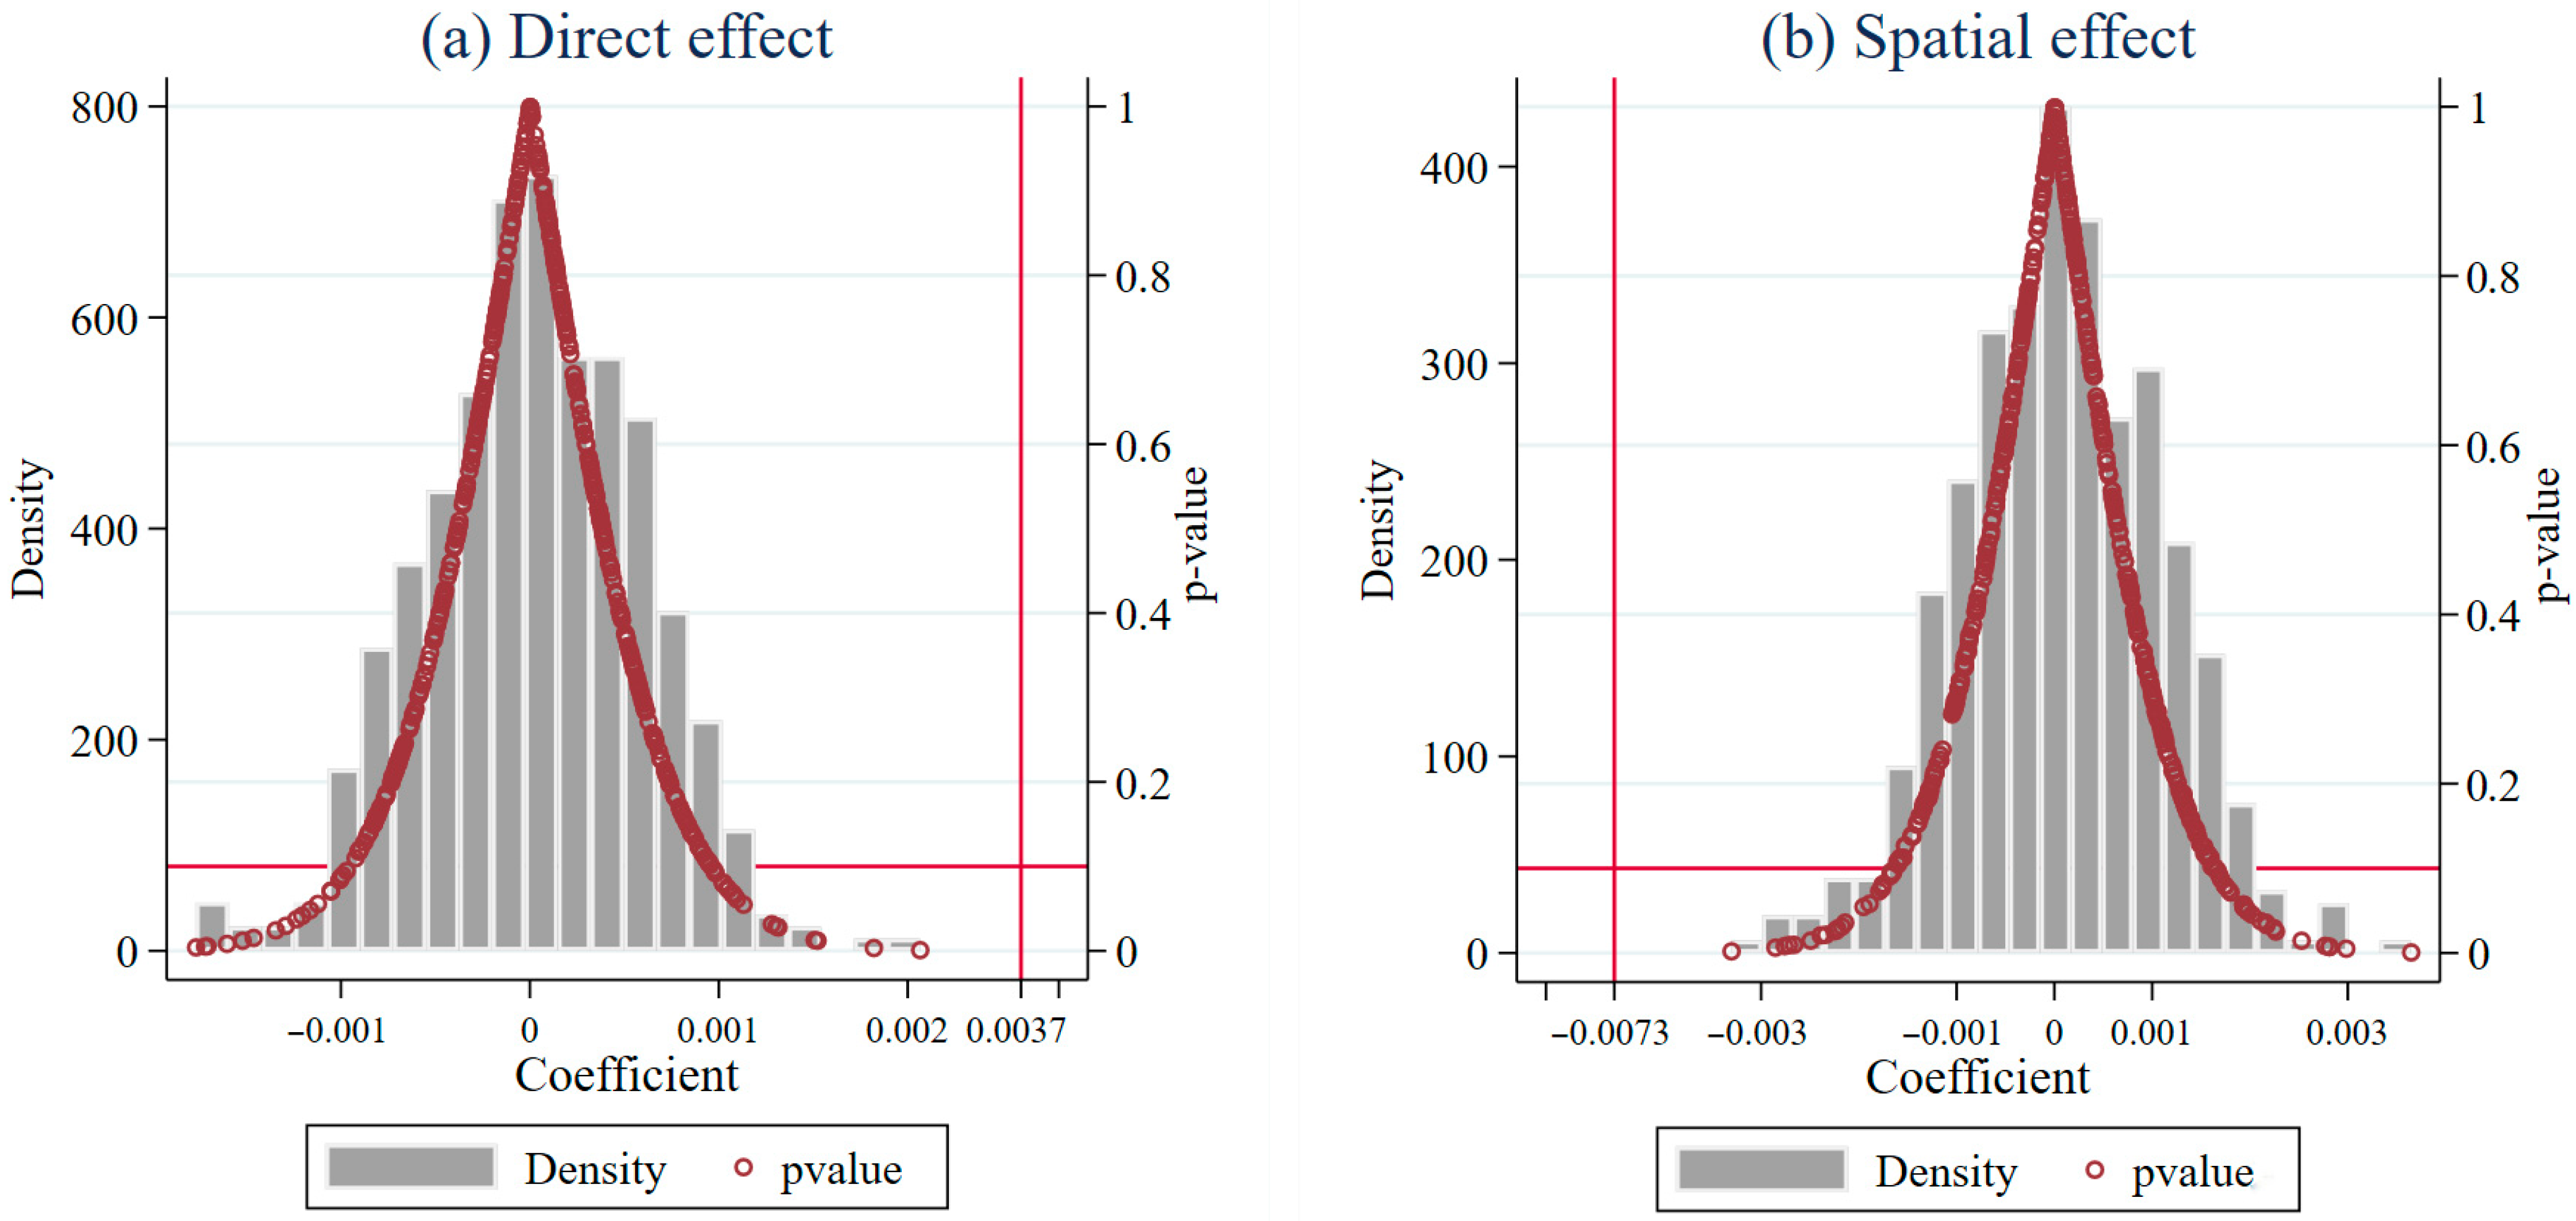
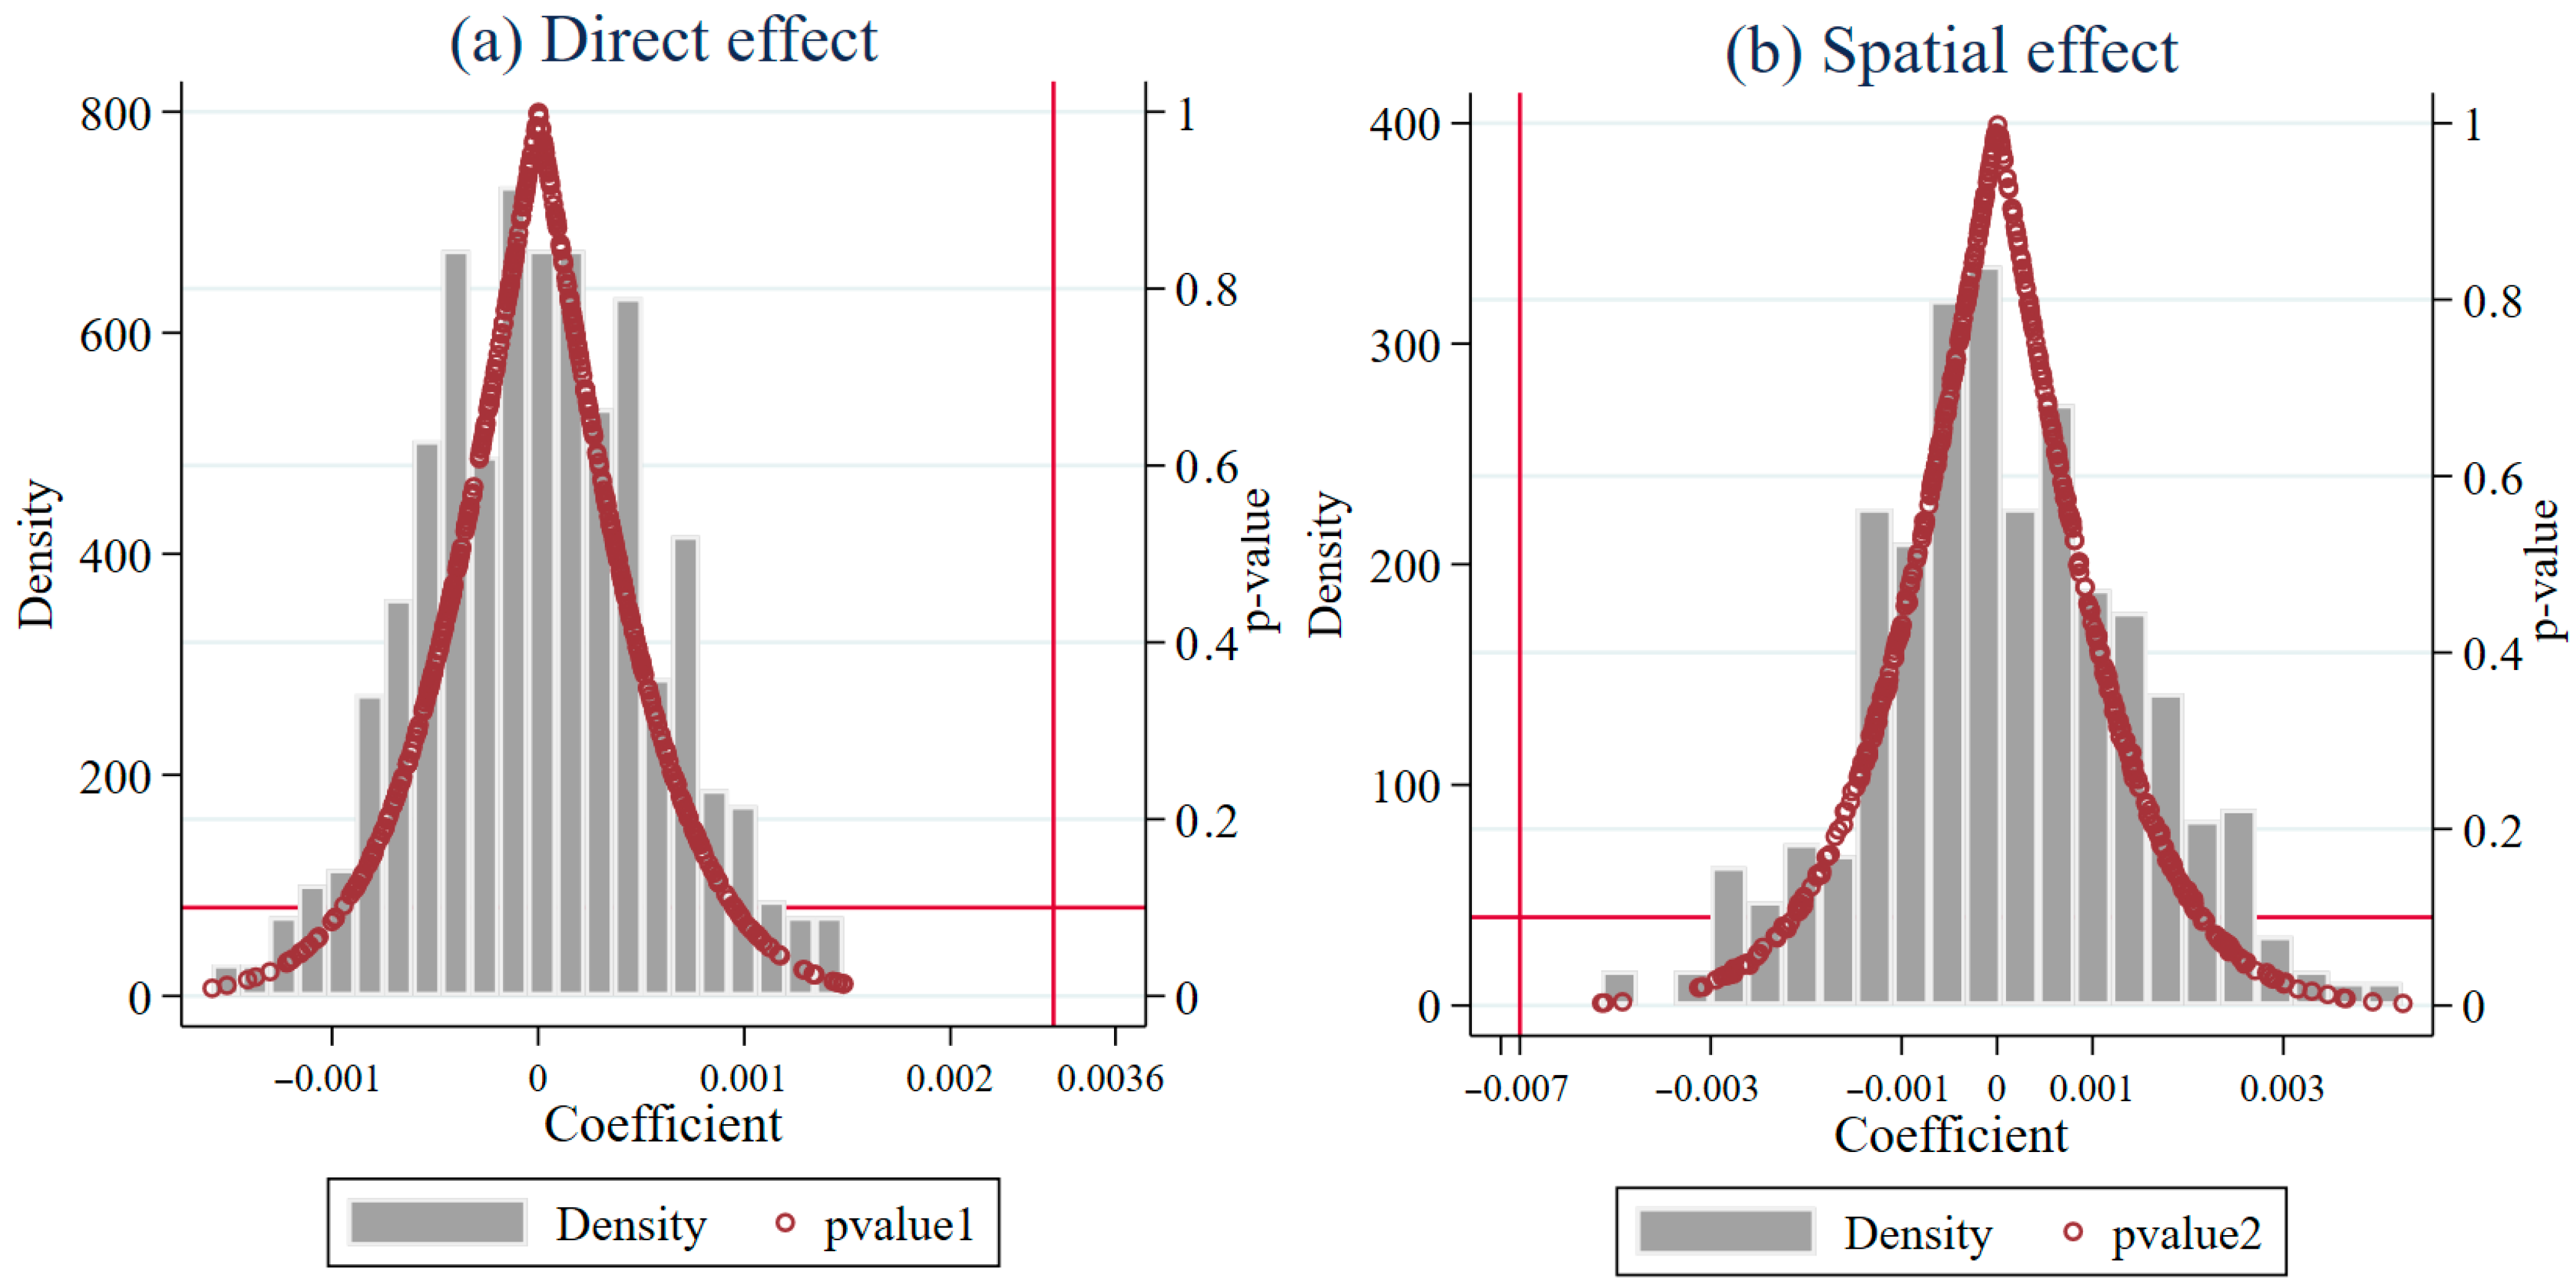
For the placebo test, we constructed a placebo policy by randomly assigning units to the treatment or control group. This process was repeated 500 times to generate the distribution of the estimated placebo coefficients. Figure 6 presents the placebo test results estimated using the binary spatial matrix (the estimation results using the time-varying economic weight matrix and time-varying population weight matrix are provided in Figure A3 and A4, respectively). Figure 6 shows that the placebo coefficients of both the direct effect ( T r e a t i × P o s t t ) and the spatial effect ( W T r e a t i × P o s t t ) are different significantly from the true values and are statistically insignificant. This indicates that the placebo policy does not produce a systematic effect, which demonstrate that the benchmark results are robust and pass the placebo test.

4.6. Robustness Test

4.6.1. Considering the Impact of Administrative Levels

Compared with regular prefecture-level cities, municipalities directly under the central government in China have higher administrative levels and enjoy greater advantages in resource access and policy support. Thus, to eliminate the potential influence of urban administrative hierarchy on the policy effects of cloud computing, this study excludes samples of municipalities and provincial capital cities for a robustness test. The estimation results in Table 4 indicate that after this exclusion, the direct effect of cloud computing remains significantly positive, and the coefficient of the spatial term W T r e a t i × P o s t t remains significantly negative. Thus, the findings confirm that the conclusions of this study are robust after controlling for the influence of administrative hierarchy.

4.6.2. Changing the Explained Variable

In the baseline regression, this study employs the super-SBM model to measure GTFP. To enhance robustness, we replace the measurement approach with the SBM model without super-efficiency and re-estimate the regression results. Table 5 shows that when GTFP is measured using the SBM model, the coefficient of T r e a t i × P o s t t remains significantly positive, and the estimated coefficient of W T r e a t i × P o s t t remains significantly negative. These findings align with the baseline results, confirming the robustness of the study’s core conclusions.

4.6.3. Dropping the Anticipated Effects of Policies

Prior to policy implementation, individuals in the treated group might have obtained advance information about the policy. Additionally, cloud computing requires a construction period before it is officially deployed in cities. Consequently, local economic entities may develop anticipatory effects regarding cloud computing deployment. To control for policy anticipation effects, we exclude samples from the first and second periods preceding implementation and re-estimate the regression coefficients. The results in Table 6 indicate that, even after accounting for anticipatory policy effects, the estimated coefficients for cloud computing remain consistent with the baseline regression, confirming the robustness of the core findings.

4.6.4. Heterogeneous DID

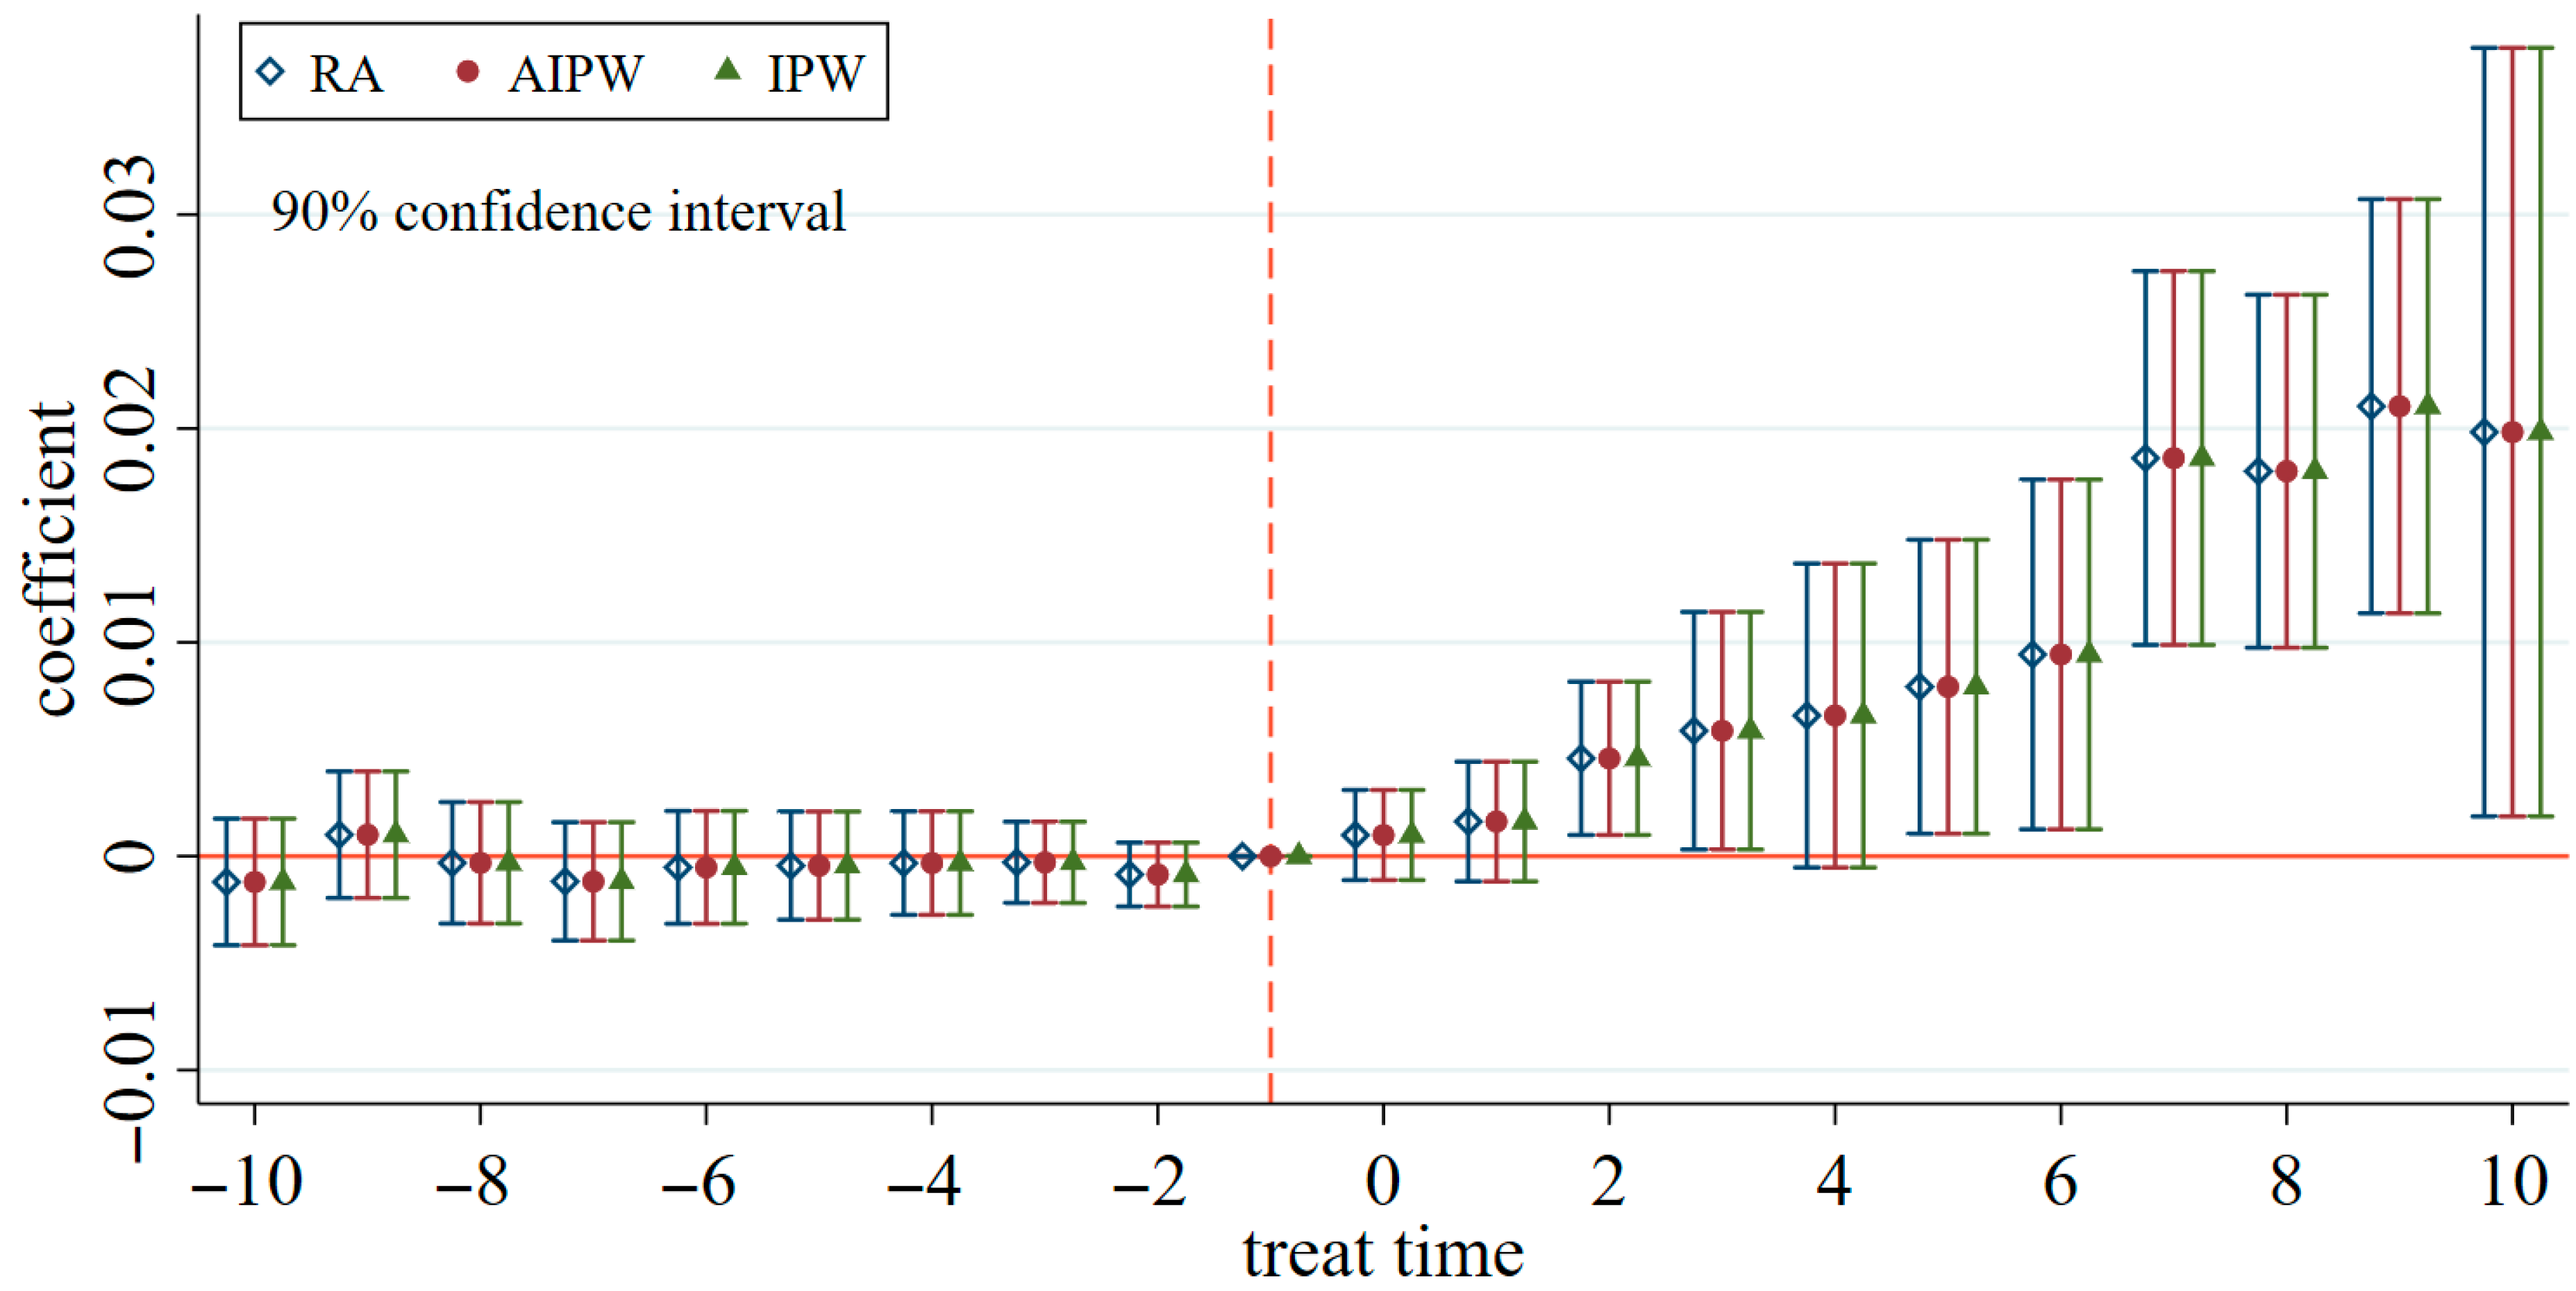
The prior studies have noted that traditional two-way fixed effects DID models are susceptible to bias from treatment effect heterogeneity, which may lead to unreliable estimates of policy effects. To address this concern, we employ the heterogeneous DID model proposed by [65]. Figure 7 presents the estimation results of the heterogeneous DID model. We estimate the regression coefficients by the method of regression adjustment (AR), inverse-probability weighting (IPW), and augmented inverse-probability weighting (AIPW). The results in Figure 7 show that the coefficient of cloud computing on GTFP was close to 0 and statistically insignificant prior to policy implementation, but turned significantly positive following policy implementation. Thus, after accounting for the issue of heterogeneity, the core conclusions of this study remain robust.

4.6.5. Control for the Effects of Economic Development and Digital Infrastructure

First, urban economic development may influence both urban GTFP and cloud computing adoption. To rule out its impact on the results, we additionally control for the natural logarithm of urban GDP (lngdp) and the natural logarithm of per capita GDP (lnper_gdp) in the regressions. Second, the application of urban cloud computing relies on digital infrastructure. Robust digital infrastructure enhances data transmission capacity, boosts computing power, and promotes the construction and diffusion of urban cloud computing. Some studies indicate that the digital technology has an important impact on green transformation [66]. Moreover, extanting studies often use the Broadband China Initiative as an exogenous shock for digital infrastructure [67]. Accordingly, we also employ the Broadband China Initiative as a proxy variable for digital infrastructure development. Meanwhile, the Chinese government has implemented the Information Benefiting People Project, a strategic initiative to drive and facilitate leapfrog development in people’s livelihood sectors through information technology. During the project’s implementation, information infrastructure was improved, addressing connectivity issues in livelihood-related areas such as healthcare, medical services, elderly care, employment, and domestic services. Collectively, we use the Broadband China Initiative (Dboard) and the Information Benefit People Project (Dinformation) as proxy variables for digital infrastructure. Finally, Table 7 presents the estimation results: Columns (1)–(3) control for the influence of economic development; Columns (4)–(6) control for digital infrastructure; and Columns (7)–(9) control for both. The results in Table 7 show that after controlling for urban economic development and digital infrastructure, the findings remain consistent with the baseline regression, confirming the robustness of our conclusions.

4.6.6. Control for the Effects of Sample Timing Selection

This study utilizes city-level panel data from China for the period 2000 to 2023, retaining 10 pre-treatment periods. Using 2000 as the sample starting year, on the one hand, a longer pre-treatment sample facilitates clearer observation of GTFP differences between the treatment and the control group cities. Additionally, the extended sample period enables examination of the long-term effects of cloud computing. To access the robustness of the chosen starting year, we first adjust the sample starting year, use 2003, 2005, and 2008 as alternative starting years, re-estimate the model. Figure 8A presents the estimation results. Second, we vary the number of pre-treatment periods retained, we retain only 9, 7, and 5 pre-treatment periods, respectively, and re-estimate the results. Figure 8B reports the outcomes of adjusting the pre-treatment sample length. Overall, the results in Figure 8A,B indicate that, after adjusting the sample starting year and pre-treatment sample length, the estimated coefficients are insignificant in all pre-treatment periods, and no obvious pre-trends are observed. The findings remain consistent with the baseline regression, confirming that our choice of 2000 as the sample starting year does not affect this study’s conclusions.

4.6.7. Measuring GTFP Using Other Energy Inputs

In the baseline regression, this study uses total social electricity consumption as the urban energy input. Although existing literature has adopted this approach, electricity consumption cannot fully substitute for total energy input. For cities where electricity assumption accounts for a low proportion of total energy consumption, using electricity consumption to represent total energy consumption will underestimate urban energy consumption, thereby overestimating urban GTFP. However, there is currently no publicly available statistical data disclosing overall urban energy consumption. To mitigate the impact of using urban electricity consumption as a proxy for urban energy consumption on GTFP measurement, this study measures GTFP under alternative different energy inputs specification. First, following the studies of Yang et al. (2023) [68] and Chand et al. (2009) [69], this study measures the total urban energy consumption and recalculates urban GTFP. Table 8 reports the estimation results for Columns (1)–(3). Second, without considering energy input, following the research of Liu et al. (2025) [70] and Xia and Xu (2020) [71], this study uses only labor and capital as input factors to recalculate GTFP. Table 8 presents the estimation results for Columns (4)–(6). Overall, Table 8 analyzes the results under different energy inputs. The estimation results show that across different specifications, the coefficient of the core explanatory variable remains consistent with the baseline regression. Therefore, after mitigating the impact of energy input, the conclusions of this study remain robust.

5. Mechanism Analysis and Discussion

5.1. Mechanism Analysis

First, Columns (1) to (3) of Table 9 examine the impact of cloud computing on urban knowledge spillovers. The results indicate that cloud computing significantly promotes the intra-urban knowledge spillovers. Empirical findings show that cloud computing facilitates knowledge exchange and dissemination among economic entities within cities. Then, Columns (4) to (6) analyze the impact of cloud computing on green invention patent innovation (Green_Inno1) and Columns (7) to (9) analyze the impact of cloud computing on green utility model patent innovation (Green_Inno2) in cities, respectively. The estimated coefficients in Columns (4) to (9) are all positive and statistically significant at the 1% level, indicating that cloud computing significantly promotes urban green innovation. Therefore, the results of Table 9 demonstrate that cloud computing enhances intra-urban knowledge dissemination, drive knowledge spillovers, and contribute to the advancement of green technological innovation. This, in turn, promotes the adoption of urban green technologies and boosts the improvement of urban GTFP. Hypothesis 2 proposes that the cloud computing can promote knowledge spillovers within cities, drive technological breakthroughs, facilitate urban green innovation, and thereby enhance urban GTFP. The results in Table 9 strongly support the view that cloud computing promotes knowledge spillovers and drives green innovation breakthroughs in cities. Therefore, Hypothesis 2 is well-supported.
Second, Table 10 analyzes the impact of cloud computing on urban labor factor distortion (Labor_Miss), capital factor distortion (Capital_Miss), and overall factor distortion (Miss_All). Columns (1) to (3) examine the impact of cloud computing on labor factor distortion, with all coefficients being statistically significant and negative. Columns (4) to (6) report the impact of cloud computing on capital factor distortion, showing significantlynegative estimates. Meanwhile, Columns (7) to (9) show the impact of cloud computing on overall factor distortion, where the coefficients are statistically significant negative at the 1% level. Overall, empirical results demonstrate that urban cloud computing significantly reduces labor factor distortion, capital factor distortion, and overall factor distortion. Consequently, cloud computing promotes effective factor allocation, reduces unnecessary factor inputs, achieves intensive and efficient use of factors, avoids waste, and thereby enhances urban GTFP. In Hypothesis 3, this study posits that the urban cloud computing can improve resource allocation efficiency, thereby enhancing urban GTFP. Using study employs HK [61] analytical framework, Table 10 empirically tests this hypothesis from the perspectives of capital factor allocation, labor factor allocation, and overall factor allocation. The results confirm that cloud computing can promote factor allocation efficiency. Therefore, through the mechanism analysis in Table 10, this study fully supports the analysis of Hypothesis 3.

5.2. Heterogeneity Analysis

This study further analyzes the heterogeneous policy effects of urban cloud computing from three perspectives: urban economic scale, coastal status, and location within an urban agglomeration.
First, we examine the heterogeneity in economic scale. Significant economic disparities exist between large and small Chinese cities. Large cities typically have large economic scales, characterized by big populations and diverse industries, whereas small cities have smaller economic scales and less developed industries. Does cloud computing exert an effect on cities with differing economic scales? To address this, this study categorizes economic scales into large-scale and small-scale cities to examine the heterogeneous impacts of cloud computing under different economic scales, with the estimation results reported Table 11. The coefficients of Treat × Post in Columns (1)–(6) are significant at the 10% level, indicating that cloud computing can promote GTFP in both large-scale and small-scale cities. However, the coefficients are larger in small-scale cities. The coefficients of the spatial term ( W T r e a t i × P o s t t ) are −0.0111, −0.0106, and −0.00791 in Columns (2), (4), and (6), respectively, all significant at the 1% level. In contrast, for larger-scale cities, the coefficients of W T r e a t i × P o s t t are only significant in Columns (1) and (5), and these coefficients are smaller than the lower-scale cities. This indicates that the spatial term coefficients suggest cloud computing in neighboring cities has a greater negative effect on small-scale cities. After neighboring cities adopt cloud computing, small-scale cities experience a stronger siphon effect that disproportionately hampers their GTFP.
For small-scale cities, urban capital investment and infrastructure development are relatively backward. For instance, the average log capital stock is 16.12 in small-scale cities, compared to 17.26 in larger-scale cities, highlighting their lower investment level. In small-scale cities, capital further flows to large cities, thus exposing them to a more pronounced siphon effect. Meanwhile, in cities implementing cloud computing, the continuous improvement in industrial development and digitalization levels may trigger a siphon effect, where talent and capital flow toward these cloud computing cities. While the agglomeration effect of cloud computing enhances local GTFP, it may simultaneously suppress the green development of surrounding small-scale cities through factor drainage mechanisms. Cloud computing cities, equipped with advanced digital infrastructure and green innovation platforms, establish platforms that improve massive data processing capabilities and foster R&D collaboration [14,37], creating strong attractions for technical talent and digitally skilled labor. Small-scale cities, however, have low resistance to large cities and struggle to prevent the outflow of talent and resources. Second, as an emerging information technology critical to future urban economic development [36,59,72], cloud computing exhibits comparative advantages in green project financing, digital technology investment, and ecosystem modeling [33]. This makes it highly attractive to regional venture capital and industrial funds, diverting financial resources from green industry projects in surrounding small-scale cities. Consequently, small-scale cities struggle to advance infrastructure investments in clean energy substitution and circular economy parks, slowing improvements in resource utilization efficiency and the green transition process. Thus, the development of urban cloud computing may generate siphon effects that widen regional gaps in green development, exerting adverse impacts on the GTFP of neighboring small-scale cities.
Second, we examine the heterogeneity policy effect between coastal and non-coastal cities. Overall, coastal cities exhibit higher levels of economic development, superior market conditions, and more advanced technological capabilities. Therefore, does the impact of cloud computing on GTFP differ significantly between coastal and non-coastal regions? This study divides samples into coastal and non-coastal cities based on whether their provinces are coastal. Column (1), Column (3), and Column (5) in Table 12 present the impact of cloud computing on GTFP in coastal cities, while Column (2), Column (4), and Column (6) report the impact of cloud computing on non-coastal cities. The results show that the estimated coefficients of Treat × Post are significantly positive. However, the coefficient of W T r e a t i × P o s t t is significantly positive in Column (1), Column (3), and Column (5), but significantly negative in Column (2), Column (4), and Column (6). This suggests that in coastal cities, cloud computing generate positive spillover effects, enhancing GTFP in neighboring cities. Thus, compared to non-coastal cities, cloud computing in coastal cities not only boosts local GTFP but also generates positive spillover effects on neighboring cities.
The significant positive spillover of cloud computing in coastal regions on urban GTFP stems primarily from strengthened inter-regional cooperation. First, coastal regions (e.g., the Yangtze River Delta and Pearl River Delta) have mature industrial coordination mechanisms, enabling leading digital economy firms and neighboring cities to form rational division of labor chains [73,74]. Central cities focus on breakthroughs in core technologies such as algorithms and big data, while smaller cities undertake segments including smart environmental protection equipment manufacturing and industrial internet applications. Cross-city data interoperability optimizes production processes, reducing resource misallocation and redundant construction [75,76]. Second, the interconnectivity of infrastructure such as ports and high-speed railways facilitates inter-regional cooperation [77]. Coastal regions, with more comprehensive transportation infrastructure networks, facilitate inter-regional collaboration and drive the positive technological spillover of cloud computing. Third, lower administrative monopolies can encourage technological exchange and regional cooperation [78]. Coastal regions exhibit higher marketization levels and lower administrative monopolies [79,80], enabling the rapid diffusion of green technologies within the region and avoiding the short-sighted “beggar-thy-neighbor” behavior. In summary, the stronger coordination and cooperation, lower administrative monopolies, and well-developed infrastructure in coastal regions collectively promote positive spillovers in GTFP.
Finally, we examine the heterogeneity in urban agglomeration scope. During China’s urbanization, the construction of mega and super-large urban agglomerations has been prominent. Within urban agglomerations, information exchange and material circulation among cities are more frequent, supported by shared infrastructure that facilitates integrated regional development. Therefore, this study examines the differential effects of cloud computing on GTFP for cities inside and outside urban agglomerations, with the results reported in Table 13. The results indicate that cloud computing significantly promotes the improvement of GTFP in cities inside urban agglomerations but has no significant impact on the outside. Meanwhile, the coefficient of the spatial term W T r e a t i × P o s t t in Column (1) and (5) are significantly negative, suggesting a significant siphon effect of cloud computing within urban agglomerations. Thus, on the one hand, this study finds that cloud computing enhances GTFP within cities. On the other hand, significant competition exists among cities within an urban agglomeration, and the adoption of cloud computing by one city can trigger a notable siphon effect on neighboring cities.

5.3. The Impact of Industrial Agglomeration

This study further investigates the role of industrial agglomeration in the context of cloud computing. It calculates the location entropy of industrial development at the city level, incorporates it as an interaction term into the regression model, and the estimation results are presented in Table 14. The interaction term T r e a t i × P o s t t × A g g is significantly positive in Columns (1)–(2), suggesting that urban industrial agglomeration amplifies the positive effect of cloud computing on GTFP. Specially, in cities with higher degree of industrial agglomeration, industrial agglomeration amplifies the promoting effect of cloud computing on technological exchanges and sharing among enterprises. The rapid adoption of cloud computing in these agglomerated areas facilitates the intelligent and digital transformation of industrial development. Therefore, industrial agglomeration strengthens the positive contribution of cloud computing to GTFP.

5.4. Mitigating the Siphon Effect of Cloud Computing

The baseline regression in this study indicate that urban cloud computing exhibits a significant siphon effect, and the construction of cloud computing at the city level remains in a stage of mutual competition. Therefore, fostering cooperation among cities to generate positive spatial spillover effects of cloud computing on urban GTFP is crucial for urban development. In the process of urban development, urban policies play a crucial role in urban industrial development, regional collaborative cooperation, and other areas. Therefore, this study analyzes approaches to mitigating the siphon effect of cloud computing on urban GTFP from the perspective of regional policies.
First, urban agglomeration integration enables the sharing of infrastructure, promotes the flow of factors within urban agglomerations and metropolitan areas, and improves factor mobility efficiency. Meanwhile, central cities with agglomerations can generate positive spillover effects, facilitating the development of peripheral cities within the urban agglomerations. In the process of advancing urban agglomeration integration, with the positive radiation effect of central cities, cloud computing can promote the improvement of GTFP in peripheral cities. Therefore, this study examines whether urban agglomeration integration can mitigate the siphon effect of cloud computing. By selecting the implementation timelines of integration in China’s four major urban agglomerations, the Beijing-Tianjin-Hebei, Yangtze River Delta, Pearl River Delta, and Chengdu-Chongqing urban agglomerations, this study tests whether the integration of these urban agglomerations can promote the positive spatial spillover effects of cloud computing. As reported in Columns (1)–(3) of Table 15, the estimated coefficient of the interaction term ( W T r e a t i × P o s t t × Inter) is significantly positive across different spatial weight matrices. This indicates that during the integration of the four major urban agglomerations, the construction of cloud computing within these agglomerations can exert significant positive spillover effects, alleviating the siphon effect of cloud computing internally. In summary, we find that regional integration can reduce inter-city competition and unlock the positive green spillover effects of cloud computing to surrounding cities. Therefore, enhancing regional integration is a key regional policy avenue for mitigating the siphon effect of cloud computing.
Second, in terms of inter-city industrial development and factor mobility, administrative monopoly plays a significant role. Local governments may hinder the free flow of factors through administrative monopoly, exerting a negative effect on economic efficiency. Thus, restricting local governments from setting entry barriers and reducing their intervention in cross-regional investment are important components of policy design. In 2009, China implemented the Anti-Monopoly Law to reduce local administrative monopoly and promote the free adjustment of industries and investments. During policy implementation, it may interact with industrial policies, regional policies, etc. This study analyzes the impact of reducing regional administrative monopoly on mitigating the siphon effect of cloud computing from the perspective of the Anti-Monopoly Law implementation. Theoretically, a decrease in regional administrative monopoly enhances the across-regional flow of factors. As a key component of the digital economy, cloud computing, under reduced administrative monopoly, can proactively provide computing power services to surrounding cities, promoting the growth of their GTFP. Therefore, regional administrative monopoly policies can help alleviate the siphon effect of cloud computing on GTFP. Following the approach of [81], this study define regions in the top quartile of administrative monopoly rankings before 2009 as the treatment group. After 2009, these regions with higher administrative monopoly experienced greater policy shocks, leading to further reductions in administrative monopoly and promoting the flow of industries, capital, and factors. A policy dummy variable Dmonopoly for administrative monopoly is constructed, with the treated group set to 1 after 2009. Introduced into the model in the form of an interaction term, Table 16 presents the empirical results. The results show that the coefficients of W T r e a t i × P o s t t × Dmonopoly are all significantly positive, indicating that policies to reduce regional administrative monopoly can mitigate the siphon effect of cloud computing on GTFP. Therefore, in mitigating the siphon effect of cloud computing on urban GTFP, it is necessary to further formulate relevant policies to reduce regional administrative monopoly.
Third, international trade liberalization can promote efficient factor mobility, enhance urban foreign economic activities, and drive regional economic growth. To advance international trade liberalization, China has implemented cross-border e-commerce comprehensive pilot zone policies in various cities. These pilot zones play a positive role in facilitating the transformation and upgrading of traditional industries and promoting industrial digital development. With the growth of cross-border e-commerce, urban foreign economic activities expand, requiring increased raw material trade with neighboring cities for urban international trade, thereby stimulating inter-reginal economic development. This process continuously strengthens economic cooperation between cities through e-commerce. Moreover, advancements in technologies such as cloud computing further promote e-commerce development. Therefore, cloud computing exerts positive spillover effects by facilitating e-commerce and urban international economic trade, thereby mitigating its siphon effect on urban GTFP. Accordingly, this study examines the interactive policy effect between cross-border e-commerce comprehensive pilot zones (DEtrade) and urban cloud computing, and presents the estimation results in Table 17. The results in Table 17 show that the coefficients of W T r e a t i × P o s t t × DEtrade are all positive, with the p-value for Column (1) at 0.12, Column (2) at 0.19, and Column (3) significant at the 10% level. These findings indicate that cross-border e-commerce comprehensive pilot zones can alleviate cloud computing’s siphon effect. Overall, the empirical results demonstrate that promoting urban international economic activities and advancing electronic trade liberalization are effective pathways to mitigate the siphon effect of cloud computing on urban GTFP.
In summary, from the perspective of regional policies, this study analyzes effective policy paths to mitigate the negative siphon effect of cloud computing on the urban GTFP. It is concluded that promoting integrated development of urban agglomerations, reducing administrative monopoly to facilitate factor mobility, and advancing urban international economic activities are key strategies to alleviate the siphon effect of cloud computing on urban GTFP.

6. Conclusions

With the rapid development of new-generation information technologies such as cloud computing, artificial intelligence, big data, and blockchain, socioeconomic development has been profoundly impacted. In recent years, cloud computing growth has drawn significant attention. From an urban development perspective, this study addresses the question of how urban cloud computing usage affects urban green total factor productivity (GTFP). The main contributions of this paper lie in advancing the study of the digital economy at a more granular level, investigating the economic impact of cloud computing, and enriching the study of the new-generation information technology applications in environmental economics. Through the study of urban cloud computing, this study identifies internal pathways for improving urban green and sustainable economies by developing urban cloud computing infrastructure. It offers a positive reference for unpacking the black box of interactions between the digital economy and environmental economics. Given the comprehensive impact of the digital economy on the economy, this study incorporates the spatial interaction effects of urban cloud computing into the analytical framework. Using a spatial economics framework, it analyzes the combined impact of new-generation information technology (represented by cloud computing) on environmental economics, offering a spatial economic perspective on how the digital economy influences environmental economics. This further enriches spatial economics theory regarding the economic impacts of new-generation information technology.
This study employs text analysis to extract the policy adoption timeline of cloud computing from official documents and constructs a quasi-natural experiment framework. Using panel data from 284 cities in China spanning 2000–2023, the impact of urban cloud computing on the urban GTFP is analyzed through a spatial difference-in-differences (DID) model. First, in the baseline results, the results of spatial Durbin-DID model indicate two key findings: On the one hand, urban cloud computing can promote the improvement of urban GTFP. On the other hand, the spatial term results suggest that the development of cloud computing among cities remains in a competitive state, with the siphon effect of cloud computing exerting a negative spatial impact on the GTFP of neighboring cities. These results pass the parallel trends test and placebo test and remain robust under various robustness tests. Second, using the Spatial Autoregressive-DID (SAR-DID) model, the mechanism analysis reveals that cloud computing enhances urban GTFP by facilitating resource allocation efficiency and improving green innovation. Third, heterogeneity analysis shows that cloud computing has a more pronounced siphoning effect on the small cities, generates significant positive spatial spillovers in coastal cities, and notably promotes the GTFP of cities within urban agglomerations, though it has no significant impact on non-urban-agglomeration cities. Additionally, this paper finds that industrial agglomeration strengthens the positive effect of cloud computing on green total factor productivity. Furthermore, from the perspective of regional policies, this paper finds that promoting the integrated development of urban agglomerations, reducing administrative monopoly, facilitating free factor mobility, and advancing free international trade are effective pathways to mitigate the siphon effect of cloud computing on urban GTFP. Finally, based on the empirical findings, corresponding policy recommendations are proposed:
(1)
Constructing city-level green data cloud platforms to activate the emission reduction empowerment function of data elements. The empirical findings of this paper indicate that urban cloud computing can promote the improvement of urban GTFP. As a new-generation information technology, cloud computing can enhance data processing capabilities; therefore, it is necessary to further integrate regional data to leverage the data processing advantages of cloud computing. ① Comprehensively advance the development of unified city-level green data cloud platforms. Integrate multi-dimensional data including enterprise production energy consumption, carbon emission monitoring, park environmental quality, and renewable energy output, break down data silos among departments and enterprises, and form a green data resource pool covering the urban economic system. ② Guide enterprises to connect green-related data from production, operation, and management processes to the cloud, enabling accurate identification of high-energy-consuming links and emission reduction potential. The dynamic effects analysis in this paper reveals that the promotional effect of urban cloud computing on urban GTFP exhibits a certain time lag, with a significant positive effect emerging only after two periods. Therefore, governments need to further facilitate the adoption of cloud computing across different economic entities and encourage enterprises to proactively utilize cloud computing. ③ Support research institutions and enterprises in conducting joint R&D on green technologies based on cloud platforms. This facilitates the transformation of data elements into green productive forces, thereby enhancing urban GTFP from the perspective of technological innovation.
(2)
Cultivating cloud-based green resource collaboration platforms to promote the formation of cross entity emission reduction collaboration networks. ① Support leading enterprises in fields such as new energy, environmental protection, and high-tech manufacturing within cities to build cross entity cloud-based green resource sharing platforms. ② The empirical results indicate that urban cloud computing exhibits a significant negative siphon effect. Therefore, it is necessary to further promote cooperation among different economic entities and leverage the positive spillover mechanisms of technology. For instance, prioritize the integration of clean energy data resources, low-carbon technology resources, and idle green computing resources. Encourage large enterprises to open up redundant cloud computing resources and support small, medium, and micro enterprises in carrying out lightweight innovation activities such as low-carbon product design and carbon emission accounting. ③ Industrial agglomeration can mitigate the siphon effect of urban cloud computing on urban GTFP. It can promote the establishment of platform collaboration incentive mechanisms in industrial agglomeration areas, providing incentive measures such as carbon credits and policy preferences to enterprise clusters that actively share green resources. This, in turn, fosters the formation of a collaborative model with data interoperability, facilitates coordinated emission reduction across upstream and downstream industrial chains within industrial agglomeration areas, and enhances urban green total factor productivity by optimizing the allocation efficiency of green factors.
(3)
Optimizing support policies for green cloud applications to reduce the corporate transformation cost. To address enterprises’ green transformation needs during cloud computing adoption, a differentiated policy support system is introduced. ① Fiscal subsidies and support should fully account for differences in regional economic scale. Heterogeneous results indicate that cloud computing exerts a stronger siphon effect in small-scale cities. Therefore, to advance the balanced development of urban GTFP, it is essential to strengthen subsidies for cloud computing in small-scale cities, for instance, by providing tax reductions or financial support to enterprises that deploy cloud computing applications such as cloud-based carbon management systems and green supply chain management platforms. ② Improve urban cloud computing infrastructure by promoting the adoption of low-carbon technologies (e.g., photovoltaic power supply and waste heat recovery) in data centers to reduce the carbon emission intensity of cloud computing infrastructure itself. Simultaneously, expand the integrated coverage of 5G, edge computing, and green cloud platforms to enhance the response efficiency of cloud computing’s green applications. ③ Further promoting the integrated development of urban agglomerations, reducing regional administrative monopoly, facilitating free factor mobility, and advancing urban international economic activities. In further analysis, this paper finds that the implementation of urban agglomeration integration policies, the reduction in administrative monopoly via the Anti-Monopoly Law, and the rollout of cross-border e-commerce comprehensive pilot zone policies are effective pathways to mitigate the siphon effect of cloud computing on urban GTFP. Therefore, to enhance the positive spillover effects of urban cloud computing on GTFP, government policy formulation should further advance regional integrated development, shifting toward directions that promote cross-regional exchange and cooperation, enable free factor mobility, and drive international economic and trade development.

Author Contributions

L.Y. performed the experiments, analyzed data and wrote the paper. Y.D. and W.Z. created the research concept, organized the work, designed the experiments, analyzed data. L.Y. provided advice and research strategy. Y.D. analyzed data. All authors have read and agreed to the published version of the manuscript.

Funding

This research was funded by the National Social Science Fund Project: 2023BJ0266.

Data Availability Statement

The data presented in this study are available on request from the author. Readers can contact email liangjun_yi@foxmail.com for free data, and refer to Section 3.4 in this article for data sources.

Acknowledgments

The authors acknowledge the support of the Xiamen University, the Southwestern University of Finance and Economics, and the Yunnan University of Finance and Economics.

Conflicts of Interest

The authors declare no conflicts of interest.

Abbreviations

The following abbreviations are used in this manuscript:
GTFPGreen Total factor productivity
DIDDifference-in-Differences
SDIDSpatial Difference in differences
SDM-DIDSpatial Durbin Difference-in-Differences model
SARSpatial autoregressive
SAR-event-studySpatial autoregressive event-study method
SAR-DIDSpatial Autoregressive Difference-in-Differences model

Appendix A

The map of China’s administrative divisions is as follows:
Figure A1. The map of China’s administrative divisions.
Sustainability 17 09828 g0a1
Figure A2 shows parallel trends test using time-varying weight matrix.
Figure A2. Parallel Trends Test using time-varying weight matrix. (a) using the time-varying economic weight matrix and (b) using the time-varying population weight matrix. The vertical dashed line indicates the selection of the first pre-policy period as the baseline for the event-study method.
Sustainability 17 09828 g0a2
Figure A3 present the Placebo test using the time-varying economic weight matrix.
Figure A3. The Placebo test using the time-varying economic weight matrix. (a) presents the placebo test of the coefficient for T r e a t i × P o s t t ; (b) presents the placebo test of the coefficient for W T r e a t i × P o s t t . The vertical red line represents the estimated true value.
Sustainability 17 09828 g0a3
Figure A4 present the Placebo test using the time-varying population weight matrix.
Figure A4. The Placebo test using the time-varying population weight matrix. (a) presents the placebo test of the coefficient for T r e a t i × P o s t t ; (b) presents the placebo test of the coefficient for W T r e a t i × P o s t t . The vertical red line represents the estimated true value.
Sustainability 17 09828 g0a4

References

  1. Dai, S.; Tang, D.; Li, Y.; Lu, H. Digital Trade, Trade Openness, FDI, and Green Total Factor Productivity. Int. Rev. Financ. Anal. 2025, 97, 103777. [Google Scholar] [CrossRef]
  2. Lyu, Y.; Xiao, X.; Zhang, J. Does the Digital Economy Enhance Green Total Factor Productivity in China? The Evidence from a National Big Data Comprehensive Pilot Zone. Struct. Change Econ. Dyn. 2024, 69, 183–196. [Google Scholar] [CrossRef]
  3. Yang, S.; Chen, Y.; Chen, H.; Ye, B.; Shao, S. Digital Enterprise Distribution and Green Total Factor Productivity: A Spatial Agglomeration Perspective. Environ. Impact Assess. Rev. 2025, 112, 107832. [Google Scholar] [CrossRef]
  4. Kong, F.; Chen, H.; Bao, S. Analysis of the Dynamic Evolution, Regional Differences, and Influencing Factors of Green Total Factor Productivity in Grain: The Case of China. Environ. Impact Assess. Rev. 2026, 116, 108141. [Google Scholar] [CrossRef]
  5. Guo, D.; Li, L.; Pang, G. Does the Integration of Digital and Real Economies Promote Urban Green Total Factor Productivity? Evidence from China. J. Environ. Manag. 2024, 370, 122934. [Google Scholar] [CrossRef]
  6. Li, Z.; Wang, Y. Tourism Industry Development, Rural Digitalization, and Green Total Factor Productivity. Financ. Res. Lett. 2025, 81, 107419. [Google Scholar] [CrossRef]
  7. Chen, L.; Lu, Y.; Meng, Y. The Impact of Environmental Regulation on Green Total Factor Productivity: Evidence from China’s Provincial Level. Process Saf. Environ. Prot. 2025, 198, 107106. [Google Scholar] [CrossRef]
  8. Dai, G.; Lv, X.; Sun, J.; Gao, X. Impact of Marine Industrial Synergistic Agglomeration on Marine Green Total Factor Productivity—Evidence from China’s Coastal Areas. Reg. Stud. Mar. Sci. 2025, 90, 104469. [Google Scholar] [CrossRef]
  9. Li, Y.; Wang, C.; Xia, X.; Huang, Q. Impact of China Europe Railway Express Operation on Green Total Factor Productivity and Spatial Spillover Effect in Chinese Cities. Transp. Policy 2025, 172, 103763. [Google Scholar] [CrossRef]
  10. Sun, Y.; Liu, Z. How Does Climate Risk Impact Green Total Factor Productivity? A Greening and Digital Synergy Perspective. Financ. Res. Lett. 2025, 85, 108205. [Google Scholar] [CrossRef]
  11. Ma, T.; Li, J. Green Credit Policy, Financing Constraints, and Total Factor Productivity of Enterprises. Financ. Res. Lett. 2025, 85, 108060. [Google Scholar] [CrossRef]
  12. Zhang, L.; Bai, J.; Sun, H.; Deng, F.; Qian, Y. Climate Policy Uncertainty, Supply Chain Resilience and Enterprises’ Green Total Factor Productivity: Evidence from China. Int. Rev. Econ. Financ. 2025, 103, 104555. [Google Scholar] [CrossRef]
  13. Ling, D.; Li, X. Can Green Bonds Enhance Enterprises’ Total Factor Productivity? The Impacts of Macroeconomic Policy Adjustment and Ownership Heterogeneity. Financ. Res. Lett. 2025, 82, 107562. [Google Scholar] [CrossRef]
  14. Lei, L.; Feng, H.; Ren, J. Artificial Intelligence, Human Capital and Firm-Level Total Factor Productivity. Financ. Res. Lett. 2025, 85, 107897. [Google Scholar] [CrossRef]
  15. Li, H.; Wu, H.; Rao, J. Impact of Artificial Intelligence on Corporate Green Transformation. Financ. Res. Lett. 2025, 80, 107427. [Google Scholar] [CrossRef]
  16. Li, Z.; Liu, M.; Wang, L. Artificial Intelligence Development and Rural Labor Employment Quality. Int. Rev. Econ. Financ. 2025, 102, 104292. [Google Scholar] [CrossRef]
  17. Wang, J.; Li, J. Data Factors as a Source of Innovation: Evidence from Chinese Cloud Computing Listed Firms. In Proceedings of the 2023 8th International Conference on Cloud Computing and Big Data Analytics (ICCCBDA), Chengdu, China, 26–28 April 2023; pp. 247–251. [Google Scholar]
  18. Lyu, Y.; Wang, W.; Wu, Y.; Zhang, J. How Does Digital Economy Affect Green Total Factor Productivity? Evidence from China. Sci. Total Environ. 2023, 857, 159428. [Google Scholar] [CrossRef] [PubMed]
  19. Qian, J.; Zhou, Y.; Hao, Q. The Effect and Mechanism of Digital Economy on Green Total Factor Productivity—Empirical Evidence from China. J. Environ. Manag. 2024, 372, 123237. [Google Scholar] [CrossRef]
  20. Shi, P.; Zhang, H.; Sun, C.; Wang, X.; Li, X. The Driving Effect of Digital Finance on Green Total Factor Productivity—Analysis Based on Double/Debiased Machine Learning Model and Spatial Durbin Model. Financ. Res. Lett. 2025, 81, 107463. [Google Scholar] [CrossRef]
  21. Li, G.; Liao, F. Input Digitalization and Green Total Factor Productivity under the Constraint of Carbon Emissions. J. Clean. Prod. 2022, 377, 134403. [Google Scholar] [CrossRef]
  22. Yang, K.; Kuang, J. How Artificial Intelligence Applications Enhance Enterprise Green Total Factor Productivity? A Perspective on Human-Machine Matching and Labor Skill Structure. Econ. Anal. Policy 2025, 87, 926–947. [Google Scholar] [CrossRef]
  23. Jiang, Y. Government Digital Governance and Corporate Green Total Factor Productivity. Int. Rev. Econ. Financ. 2025, 102, 104338. [Google Scholar] [CrossRef]
  24. Li, D.; Wang, P. FinTech Development and Corporate Green Total Factor Productivity. Int. Rev. Financ. Anal. 2025, 107, 104567. [Google Scholar] [CrossRef]
  25. Wen, J.; Hai, H.; Zhang, Y.; Chen, Z.; Li, L. Does Digital Transformation Impact Green Total Factor Productivity? Evidence from National Big Data Comprehensive Pilot Zones in China. Econ. Anal. Policy 2025, 86, 2207–2221. [Google Scholar] [CrossRef]
  26. Xue, D.; Zhu, Z. Digital Transformation of Energy Enterprises, ESG Performance, and Green Total Factor Productivity. Financ. Res. Lett. 2025, 86, 108398. [Google Scholar] [CrossRef]
  27. Liu, D.; Li, Y.; You, J.; Balezentis, T.; Shen, Z. Digital Inclusive Finance and Green Total Factor Productivity Growth in Rural Areas. J. Clean. Prod. 2023, 418, 138159. [Google Scholar] [CrossRef]
  28. Sallehudin, H.; Aman, A.H.M.; Razak, R.C.; Ismail, M.; Bakar, N.A.A.; Fadzil, A.F.M.; Baker, R. Performance and Key Factors of Cloud Computing Implementation in the Public Sector. Int. J. Bus. Soc. 2021, 21, 134–152. [Google Scholar] [CrossRef]
  29. Chang, I.-C.; Liu, C.-C.; Wu, T.-L. Does Cloud Computing Influence Enterprise Performance? J. Organ. End User Comput. JOEUC 2021, 33, 1–15. [Google Scholar] [CrossRef]
  30. Yu, H.; Lu, X.; Pan, Z. An Authorized Public Auditing Scheme for Dynamic Big Data Storage in Cloud Computing. IEEE Access 2020, 8, 151465–151473. [Google Scholar] [CrossRef]
  31. Katz, R.; Jung, J. Economic Spillovers from Cloud Computing: Evidence from OECD Countries. Inf. Technol. Dev. 2024, 30, 173–194. [Google Scholar] [CrossRef]
  32. Al-Azzawi, T.; Kaya, T. The Impact of Cloud Computing on Organizational Performance. Int. J. Cloud Appl. Comput. 2021, 11, 136–151. [Google Scholar] [CrossRef]
  33. Floerecke, S.; Lehner, F.; Schweikl, S. Cloud Computing Ecosystem Model: Evaluation and Role Clusters. Electron. Mark. 2021, 31, 923–943. [Google Scholar] [CrossRef]
  34. Son, I.; Lee, D.; Lee, J.-N.; Chang, Y.B. Market Perception on Cloud Computing Initiatives in Organizations: An Extended Resource-Based View. Inf. Manag. 2014, 51, 653–669. [Google Scholar] [CrossRef]
  35. Liu, Y.; Dong, S.; Wei, J.; Tong, Y. Assessing Cloud Computing Value in Firms through Socio-Technical Determinants. Inf. Manag. 2020, 57, 103369. [Google Scholar] [CrossRef]
  36. Chen, Y.; Zhang, R.; Lyu, J.; Ma, X. The Butterfly Effect of Cloud Computing on the Low-Carbon Economy. Technol. Forecast. Soc. Chang. 2024, 204, 123433. [Google Scholar] [CrossRef]
  37. Golightly, L.; Chang, V.; Xu, Q.A.; Gao, X.; Liu, B.S. Adoption of Cloud Computing as Innovation in the Organization. Int. J. Eng. Bus. Manag. 2022, 14, 18479790221093992. [Google Scholar] [CrossRef]
  38. Blichfeldt, H.; Faullant, R. Performance Effects of Digital Technology Adoption and Product & Service Innovation—A Process-Industry Perspective. Technovation 2021, 105, 102275. [Google Scholar] [CrossRef]
  39. Marchesani, F.; Masciarelli, F.; Doan, H.Q. Innovation in Cities a Driving Force for Knowledge Flows: Exploring the Relationship between High-Tech Firms, Student Mobility, and the Role of Youth Entrepreneurship. Cities 2022, 130, 103852. [Google Scholar] [CrossRef]
  40. Wang, J.; Dong, K.; Sha, Y.; Yan, C. Envisaging the Carbon Emissions Efficiency of Digitalization: The Case of the Internet Economy for China. Technol. Forecast. Soc. Change 2022, 184, 121965. [Google Scholar] [CrossRef]
  41. Wang, J.; Wang, B.; Dong, K.; Dong, X. How Does the Digital Economy Improve High-Quality Energy Development? The Case of China. Technol. Forecast. Soc. Change 2022, 184, 121960. [Google Scholar] [CrossRef]
  42. Shahbaz, M.; Wang, J.; Dong, K.; Zhao, J. The Impact of Digital Economy on Energy Transition across the Globe: The Mediating Role of Government Governance. Renew. Sustain. Energy Rev. 2022, 166, 112620. [Google Scholar] [CrossRef]
  43. Liu, Q.; Wang, Q. An Energy Efficient On-Demand Multi-Path Routing Protocol for Wireless Body Area Network. Int. J. Comput. Sci. Eng. 2024, 27, 238–247. [Google Scholar] [CrossRef]
  44. Zhang, T.; Shi, Z.-Z.; Shi, Y.-R.; Chen, N.-J. Enterprise Digital Transformation and Production Efficiency: Mechanism Analysis and Empirical Research. Econ. Res.-Ekon. Istraživanja 2022, 35, 2781–2792. [Google Scholar] [CrossRef]
  45. Zhang, W.; Zhou, H.; Chen, J.; Fan, Z. An Empirical Analysis of the Impact of Digital Economy on Manufacturing Green and Low-Carbon Transformation under the Dual-Carbon Background in China. Int. J. Environ. Res. Public Health 2022, 19, 13192. [Google Scholar] [CrossRef] [PubMed]
  46. Chen, C.; Ye, F.; Xiao, H.; Xie, W.; Liu, B.; Wang, L. The Digital Economy, Spatial Spillovers and Forestry Green Total Factor Productivity. J. Clean. Prod. 2023, 405, 136890. [Google Scholar] [CrossRef]
  47. Wang, M.; Yu, X.; Hong, X.; Yang, X. Can Digital Finance Promote Green Innovation Collaboration in Enterprises? Glob. Financ. J. 2025, 65, 101109. [Google Scholar] [CrossRef]
  48. Tian, L.; Li, Z.; Shi, B. Cloud Adoption and Corporate Innovation: Insights from Data as a Factor of Production. J. World Econ. 2025, 48, 178–210. [Google Scholar] [CrossRef]
  49. Nuo, X.; Ju, M.; Mao, X.; Wang, Y. Computility Deployment, Cross-Domain Data Flow and Enterprise Total Factor Productivity: Evidence from Intelligent Computing Centers. China Ind. Econ. 2025, 04, 61–79. [Google Scholar] [CrossRef]
  50. Zhang, Y.; Miao, Z.; Sun, Y. Impact of Green and Low-Carbon Technological Innovation on Green Total Factor Productivity of Industrial Sector: An Analysis Based on BAM-DEA Model. Sustain. Futures 2025, 10, 101036. [Google Scholar] [CrossRef]
  51. Babina, T.; Fedyk, A.; He, A.; Hodson, J. Artificial Intelligence, Firm Growth, and Product Innovation. J. Financ. Econ. 2024, 151, 103745. [Google Scholar] [CrossRef]
  52. Jia, F.; Zeng, S.; Gao, X. Can the Digital Economy Empower the Transportation Sector to Improve Green Total Factor Productivity? Int. J. Sustain. Transp. 2024, 18, 871–886. [Google Scholar] [CrossRef]
  53. Jiang, Y.; Han, G.; Yu, D. Digital Finance and Agricultural Green Total Factor Productivity: The Mediating Role of Digital Village Development. Financ. Res. Lett. 2024, 67, 105948. [Google Scholar] [CrossRef]
  54. Shan, H. Reestimating the Capital Stoack of China: 1952–2006. J. Quant. Tech. Econ. 2008, 10, 17–31. [Google Scholar]
  55. Wu, H.; Hao, Y.; Ren, S. How Do Environmental Regulation and Environmental Decentralization Affect Green Total Factor Energy Efficiency: Evidence from China. Energy Econ. 2020, 91, 104880. [Google Scholar] [CrossRef]
  56. Yi, L.; Zhang, W.; Liu, Y.; Zhang, W. An Analysis of the Impact of Market Segmentation on Energy Efficiency: A Spatial Econometric Model Applied in China. Sustainability 2021, 13, 7659. [Google Scholar] [CrossRef]
  57. Fullerton, T.M., Jr.; Walke, A.G. Empirical Evidence Regarding Electricity Consumption and Urban Economic Growth. Appl. Econ. 2019, 51, 1977–1988. [Google Scholar] [CrossRef]
  58. Alhamwi, A.; Medjroubi, W.; Vogt, T.; Agert, C. Modelling Urban Energy Requirements Using Open Source Data and Models. Appl. Energy 2018, 231, 1100–1108. [Google Scholar] [CrossRef]
  59. Polyviou, A.; Venters, W.; Pouloudi, N. Distant but Close: Locational, Relational and Temporal Proximity in Cloud Computing Adoption. J. Inf. Technol. 2024, 39, 71–93. [Google Scholar] [CrossRef]
  60. Jia, R.; Shao, S.; Yang, L. High-Speed Rail and CO2 Emissions in Urban China: A Spatial Difference-in-Differences Approach. Energy Econ. 2021, 99, 105271. [Google Scholar] [CrossRef]
  61. Hsieh, C.-T.; Klenow, P.J. Misallocation and Manufacturing TFP in China and India. Q. J. Econ. 2009, 124, 1403–1448. [Google Scholar] [CrossRef]
  62. Hongjun, G.; Liye, D.; Aiwu, Z. Energy Structure Dividend, Factor Allocation Efficiency and Regional Productivity Growth-- An Empirical Examination of Energy Restructuring in China. Energy Policy 2023, 172, 113307. [Google Scholar] [CrossRef]
  63. Feng, W.; Sun, S.; Yuan, H. Research on the Efficiency of Factor Allocation in the Pilot Free Trade Zones. Econ. Anal. Policy 2023, 79, 727–745. [Google Scholar] [CrossRef]
  64. Li, X.; Ma, L.; Tang, Y. Migration and Resource Misallocation in China. J. Dev. Econ. 2024, 167, 103218. [Google Scholar] [CrossRef]
  65. Callaway, B.; Sant’Anna, P.H.C. Difference-in-Differences with Multiple Time Periods. J. Econom. 2021, 225, 200–230. [Google Scholar] [CrossRef]
  66. Su, Z.; Liu, Y.; Gao, Y.; Park, K.-S.; Su, M. Critical Success Factors for Green Port Transformation Using Digital Technology. J. Mar. Sci. Eng. 2024, 12, 2128. [Google Scholar] [CrossRef]
  67. Wang, H.; Yan, T.; Huang, R.; Gao, J. Alleviating the Rural Household Energy Poverty in China: The Role of Digital Economy. Energy Econ. 2025, 142, 108160. [Google Scholar] [CrossRef]
  68. Yang, G.; Wang, H.; Fan, H.; Yue, Z. Carbon Reduction Effect of Digital Economy: Theoretical Analysis and Empirical Evidence. China Ind. Econ. 2023, 05, 80–98. [Google Scholar] [CrossRef]
  69. Chand, T.R.K.; Badarinath, K.V.S.; Elvidge, C.D.; Tuttle, B.T. Spatial Characterization of Electrical Power Consumption Patterns over India Using Temporal DMSP-OLS Night-time Satellite Data. Int. J. Remote Sens. 2009, 30, 647–661. [Google Scholar] [CrossRef]
  70. Liu, H.; Fang, W.; Yuan, P.; Dong, X. How Does Climate Change Affect Green Total Factor Productivity? Clim. Change 2025, 178, 112. [Google Scholar] [CrossRef]
  71. Xia, F.; Xu, J. Green Total Factor Productivity: A Re-Examination of Quality of Growth for Provinces in China. China Econ. Rev. 2020, 62, 101454. [Google Scholar] [CrossRef]
  72. Han, L.; Wojan, T.R.; Goetz, S.J. Cloud Computing and Rural Globalization: Evidence for the U.S. Nonfarm Economy. Telecommun. Policy 2024, 48, 102814. [Google Scholar] [CrossRef]
  73. Fan, J. Yangtze River Delta Integration, Regional Specialization, and the Spatial Relocation of Manufacturing. J. Manag. World 2004, 11, 77–84+96. [Google Scholar] [CrossRef]
  74. XiaoFeng, C.; ZhaoFeng, C. Level and Effect on Co -agglomeration of Producer Service and Manufacturing Industry: Empirical Evidence from the Eastern Area of China. Financ. Trade Res. 2014, 25, 49–57. [Google Scholar] [CrossRef]
  75. Xuesong, M.; Dingliang, W. The Internal Mechanism and Realization Path for the Modernization of Spatial Governance in Megacities from the Perspective of Deepening Coordinated Regional Development. Soc. Sci. Yunnan 2025, 05, 23–33. [Google Scholar]
  76. Xiaolin, W. The City of Traffic in the Digital Age: The Rise and Governance of the New City Form. Jiangsu Soc. Sci. 2022, 4, 62–72+242–243. [Google Scholar] [CrossRef]
  77. Xie, C.; Wang, M. A Study on the Impact of Transportation Infrastructure on the Spatial Distribution of Industrial Activities. J. Manag. World 2020, 36, 52–64+161+65–66. [Google Scholar] [CrossRef]
  78. Jiang, X.; Meng, L. Mainly Inner Circulation, Outer Circulation Empowerment and Higher Level Double Circulation: International Experience and Chinese Practice. J. Manag. World 2021, 37, 1–19. [Google Scholar] [CrossRef]
  79. Yu, C.; Yu, D. The Measurement of Local Administrative Monopoly Degree in China. Econ. Res. J. 2009, 44, 119–131. [Google Scholar]
  80. Lu, X.; Wang, S. Measurement of the Degree of Marketization of Factors, Decomposition of Regional Differences and Dynamic Evolution: Empirical Research Based on China’s Provincial Panel Data. South China J. Econ. 2021, 01, 37–63. [Google Scholar] [CrossRef]
  81. Wang, Y.; Jiang, Y. Competition Policy and Corporate Investment: Quasi-natural Experiments Based on the Implementation of the Anti-monopoly Law. Econ. Res. J. 2020, 55, 137–152. [Google Scholar]
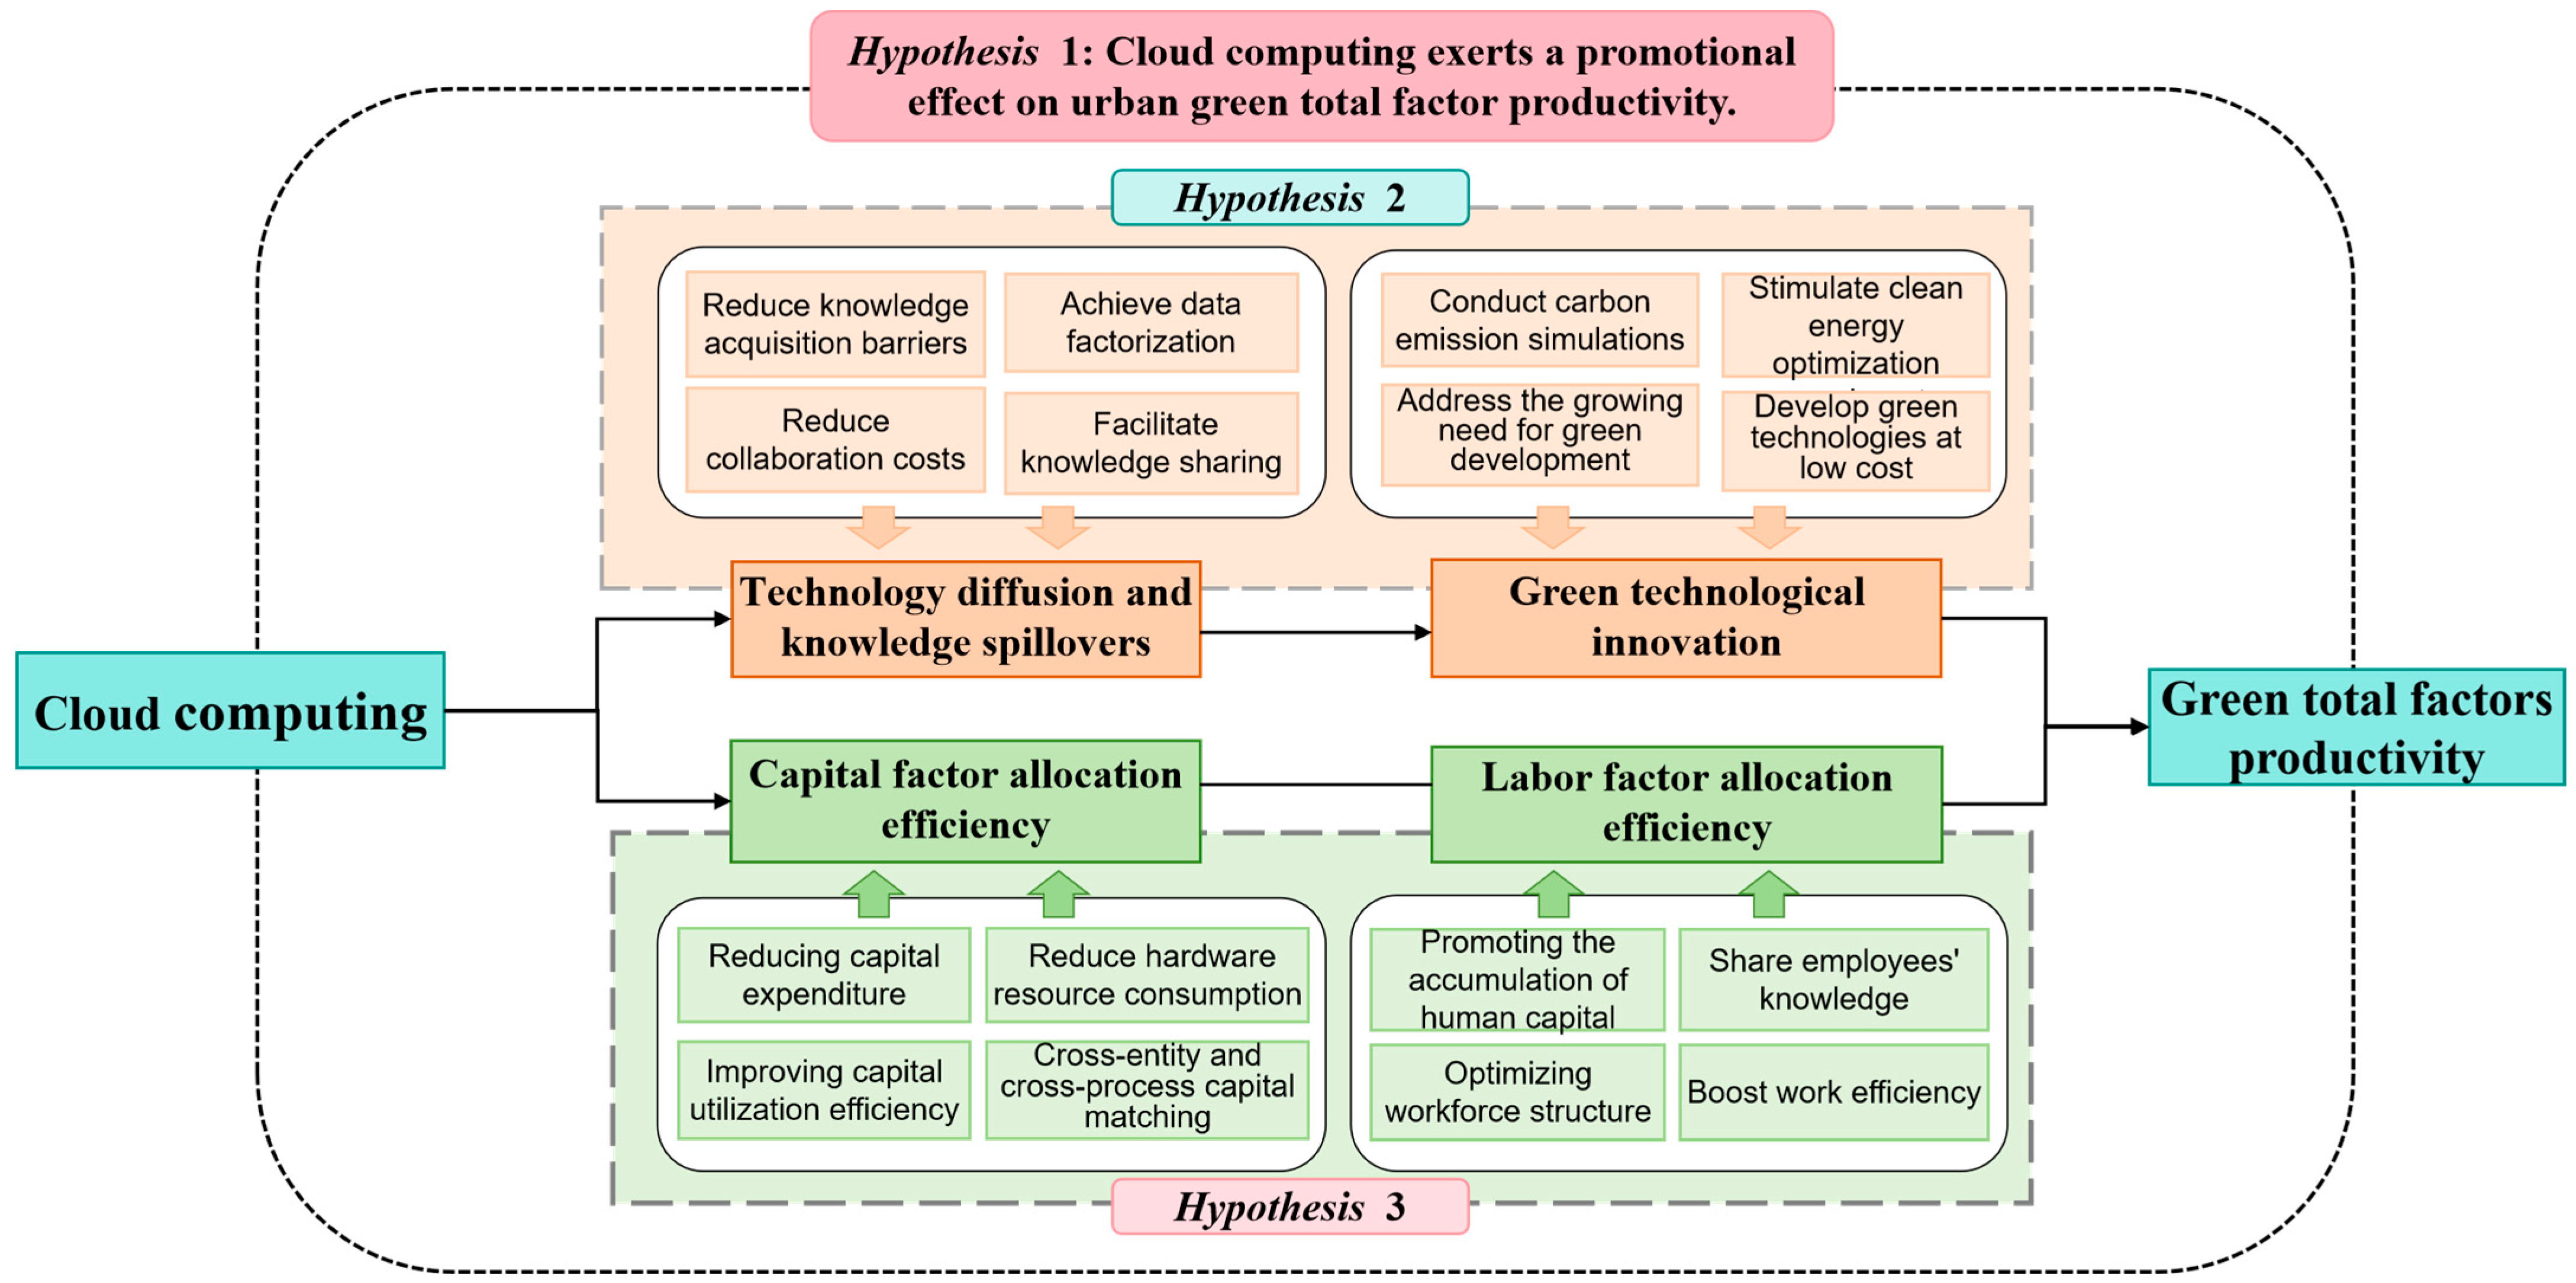
Figure 1. Framework diagram of research hypotheses.
Sustainability 17 09828 g001
Figure 2. Research framework diagram.
Sustainability 17 09828 g002
Figure 3. The spatial and temporal distribution of GTFP.
Sustainability 17 09828 g003
Figure 4. The hot-spot analysis of GTFP.
Sustainability 17 09828 g004
Figure 5. Parallel trends test. The vertical dashed line indicates the selection of the first pre-policy period as the baseline for the event-study method.
Sustainability 17 09828 g005
Figure 6. The Placebo test. (a) presents the placebo test of the coefficient for T r e a t i × P o s t t ; (b) presents the placebo test of the coefficient for W T r e a t i × P o s t t . The vertical red line represents the estimated true value.
Sustainability 17 09828 g006
Figure 7. The result of heterogeneous DID. The vertical dashed line indicates the selection of the first pre-policy period as the baseline for the event-study method.
Sustainability 17 09828 g007
Figure 8. Control for the effects of sample timing selection. (A) adjust the sample starting year; (B) adjust pre-treatment periods. The vertical dashed line indicates the selection of the first pre-policy period as the baseline for the event study.
Sustainability 17 09828 g008
Table 1. Descriptive statistics.
VariableObs.MeanSDMinMax
Panel A The data of basic result
G T F P i t 67120.890.060.571.06
T r e a t i × P o s t t 69470.240.430.001.00
gove68980.170.110.010.68
urban694738.4724.3410.01100.00
R2693945.2411.5713.5574.73
LK67121.320.090.891.79
lnedu69412.980.740.005.44
lnpop69395.830.742.857.19
consump694114.861.7811.6818.03
Dsponge69470.040.190.001.00
Dbigdata69470.090.290.001.00
Panel B The data of mechanism analysis
s p i l l o v e r c t 54432.203.740.0016.80
Green_Inno166523.151.970.0010.08
Green_Inno266523.531.890.009.30
Labor_Miss61460.560.270.030.91
Capital_Miss67120.930.080.680.99
Miss_All61460.760.180.290.96
Table 2. The Moran index of GTFP.
TimeMoran’s Ip-ValueTimeMoran’s Ip-Value
20000.267 ***0.00020120.107 ***0.005
20010.265 ***0.00020130.101 ***0.008
20020.256 ***0.00020140.111 ***0.004
20030.230 ***0.00020150.154 ***0.000
20040.217 ***0.00020160.153 ***0.000
20050.090 **0.01820170.225 ***0.000
20060.110 ***0.00420180.214 ***0.000
20070.115 ***0.00320190.199 ***0.000
20080.086 **0.02320200.149 ***0.000
20090.0600.10720210.105 ***0.006
20100.106 ***0.00620220.100 ***0.005
20110.105 ***0.00620230.143 ***0.001
Note: *, **, *** denote statistical significance at 10%, 5%, and 1%, respectively.
Table 3. The impact of cloud computing on urban GTFP.
(1)(2)(3)(4)(5)(6)
W01W01W01W01 W t G D P W t P O P
GTFPGTFPGTFPGTFPGTFPGTFP
T r e a t i × P o s t t 0.00564 ***0.00375 ***0.00283 ***0.00357 ***0.00368 ***0.00374 ***
(0.0016)(0.0011)(0.0011)(0.0011)(0.0011)(0.0011)
gove−0.0483 ***−0.113 *** −0.113 ***−0.109 ***−0.104 ***
(0.0070)(0.0076) (0.0073)(0.0073)(0.0072)
R2−0.000654 ***−0.000443 *** −0.000386 ***−0.000372 ***−0.000422 ***
(0.000054)(0.000067) (0.000063)(0.000063)(0.000063)
urban−0.000237 ***−0.0000469 0.00000509−0.00000433−0.0000283
(0.000027)(0.000043) (0.000042)(0.000043)(0.000043)
LK0.277 ***0.121 *** 0.146 ***0.155 ***0.144 ***
(0.010)(0.010) (0.010)(0.010)(0.010)
lnedu−0.0190 ***−0.00999 *** −0.0122 ***−0.0135 ***−0.0127 ***
(0.0016)(0.0016) (0.0015)(0.0015)(0.0015)
lnpop0.0252 ***0.0373 *** 0.0370 ***0.0362 ***0.0333 ***
(0.0018)(0.0040) (0.0038)(0.0038)(0.0038)
consump0.00918 ***−0.00329 *** −0.00287 ***−0.00223 **−0.00308 ***
(0.00095)(0.00100) (0.0010)(0.0010)(0.00100)
Dsponge0.0109 ***0.0101 *** 0.0130 ***0.0134 ***0.0132 ***
(0.0025)(0.0019) (0.0018)(0.0018)(0.0019)
Dbigdata−0.0211 ***−0.00793 *** −0.00715 ***−0.00631 ***−0.00379 *
(0.0031)(0.0023) (0.0022)(0.0020)(0.0020)
W T r e a t i × P o s t t −0.0228 ***−0.0154 ***−0.0108 ***−0.00692 ***−0.00479 **−0.00736 ***
(0.0027)(0.0021)(0.0025)(0.0025)(0.0019)(0.0018)
W gove0.116 ***0.123 *** 0.0600 ***0.0298 ***0.0197 *
(0.011)(0.012) (0.014)(0.011)(0.011)
W R20.000625 ***0.000589 *** 0.000294 ***0.0001040.000190 **
(0.000094)(0.00011) (0.00011)(0.000091)(0.000091)
W urban−0.000296 ***−0.000580 *** −0.000120−0.0000953−0.000126 *
(0.000051)(0.000067) (0.000092)(0.000076)(0.000074)
W LK−0.435 ***−0.0740 *** 0.0723 ***0.0344 **0.0600 ***
(0.012)(0.016) (0.020)(0.016)(0.015)
W lnedu0.0356 ***0.0110 *** 0.0009160.00534 **0.00368 *
(0.0029)(0.0029) (0.0029)(0.0024)(0.0022)
W lnpop−0.0616 ***−0.0578 *** −0.0528 ***−0.0450 ***−0.0366 ***
(0.0034)(0.0079) (0.0074)(0.0066)(0.0061)
W consump0.0112 ***0.00560 *** 0.00489 **0.002290.00483 ***
(0.0016)(0.0016) (0.0020)(0.0018)(0.0016)
W Dsponge−0.0107 *−0.0175 *** −0.000875−0.0000359−0.00649 **
(0.0057)(0.0043) (0.0042)(0.0031)(0.0031)
W Dbigdata0.0285 ***0.0152 *** 0.0129 ***0.00929 ***0.00600 **
(0.0043)(0.0034) (0.0032)(0.0028)(0.0027)
ρ 0.720 ***0.841 ***0.293 ***0.272 ***0.222 ***0.185 ***
(0.0090)(0.0073)(0.018)(0.018)(0.015)(0.015)
Time FENoNoYesYesYesYes
City FENoYesYesYesYesYes
Adj.R20.620.790.0510.140.130.13
N670467046712670467046704
Note: *, **, *** denote statistical significance at 10%, 5%, and 1%, respectively. The values in parentheses are the cluster standard errors.
Table 4. Robustness text: considering the impact of administrative levels.
(1)(2)(3)(4)(5)(6)
W01W01 W t G D P W t G D P W t P O P W t P O P
Excluding Samples of MunicipalitiesExcluding Samples of Provincial Capital CitiesExcluding Samples of MunicipalitiesExcluding Samples of Provincial Capital CitiesExcluding Samples of MunicipalitiesExcluding Samples of Provincial Capital Cities
T r e a t i × P o s t t 0.00316 ***0.00265 **0.00320 ***0.00260 **0.00323 ***0.00257 **
(0.0011)(0.0011)(0.0011)(0.0011)(0.0011)(0.0011)
W T r e a t i × P o s t t −0.00637 ***−0.0103 ***−0.00480 **−0.00745 ***−0.00713 ***−0.00914 ***
(0.0025)(0.0025)(0.0019)(0.0019)(0.0018)(0.0018)
(0.0020)(0.0021)(0.0018)(0.0018)(0.0016)(0.0016)
ρ 0.271 ***0.248 ***0.220 ***0.204 ***0.181 ***0.181 ***
(0.018)(0.019)(0.015)(0.016)(0.015)(0.015)
XYesYesYesYesYesYes
WXYesYesYesYesYesYes
Time FEYesYesYesYesYesYes
City FEYesYesYesYesYesYes
Adj.R20.150.160.140.150.130.15
N660961896609618966096189
Note: *, **, *** denote statistical significance at 10%, 5%, and 1%, respectively. The values in parentheses are the cluster standard errors. X is the control variable, and WX is the spatial term of the control variable.
Table 5. Robustness test: changing the explained variable.
(1)(2)(3)(4)(5)(6)
W01W01 W t G D P W t G D P W t P O P W t P O P
GTFP-SBMGTFP-SBMGTFP-SBMGTFP-SBMGTFP-SBMGTFP-SBM
T r e a t i × P o s t t 0.00357 ***0.00353 ***0.00314 **0.00364 ***0.00373 ***0.00371 ***
(0.0013)(0.0011)(0.0013)(0.0011)(0.0013)(0.0011)
W T r e a t i × P o s t t −0.0108 ***−0.00693 ***−0.00286−0.00468 **−0.00814 ***−0.00710 ***
(0.0029)(0.0024)(0.0022)(0.0018)(0.0021)(0.0018)
ρ0.260 ***0.281 ***0.210 ***0.230 ***0.168 ***0.189 ***
(0.020)(0.018)(0.016)(0.015)(0.015)(0.015)
XNoYesNoYesNoYes
WXNoYesNoYesNoYes
Time FEYesYesYesYesYesYes
City FEYesYesYesYesYesYes
Adj.R20.0360.150.0340.140.0280.13
N693867046938670469386704
Note: *, **, *** denote statistical significance at 10%, 5%, and 1%, respectively. The value in parentheses are the cluster standard errors. X is the control variables, and WX is the spatial term of the control variables.
Table 6. Robustness test: dropping the anticipated effects of cloud computing.
(1)(2)(3)(4)(5)(6)
W01W01 W t G D P W t G D P W t P O P W t P O P
GTFPGTFPGTFPGTFPGTFPGTFP
T r e a t i × P o s t t 0.00359 ***0.00309 **0.00365 ***0.00315 **0.00365 ***0.00308 **
(0.0012)(0.0013)(0.0012)(0.0013)(0.0012)(0.0013)
W T r e a t i × P o s t t −0.00905 ***−0.0103 ***−0.00658 ***−0.00740 ***−0.00909 ***−0.0105 ***
(0.0025)(0.0026)(0.0020)(0.0020)(0.0019)(0.0020)
ρ0.256 ***0.234 ***0.218 ***0.209 ***0.173 ***0.159 ***
(0.019)(0.019)(0.016)(0.016)(0.015)(0.015)
XYesYesYesYesYesYes
WXYesYesYesYesYesYes
Time FEYesYesYesYesYesYes
City FEYesYesYesYesYesYes
Adj.R20.140.140.130.130.130.13
N645662066456620664566206
Note: *, **, *** denote statistical significance at 10%, 5%, and 1%, respectively. The values in parentheses are the cluster standard errors. In Columns (1), (3), and (5), this study removes observations from the first period before policy implementation; and in Columns (2), (4) and (6), it removes observations from both the first and second periods before policy implementation. X is the control variable, and WX is the spatial term of the control variable.
Table 7. Robustness test: control for the effects of economic development and digital infrastructure.
(1)(2)(3)(4)(5)(6)(7)(8)(9)
W01 W t G D P W t P O P W01 W t G D P W t P O P W01 W t G D P W t P O P
GTFPGTFPGTFPGTFPGTFPGTFPGTFPGTFPGTFP
T r e a t i × P o s t t 0.00342 ***0.00342 ***0.00346 ***0.00303 ***0.00251 **0.00320 ***0.00289 **0.00280 **0.00297 ***
(0.0011)(0.0011)(0.0011)(0.0011)(0.0010)(0.0011)(0.0011)(0.0011)(0.0011)
lngdp−0.0692 ***−0.0693 ***−0.0678 *** −0.0629 ***−0.0629 ***−0.0624 ***
(0.0081)(0.0083)(0.0082) (0.0083)(0.0085)(0.0084)
lnper_gdp0.0745 ***0.0758 ***0.0718 *** 0.0689 ***0.0697 ***0.0670 ***
(0.0082)(0.0084)(0.0082) (0.0085)(0.0087)(0.0085)
Dinformation 0.00490 ***0.00526 ***0.00468 ***0.00301 *0.00268 *0.00252
(0.0016)(0.0016)(0.0016)(0.0016)(0.0016)(0.0016)
Dboard 0.00576 ***0.00674 ***0.00587 ***0.00530 ***0.00542 ***0.00525 ***
(0.0012)(0.0011)(0.0012)(0.0012)(0.0012)(0.0012)
W T r e a t i × P o s t t −0.00783 ***−0.00587 ***−0.00863 ***−0.00721 ***−0.00422 **−0.00736 ***−0.00794 ***−0.00662 ***−0.00854 ***
(0.0025)(0.0019)(0.0019)(0.0025)(0.0017)(0.0019)(0.0025)(0.0019)(0.0018)
W lngdp0.01270.00158−0.00269 0.02860.01960.00856
(0.022)(0.029)(0.025) (0.023)(0.029)(0.025)
W lnper_gdp−0.003130.008470.0187 −0.0205−0.009670.00643
(0.022)(0.029)(0.025) (0.023)(0.029)(0.025)
W Dinformation 0.00845 **0.002640.004650.006310.002980.00300
(0.0042)(0.0030)(0.0033)(0.0041)(0.0031)(0.0032)
W Dboard 0.002950.00411 **0.001870.001690.00363 *0.000602
(0.0027)(0.0021)(0.0021)(0.0027)(0.0022)(0.0020)
ρ0.263 ***0.211 ***0.172 ***0.267 ***0.201 ***0.182 ***0.261 ***0.208 ***0.171 ***
(0.019)(0.016)(0.015)(0.018)(0.016)(0.015)(0.018)(0.016)(0.015)
XYesYesYesYesYesYesYesYesYes
WXYesYesYesYesYesYesYesYesYes
Time FEYesYesYesYesYesYesYesYesYes
City FEYesYesYesYesYesYesYesYesYes
Adj.R20.160.150.140.150.320.140.160.150.15
N670467046704670467046704670467046704
Note: *, **, *** denote statistical significance at 10%, 5%, and 1%, respectively. The value in parentheses are the cluster standard errors. X is the control variables, and WX is the spatial term of the control variables.
Table 8. Robustness test: measuring GTFP using other energy inputs.
(1)(2)(3)(4)(5)(6)
W01 W t G D P W t P O P W01 W t G D P W t P O P
GTFPGTFPGTFPGTFPGTFPGTFP
T r e a t i × P o s t t 0.00356 ***0.00272 **0.00336 ***0.00296 ***0.00189 **0.00271 ***
(0.0012)(0.0012)(0.0012)(0.00091)(0.00096)(0.00094)
W T r e a t i × P o s t t −0.00618 **−0.00410 **−0.00527 ***−0.00497 **−0.00393 **−0.00339 **
(0.0026)(0.0020)(0.0020)(0.0021)(0.0016)(0.0015)
ρ0.445 ***0.363 ***0.332 ***0.377 ***0.300 ***0.251 ***
(0.017)(0.014)(0.014)(0.018)(0.015)(0.014)
XYesYesYesYesYesYes
WXYesYesYesYesYesYes
Time FEYesYesYesYesYesYes
City FEYesYesYesYesYesYes
Adj.R20.190.160.150.170.0950.15
N642664266426670467086704
Note: *, **, *** denote statistical significance at 10%, 5%, and 1%, respectively. The value in parentheses are the cluster standard errors. X is the control variables, and WX is the spatial term of the control variables.
Table 9. Mechanism analysis: The impact of cloud computing on green innovation.
(1)(2)(3)(4)(5)(6)(7)(8)(9)
W01 W t G D P W t P O P W01 W t G D P W t P O P W01 W t G D P W t P O P
Knowledge SpilloverKnowledge SpilloverKnowledge SpilloverGreen_Inno1Green_Inno1Green_Inno1Green_Inno2Green_Inno2Green_Inno2
T r e a t i × P o s t t 0.616 ***0.579 ***0.599 ***0.0826 ***0.0809 ***0.0927 ***0.0625 ***0.0727 ***0.0794 ***
(0.12)(0.12)(0.12)(0.026)(0.026)(0.026)(0.021)(0.022)(0.022)
ρ0.134 ***0.167 ***0.114 ***0.360 ***0.292 ***0.243 ***0.415 ***0.287 ***0.265 ***
(0.019)(0.017)(0.016)(0.015)(0.013)(0.013)(0.015)(0.013)(0.013)
Control variablesYesYesYesYesYesYesYesYesYes
Time FEYesYesYesYesYesYesYesYesYes
City FEYesYesYesYesYesYesYesYesYes
Adj.R20.0650.0770.0660.180.180.160.180.150.14
N530453045304650865086508650865086508
Note: *, **, *** denote statistical significance at 10%, 5%, and 1%, respectively. The value in parentheses are the cluster standard errors.
Table 10. Mechanism analysis: the impact of cloud computing on resource allocation efficiency.
(1)(2)(3)(4)(5)(6)(7)(8)(9)
W01 W t G D P W t P O P W01 W t G D P W t P O P W01 W t G D P W t P O P
Labor_MissLabor_MissLabor_MissCapital_MissCapital_MissCapital_MissMiss_AllMiss_AllMiss_All
T r e a t i × P o s t t −0.00948 **−0.00922 **−0.00990 ***−0.00100 **−0.000928 *−0.000931 *−0.00817 ***−0.00782 ***−0.00832 ***
(0.0037)(0.0037)(0.0038)(0.00051)(0.00051)(0.00051)(0.0029)(0.0028)(0.0029)
ρ0.388 ***0.332 ***0.285 ***0.238 ***0.161 ***0.217 ***0.330 ***0.298 ***0.250 ***
(0.020)(0.017)(0.016)(0.021)(0.018)(0.017)(0.021)(0.017)(0.017)
Control variablesYesYesYesYesYesYesYesYesYes
Time FEYesYesYesYesYesYesYesYesYes
City FEYesYesYesYesYesYesYesYesYes
Adj.R20.140.140.130.110.0960.120.0840.0960.081
N451345134513507750775077451345134513
Note: *, **, *** denote statistical significance at 10%, 5%, and 1%, respectively. The value in parentheses are the cluster standard errors.
Table 11. The heterogeneity analysis: economic scale.
(1)(2)(3)(4)(5)(6)
W01W01 W t G D P W t G D P W t P O P W t P O P
Large-Scale CitiesSmall-Scale CitiesLarge-Scale CitiesSmall-Scale CitiesLarge-Scale CitiesSmall-Scale Cities
T r e a t i × P o s t t 0.00299 **0.00357 **0.00278 *0.00411 **0.00307 **0.00341 **
(0.0014)(0.0017)(0.0014)(0.0017)(0.0014)(0.0017)
W T r e a t i × P o s t t −0.00530 **−0.0111 ***−0.00224−0.0106 ***−0.00706 ***−0.00791 ***
(0.0024)(0.0027)(0.0021)(0.0024)(0.0020)(0.0024)
ρ0.145 ***0.143 ***0.170 ***0.123 ***0.147 ***0.130 ***
(0.020)(0.023)(0.019)(0.020)(0.019)(0.019)
XYesYesYesYesYesYes
WXYesYesYesYesYesYes
Time FEYesYesYesYesYesYes
City FEYesYesYesYesYesYes
Adj.R20.170.0820.180.0840.170.081
N338732983387329833873298
Note: *, **, *** denote statistical significance at 10%, 5%, and 1%, respectively. The value in parentheses are the cluster standard errors. X is the control variables, and WX is the spatial term of the control variables.
Table 12. The heterogeneity analysis: coastal status.
(1)(2)(3)(4)(5)(6)
W01W01 W t G D P W t G D P W t P O P W t P O P
Coastal RegionsNo-Coastal RegionsCoastal RegionsNo-Coastal RegionsCoastal RegionsNo-Coastal Regions
T r e a t i × P o s t t 0.00619 **0.00355 ***0.00643 ***0.00364 ***0.00716 ***0.00333 ***
(0.0025)(0.0012)(0.0025)(0.0012)(0.0024)(0.0012)
W T r e a t i × P o s t t 0.0137 ***−0.00959 ***0.0149 ***−0.00701 ***0.0123 ***−0.00790 ***
(0.0047)(0.0026)(0.0038)(0.0020)(0.0035)(0.0020)
ρ0.194 ***0.240 ***0.183 ***0.194 ***0.214 ***0.155 ***
(0.037)(0.020)(0.032)(0.017)(0.030)(0.016)
XYesYesYesYesYesYes
WXYesYesYesYesYesYes
Time FEYesYesYesYesYesYes
City FEYesYesYesYesYesYes
Adj.R20.330.0900.320.0860.350.077
N987567498756749875674
Note: *, **, *** denote statistical significance at 10%, 5%, and 1%, respectively. The value in parentheses are the cluster standard errors. X is the control variables, and WX is the spatial term of the control variables.
Table 13. The heterogeneity analysis: urban agglomeration.
(1)(2)(3)(4)(5)(6)
W01W01 W t G D P W t G D P W t P O P W t P O P
Urban AgglomerationNo-Urban AgglomerationUrban AgglomerationNo-Urban AgglomerationUrban AgglomerationNo-Urban Agglomeration
T r e a t i × P o s t t 0.00578 ***0.001600.00574 ***0.001700.00598 ***0.00153
(0.0016)(0.0015)(0.0016)(0.0015)(0.0016)(0.0015)
W T r e a t i × P o s t t −0.00781 **0.00325−0.003740.000710−0.00819 ***0.000714
(0.0035)(0.0026)(0.0028)(0.0021)(0.0027)(0.0022)
ρ0.271 ***0.203 ***0.223 ***0.186 ***0.201 ***0.162 ***
(0.024)(0.020)(0.021)(0.018)(0.021)(0.018)
XYesYesYesYesYesYes
WXYesYesYesYesYesYes
Time FEYesYesYesYesYesYes
City FEYesYesYesYesYesYes
Adj.R20.170.130.160.130.170.11
N334333523343335233433352
Note: *, **, *** denote statistical significance at 10%, 5%, and 1%, respectively. The value in parentheses are the cluster standard errors. X is the control variables, and WX is the spatial term of the control variables.
Table 14. The effect of industry agglomeration.
(1)(2)(3)
W01 W t G D P W t P O P
GTFPGTFPGTFP
T r e a t i × P o s t t × A g g 0.00868 **0.00709 **0.00527
(0.0036)(0.0036)(0.0036)
T r e a t i × P o s t t −0.00460−0.00286−0.00100
(0.0037)(0.0037)(0.0037)
A g g 0.0229 ***0.0126 **0.0257 ***
(0.0065)(0.0063)(0.0063)
W T r e a t i × P o s t t × A g g 0.0302 ***0.0197 ***0.0231 ***
(0.0079)(0.0063)(0.0056)
W T r e a t i × P o s t t −0.0361 ***−0.0236 ***−0.0301 ***
(0.0081)(0.0064)(0.0059)
W A g g −0.0270 **−0.0156 *−0.0308 ***
(0.011)(0.0089)(0.0083)
ρ0.269 ***0.215 ***0.182 ***
(0.019)(0.016)(0.015)
XYesYesYes
WXYesYesYes
Time FEYesYesYes
City FEYesYesYes
Adj.R20.130.120.12
N670467046704
Note: *, **, *** denote statistical significance at 10%, 5%, and 1%, respectively. The value in parentheses are the cluster standard errors. X is the control variables, and WX is the spatial term of the control variables.
Table 15. The impact of regional integration policies on mitigating the siphon effect of cloud computing.
(1)(2)(3)
W01 W t G D P W t P O P
GTFPGTFPGTFP
T r e a t i × P o s t t × Inter 0.002180.001160.00158
(0.0023)(0.0023)(0.0023)
T r e a t i × P o s t t 0.00335 ***0.00383 ***0.00391 ***
(0.0012)(0.0012)(0.0012)
Inter 0.000337−0.00305−0.00248
(0.0025)(0.0024)(0.0024)
W T r e a t i × P o s t t × Inter 0.00811 **0.0104 ***0.00926 ***
(0.0036)(0.0031)(0.0029)
W T r e a t i × P o s t t −0.00878 ***−0.00728 ***−0.00958 ***
(0.0027)(0.0021)(0.0020)
W Inter −0.0005000.001320.00206
(0.0032)(0.0028)(0.0028)
ρ0.267 ***0.220 ***0.184 ***
(0.018)(0.015)(0.015)
XYesYesYes
WXYesYesYes
Time FEYesYesYes
City FEYesYesYes
Adj.R20.150.140.13
N670467046704
Note: *, **, *** denote statistical significance at 10%, 5%, and 1%, respectively. The value in parentheses are the cluster standard errors. X is the control variables, and WX is the spatial term of the control variables.
Table 16. The impact of administrative monopoly on mitigating the siphon effect of cloud computing.
(1)(2)(3)
W01 W t G D P W t P O P
GTFPGTFPGTFP
T r e a t i × P o s t t × Dmonopoly0.00615 **0.00623 **0.000537
(0.0028)(0.0028)(0.0042)
T r e a t i × P o s t t 0.00276 **0.00288 **0.00667 ***
(0.0012)(0.0012)(0.0016)
Dmonopoly0.003330.001420.00158
(0.0035)(0.0033)(0.0048)
W T r e a t i × P o s t t × Dmonopoly0.0134 **0.00972 **0.0242 ***
(0.0057)(0.0045)(0.0067)
W T r e a t i × P o s t t −0.00958 ***−0.00666 ***−0.0136 ***
(0.0027)(0.0021)(0.0027)
W Dmonopoly−0.004320.0005100.000951
(0.0051)(0.0044)(0.0061)
ρ0.269 ***0.221 ***0.183 ***
(0.018)(0.015)(0.015)
XYesYesYes
WXYesYesYes
Time FEYesYesYes
City FEYesYesYes
Adj.R20.150.130.21
N670467046704
Note: *, **, *** denote statistical significance at 10%, 5%, and 1%, respectively. The value in parentheses are the cluster standard errors. X is the control variables, and WX is the spatial term of the control variables.
Table 17. The impact of international trade liberalization on mitigating the siphon effect of cloud computing.
(1)(2)(3)
W01 W t G D P W t P O P
GTFPGTFPGTFP
T r e a t i × P o s t t × DEtrade0.001650.002570.00110
(0.0034)(0.0035)(0.0051)
T r e a t i × P o s t t 0.00315 ***0.00317 ***0.00640 ***
(0.0011)(0.0011)(0.0015)
DEtrade0.00914 ***0.00853 **0.0103 **
(0.0033)(0.0034)(0.0049)
W T r e a t i × P o s t t × DEtrade0.01530.01130.0206 *
(0.010)(0.0086)(0.012)
W T r e a t i × P o s t t −0.0103 ***−0.00601 ***−0.0107 ***
(0.0025)(0.0019)(0.0025)
W DEtrade−0.0150−0.00941−0.0195 *
(0.0098)(0.0084)(0.012)
ρ0.272 ***0.214 ***0.183 ***
(0.018)(0.015)(0.014)
XYesYesYes
WXYesYesYes
Time FEYesYesYes
City FEYesYesYes
Adj.R20.150.140.21
N670467046704
Note: *, **, *** denote statistical significance at 10%, 5%, and 1%, respectively. The value in parentheses are the cluster standard errors. X is the control variables, and WX is the spatial term of the control variables.
Disclaimer/Publisher’s Note: The statements, opinions and data contained in all publications are solely those of the individual author(s) and contributor(s) and not of MDPI and/or the editor(s). MDPI and/or the editor(s) disclaim responsibility for any injury to people or property resulting from any ideas, methods, instructions or products referred to in the content.