1. Introduction
As extreme global weather events become more frequent and urbanization accelerates, water-related environmental issues—exemplified by urban flooding caused by heavy rainfall—pose significant challenges to sustainable urban development [
1,
2]. One key cause of urban flooding is the expansion of impervious surface areas, which disrupt natural hydrological cycles, degrade aquatic ecosystems, and increase both the frequency and intensity of floods as urban development intensifies [
3,
4,
5].
“Sponge City” is a water management concept proposed to alleviate urban flooding by enabling cities to function like sponges—absorbing excess stormwater, mitigating flood risks, and enhancing resilience [
6,
7]. Originally introduced in China, Sponge City has been promoted as a key urban governance policy. According to the 2014 Technical Guide for Sponge City Construction—Low-Impact Development of Rainwater Systems [
8] compiled by the Ministry of Housing and Urban-Rural Development of the People’s Republic of China, LID measures are explicitly identified as the primary method for realizing Sponge City, with stormwater runoff control serving as the main objective.
Urban designers and architects must enhance their understanding and modeling capabilities for stormwater runoff in order to address escalating risks. LID has proven to be an effective strategy for mitigating urban stormwater runoff [
9,
10,
11,
12]. However, current Sponge City designs centered on the LID concept primarily focus on micro-scale issues—such as the placement of LID facilities and the optimization of engineering measures—and are often overseen by hydrological engineers, leading to the risk of disciplinary silos. In practical engineering projects led by urban designers and architects, a holistic perspective on stormwater runoff control is essential. LID strategies must be integrated with other design elements and are, to some extent, part of the design itself [
13]. If the selection of LID measures is entirely disconnected from the early design process, it can lead to impractical solutions or repeated design iterations. Moreover, retrofitting LID measures at later project stages often results in significant cost overruns and delays, highlighting the urgent need for early integration. Early-stage planning must therefore provide suitable locations and scales for LID interventions while systematically determining the necessary LID strategies to better integrate with the urban form as well as architectural and landscape elements.
To address the issues discussed in this paper, it is necessary to develop a toolkit that assists urban designers and architects in controlling stormwater runoff. Currently, there are three primary types of models for stormwater and flood simulation: Physically Based Models [
14], Statistical and Empirical Models [
15], and Hybrid Models [
16]. These findings and methodological frameworks are well integrated into commercial software such as SWMM (Storm Water Management Model), HEC-RAS (Hydrologic Engineering Center’s River Analysis System), and MIKE FLOOD [
17,
18,
19]. However, these software packages are not particularly user-friendly for architects and urban designers for several reasons: they do not support direct import of complex computational models; the data are not delivered to designers in a timely manner; two-dimensional numerical results cannot be readily translated into three-dimensional spatial considerations; and the subject matter involves highly specialized knowledge of stormwater and flood simulation.
Parametric design methods employ algorithms to generate multiple design schemes based on a set of defined parameters, objectives, and constraints [
20]. Such a computerized, generative workflow can also streamline the design process, thereby saving time and resources [
21]. Specifically, integrating parametric design methods into the urban design process enables designers to make quick and easy adjustments at each stage [
22,
23]. Grasshopper, commonly used by architectural designers, is a parametric design tool that features an open-source development model and enhanced interactive design features. This makes it more accessible to designers with planning or architectural backgrounds. Several research teams have employed Grasshopper for rainwater risk management and assessment. For instance, Chen et al. (2016) developed the Rainwater+ toolkit, which assists designers in considering the impact of stormwater runoff on spatial environments in the early design stages [
13]. Similarly, Morschek et al. (2019) introduced the SRTF tool, which helps designers optimize site layouts based on flood resilience assessments [
24]. Moreover, Wang et al. (2023) developed a runoff simulation on the Grasshopper platform and applied it in an urban design project [
25]. These three studies, distinct from the broader hydrological or planning-oriented works mentioned earlier, explicitly combine architectural design with rainfall–runoff models using parametric approaches, and together they have provided strong inspiration for the development of this research.
Beyond these Grasshopper-based applications, recent studies have advanced computational approaches for sponge city and sustainability assessment. Liang et al. (2020) proposed an integrated framework for resilient sponge city design [
26]. Javan et al. (2025) coupled SWMM with MOEA/D to optimize LID layouts considering runoff, peak flow, and cost [
27]. Extending to broader domains, Javan and Darestani (2024) applied SWAT with HWA to assess climate impacts on agriculture, and Javan et al. (2023) integrated system dynamics with HWA to evaluate the Water–Energy–Food nexus [
28,
29]. These works highlight the value of optimization and cross-sector frameworks, which inform the integrated workflow developed in this study. Unlike these tools, Sponge City+ integrates compliance checking, cost-performance optimization, and LID spatial layout into a single workflow for architects and urban designers.
This paper presents the Sponge City+ toolkit developed on the Grasshopper platform, outlining its workflow and key functions, followed by validation through three case studies.
To establish a parametric design workflow suited to Sponge City design;
To develop a Sponge City toolkit capable of compliance checks and spatial design optimization;
To validate, through practical case studies, the effectiveness of both the workflow and toolkit developed by our research team.
Here, we provide a comparative table to highlight the differences between mainstream hydrological simulation software and the Sponge City+ toolkit described in this study. As shown in
Table 1, tools such as SWMM and MIKE are powerful, capable of simulating runoff volume, flow rates, and water quality. However, their complexity and high data requirements limit their direct application in the early stages of architectural and landscape design. HydroCAD and the National Stormwater Calculator, on the other hand, have partially restricted functions. By contrast, the Sponge City+ toolkit is not intended to replace detailed hydrological models. Instead, it offers functions such as runoff volume estimation, LID design support, 3D interaction, and runoff visualization. Built on the RHINO and Grasshopper for Rhino platform, it provides convenient support for architects and landscape designers during conceptual and preliminary design phases, highlighting its applicability and advantages in sponge city design scenarios where SUDS or drainage network data are not yet available.
2. Overview of the Toolkit and Workflow
The “Sponge City+” toolkit introduced in this paper is an interactive resource intended for use in the early stages of urban design. Developed on Rhino and Grasshopper for Rhino, the workflow and toolkit are designed to serve architects, landscape designers, and the hydrological engineers who collaborate with them. As an open-source parametric design platform, Grasshopper for Rhino integrates multiple analytical parameters while enabling real-time visual interaction during the design process. In contrast to other software lacking modeling capabilities, designers do not need to rely on separate tools, thereby facilitating a fully integrated workflow.
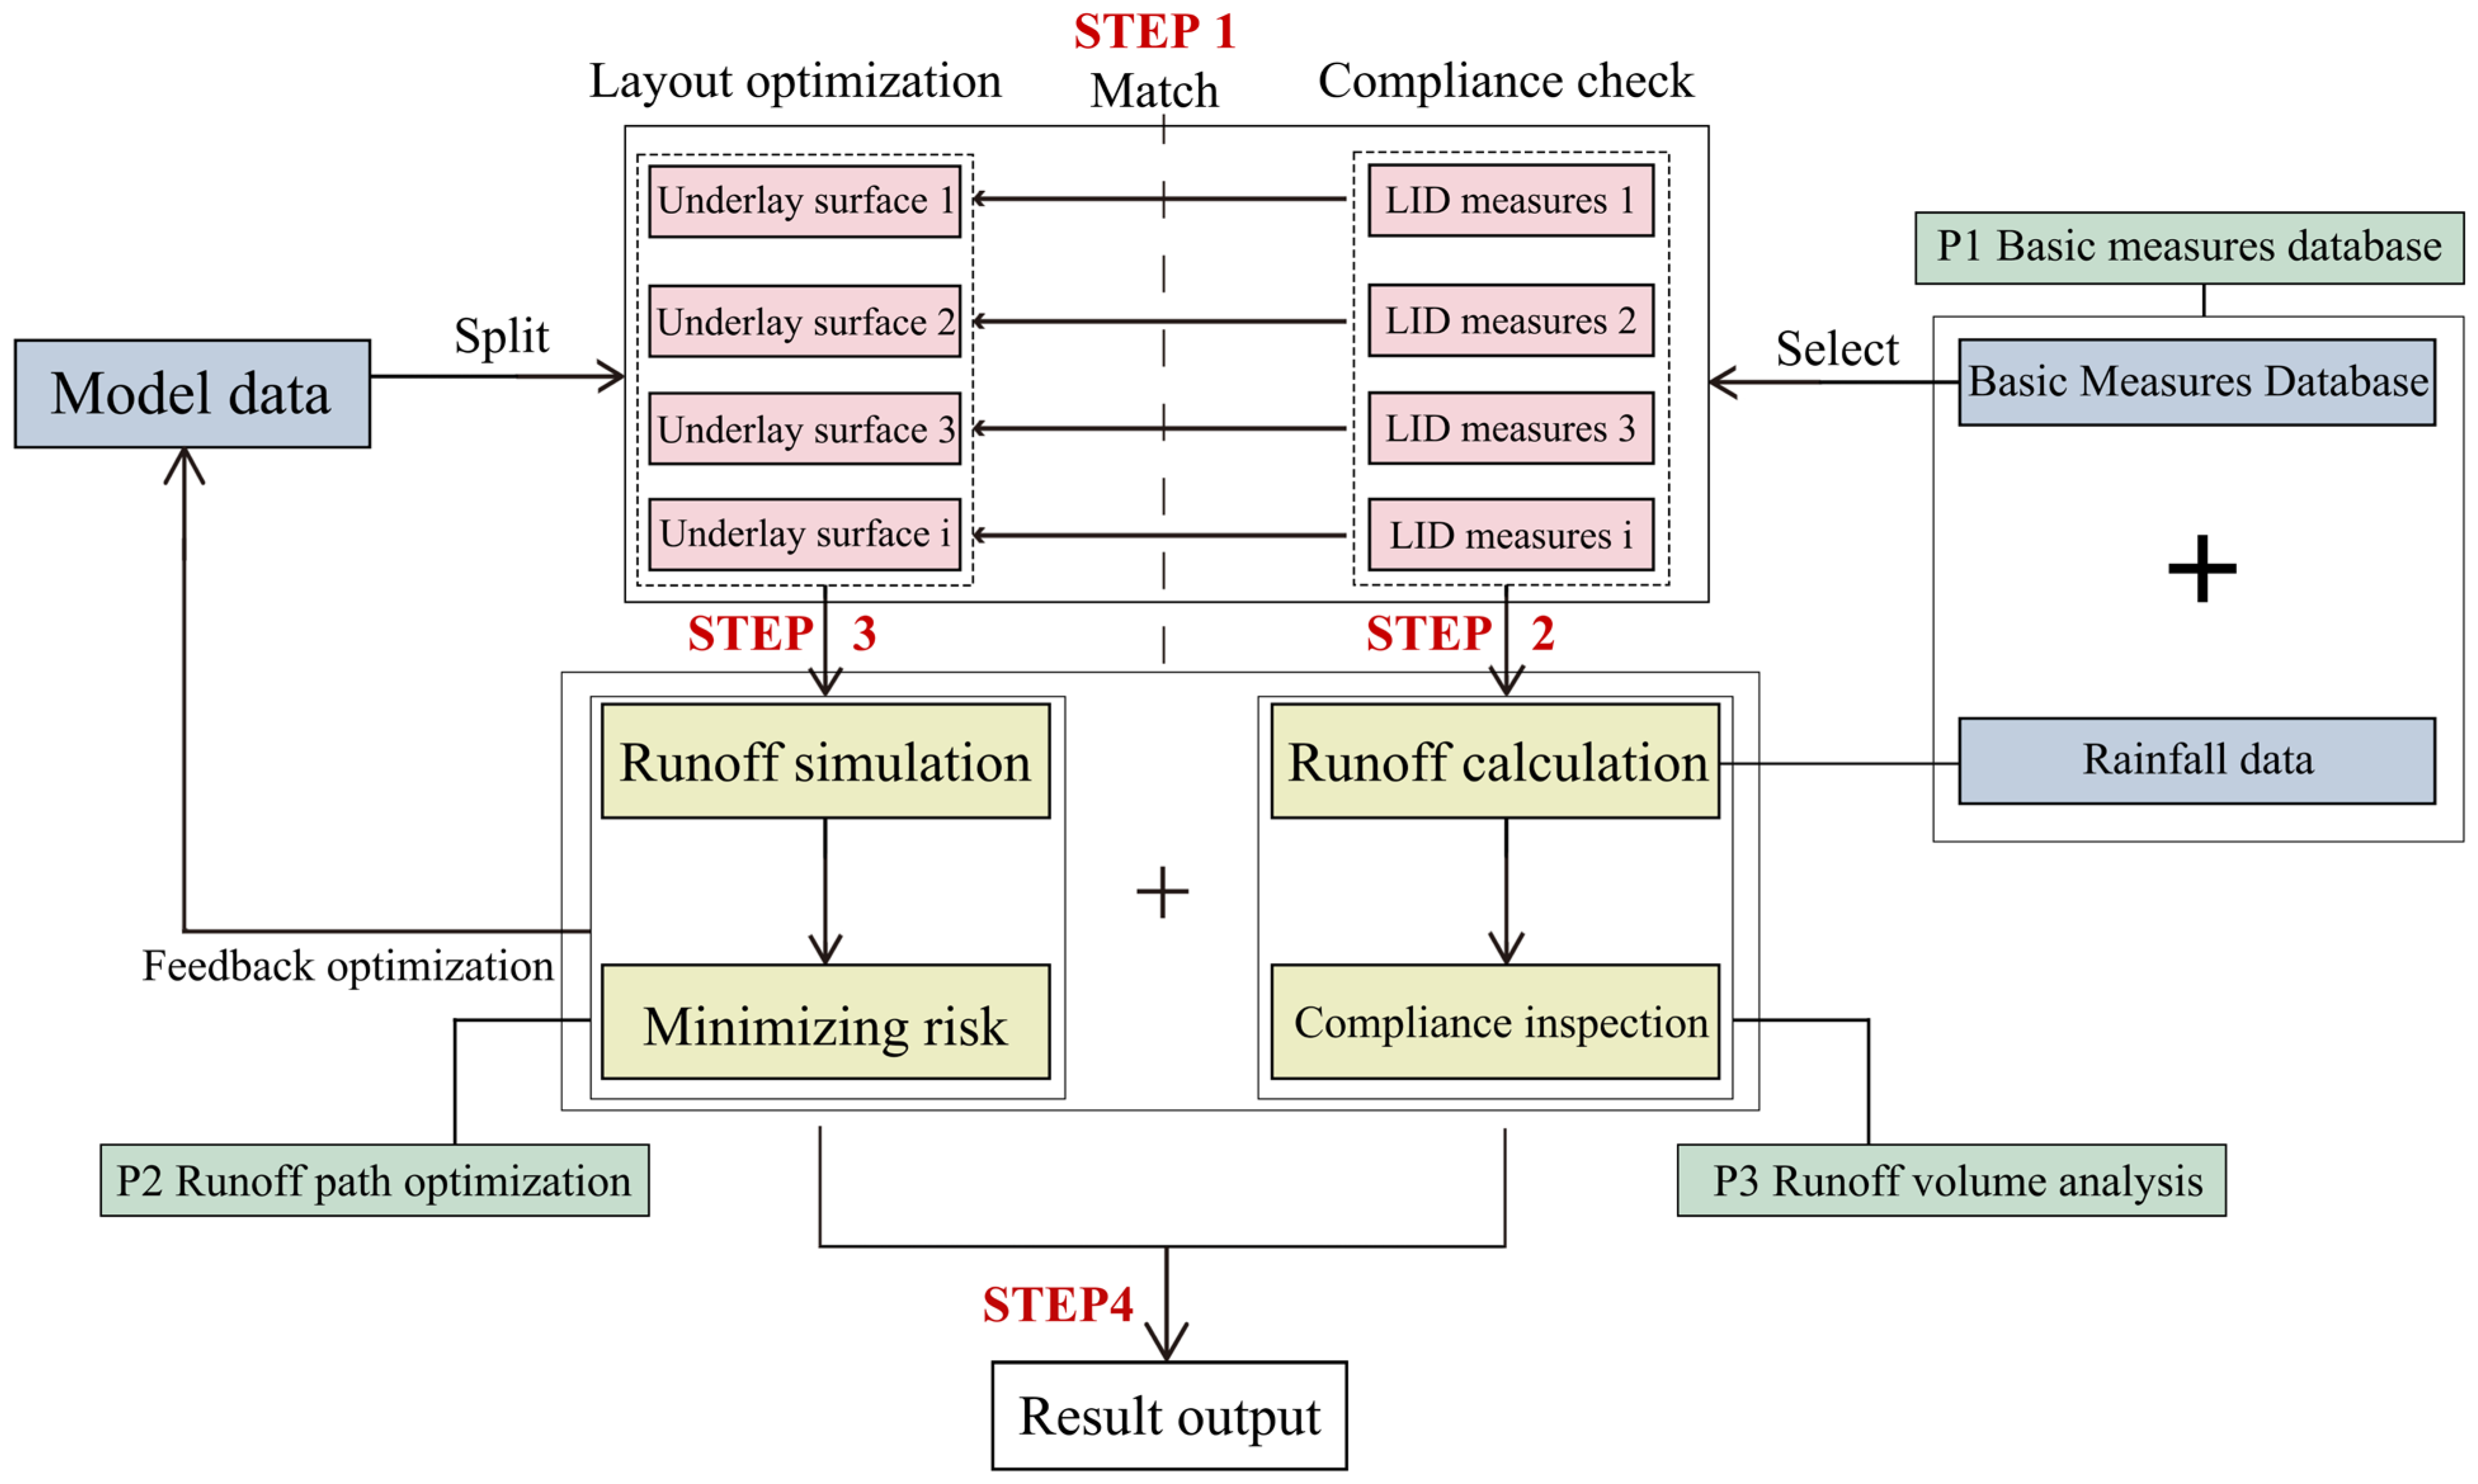
The main components of the “Sponge City+” system are divided into three parts: a basic measures database, runoff volume analysis, and runoff path optimization. The workflow is illustrated in
Figure 1, and it proceeds through four steps.
Step 1—Data preparation and matching (LID measures database).
Model data are first split into underlay surfaces that can host LID facilities. These are then matched with options from the Basic Measures Database, combined with rainfall data. This step establishes the feasible design space with clear attributes of cost, applicability, and hydrological function.
Step 2—Runoff volume analysis (compliance check).
The Volume Method is applied to calculate the annual runoff capture ratio for each candidate scheme. Results are compared against local control targets, providing compliance inspection and quantitative indicators such as capture ratio and facility coverage.
Step 3—Runoff path optimization (risk minimization).
A particle-based simulation (Kangaroo) is used to trace runoff paths and identify areas of accumulation. The visualization results are fed back to the layout stage, allowing designers to adjust the allocation of LID measures in response to high-risk zones. This step ensures that schemes are iteratively improved before final optimization.
Step 4—Result output and analysis.
The final step integrates all compliance and simulation outputs into a multi-objective optimization (NSGA-II) that balances cost, compliance, and risk reduction. The results are synthesized into Pareto fronts, risk maps, and cost evaluations, enabling designers to interpret trade-offs and select appropriate schemes for practical application.
To ensure accuracy, the AVCR results generated by the toolkit were cross-validated in two ways. First, internal consistency was checked by comparing the calculated values with the compliance targets specified in the Technical Guide for Sponge City Construction. Second, the method was applied to three different university campuses of varying scale and density. The cross-case validation confirmed that the results are consistent across contexts and sensitive to variations in LID coverage, thereby supporting the robustness of the calculations.
2.1. Core Modules
“Sponge City+” can be applied to compliance checks, decision-making recommendations, evaluations, and cost estimates using the Sponge City “volume-based approach.” Its four core functions are: a rainfall conditions and measures database, a runoff volume analysis tool, a runoff path analysis tool, and a terrain analysis tool.
2.1.1. Rainfall Conditions and Measures Database
The “rainfall conditions database” in “Sponge City+” is primarily derived from the Technical Guide for Sponge City Construction—Low-Impact Development of Rainwater Systems, which outlines volume capture ratio of annual rainfall for various cities across mainland China. The guide compiles and analyzes daily rainfall data (1983–2012) for nearly 200 cities, categorizing mainland China into five distinct regions. Accordingly, the rainfall conditions database aligns with each city’s specific stormwater runoff control requirements.
The measures database includes the volumetric runoff coefficient (defined as the ratio of total runoff over a given period to the total rainfall) for commonly used LID measures, along with the associated cost for each measure. Unlike rainfall parameters, the cost data in the measures database are not fixed values derived from a single guideline. Instead, the toolkit provides an open interface that allows engineers to update and calibrate unit costs in real time based on current market prices and project-specific quotations. This feature ensures that the tool remains reproducible while maintaining practical applicability in different contexts. Establishing this database streamlines data retrieval for runoff volume analysis.
2.1.2. Runoff Volume Calculation Tool
Runoff calculations in this study are conducted using the Volume Method, which is the standard approach recommended in the Technical Guide for Sponge City Construction [
8]. The method evaluates sponge city compliance by calculating the annual runoff volume capture ratio (AVCR), defined as the proportion of annual rainfall that can be retained and utilized on-site. In practice, the design rainfall depth (H) corresponding to the target AVCR is determined, the volumetric runoff coefficient (φ) is estimated based on surface types, and the design storage volume is calculated using the formula V = 10HφF. The actual storage volume of the LID facilities (V′) is then compared with the design requirement to check compliance.
Using the “Volume Method” of sponge city design, “Sponge City+” enables the visualization of runoff capacity for various underlying surfaces in early-stage urban design proposals. In Sponge City+, LID measures are parameterized primarily through volumetric runoff coefficients for efficiency, consistent with the Technical Guide, while also allowing adjustments for storage depth and permeable surface ratios. This visualization helps designers better understand the relative importance of different LID measures in stormwater management and suggests avenues for optimization. Additionally, “Sponge City+” offers an interactive visual solution, facilitating the seamless integration of LID strategies with other urban, architectural, and landscape design elements from the early stages of planning (
Figure 2).
2.1.3. Runoff Path Analysis Tool
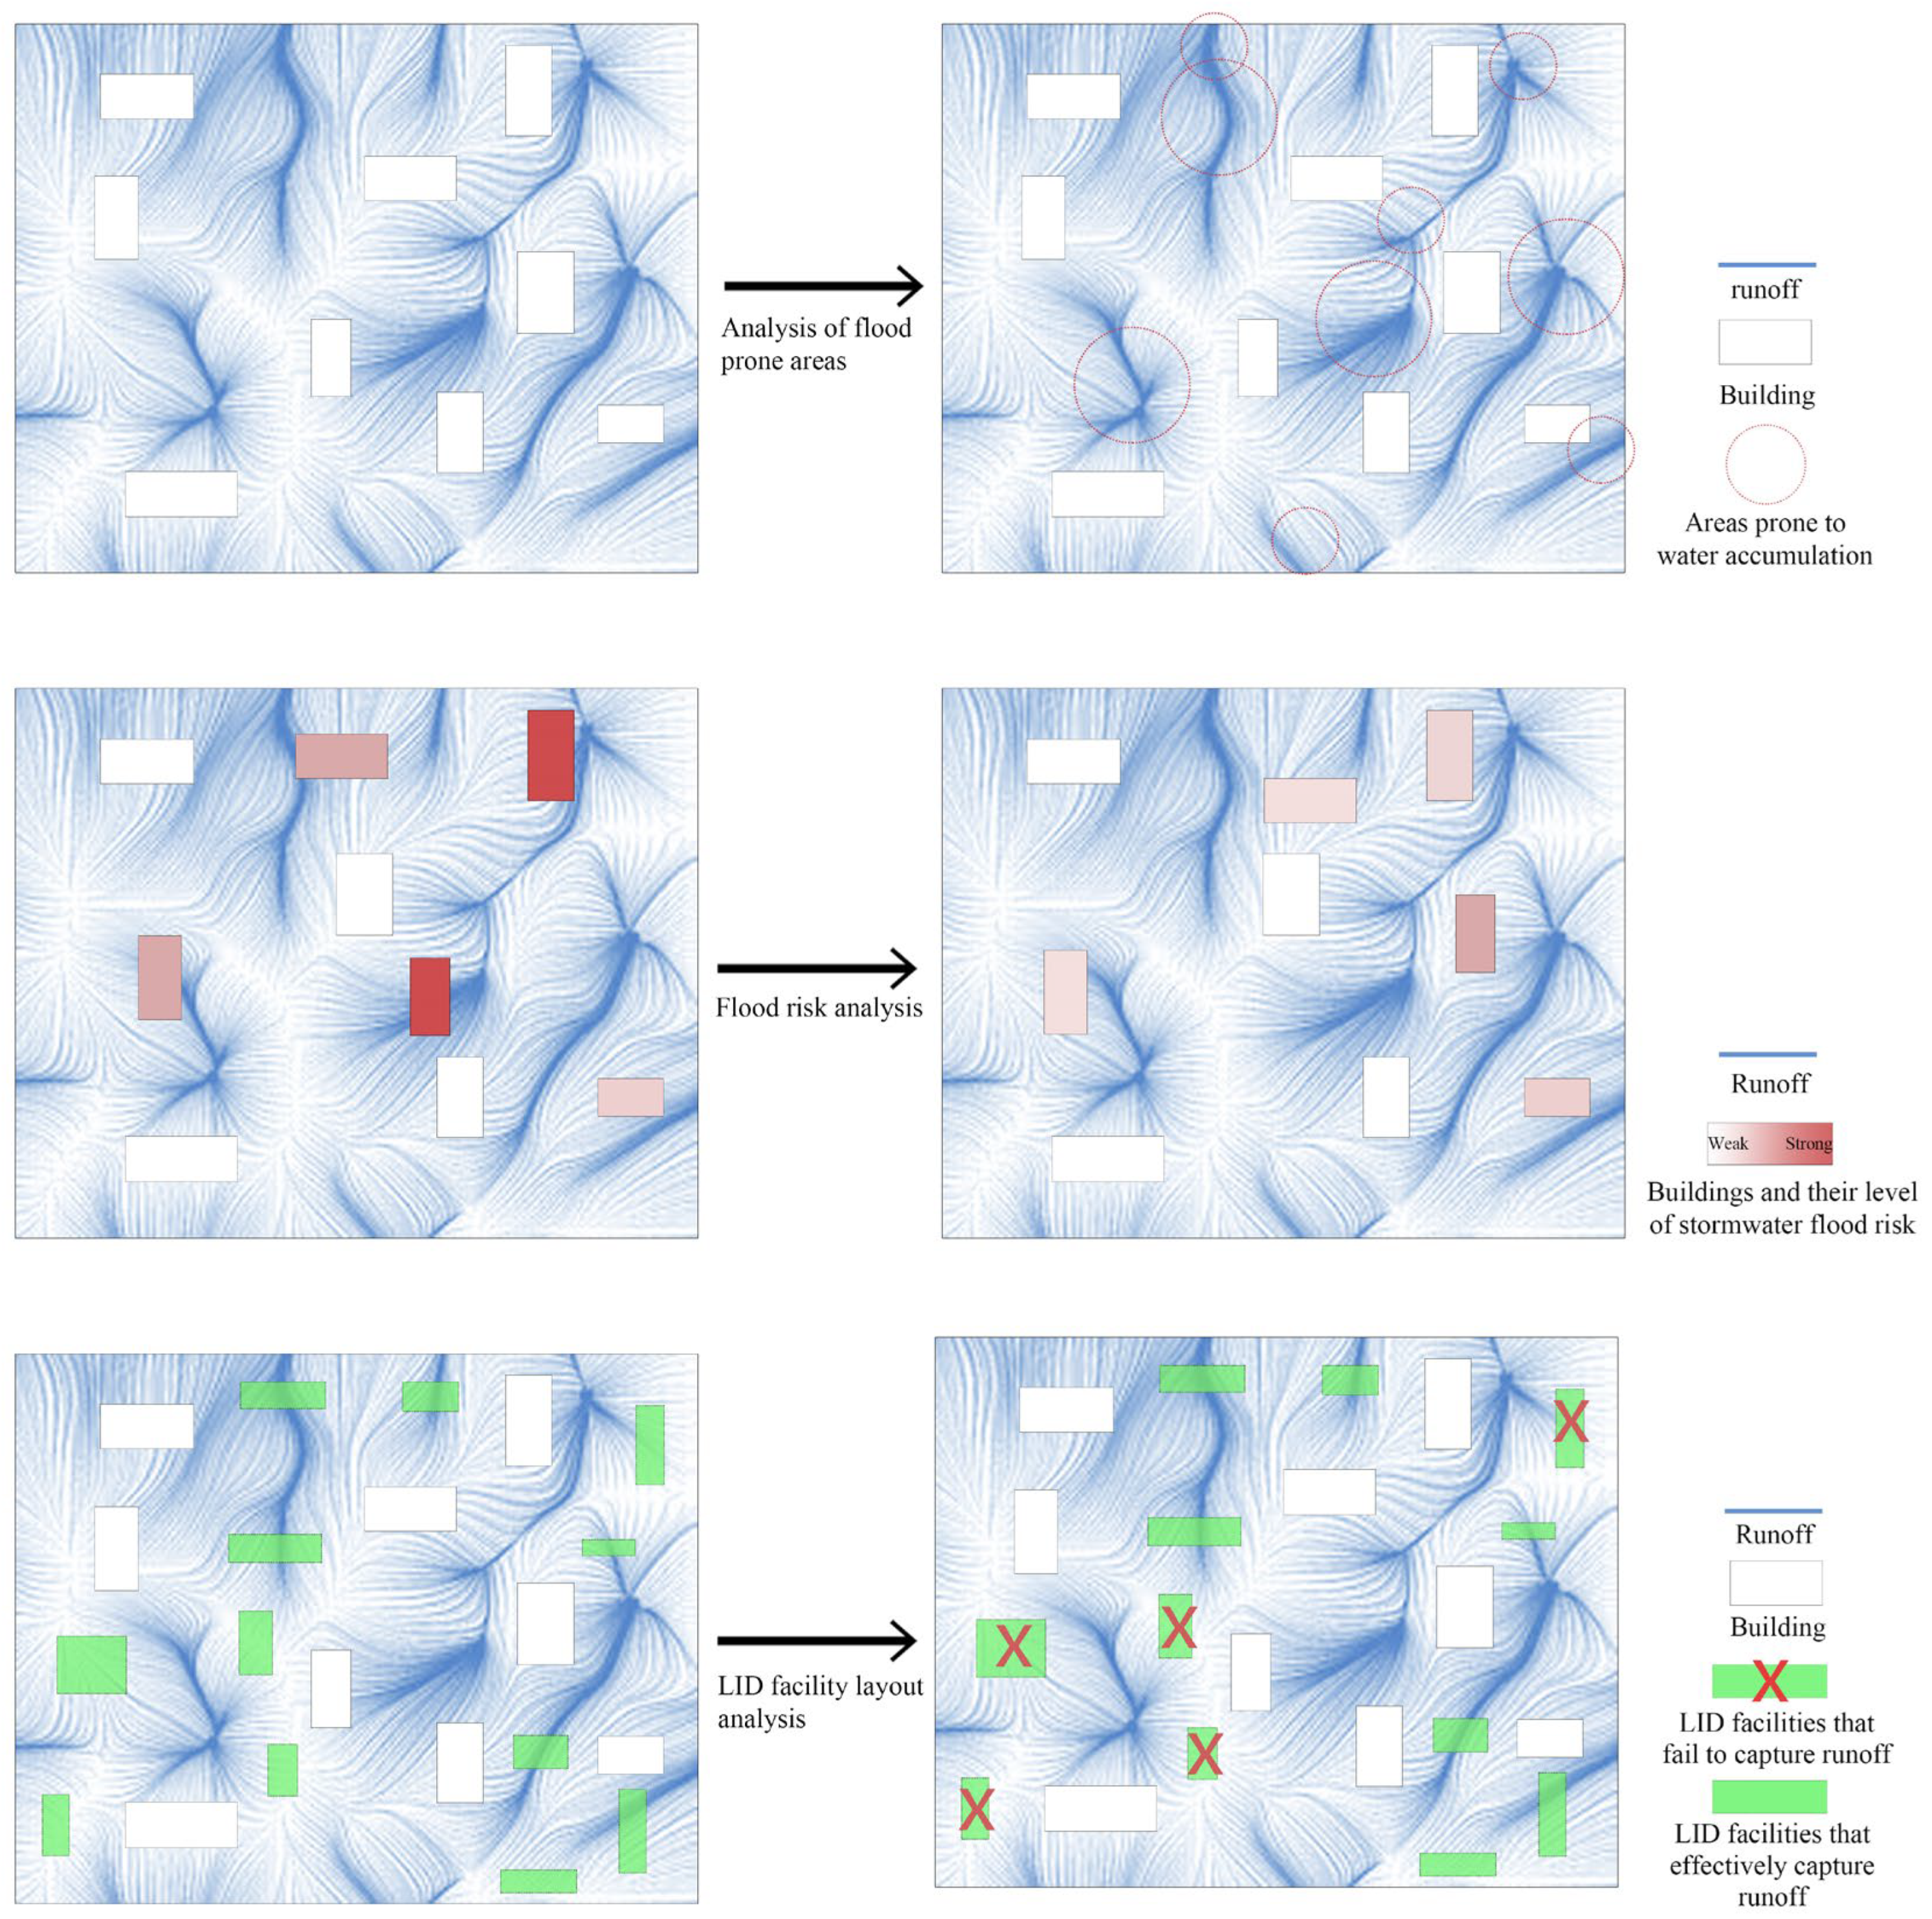
Relying solely on performance data for compliance checks may cause decision-making to overemphasize numerical indicators, potentially neglecting whether LID measures effectively “capture” rainfall. To address this, “Sponge City+” provides a runoff path analysis tool that interprets terrain data to optimize the layout of LID measures. This tool uses Kangaroo for Grasshopper as its physics engine, simulating the full process of raindrops contacting the ground, forming surface runoff, and converging at various time steps, then recording raindrop positions and trajectories to visualize runoff across different rainfall scenarios. Based on the locations where rainwater converges and its relationship to buildings and LID facilities, multiple stormwater scenarios can be analyzed (
Figure 3), including:
Identifying areas prone to water accumulation through rainfall convergence trends and density;
Assessing flood risk for buildings based on rainwater contact;
Evaluating the effectiveness of LID facilities by examining their placement in relation to rainwater accumulation or flow paths.
Figure 3.
Functional Concept Diagram: Analysis of Different Rainfall and Flood Scenarios.
Figure 3.
Functional Concept Diagram: Analysis of Different Rainfall and Flood Scenarios.
As illustrated in
Figure 3, the outputs of the Runoff Path Analysis Tool should be understood as functional conceptual demonstrations, rather than quantitative validations. The left- and right-hand panels in each row highlight different aspects of the analysis: identifying areas prone to water accumulation, assessing building flood risk before and after design refinement, and evaluating whether the placement of LID facilities effectively intercepts runoff along flow paths. These visualizations are intended to clarify the decision-making process supported by the tool, rather than to provide percentage-based accuracy measures.
Following the setup proposed by Morschek et al. (2019), the simulation employed 5000–10,000 particles with a virtual diameter of 20–30 cm to approximate rainfall volume. Each run was carried out for 1000–3000 iterations, where lower iteration counts represent immediate runoff accumulation and higher counts indicate post-event stability [
24]. Surface roughness and impermeability were represented by friction coefficients and restitution parameters in the Kangaroo physics engine. This particle-based approach is simplified and not fully accurate, but for new projects without detailed pipe network data, it offers a practical way to quickly visualize runoff paths and accumulation risks in support of early-stage design.
2.2. Calculation Principles—“Volume Method”
When designing LID facilities with runoff volume and runoff pollution as control objectives, the detention volume of various facilities should generally meet the “Volume of LID Facilities for Catchment Runoff Control” criteria. The specific steps for using the “Volume Method” are as follows:
S1: Determine the Volume Capture Ratio of Annual Rainfall based on planning goals and look up the corresponding Design Rainfall Depth
in a reference table (List of Design Rainfall Depth Corresponding to Volume Capture Ratio of Annual Rainfall in Selected Chinese Cities) [
8] (
Table 2). In this table, labels such as “Guangzhou-85%” and “Guangzhou-100%” indicate the target annual runoff volume capture ratio (VCRAR) used in different Chinese cities. For example, “Guangzhou-85%” means that the design rainfall depth corresponds to an 85% annual runoff capture target for Guangzhou, while “Guangzhou-100%” refers to the 100% target. These values represent the regional runoff control objectives defined in sponge city practice.
S2: Initially, propose LID control indicators for each plot, which may include the sunken green space ratio and its depth, permeable pavement ratio, green roof ratio, and other storage capacities. Then, calculate the comprehensive Volumetric Runoff Coefficient φ.
S3: Calculate the Design Storage Volume V using the formula , where is the design storage volume in m3, is the Design Rainfall Depth in mm, is the comprehensive Volumetric Runoff Coefficient (calculated as a weighted average), and is the catchment area in hm2.
S4: Calculate the Actual Storage Volume of facilities with storage functions.
S5: Derive the Actual Rainfall Depth using
, then use interpolation to look up the Volume Capture Ratio of Annual Rainfall in the reference table (
Table 2). Finally, determine whether the Volume Capture Ratio of Annual Rainfall meets the standard. If it does not, return to S2 to adjust the plan until it meets the requirements.
The research team integrated the calculation formulas of the “Volume Method” into the parametric design platform. “Sponge City+” enables designers to assign distinct LID strategies to different underlying surfaces and to visualize the stormwater runoff control capacity for each type.
2.3. Multiple Operational Modes
2.3.1. Compliance Check and Sensitivity Analysis
According to the “Volume Method” outlined in the Guide, the overall stormwater runoff control capacity of an urban design proposal is calculated to verify compliance with local design rainfall standards and to ensure that the “Volume of LID Facilities for Catchment Runoff Control” criteria are met. The results are then output in tabular form. By applying the principles of controlled variable experiments, designers can analyze the impact of a specific LID strategy on the overall stormwater runoff control capacity, thereby enabling informed optimization and adjustments.
2.3.2. Multi-Objective Optimization
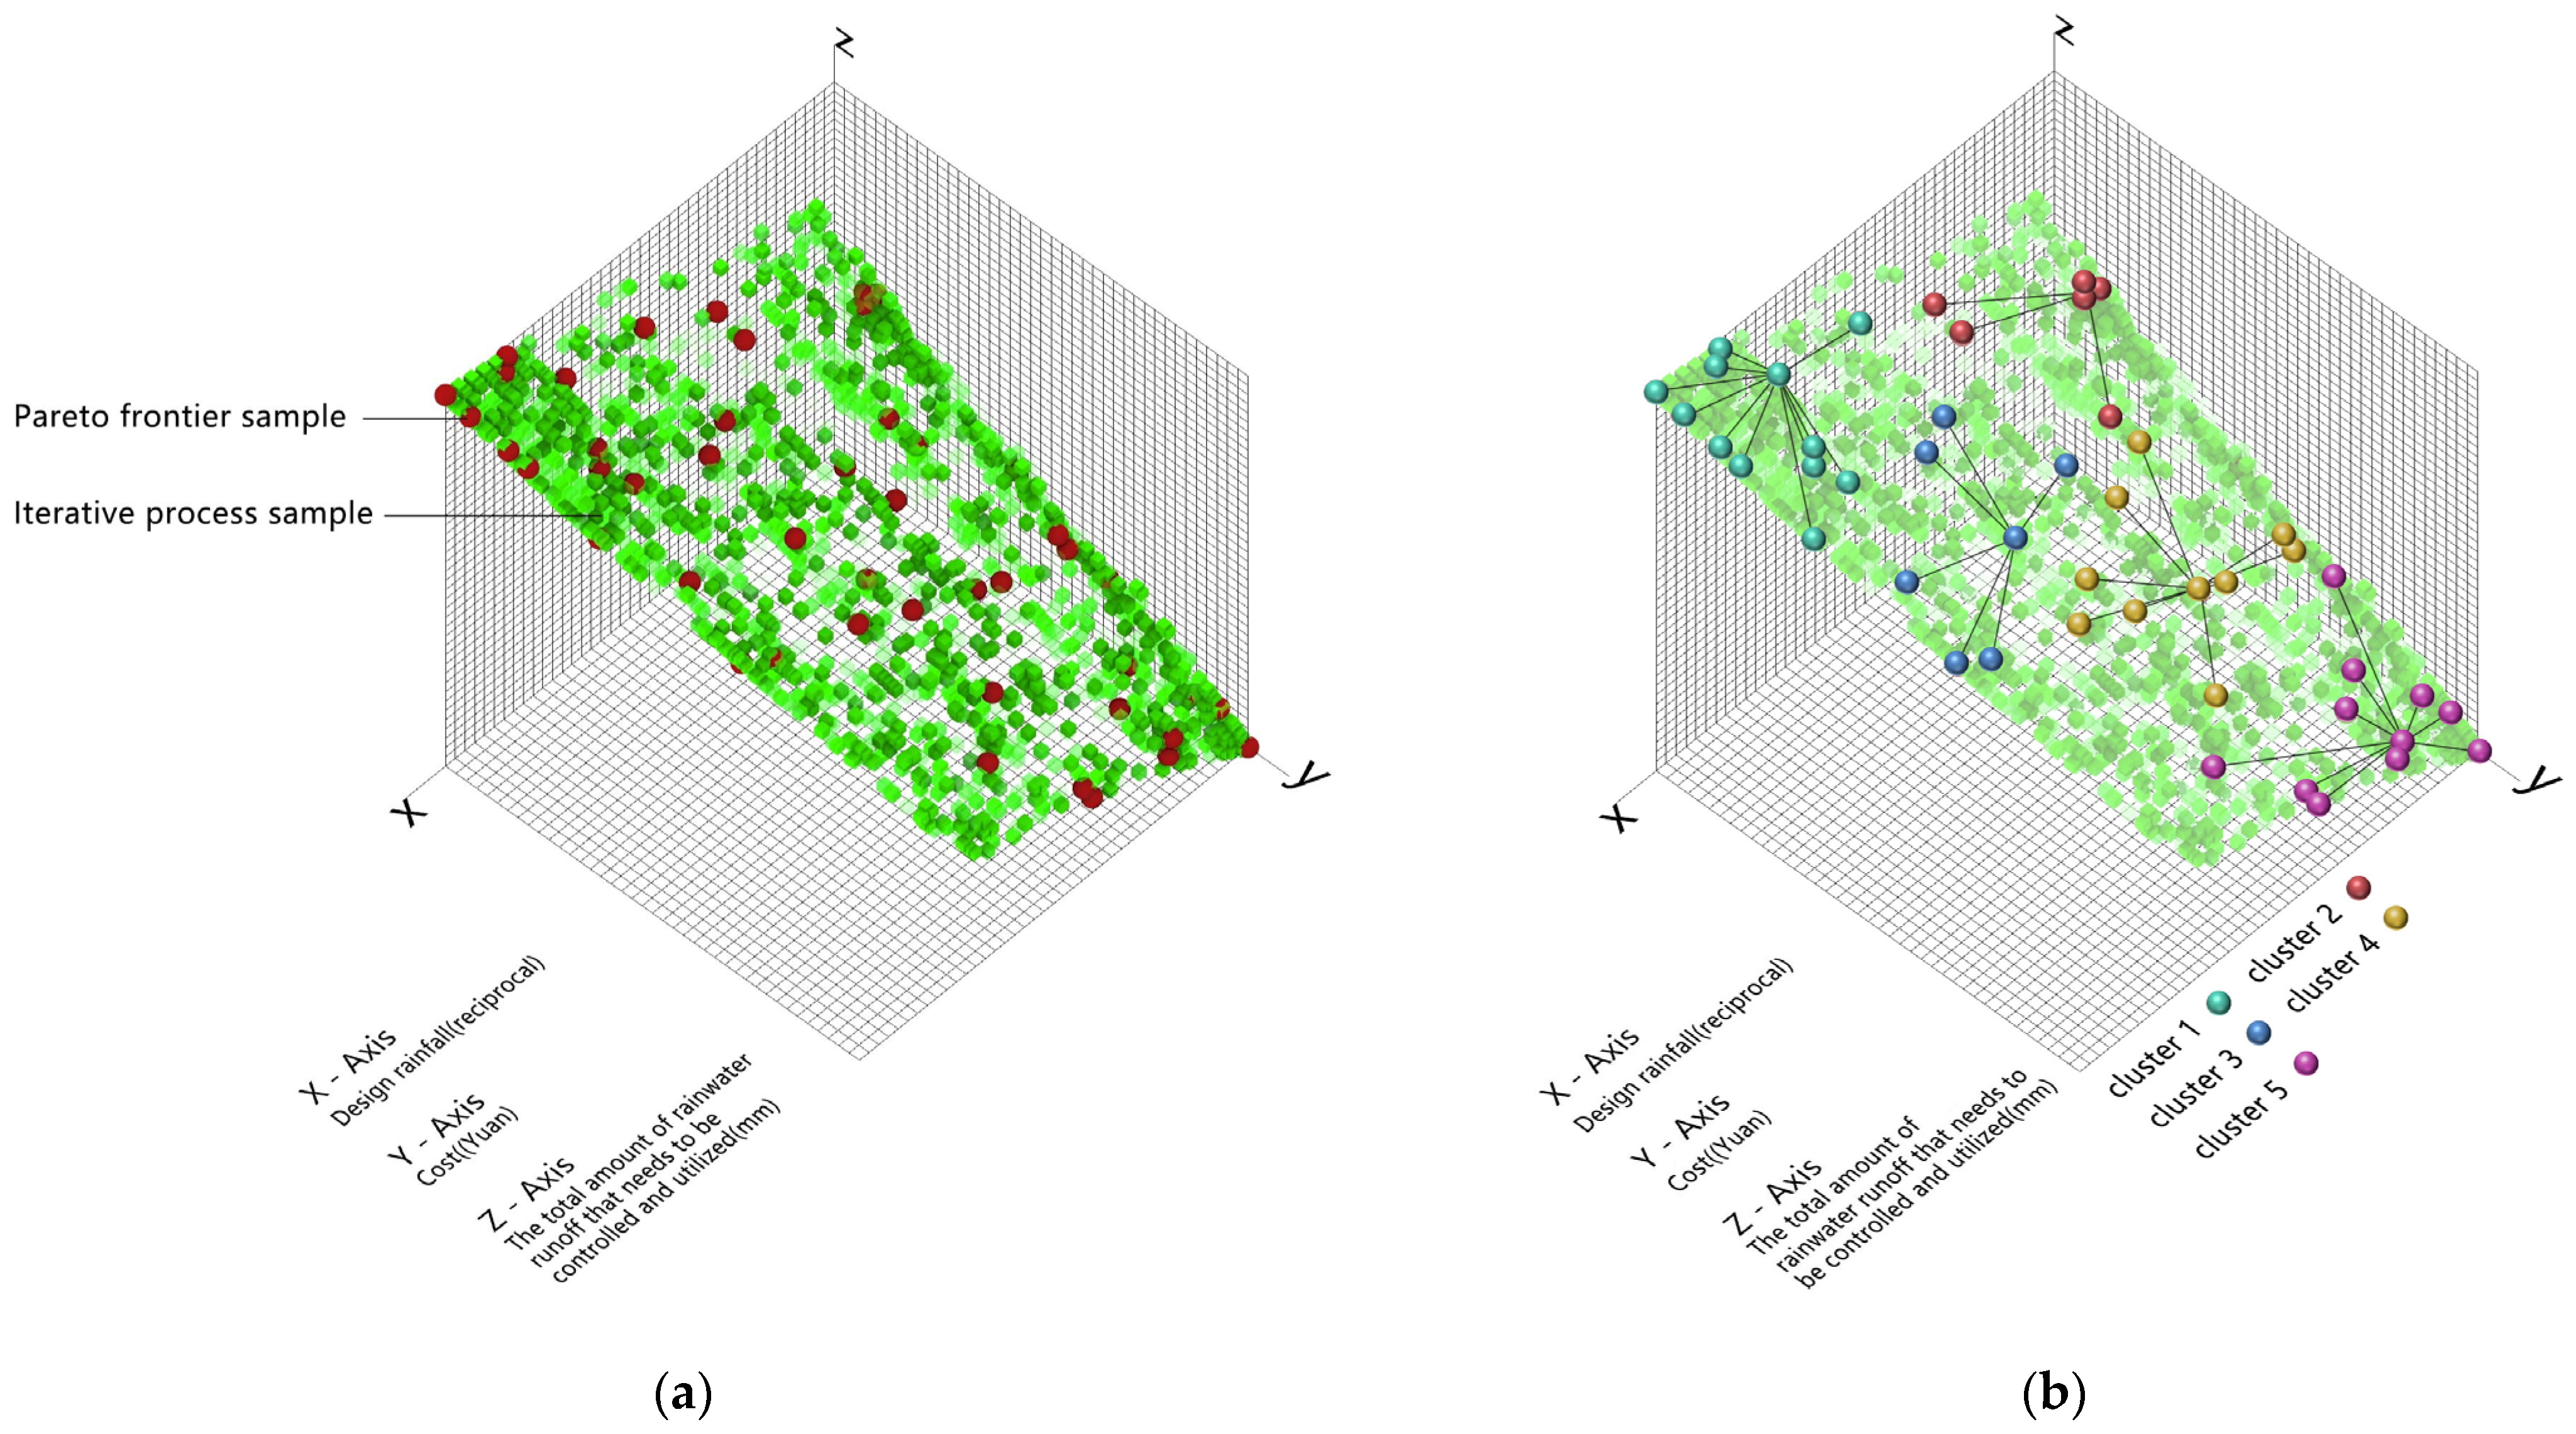
Leveraging the open-source capabilities of the Grasshopper platform, the “Sponge City+” toolkit utilizes the Wallacei plugin and the NSGA-II algorithm to achieve multi-objective optimization. During the goal-setting process for multi-objective optimization, the binding of the LID measures database with the cost database within “Sponge City+” allows cost control to be set as one of the optimization objectives. This approach helps prevent design solutions from becoming overly “performance-driven” or “idealized”. The optimization framework in this study was designed to avoid being purely performance-driven. Instead of pursuing a single “ideal” solution, the NSGA-II algorithm generated a set of feasible design alternatives that simultaneously satisfied compliance with sponge city standards (evaluated by the annual runoff volume capture ratio via the Volume Method), project cost constraints, and peak reduction targets. This ensures that all solutions meet practical thresholds and leaves the final choice to designers and stakeholders. As noted by Sun et al. (2024), effective infrastructure planning requires balancing resilience and lifecycle cost [
30]. Our approach follows this rationale by embedding cost-effectiveness alongside hydrological compliance in the optimization process.
In particular, this mode was tested in Case 2, which was still at the mid-design stage rather than fully constructed. The application at this stage demonstrated how multi-objective optimization can guide designers to balance hydrological performance and construction costs before finalizing the campus layout. Three objectives were defined for multi-objective optimization in Case 2:
- 1.
Actual Design Rainfall Depth (H′)—representing runoff volume control, calculated as
In the formulas:
H′ represents actual rainfall depth (mm);
φ represents comprehensive volumetric runoff coefficient;
V′ represents actual storage volume (m
3);
F′ represents catchment area of facilities with storage function (m
2).
- 2.
Total Stormwater Runoff to be Controlled and Utilized (W)—representing peak flow control, calculated as
In the formulas:
W represents total stormwater runoff to be controlled and utilized (m
3);
c, represents volumetric runoff coefficient;
O, represents volumetric runoff coefficient corresponding to the control peak runoff, which should meet the local planning control requirements;
hy represents design daily rainfall (mm), determined by the maximum 24 h rainfall of the year, not less than the design rainfall corresponding to the volume capture ratio of annual rainfall of the locality;
Fy represents hardened catchment area (hm
2), calculated based on the horizontal projection area of the hardened catchment area.
- 3.
Cost (C)—the total construction cost of LID facilities, derived from local market data in the measures database.
2.3.3. Guidelines for Design Layout Optimization
“Sponge City+” offers prescriptive optimization by analyzing stormwater runoff. This enables the rational overall layout of LID measures during the early design stages, enhancing their ability to effectively “capture” rainfall. Simultaneously, the tool can be used to identify areas more prone to flooding. When designers overlay multiple simulation results, a “diversity map” based on stormwater runoff control emerges, supporting more informed and comprehensive design decisions.
2.4. Collaborative Design Framework in Parametric Environment
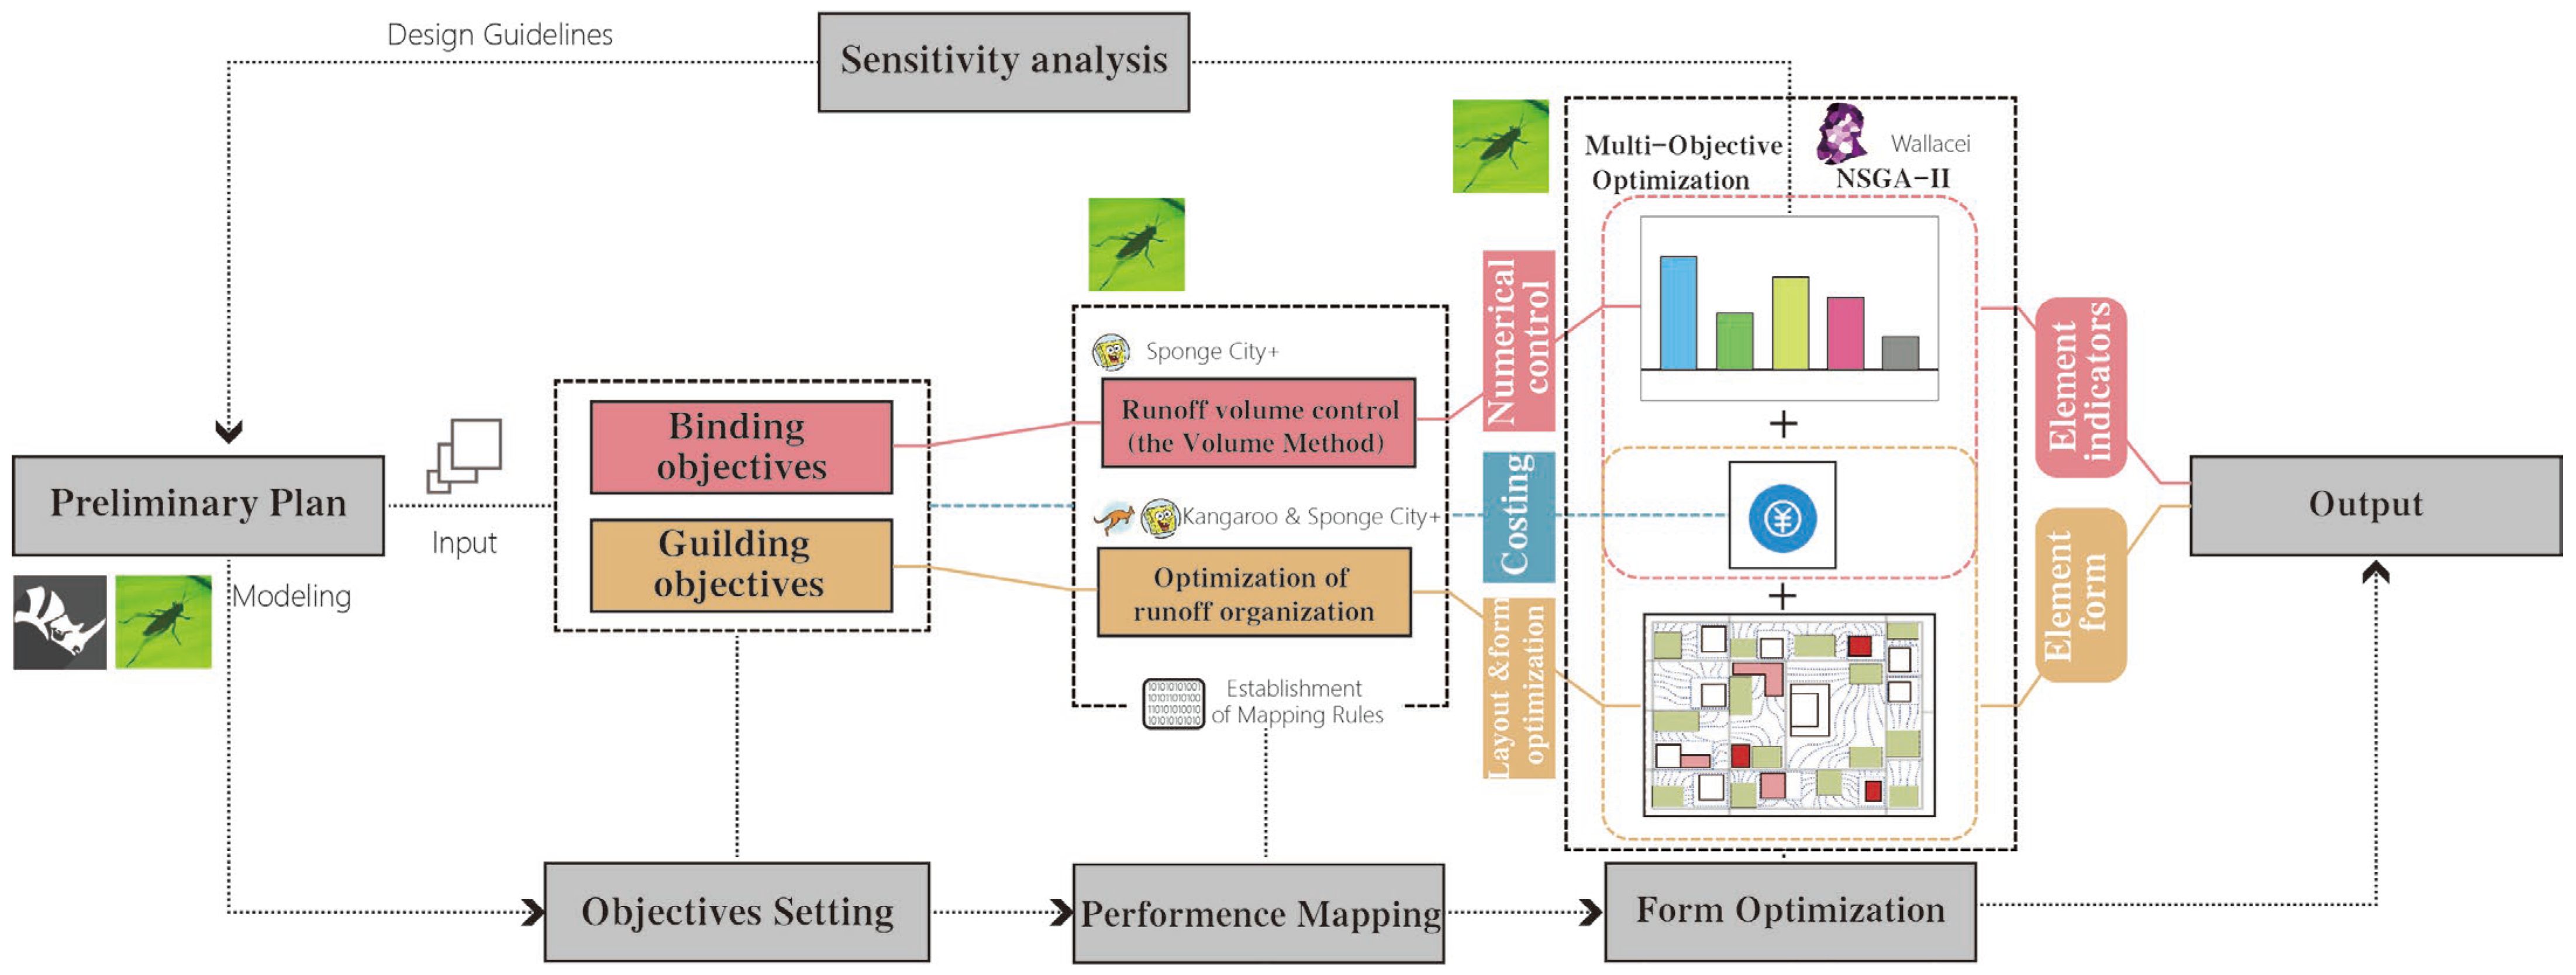
This study employs Grasshopper for Rhino as an open parametric platform to construct a collaborative framework that links urban form with hydrological performance in three stages: objectives setting, performance mapping, and form optimization (
Figure 4). Rhino provides the geometric environment, while Grasshopper manages parametric data sets that directly control spatial form, enabling rapid generation and adjustment of design alternatives.
- 1.
Design Objectives Setting: Two types of objectives are defined. Binding objectives represent compliance requirements, such as annual runoff volume capture ratio assessed with the Sponge City+ toolkit. Guiding objectives focus on spatial optimization, such as reducing inundation risks, supported by Kangaroo runoff path simulations. Balancing these two types ensures that design development is both regulation-compliant and spatially effective.
- 2.
Performance Mapping: In this stage, numerical rules translate design parameters into performance outcomes. For binding objectives, Sponge City guidelines are converted into measurable criteria. For guiding objectives, runoff path simulations highlight high-risk zones, supplemented by cost-control indicators. Importantly, the framework also incorporates sensitivity analysis, which evaluates how different LID measures contribute to runoff reduction and identifies the most influential strategies. This provides designers with clear guidance on which interventions have the greatest impact.
- 3.
Form Optimization: The Wallacei plugin is employed for multi-objective optimization. By integrating compliance outputs from Sponge City+, risk mapping from Kangaroo, and cost indicators, Wallacei applies the NSGA-II algorithm to evolve Pareto-optimal solutions. This enables dynamic quantification and immediate feedback, generating diverse design options under standard computational capacity.
Through this integrated framework, Rhino and Grasshopper act as the open parametric front-end, providing geometric modeling and data-driven control of spatial forms. On top of this platform, the Sponge City+ toolkit functions as the analytical and optimization engine, integrating Kangaroo for runoff path simulation and Wallacei for multi-objective optimization. In this way, Sponge City+ links geometric design with hydrological performance, enabling compliance checks, risk analysis, sensitivity testing, and optimization within a single environment. This holistic integration ensures that early-stage sponge city design can be both regulation-compliant and spatially effective, while offering designers transparent feedback and diverse solution sets.
3. Case Demonstration
This section presents three case studies that collectively demonstrate the applicability of the Sponge City+ toolkit. The cases are designed to be complementary and progressive. Case Study 1 focuses on the sensitivity analysis of different LID strategies, identifying the relative contribution of typical measures to runoff control. Case Study 2 applies multi-objective optimization to balance compliance, cost, and peak reduction, thereby generating a diverse set of feasible design alternatives. Case Study 3 further demonstrates a runoff visualization–based process that integrates human–computer interaction to refine design layouts and mitigate potential flood risks at the early stage. Together, these cases form a coherent framework that moves from evaluating individual measures to testing optimization strategies and finally to practical design adjustment. It must be noted that all three case studies are newly planned projects on undeveloped land, where detailed SUDS or drainage system data are not available. In Case Studies 1 and 2, the input parameters are derived from all underlying-surface data extracted by the Sponge City+ toolkit. After a two-level classification, these data are transformed into LID and non-LID facility datasets (
Figure 5), which can then be mapped to specific facilities with corresponding rainfall retention capacities, thereby enabling calculation through the Volume Method. By contrast, Case Study 3 focuses on the very early design stage. Here, preliminary layout optimization of LID facilities is carried out using surface runoff simulations to guide human–computer interaction, without involving quantitative calculations.
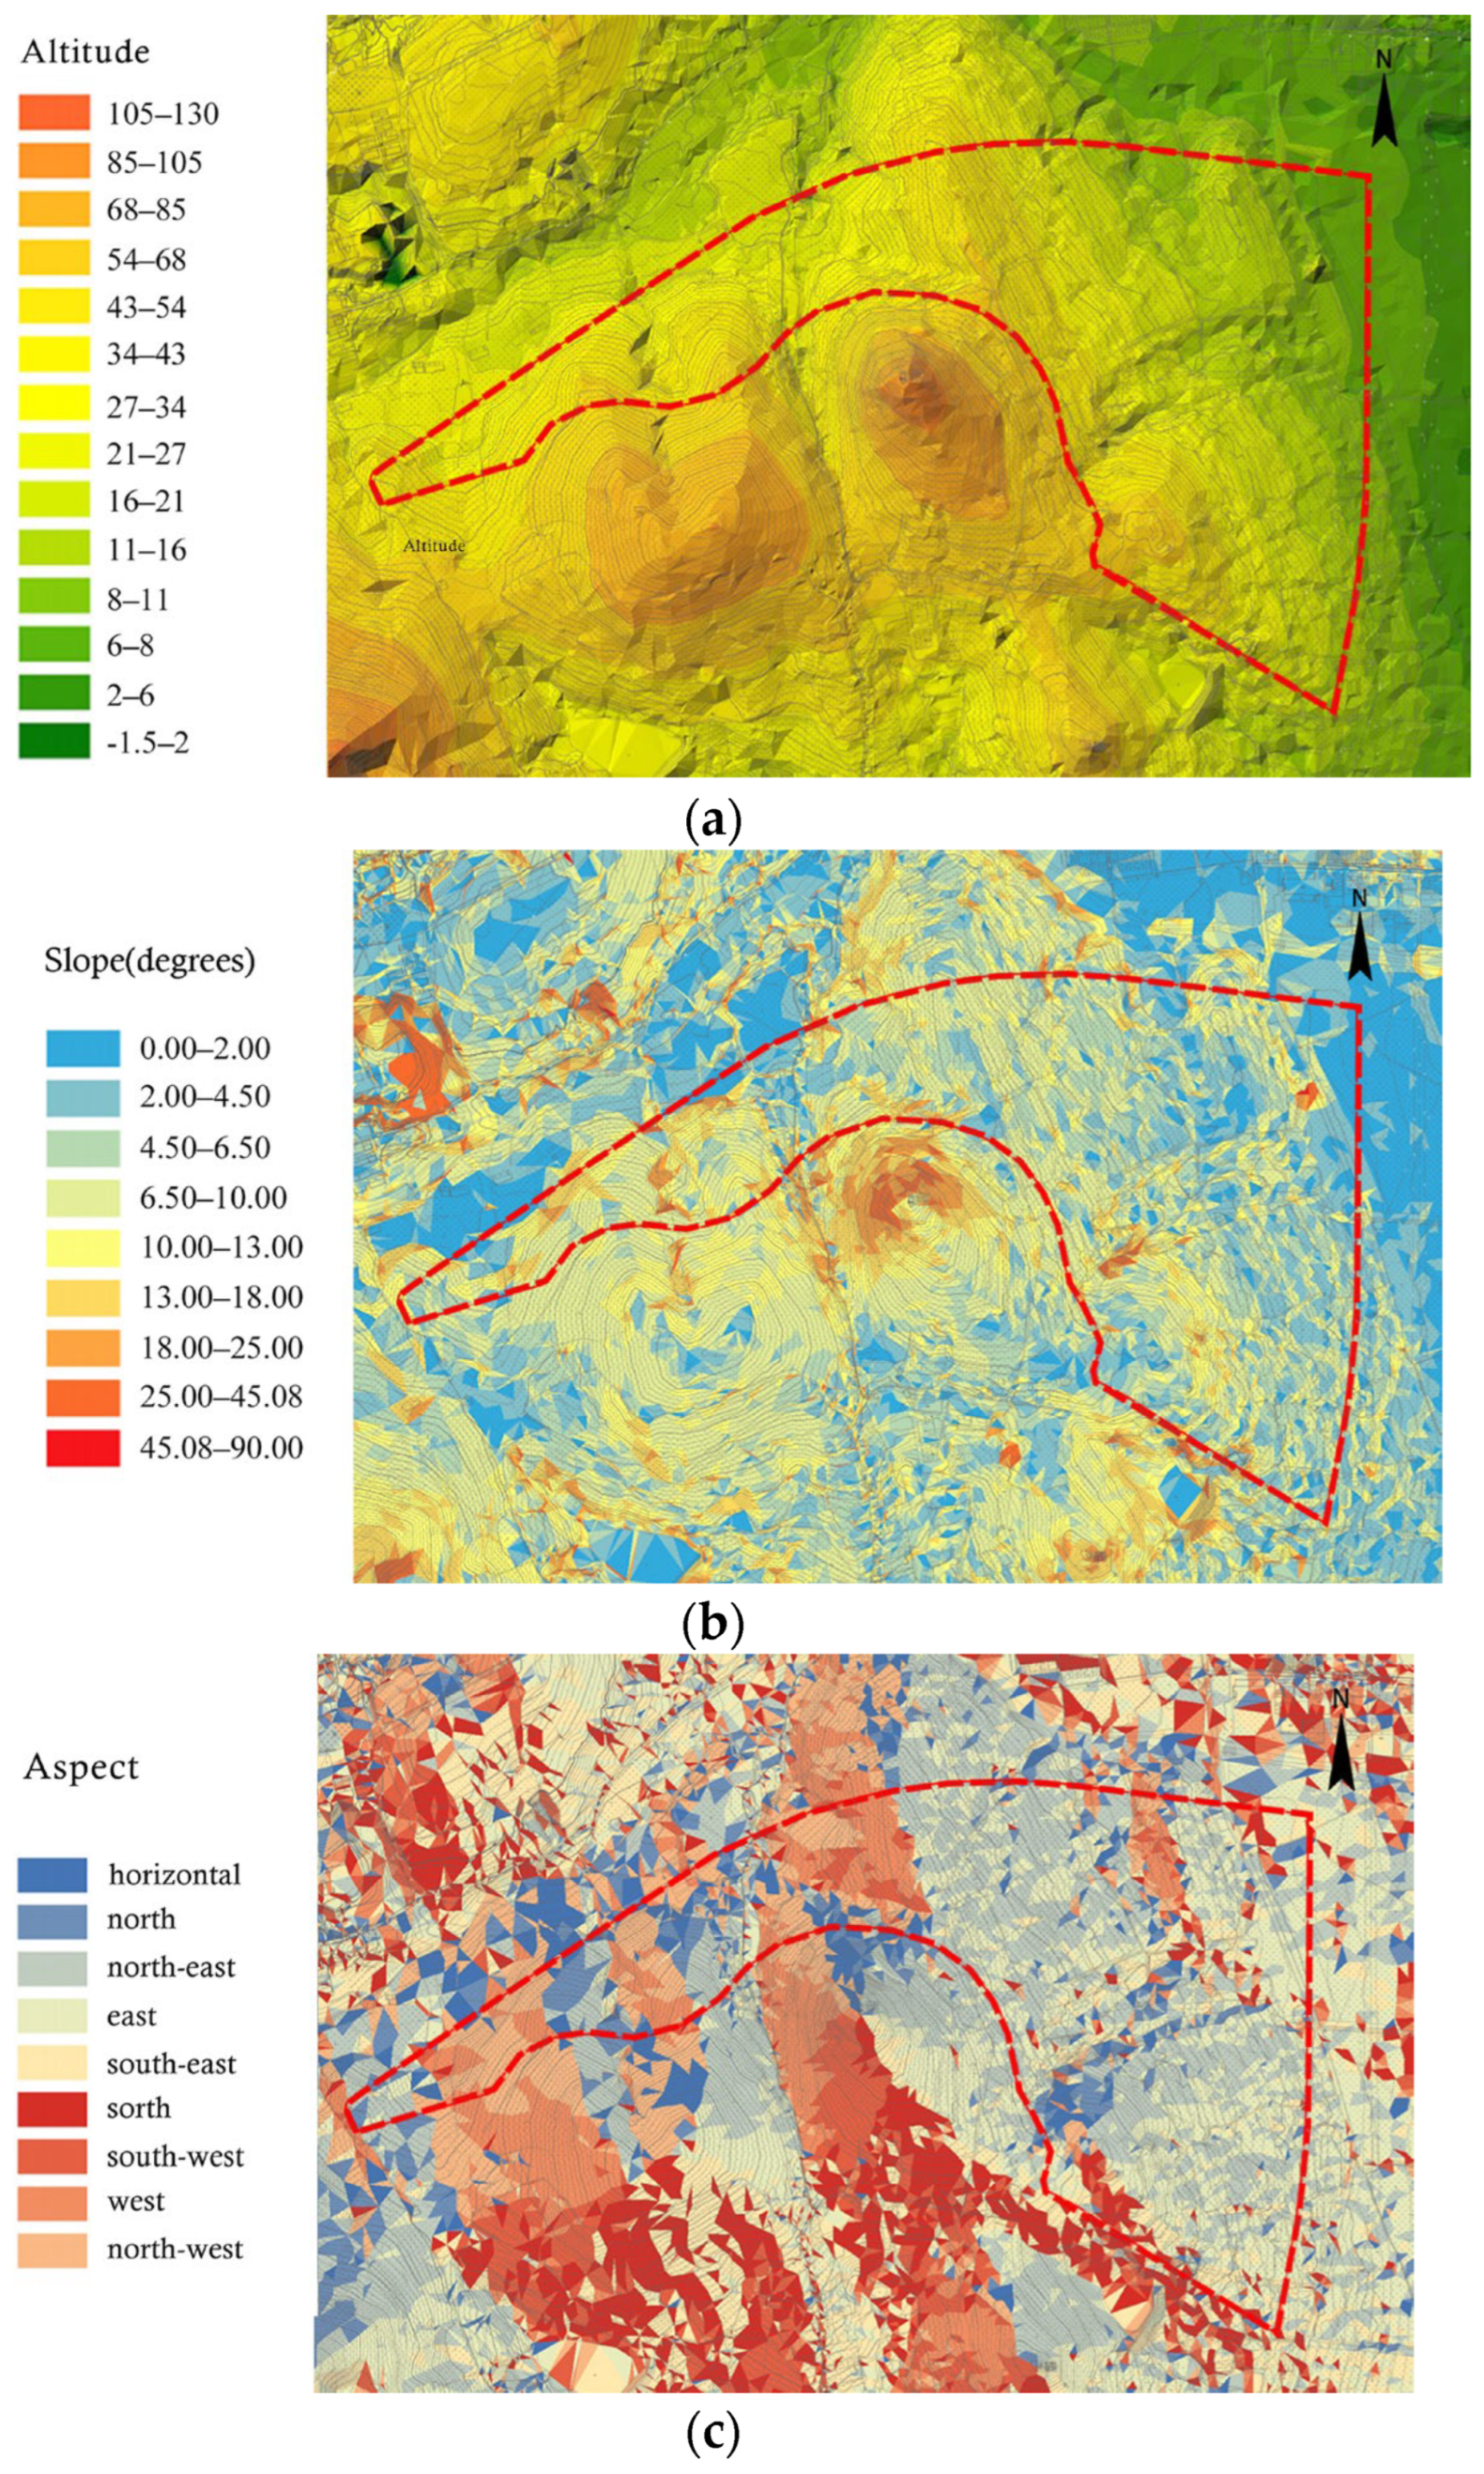
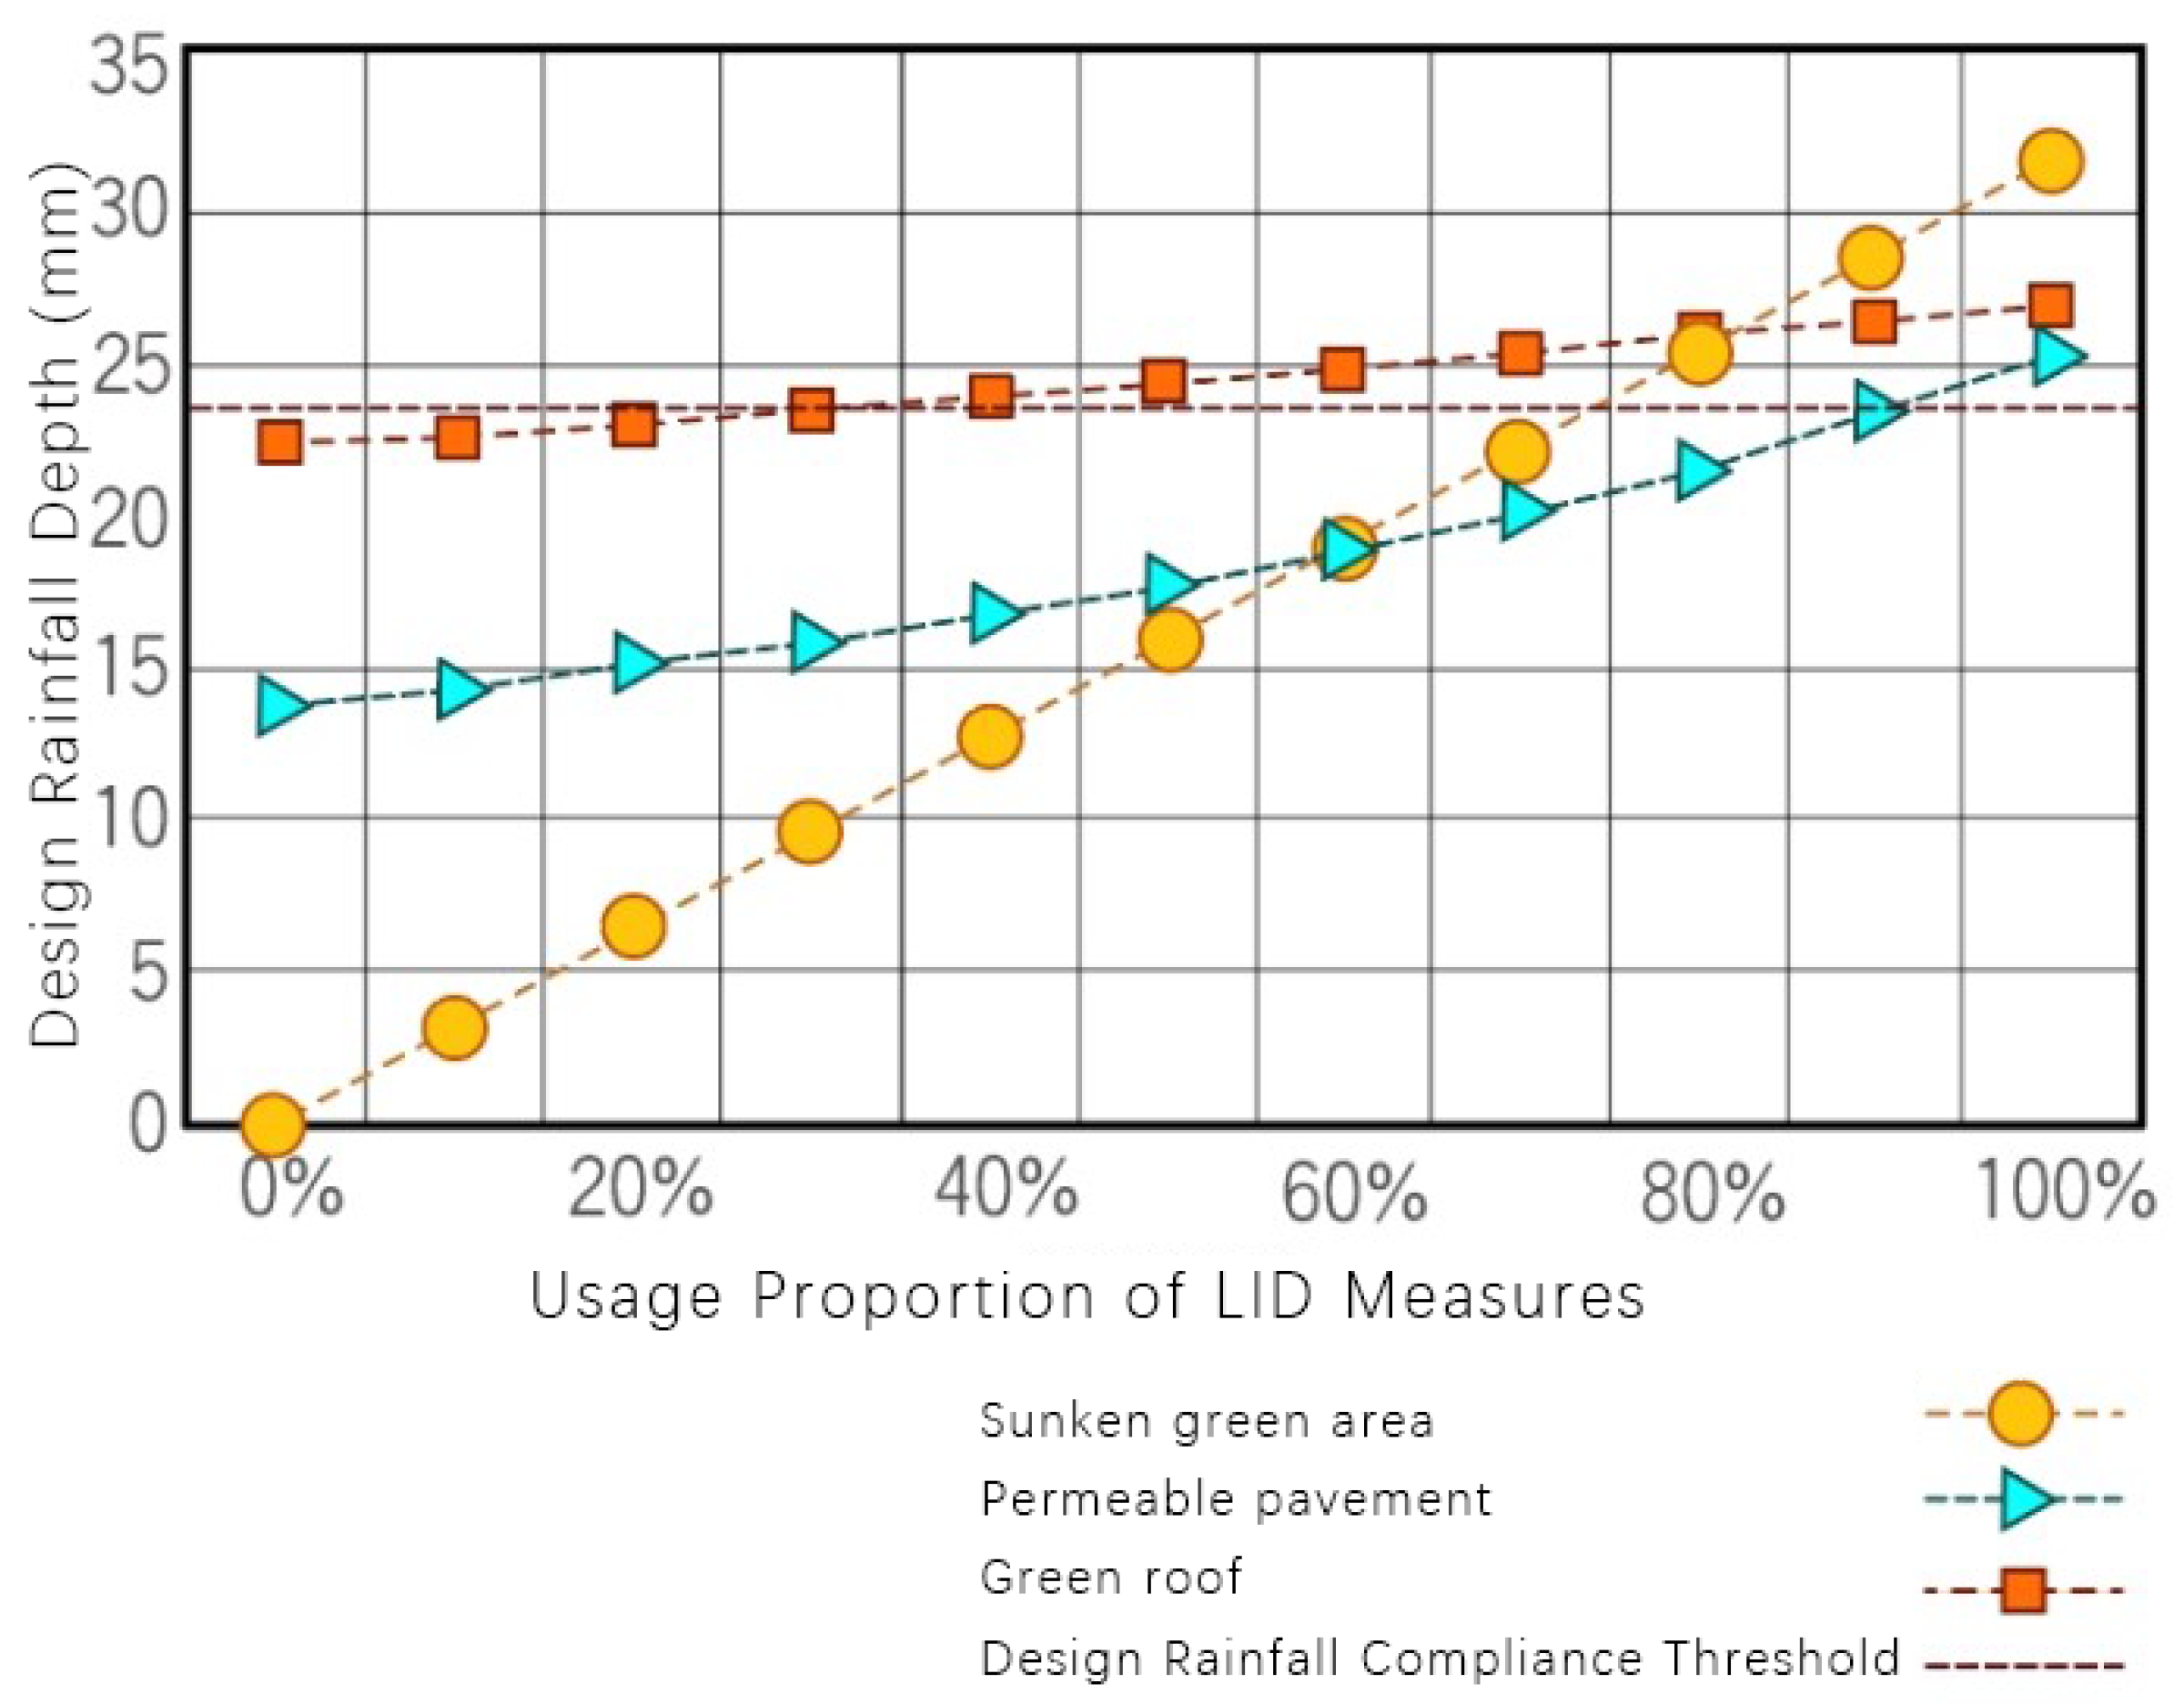
Case Study 1 involves a newly constructed university campus in East China. The study area covers approximately 366,500 square meters, with a total floor area of about 485,000 square meters, of which aboveground structures account for 417,000 square meters, yielding a floor area ratio of 1.14. The site is characterized by typical mountainous terrain, and its steep slopes shorten the runoff convergence time (
Figure 6). The design should aim to restore natural runoff conditions as much as possible, buffering the stormwater from the natural slopes, while also addressing the dual adverse effects of steep gradients and increased hardscaping on site runoff. A rational combination of LID facilities is a key aspect of designing a sponge campus. The proposed plan employs the three most common LID measures: green roofs, permeable pavements, and sunken green spaces. In this project, the “Sponge City+” toolkit will be used to perform a compliance check, followed by sensitivity analysis of each LID measure. Ultimately, this approach will assist campus designers in making informed and appropriate design decisions.
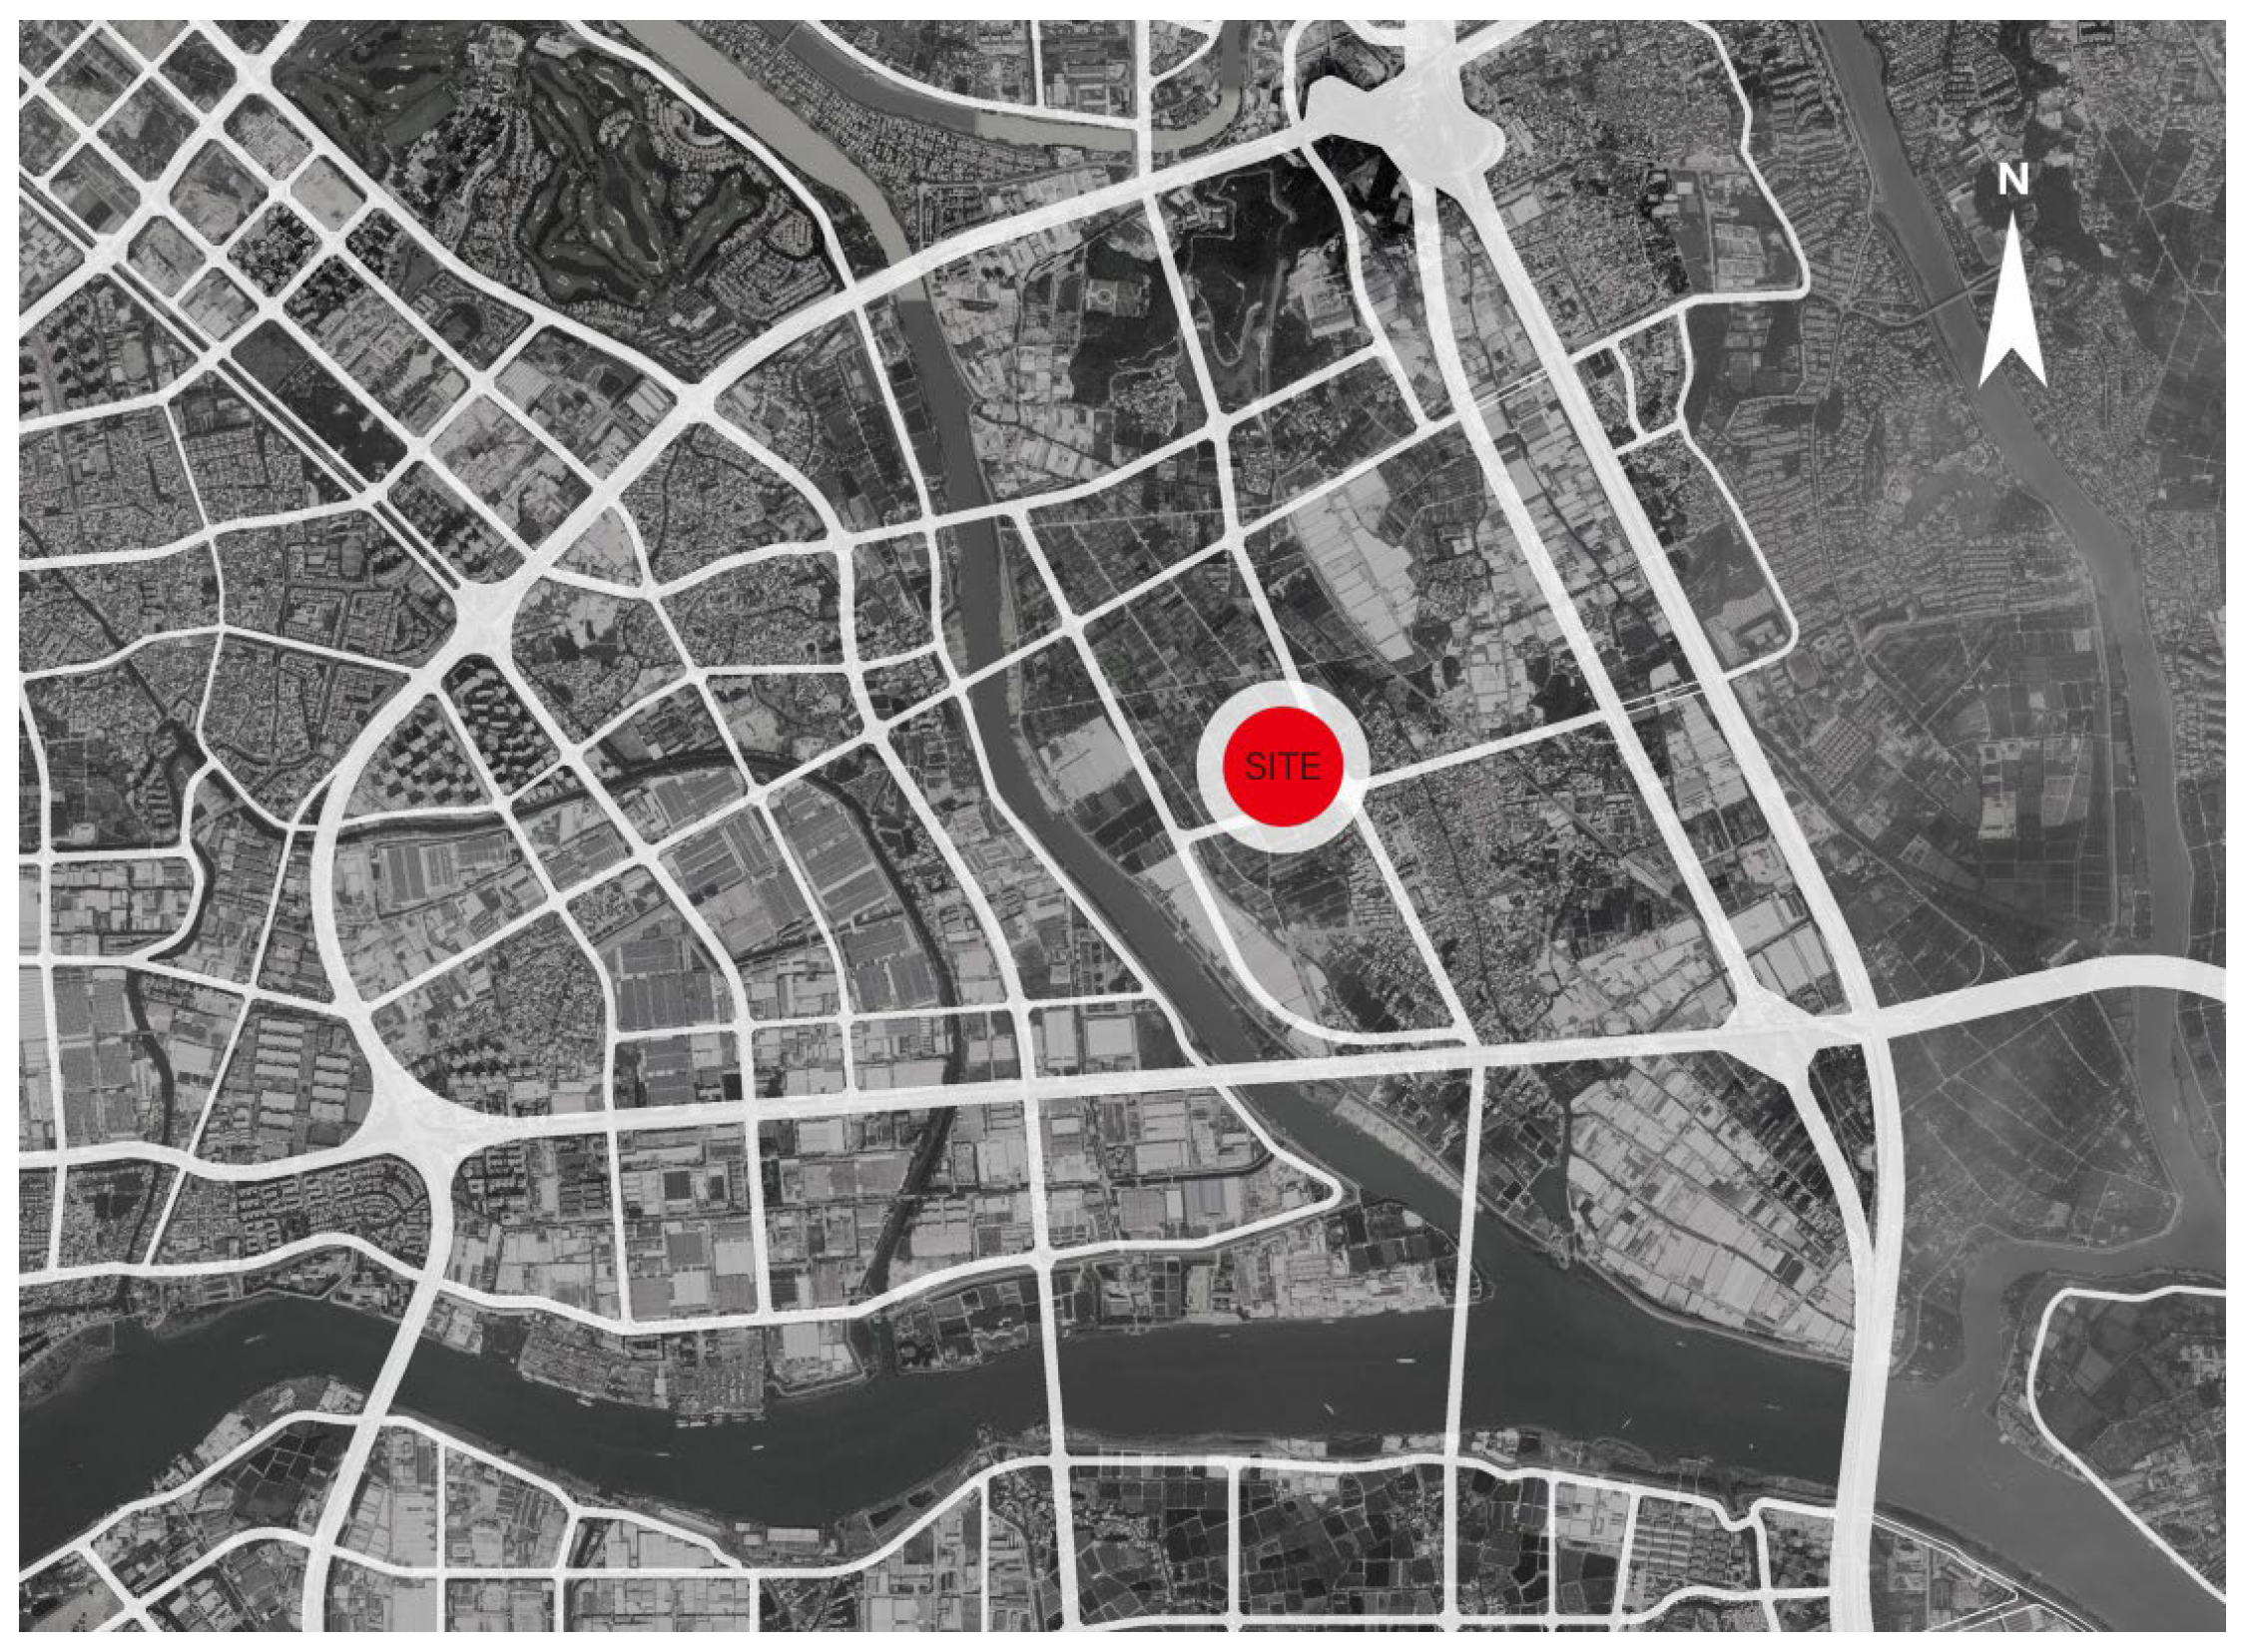
Case Study 2 examines a university campus in southern China with a site area of approximately 123,000 square meters and a total floor area of around 233,000 square meters, characterizing it as a high-density, intensive campus. The site is located on the alluvial plain of the Pearl River Delta, adjacent to the Pearl River waterfront. The terrain is flat with almost no elevation variation (
Figure 7). “Sponge City+” was introduced at the mid-stage of the design process. At this point, designers had already established a basic layout for the campus core area based on provided conditions. During this phase, the research team aimed to optimize the design with a focus on balancing the performance and cost of LID measures. In this case, three optimization objectives were established: “Design Rainfall Depth” (volume control), “Total Stormwater Runoff to be Controlled and Utilized” (peak control), and the cost of low-impact development facilities (cost control). Case Study 2 was analyzed during its mid-design phase and has not yet been fully constructed. The goal was to deliver a high-performance solution with high cost-effectiveness. Before initiating the optimization process, a baseline scenario was established using a traditional trial-and-error approach to provide a reference condition for comparison. In this configuration, the green roof coverage rate was set to 75%, the permeable pavement coverage rate to 75%, and the sunken green space rate to 50%. Under these conditions, the Actual Design Rainfall Depth (H′) reached 44.01 mm, corresponding to an annual runoff volume capture ratio of 85.26%, which meets the local design requirement of 43.4 mm (85%). The Total Stormwater Runoff to be Controlled and Utilized (W) was 6724.64 m
3, and the total cost (C) of LID facilities amounted to ¥ 17,945,000 RMB. This baseline scenario serves as the standard working condition, against which the improvements achieved through the NSGA-II–based multi-objective optimization were evaluated.
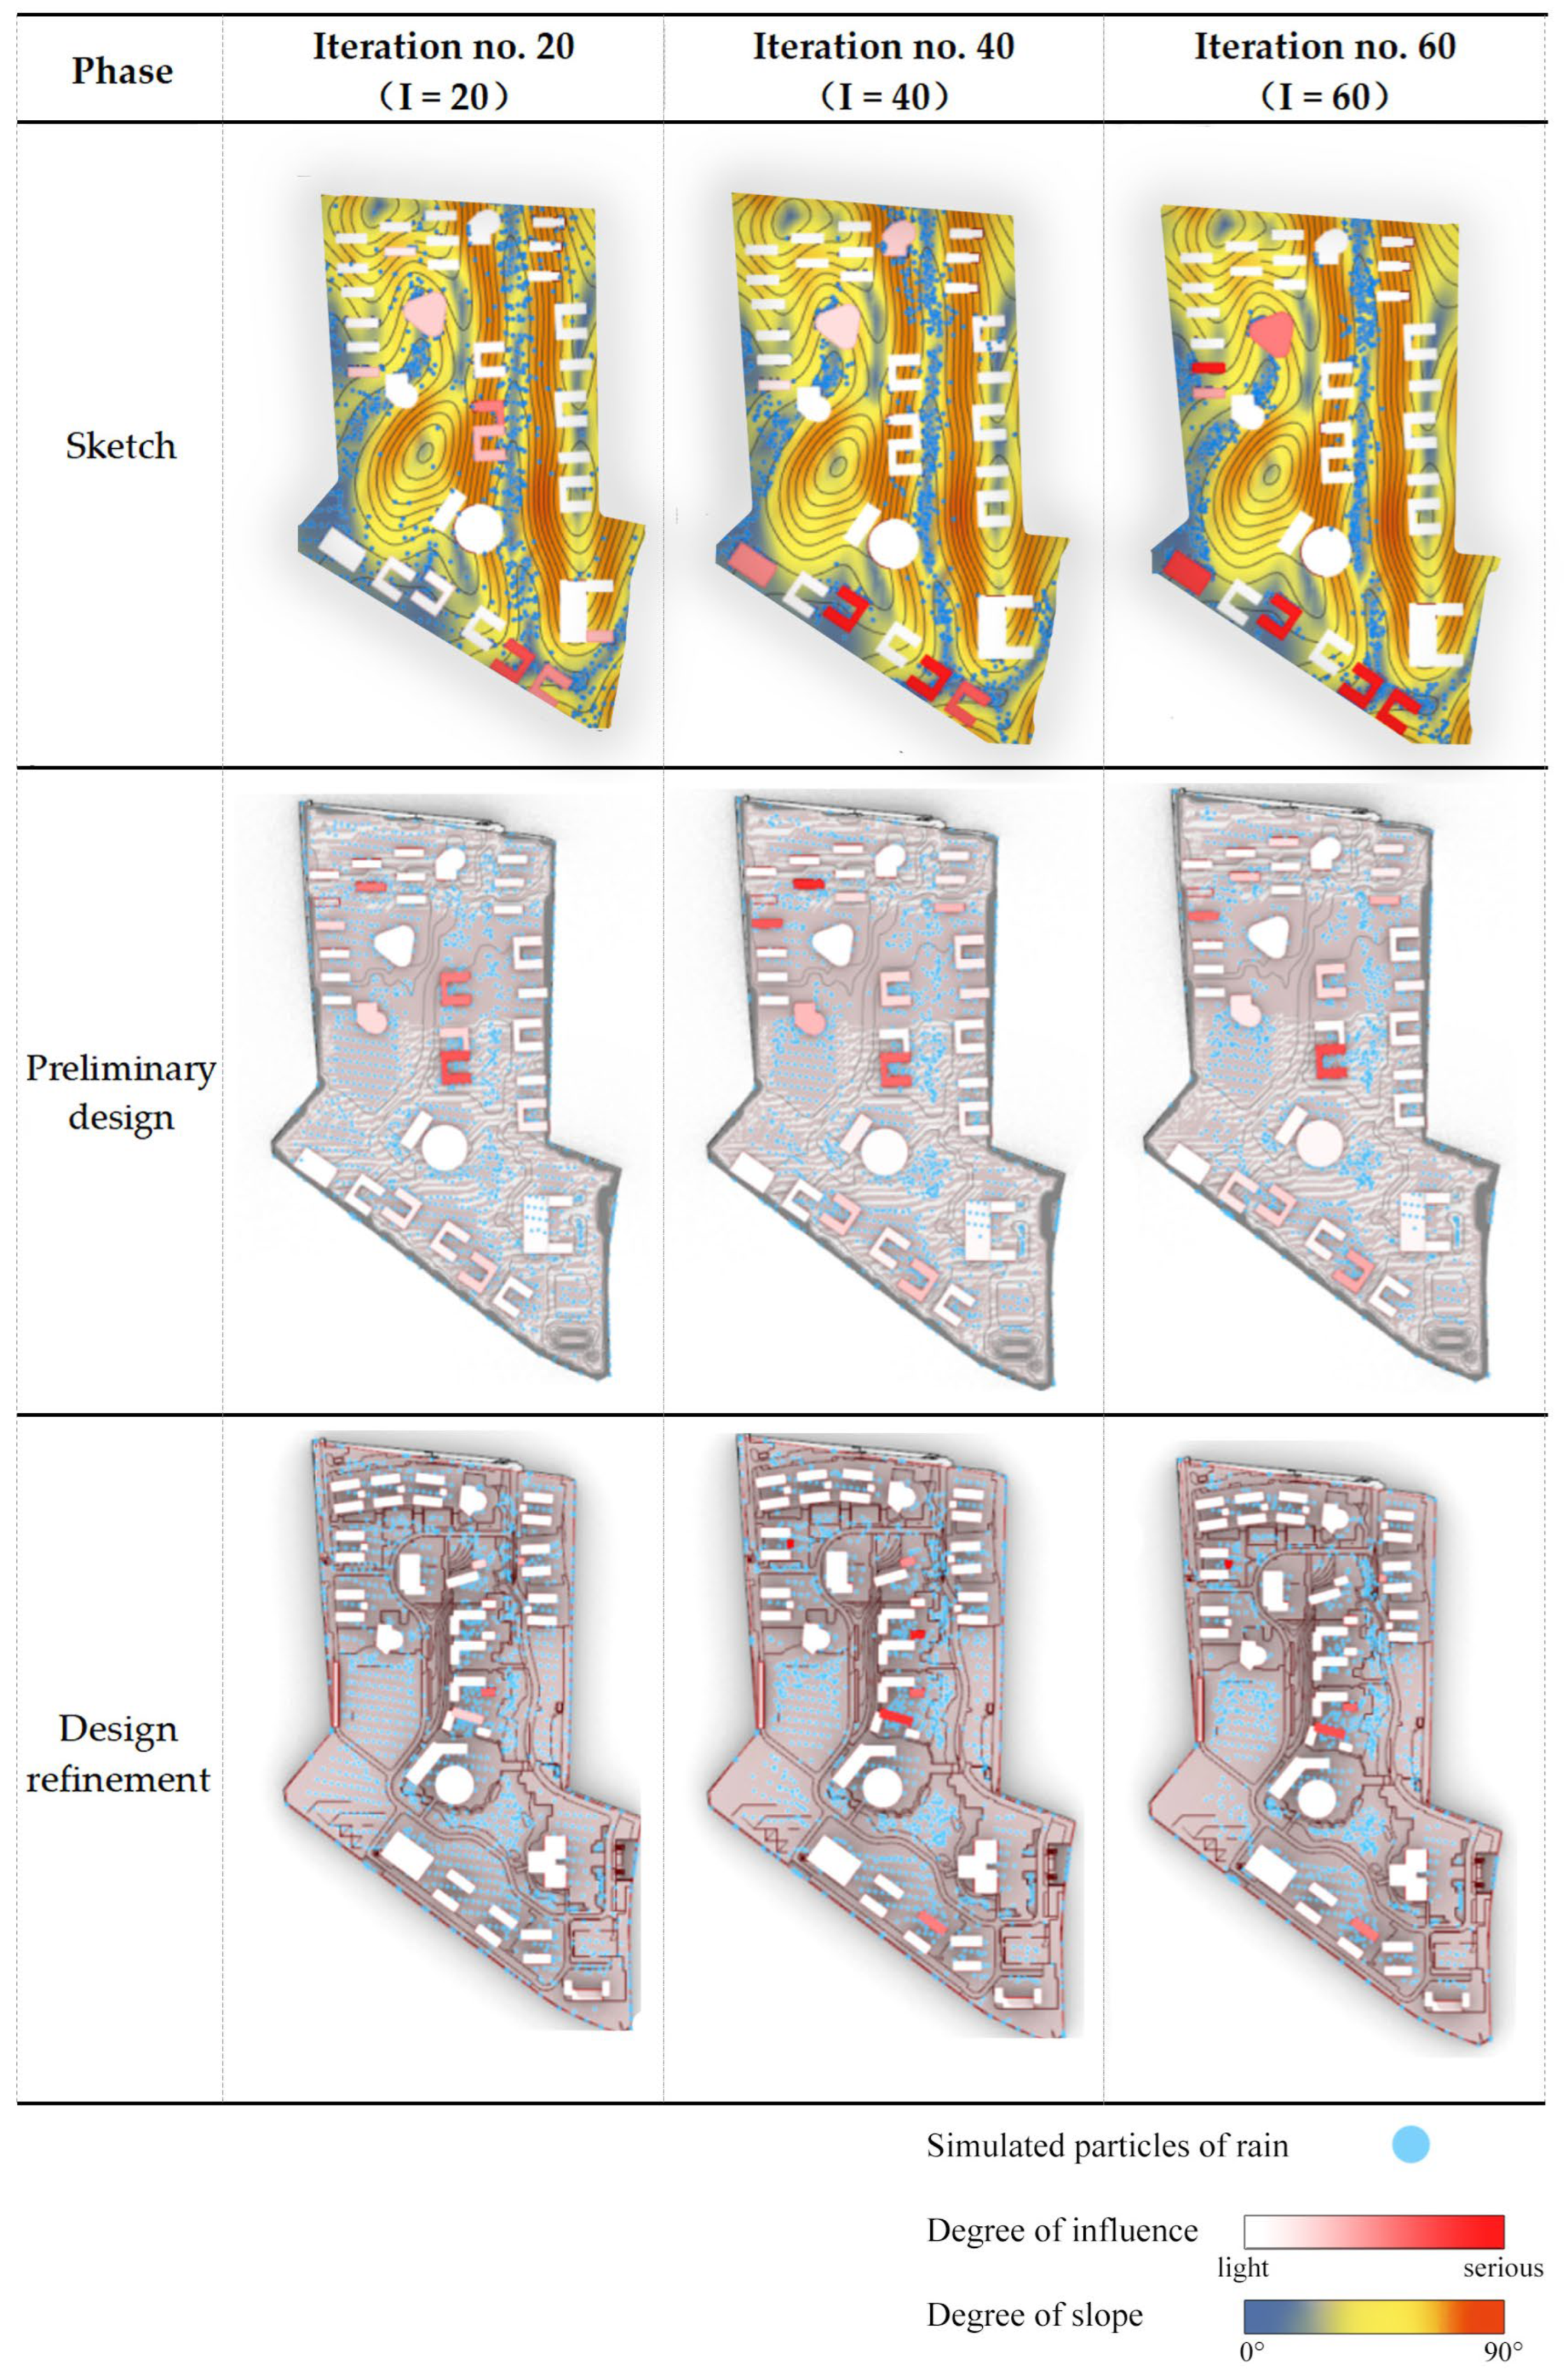
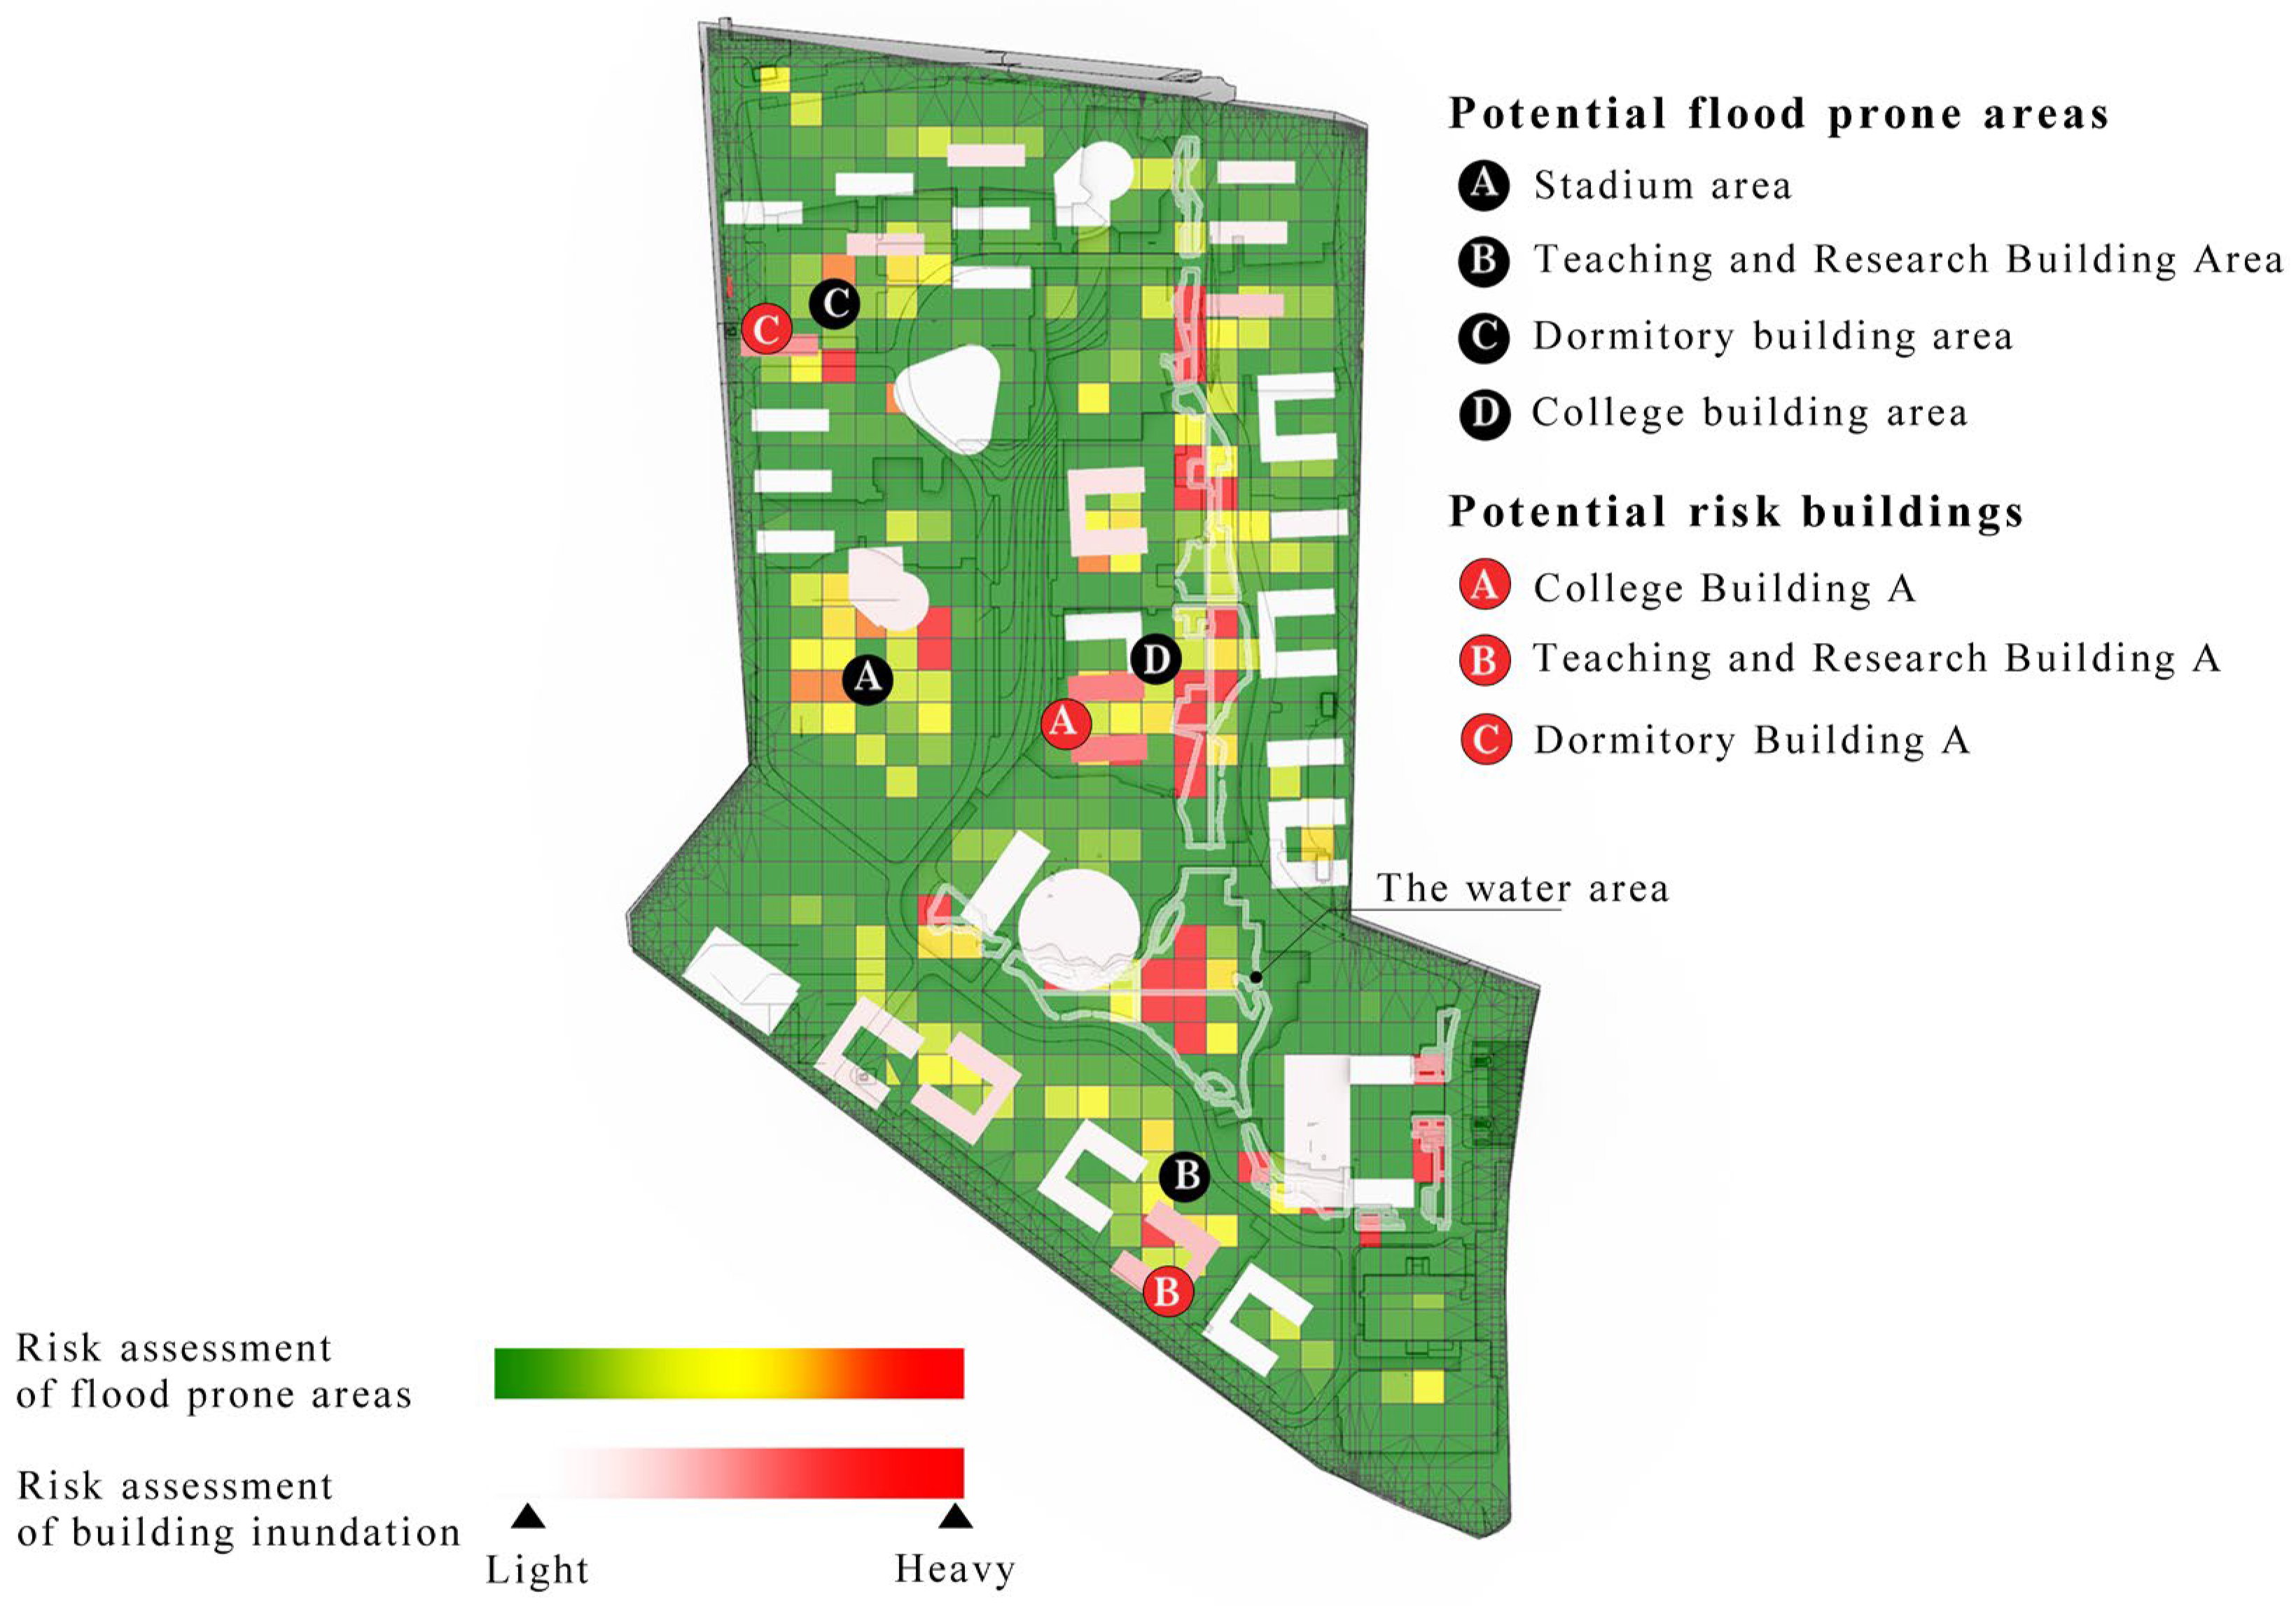
Case Study 3 focuses on a university campus in central China, covering approximately 533,000 square meters of land with a built-up area of 230,000 square meters. The campus is located in a hilly suburban area of a city. The complex terrain and existing natural gullies within the site pose significant hazards due to complicated runoff convergence (
Figure 8), making the rational placement of LID measures and the optimization of vertical design to improve runoff conditions critical issues in the early design stage. In this project, the “Sponge City+” toolkit is applied to analyze on-site runoff conditions and to conduct a comprehensive assessment of flood risks to both the site and the buildings. These analyses provide recommendations for the layout of LID measures.
5. Discussion and Conclusions
5.1. Limitations of This Study
Regarding the selection of empirical case studies, this research focuses exclusively on three university campuses. Compared to other urban areas, university campuses typically exhibit lower density and differ in their design and construction approaches. As the largest single planning units within cities, campus planning and architectural design are generally controlled by relatively few teams, whereas urban design and construction involve greater complexity and more stakeholders and constraints. Consequently, the results presented in this study offer only partial guidance for broader sponge city initiatives. Future research should expand upon this work by examining a more diverse range of urban areas.
In terms of runoff calculation methods, this study utilized the “volume method” recommended by the Guidelines. The validity of the simulation outcomes heavily relies on the scientific robustness of this volume method. Future studies should enhance empirical testing—including scaled-down models and on-site environmental measurements—to validate and potentially refine the volume method, thereby developing a comprehensive and scientifically sound evaluation methodology.
With regard to the design tools, this research simplified simulation methods due to limitations in computational power and tool capabilities. The Kangaroo simulation is not a precise hydraulic model but a simplified tool for rapid assessment. Its advantage lies in providing early guidance in contexts where SUDS or drainage network data are not yet available. Additionally, since the projects studied were newly constructed without complete stormwater pipe network data, the simulations addressed only overland surface runoff and did not account for the influence of stormwater drainage systems. It cannot replace detailed engineering simulations such as SWMM. The quantitative compliance of schemes is therefore primarily assessed through the Volume Method, while the runoff simulation supports designers by offering visual feedback for iterative adjustments. Consequently, the runoff simulations in this study possess inherent limitations, potentially impacting the accuracy of predictions. Subsequent research should integrate advanced stormwater and runoff simulation techniques, comprehensively considering stormwater pipe network impacts, to provide more holistic design guidance.
Therefore, the Sponge City+ toolkit should be regarded as a decision-support system for overland flow analysis and preliminary sizing at the early design stage, rather than as a substitute for detailed hydraulic engineering simulations using models such as SWMM or MIKE URBAN. Its role is to rapidly visualize runoff risks, support compliance checking, and generate feasible strategy sets, while detailed hydrodynamic analysis should still be conducted in later design phases.
5.2. Conclusions and Significance of This Study
- 1.
Previous research on sponge cities primarily focused on the optimization of specific infrastructural facilities and pipe networks, with limited attention given to urban design processes. This study establishes a parametric design workflow tailored specifically to sponge city design, enabling intervention at an earlier stage in urban planning processes. This workflow positively influences the traditional post-evaluation urban design approach, facilitating a closer integration of urban and architectural designs with the placement of Low-impact Development (LID) measures.
- 2.
From the perspective of urban planners and architects, sponge city design involves certain professional barriers, often resulting in a disconnect between spatial design and LID measures. Additionally, architects typically lack effective interactive tools for optimizing designs based on stormwater runoff control objectives. This research introduces a versatile sponge city toolkit validated through practical case studies, demonstrating effectiveness in compliance checking, sensitivity analysis, multi-objective optimization, and spatial layout guidance.
- 3.
The practicality of the workflow and tools developed by the research team has been confirmed through empirical case studies. Specifically, combining compliance checks with sensitivity analyses enables urban and architectural designers to better understand the role of different LID measures in stormwater runoff management. The multi-objective optimization approach helps prevent design proposals from becoming overly performance-driven by incorporating engineering cost controls, enhancing their practical applicability. Furthermore, spatial layout guidelines for LID measures mitigate the risk of designs prioritizing performance at the expense of aesthetics or functionality, ensuring effective runoff capture and reducing ineffective solutions. This approach also facilitates multidisciplinary collaboration among architecture, landscape, and hydrology professionals.
By facilitating early integration of stormwater performance into spatial design, Sponge City+ contributes to sustainable urban development and aligns with global goals such as SDG 6 and SDG 11. Looking ahead, future development of the Sponge City+ toolkit will focus on two directions. First, we plan to integrate simplified stormwater pipe network modules, which can improve hydrological accuracy and extend the tool beyond overland flow analysis. Second, the toolkit will be connected to broader sustainability assessment frameworks, enabling it to evaluate not only hydrological compliance but also environmental, economic, and social co-benefits. These extensions will enhance the interdisciplinary applicability of the tool and support more comprehensive decision-making in urban design practice.
