Article

Traceability Decisions and Coordination Contracts in Agricultural Supply Chains Under Different Power Structures

1
Tan Kah Kee College, Xiamen University, Zhangzhou 363105, China
2
School of Management, Xiamen University, Xiamen 361005, China
3
School of Economics and Management, Fuzhou University, Fuzhou 350108, China
*
Author to whom correspondence should be addressed.
Sustainability 2025, 17(21), 9460; https://doi.org/10.3390/su17219460 (registering DOI)
Submission received: 18 August 2025 / Revised: 18 October 2025 / Accepted: 20 October 2025 / Published: 24 October 2025
(This article belongs to the Special Issue Design of Sustainable Supply Chain and Transportation Service Mode)

Abstract

Recent frequent food safety incidents have heightened consumer concern about agricultural product traceability, driving companies to build more robust supply chain traceability systems. However, enhancing traceability level is not only driven by consumer preferences but is also profoundly shaped by supply chain power structures and coordination mechanisms. In this study, we investigate how consumer preferences, power structures, and contractual mechanisms jointly shape traceability investment and coordination in agricultural supply chains. Using a two-tier supplier–retailer game-theoretic model, we compare traceability levels, pricing, and profit allocation under three governance structures: vertical Nash, supplier-led, and retailer-led. We also evaluate the effectiveness of cost-sharing and revenue-sharing contracts. The results reveal several key insights. First, consumer preference for traceable products serves as a critical market-driven force that enhances traceability investment across supply chain tiers. Second, power structures fundamentally determine traceability outcomes through threshold-dependent mechanisms: when consumer preference is weak, vertical Nash structures yield superior traceability via balanced cost-sharing; however, once preference intensity surpasses critical thresholds, retailer-led structures dominate in responsiveness, profit distribution, and capability building. In contrast, supplier-led structures deliver the weakest outcomes, as concentrated cost burdens suppress investment incentives, particularly in supply chains composed of small and medium-sized suppliers. Third, coordination contracts exhibit structure-specific efficacy. Cost-sharing contracts achieve full optimization in vertical Nash contexts and yield Pareto improvements in supplier-led chains, whereas traditional contracts exert minimal influence in retailer-led settings. These findings enrich our theoretical understanding of traceability governance and provide practical guidance for differentiated traceability design and contract formulation.

1. Introduction

Food safety remains a critical challenge with profound implications for public health and socioeconomic stability [1,2]. Recurrent incidents involving pesticide residues, unauthorized additives, and mislabeling have heightened societal demand for origin verification and quality assurance [3,4]. These problems stem largely from information asymmetry and accountability gaps in multi-layered supply chains, where contamination often leads to delayed source identification, widespread distribution of unsafe products, and erosion of consumer confidence. Establishing agricultural traceability systems with traceable origins, trackable distribution, and assignable responsibilities is thus essential for both regulatory oversight and corporate risk management [5,6]. Globally, traceability has evolved from voluntary guidelines to binding legal mandates, such as China’s Agricultural Product Quality Safety Law and the EU’s General Food Law [7]. The European Union also mandates that food products meet minimum sustainability standards through regulations, thereby compelling companies to invest in traceability systems [8]. Beyond compliance, firms now view traceability as a strategic tool to safeguard brand integrity, strengthen consumer trust, and improve supply chain resilience [2]. Robust traceability systems also enable rapid recalls, enhance visibility, and support process optimization [9,10]. Cases such as JD.com’s blockchain-enabled pathways and Tmall’s provenance verification further demonstrate how technological integration serves both regulatory and commercial purposes [4,11].
Concurrently, consumer preference for traceable products has emerged as a significant market force influencing corporate decision making [11,12]. Empirical studies demonstrate that consumers exhibit willingness to pay price premiums for traceable food products, perceiving them as safer, more credible, and transparent [13,14,15]. This preference pattern reflects not only strong demand for quality assurance but also creates economic incentives for enterprises to gain market returns beyond mere regulatory compliance. Retailers, positioned closest to end consumers, possess heightened sensitivity to these preferences and consequently demonstrate stronger motivation to implement traceability systems [11,12]. In contrast, upstream suppliers, despite controlling critical production data, often face substantial cost barriers related to system development, data collection infrastructure, and standardization requirements, making independent traceability implementation financially prohibitive. The fundamental challenge in establishing agricultural traceability systems lies in their dependence on coordinated investment and operational alignment across supply chain tiers [3,16]. Practical implementation is complicated by divergent objectives and resource disparities among participants [3,16]. Agricultural supply chains typically feature fragmented small-scale producers with limited bargaining power and operational capabilities, while downstream retailers exercise concentrated authority through channel control, pricing leverage, and product selection. This asymmetric power structure directly impacts stakeholders’ willingness to invest in traceability capabilities. For instance, retailers may mandate upstream data provision to satisfy regulatory or consumer demands without compensating suppliers’ implementation costs, thereby suppressing supplier participation [16]. Conversely, when brand owners require downstream sales data to establish distribution tracking, retailers as non-primary beneficiaries may demonstrate limited cooperation incentives [3]. Such collaboration dilemmas arising from misaligned cost–benefit distributions represent the core impediment to effective traceability system development.
Furthermore, supply chain power structures determine the leading party in traceability initiatives and the distribution of responsibilities, influencing overall system efficiency [17]. In retailer-dominated structures, retailers may enforce compliance through contractual mandates, exemplified by Walmart’s RFID initiative. In supplier-led structures, brand owners may require retailers to record sales data through bundling and channel partnerships [3,16]. Although prior studies have addressed technical implementation and consumer responses, there is still limited theoretical work that systematically models how different power structures shape traceability decisions and coordination under consumer-driven contexts. This represents a clear research gap. To address this gap, this study develops a game-theoretic framework for a two-tier agricultural supply chain (one supplier and one retailer) with consumer traceability preference incorporated. Four research questions guide the analysis:
  • RQ1: What are the optimal traceability levels, wholesale price, retail price, and order quantity under different supply chain power structures? Based on this research question, we assume that under different power structures, firms’ optimal decisions on traceability level, pricing, and order quantity will vary systematically.
  • RQ2: Which supply chain power structure most effectively enhances supply chain traceability? And how does each structure affect supplier and retailer profitability? Based on this research question, we assume that supply chain power structures significantly influence overall traceability levels and the distribution of profits between suppliers and retailers.
  • RQ3: How does consumer preference for traceability impact firms’ traceability investments? Based on this research question, we assume that stronger consumer preferences for traceable products increase firms’ incentives to invest in traceability across supply chain tiers.
  • RQ4: How can contractual arrangements (e.g., revenue-sharing and cost-sharing) coordinate decentralized supply chains to incentivize traceability enhancement? Based on this research question, we assume that cost-sharing and revenue-sharing contracts mitigate incentive misalignments in decentralized supply chains and enhance traceability performance.
To answer these questions, in this study, we first establish a centralized joint decision-making model as the benchmark. Subsequently, considering asymmetries and non-cooperative behaviors, we develop three decentralized models: vertical Nash, supplier-led Stackelberg, and retailer-led Stackelberg. To address incentive misalignments, two coordination mechanisms are further examined: cost-sharing contracts to alleviate disproportionate upstream burdens and revenue-sharing contracts to address insufficient downstream returns. By comparing these mechanisms across governance structures, this study not only enriches agricultural traceability theory but also provides actionable strategies for firms and evidence-based policy recommendations.
This study delivers three significant theoretical contributions. First, it explicitly demonstrates how consumer preferences interact with power structures to shape traceability investment behaviors and profit distribution, extending game-theoretic approaches in this domain. Second, our integrated analytical framework encompasses both centralized decisions and diverse decentralized scenarios, accurately representing the dominant and balanced relationships characteristic of agricultural supply chains. This approach establishes theoretical foundations for understanding systemic collaboration barriers. Third, through comparative examination of cost-sharing and revenue-sharing contracts, we develop adaptable coordination strategies for varying power configurations. These findings provide substantive managerial guidance for traceability system implementation and generate evidence-based policy recommendations for optimizing supply chain governance structures.

2. Literature Review

In this study, we examine agricultural supply chains driven by consumer traceability preferences, investigating how supply chain members determine traceability investments under varying power structures and achieve systemic optimization through coordination mechanisms. To clarify the theoretical foundations and research gaps, the existing literature is reviewed across four dimensions. First, the conceptual boundaries and measurement metrics of traceability level must be established to define functional responsibilities within agricultural traceability systems. Second, as traceability systems represent system-wide investments, their implementation is influenced by multifaceted internal and external factors, necessitating examination of firms’ investment motivations and decision pathways. Third, given inherent disparities in resources and market influence among supply chain entities, power structures significantly govern leadership behaviors and response patterns in traceability development. Finally, contractual mechanisms emerge as critical tools for overcoming collaborative barriers in traceability investments, realigning cost–benefit allocations across supply chain tiers. Thus, in this study, we systematically synthesize the literature across traceability levels, investment behaviors, power structures, and coordination contracts, thereby establishing the theoretical underpinnings for our research framework and analytical modeling.

2.1. Supply Chain Traceability and Traceability Level

Agricultural traceability systems serve as critical instruments for enhancing supply chain transparency and product accountability. Originally developed for regulatory compliance and crisis management, these systems fundamentally document and transmit information to verify product origins and distribution pathways [18]. Technological advancements and growing consumer demand for provenance tracking have transformed them into strategic supply chain data integration tools [19], establishing verifiable operational records across production, processing, distribution, and retail stages to enhance overall supply chain controllability. To systematically evaluate traceability level, Golan et al. (2004) [5] and McEntire et al. (2010) [20] proposed a four-dimensional framework encompassing breadth (diversity of recorded product attributes), depth (upstream/downstream traceability coverage), precision (accuracy in identifying product-specific pathways), and velocity (information retrieval efficiency during emergencies). This classification advances theoretical understanding while guiding agricultural enterprises in setting capability targets and allocating resources. Extant research, however, remains predominantly focused on dimensional definitions, leaving significant gaps regarding how firms determine optimal traceability levels under operational constraints. Particularly underexplored are questions concerning investment symmetry and efficiency advantages across varying supply chain power structures.

2.2. Investment Decision in Agricultural Traceability Systems

Establishing traceability systems requires substantial upfront investments in hardware (e.g., scanning systems and RFID technology), software platforms (e.g., ERP and blockchain), and workforce training coupled with standardization efforts. This process necessitates complex cost–benefit analyses, where decisions regarding whether to invest, investment scale, and implementation approaches constitute core research questions. As a result, there is a phenomenon of low willingness among producers to invest in traceability systems [21]. Empirical studies have identified multiple determinants influencing corporate investment behaviors. Golan et al. (2004) [5] demonstrated that consumer preferences for traceable products and firms’ digital capabilities significantly shape investment willingness. Analyzing 234 German food companies via partial least squares methodology, Heyder et al. (2012) [22] identified managerial perceptions, regulatory pressure, consumer feedback, and organizational resources as critical investment determinants. Mattevi and Jones (2016) [23] further established through UK SME surveys that firm size, technical support, and market orientation moderate investment intentions. Cui et al. (2023) [24] demonstrate that blockchain-based traceability systems enable companies to obtain brand premium pricing in consumer markets. Yang et al.’s (2025) [25] study demonstrates that blockchain-based traceability systems hold significant consumer value in China’s fresh pork market, with government certification and information intervention serving as key driving factors. Duong et al. (2025) [26] demonstrate that blockchain-based traceability systems enhance supply chain transparency, establish consistent trust between producers and retailers, and significantly improve organic food consumption along with long-term brand loyalty. Nevertheless, two significant limitations persist in this research stream. First, studies predominantly identify influencing factors without modeling the underlying decision mechanisms governing investment behaviors. Second, most adopt single-entity perspectives, overlooking supply chain interdependencies and strategic interactions in traceability investments. To address these gaps, scholars have introduced game-theoretic approaches. Resende-Filho and Buhr (2008) [27] employed principal-agent modeling to analyze retailers’ incentive mechanisms for optimal upstream traceability investments, while Resende-Filho and Hurley (2012) [3] incorporated traceability effort variables to examine processor-supplier incentive designs. Zheng et al. (2023) [28] developed evolutionary game models between governments and food enterprises, revealing regulatory limitations in ensuring information authenticity. Song et al. (2018) [29] investigated multi-agent interactions among governments, farmers, certification bodies, and consumers to illuminate strategic pathways. Crucially, however, existing game-theoretic frameworks have not explicitly addressed how supply chain power structures govern investment sequencing and incentive allocation mechanisms in traceability systems.

2.3. The Influence of Supply Chain Power Structures on Firm Behavioral Differences

Agricultural supply chains constitute multi-tiered systems where participants exhibit significant disparities in resource control, market access, and rule-setting authority, resulting in diverse power configurations such as supplier-led, manufacturer-led, and retailer-led structures [6]. These structural disparities fundamentally shape firms’ relative positions regarding pricing power, product control, and information authority, consequently influencing their strategic choices in supply chain collaborations. Within this domain, Shi et al. (2013) [30] examined how power structures affect firm performance and risk allocation under demand uncertainty; Ghosh and Shah (2012) [31] compared pricing behaviors and profit outcomes across manufacturer-led, retailer-led, and vertical Nash structures in green product contexts; Ma et al. (2013) [32] systematically analyzed equilibrium outcomes by incorporating quality investments and market development variables; and Gao et al. (2016) [33] demonstrated how power configurations alter reverse logistics efforts and sales decisions in closed-loop supply chains. Li and Mizuno (2022) [34] further established power distribution’s critical impact on dynamic pricing and inventory adjustments in dual-channel systems. Duong et al. (2025) [26] investigated the impact of blockchain traceability technology on decision making and profits in food and agricultural supply chains under both supplier-led and retailer-led models, finding that the retailer-led model performed better. The study by Vasileiou et al. (2025) [35] also suggested that the retailer-led model is more conducive to achieving consumer value conversion. Nevertheless, existing research predominantly focuses on conventional performance metrics, such as profits, prices, and recycling rates, while largely neglecting how power structures govern traceability level selection, investment leadership, and transparency mechanism development. This significant knowledge gap necessitates systematic behavioral modeling to elucidate these underexplored relationships.

2.4. Supply Chain Coordination Mechanisms and Contract Design

Non-centralized supply chain structures often suffer from goal misalignment among participants, leading to fragmented decision making, free rider behavior, and insufficient cooperation that ultimately compromises systemic efficiency. Contractual mechanisms serve as essential governance tools to achieve coordination by ensuring equitable profit distribution while incentivizing optimal effort investments toward collective optimization. The implementation of a traceability system requires the joint participation and investment of enterprises across the entire supply chain [36]. Canavari et al. (2010) [37] emphasized that traceability system implementation transcends mere technological investment, representing instead a cross-enterprise collaboration mechanism whose effectiveness hinges on stable contractual arrangements between upstream and downstream entities. Empirical investigations reveal significant structural dependencies in contract performance. Pan et al. (2010) [38] demonstrated substantial profit variations when applying revenue-sharing versus wholesale price contracts under manufacturer-dominated versus retailer-dominated structures. Choi et al. (2013) [39] established the necessity of power-structure-aligned contract designs for effective closed-loop supply chain coordination. Chen et al. (2015) [40] further evidenced how leadership positions determine implementation outcomes in quality cost-sharing contracts between OEMs and contract manufacturers, directly influencing final product quality. Although these studies advance understanding of contract–power structure interactions, their focus remains predominantly confined to inventory, pricing, and quality dimensions. Notably absent is systematic integration of traceability capabilities into coordination frameworks. To date, only Resende-Filho and Hurley (2012) [3] have preliminarily examined downstream incentives for upstream traceability investments. Keskin et al. (2024) [41] proposed that the adoption of traceability technologies such as blockchain, through the design of intelligent coordination contracts, can maximize supply chain profits and achieve a win-win outcome for both suppliers and retailers. However, research on coordination mechanisms for supply chain traceability has not yet formed a systematic analysis, particularly lacking comparative studies on the design of coordination contracts and incentive effects under different power structures.

2.5. Research Gaps and Positioning

The existing literature provides a solid foundation for understanding the conceptual dimensions and influencing factors of supply chain traceability systems yet exhibits persistent limitations in four critical aspects. First, although traceability levels have been refined into multidimensional metrics, there remains insufficient modeling of the behavioral mechanisms through which firms determine optimal traceability levels based on market demand, institutional environments, and resource endowments. Second, prevailing single-entity perspectives overlook the inherent imbalances in investment responsibilities and benefit distributions arising from power asymmetries among supply chain participants. Third, as agricultural traceability systems constitute collaborative investments requiring cross-enterprise coordination, their dominant implementation modes, investment sequencing patterns, and incentive-sharing mechanisms under varying power structures remain unexplored. Fourth, while scholars acknowledge the necessity of aligning contractual designs with power configurations, no study has systematically examined contract formulation logics and performance differentials within traceability level development contexts across different structural arrangements. To address these gaps, in this study, we construct a game-theoretic model of a two-tier agricultural supply chain involving one supplier and one retailer. Operating within contexts where price and consumer traceability preferences jointly influence demand, we comprehensively analyze optimal traceability decisions across three fundamental power structures. Furthermore, we introduce cost-sharing and revenue-sharing contracts to explore coordination mechanisms for enhancing incentive alignment. Our investigation aims at establishing theoretical frameworks for traceability system implementation while providing actionable insights for institutional design in agricultural supply chain governance.

3. Problem Description, Assumption, and Basic Model

In this study, we examine a typical two-tier agricultural supply chain comprising an upstream supplier and a downstream retailer, as depicted in Figure 1. During the sales cycle, the supplier conducts production and processing based on retailer orders and ensures timely product delivery, while the retailer distributes products to end consumers following seasonal market launches. Increasing consumer attention to food safety and origin transparency has elevated market demand for traceable products. Digital traceability systems (e.g., quick response (QR) codes, radio-frequency identification (RFID), blockchain) provide verifiable data on cultivation practices, processing methods, cold-chain storage, and logistics pathways. Consumers ascertain product quality and safety through digital verification, subsequently influencing purchase decisions and willingness to pay traceability premiums. However, establishing traceability systems requires substantial upfront investments spanning data collection hardware, information infrastructure, and operational maintenance. Consequently, critical challenges emerge regarding cost allocation between supply chain partners, investment coordination, and incentive mechanisms for mutual traceability enhancement. Power structures fundamentally determine leadership roles in traceability decisions. In supplier-dominated configurations, suppliers may prioritize upstream information control while retailer compliance with downstream data sharing remains uncertain. Conversely, retailer-dominated structures often involve demands for comprehensive origin and process disclosures to satisfy consumer expectations. These structural disparities influence not only traceability level selection but also profit distribution dynamics and contractual design requirements. To elucidate these mechanisms, in this research, we develop a game-theoretic framework incorporating price effects and consumer traceability preferences. We analyze optimal traceability capabilities, pricing strategies, and ordering decisions under centralized coordination and three decentralized power structures (vertical Nash equilibrium, supplier-led Stackelberg, and retailer-led Stackelberg). Furthermore, we evaluate coordination effectiveness through revenue-sharing and cost-sharing contracts.
Based on this research context, we formalize the model through the following assumptions, symbolic definitions, and foundational game-theoretic framework.
Assumption 1.
 The supplier incurs a unit production cost c . Agricultural products are supplied to the retailer at a per unit wholesale price w ( w > c ) and subsequently sold to consumers at a per unit retail price p   ( p > w ) .
Assumption 2.
Market demand exhibits a negative relationship with retail price. Additionally, empirical evidence confirms consumers’ positive willingness-to-pay for traceable products [15,42,43]. Thus, market demand demonstrates a positive correlation with supply chain traceability level. Incorporating consumer traceability preference within an additive demand function yields
q = a b p + β t
where a represents market base potential, b ( b > 0 ) denotes price sensitivity coefficient, β β > 0 indicates consumer preference coefficient for traceability, and t t > 0 signifies traceability level. The retailer accurately forecasts demand and procures accordingly, while the supplier fulfills all orders.
Assumption 3.
The traceability capability of an agricultural product supply chain is associated with the investment costs of related information technologies. Referring to the service quality cost functions in numerous studies [31,32,33,44], in this paper, we adopt a quadratic function to represent traceability costs [45]:
C t = 1 2 k t 2
where k k > 0 represents the traceability cost coefficient. The traceability cost is a convex function of the traceability level t t > 0 , indicating that, as the traceability level improves, the traceability cost increases. However, excessive pursuit of a high level of traceability is uneconomical.
Assumption 4.
Implementing traceability requires assigning unique traceability codes at the production origin to record critical process data. Thus, the supplier bears primary traceability costs, including fixed investments for system development and maintenance. Retailers incur negligible costs by interfacing with the supplier’s established system. Existing studies have also focused on the investment in blockchain technology—the key technology for product traceability—at the manufacturer or supplier stage. Manufacturers either bear the direct operational costs of blockchain [41] or leverage their market power to require suppliers to join the blockchain system [24]. Then, the retailer compensates the manufacturer’s cost investment by increasing the order volume in the retail channel [41] or covers the additional costs incurred by suppliers due to blockchain traceability through compensation payments [8]. Accordingly, in this study, we examine the case in which the supplier assumes the fixed costs of traceability as the benchmark model and later explore the coordination problem regarding the retailer’s sharing of traceability costs.
Assumption 5.
Both supplier and retailer are risk-neutral, fully rational entities with symmetric cost and demand information.
The profit functions of suppliers and retailers are shown below.
Supplier’s profit
π s = w c q 1 2 k t 2 = w c ( a b p + β t ) 1 2 k t 2
Retailer’s profit
π r = p w q = p w ( a b p + β t )
The model symbols and definitions involved in this study are shown in Table 1 below.

4. The Optimal Pricing Strategies of the Agricultural Supply Chain

4.1. Scenario C

Under centralized decision making, the agricultural supply chain operates as a vertically integrated entity where the supplier and retailer jointly maximize total profit. The supply chain profit function is:
π s c = p c a b p + β t 1 2 k t 2
We calculate the first-order derivatives of p and t for Equation (3), and we get
π s c p = a + b c + t β 2 b p
π s c t = β p c k t
To find the second-order derivatives of p and t, we get the Hessian matrix
2 b β β k
When 2 b k β 2 > 0 holds (i.e., β < 2 b k ), the Hessian matrix is negative definite, and an optimal solution exists. We formally state the Theorem 1 as follows:
Theorem 1.
When β < 2 b k , there exists a unique equilibrium solution given by:
t * = a β β b c 2 b k β 2 ;   p * = a k + b c k β 2 c 2 b k β 2 ;   q * = a b k b 2 c k 2 b k β 2 ;   π s c * = k ( a b c ) 2 2 2 b k β 2

4.2. Scenario N

In a vertical Nash game in a supply chain, suppliers and retailers have equal power and simultaneously choose their own optimal decisions to maximize their own profits. Using Equation (1), we can calculate the first-order partial derivatives of supplier profit π s with respect to wholesale price w and traceability t :
π s w = a + b c b w + β t b p
π s t = β ( w c ) k t
To find the second-order partial derivative of π s with respect to wholesale price w and traceability t , the Hessian matrix is:
2 b β β k
When 2 b k β 2 > 0 holds (i.e., β < 2 b k ), the Hessian matrix is negative definite, and an optimal solution exists. The first-order partial derivative and second-order derivative of the retailer profit π r with respect to the retail price p , are obtained from Formula (2):
π r p = a + b w + β t 2 b p ,   2 π r p 2 = 2 b 0
Based on the first-order conditions, let π s w = 0 , π s t = 0 , and π r p = 0 to obtain the optimal solution. Theorem 2 is as follows.
Theorem 2.
In the vertical Nash game, when β < 3 b k , there exists a unique equilibrium solution:
t N * = a β β b c 3 b k β 2 , w N * = a k + 2 b c k β 2 c 3 b k β 2
p N * = 2 a k + b c k β 2 c 3 b k β 2 , q N * = a b k b 2 c k 3 b k β 2
The profits of supply chain members are:
π s N * = k 2 b k β 2 a b c 2 2 3 b k β 2 2 , π r N * = b k 2 ( a b c ) 2 ( 3 b k β 2 ) 2 ,   π s c N * = k ( 4 b k β 2 ) ( a b c ) 2 2 ( 3 b k β 2 ) 2
Theorem 2 shows that suppliers will implement traceability only when the potential market demand is large enough, that is, a > b c .

4.3. Scenario S

Under the supplier-led scenario, the supplier and the retailer engage in a Stackelberg game. The supplier first determines the wholesale price w and the traceability level t, and the retailer sets the retail price p based on the supplier’s decision. Using Equations (1) and (2), we apply the inverse order solution method to obtain the optimal solution, resulting in the following theorem (Theorem 3).
Theorem 3.
Under the supplier-led scenario, when β < 2 b k , there exists a unique equilibrium solution:
t S * = a β β b c 4 b k β 2 , w S * = 2 k a + b c c β 2 4 b k β 2
p S * = 3 a k + b c k c β 2 4 b k β 2 , q S * = a b k b 2 c k 4 b k β 2
The profits of supply chain members are:
π s S * = k ( a b c ) 2 2 ( 4 b k β 2 ) , π r S * = b k 2 ( a b c ) 2 ( 4 b k β 2 ) 2
π s c S * = k ( 6 b k β 2 ) ( a b c ) 2 2 ( 4 b k β 2 ) 2
Theorem 3 shows that suppliers will implement traceability only when the potential market demand is large enough, that is, a > b c .

4.4. Scenario R

Under the retailer’s dominance, the retailer and the supplier engage in a Stackelberg game. The retailer first determines the retail price p, and then the supplier determines the wholesale price w and traceability t based on the retail price p. Using Equations (1) and (2), we apply the reverse order solution method to obtain the optimal solution, resulting in the following theorem (Theorem 4).
Theorem 4.
Under the retail-led scenario, when β < 2 b k , there exists a unique equilibrium solution:
t R * = a β β b c 4 b k 2 β 2 , w R * = k a + 3 b c 2 c β 2 4 b k 2 β 2
p R * = 3 a b k a β 2 b c β 2 + c k b 2 b ( 4 b k 2 β 2 ) , q R * = a b k b 2 c k 4 b k 2 β 2
The profits of supply chain members are:
π s R * = k ( a b c ) 2 4 ( 4 b k 2 β 2 ) , π r R * = k ( a b c ) 2 2 ( 4 b k 2 β 2 )
π s c R * = 3 k ( a b c ) 2 4 ( 4 b k 2 β 2 )
Theorem 4 shows that suppliers will implement traceability only when the potential market demand is large enough, that is, a > b c .

5. Analysis of Comparative Static

This study compares and analyzes the impact of consumer preferences on supply chain traceability under different power structures, as well as the impact of different power structures on various equilibrium solutions for traceability decision making.

5.1. The Impact of Consumer Preferences on Supply Chain Traceability

Solving the first-order partial derivative of β for the traceability level t N * under the vertical Nash equilibrium, the traceability level t S * under the supplier-led Stackelberg game, and the traceability level t R * under the retailer-led Stackelberg game, we obtain the following proposition (Proposition 1).
Proposition 1.
t N * β > 0 , t S * β > 0 , t R * β > 0
The mathematical proof is provided in Appendix A.
Proposition 1 shows that, regardless of the power structure, supply chain traceability improves as consumer preferences increase. As such, increasing consumer willingness to pay can effectively promote improved product traceability in the supply chain.

5.2. The Impact of Supply Chain Power Structure on the Equilibrium Solution

5.2.1. Comparison Between the Centralized Decision Model and the Game Models Under Three Power Structures

Comparing the equilibrium solutions under centralized decision and vertical Nash game, we obtain the following proposition (Proposition 2).
Proposition 2.
Under the conditions a > b c and β < 2 b k , the equilibrium outcomes satisfy:
1
t * > t N * ; q * > q N * and π s c * > π s c N * universally;
2
p * exhibits parameter-dependent ordering: p * < p N * , when β < b k   ; p * > p N * when b k < β < 2 b k .
The mathematical proof is provided in Appendix A.
Proposition 2 shows that traceability, demand, and supply chain profits are all lower under the vertical Nash game than under centralized decision making. When consumer preferences are low ( β < b k ), retail prices under centralized decision making are lower than those under the vertical Nash game. When consumer preferences are high ( b k < β < 2 b k ), retail prices under the vertical Nash game are even lower.
Comparing the equilibrium solutions under centralized model and the supplier-led Stackelberg games, we obtain the following proposition (Proposition 3).
Proposition 3.
t * > t S * ; q * > q S * ; π s c * > π s c S * ; when β < b k   ,   p * < p S * ; and when b k < β < 2 b k , p * > p S * .
Comparing the equilibrium solutions under centralized model and the retailer-led Stackelberg games, we obtain the following proposition (Proposition 4).
Proposition 4.
t * > t R * ; q * > q R * ; π s c * > π s c R * ; when β < b k   , p * < p N * ; and when b k < β < 2 b k , p * > p N * .
The mathematical proof is provided in Appendix A.
Propositions 2–4 show that, under the centralized model, traceability level, market demand, and supply chain profits are all higher than under the decentralized model. When consumer preference for traceability is low, retail prices under the centralized decision model are also lower than those under the decentralized decision model. When consumer preference exceeds a certain threshold, retail prices under the centralized decision model are higher than those under the decentralized model. Therefore, contractual coordination is necessary to incentivize both parties to improve supply chain traceability.

5.2.2. Comparison Among the Game Models Under Three Power Structures

In this section, we compare the equilibrium solutions of the three models in the common interval ( β < b k ).
(a)
Comparing the traceability level t under different power structures, we get the following proposition (Proposition 5).
Proposition 5.
When β < b k , t S * < t R * < t N * ; when b k < β < 2 b k , t S * < t N * < t R * .
The mathematical proof is provided in Appendix A.
Proposition 5 shows that the traceability under supplier dominance is the smallest because suppliers bear all traceability costs. Therefore, supplier-led supply chains are the least conducive to the realization of product traceability. When consumer preference is low ( β < b k ), product traceability under vertical Nash game decision making is the largest. When consumer preference reaches a certain threshold ( b k < β < 2 b k ), the traceability of retailer-led supply chains is the highest.
(b)
Comparing the wholesale price w under different power structures, we get the following proposition (Proposition 6).
Proposition 6.
When β < b k , w R * < w N * < w S * ; when b k < β < 2 b k 3 , w N * < w R * < w S * ; and when 2 b k 3 < β < 2 b k , w N * < w S * < w R * .
The mathematical proof is provided in Appendix A.
Proposition 6 shows that the wholesale price under the vertical Nash game is always lower than the wholesale price under supplier dominance. When consumer preferences are small ( β < b k ), the wholesale price under supplier dominance is the highest because suppliers compensate for the additional costs of investing in a traceability system by raising wholesale prices. At this time, the wholesale price under retailer dominance is the lowest, and the wholesale price under the vertical Nash game is moderate. When consumer preference is large ( 2 b k 3 < β < 2 b k ), suppliers will lower wholesale prices because increased consumer preference will lead to an increase in demand, and the resulting increase in profits will offset the reduction in supplier profits caused by tracing costs.
(c)
Comparing the retail price p under different power structures, we can obtain the following proposition (Proposition 7).
Proposition 7.
When β < b k , p N * < p R * < p S * ; when b k < β < 2 b k , p S * < p N * < p R * .
The mathematical proof is provided in Appendix A.
Proposition 7 shows that the retail price under retailer dominance is always higher than the retail price under vertical Nash decision. When consumer preference is small ( β < b k ), the retail price under supplier dominance is the highest, the retail price under vertical Nash equilibrium is the lowest, and the retail price under retailer dominance is moderate. When consumer preference is large ( b k < β < 2 b k ), the retail price under the retailer’s dominance is the highest, because the retailer is closest to the consumer market and has the consumer preference information. The demand brought by the increase in consumer preference can make up for the reduced demand due to the increase in retail price. At this time, the retail price under the supplier’s dominance is the lowest.
(d)
Comparing the demand q under different power structures, the following proposition (Proposition 8) is obtained.
Proposition 8.
When β < b k , q S * < q R * < q N * ; when b k < β < 2 b k , q S * < q N * < q R * .
The mathematical proof is provided in Appendix A.
Proposition 8 shows that the market demand under the supplier’s dominance is the smallest. When consumer preference is small ( β < b k ), the market demand under the vertical Nash equilibrium is the largest. When consumer preference reaches a certain threshold ( b k < β < 2 b k ), the market demand under the retailer’s dominance is the largest.
(e)
Comparing the supplier profit π s under different power structures, we obtain the following proposition (Proposition 9).
Proposition 9.
When β < b k , π s R * < π s N * < π s S * ; when b k < β < 2 b k 3 , π s N * < π s R * < π s S * ; when 2 b k 3 < β < 2 b k , π s N * < π s S * < π s R * .
The mathematical proof is provided in Appendix A.
Proposition 9 shows that the supplier profit under supplier dominance is always greater than the supplier profit under vertical Nash equilibrium, which is consistent with intuition. When consumer preferences are small ( β < b k ), the supplier profit under retailer dominance is the smallest, and the supplier profit under supplier dominance is the largest. When consumer preference reaches a certain threshold ( 2 b k 3 < β < 2 b k ), the supplier profit under retailer dominance is the highest, which means that higher consumer preference not only benefits retailers but also suppliers.
(f)
Comparing the retailer profit π r under different power structures, we get the following proposition (Proposition 10).
Proposition 10.
π r S * < π r N * < π r R * .
The mathematical proof is provided in Appendix A.
Proposition 10 shows that, under the equilibrium solution, the retailer profit is the smallest under supplier dominance and the largest under retailer dominance, and it does not change with changes in consumer preference.
(g)
Comparing the supply chain profit π s c under different power structures, we get the following proposition (Proposition 11).
Proposition 11.
When β < b k , π s c S * < π s c R * < π s c N * ; when b k < β < 2 b k , π s c S * < π s c N * < π s c R * .
The mathematical proof is provided in Appendix A.
Proposition 11 shows that supply chain profits are minimized under supplier dominance. When consumer preferences are small ( β < b k ), supply chain profits are maximized under the vertical Nash game. When consumer preferences reach a certain threshold ( b k < β < 2 b k ), supply chain profits are maximized under retailer dominance.
Collectively, these findings demonstrate distinct outcomes across power structures (as shown in Table 2). Under vertical Nash equilibrium, the wholesale price consistently remains lower than in supplier-led scenarios, while the retail price is invariably lower than under retailer dominance. Supplier profits are smaller compared to supplier-led structures, and retailer profits exhibit moderate levels. When consumer traceability preference is low, traceability level reaches its maximum, wholesale price remains moderate, retail price minimizes, market demand maximizes, supplier profits stabilize moderately, and supply chain profits peak. Once traceability preference exceeds a threshold, traceability level moderates, wholesale price minimizes, retail price normalizes moderately, market demand stabilizes moderately, and both supplier and supply chain profits normalize moderately. In supplier-led structures, traceability level is consistently minimized, market demand is smallest, supplier profits exceed vertical Nash levels, retailer profits are minimized, and supply chain profits are lowest. With low traceability preference, wholesale and retail prices peak while supplier profits maximize. With high preference, wholesale price normalizes moderately, retail price minimizes, and supplier profits stabilize moderately. Under retailer dominance, retail prices consistently exceed vertical Nash levels. When traceability preference is low, traceability level normalizes moderately, wholesale price minimizes, retail price stabilizes moderately, market demand normalizes moderately, supplier profits are minimized, and supply chain profits moderate. Beyond preference thresholds, traceability level maximizes, wholesale and retail prices peak, market demand maximizes, retailer and supply chain profits maximize, while supplier profits (though not maximal) exceed vertical Nash levels and eventually peak with further preference increases. These findings highlight significant variations in traceability capabilities and profit distributions across power structures, warranting further investigation into coordination mechanisms for enhancing traceability investments.

6. Analysis of Supply Chain Coordination

6.1. Coordination Through Cost-Sharing Contracts

6.1.1. Scenario N

Suppliers and retailers make independent decisions, with external third-party oversight or government regulatory bodies ensuring that suppliers and retailers each bear a certain set of traceability costs. Suppliers then determine wholesale prices and traceability level, while retailers determine retail prices.
Suppliers bear a portion of the traceability costs λ 0 λ 1 , while retailers share a proportion of 1 λ in the traceability system construction costs. For example, platforms like Tmall Fresh invest in traceability equipment for some contracted farmers, and as a retailer, Tmall Fresh bears a portion of the suppliers’ traceability costs.
The supplier’s profit function is:
π s = w c q c q δ 1 2 λ k t 2
The retailer’s profit function is:
π r = p w q 1 2 ( 1 λ ) k t 2
From Equation (4), we can calculate the first-order and second-order partial derivatives of the supplier’s profit π s with respect to the wholesale price w and the traceability t , respectively, and obtain the Hessian matrix:
2 b β β λ k
When 2 b k λ β 2 > 0 , that is, when β < 2 b k λ , the Hessian matrix is negative definite, and an optimal solution exists. Based on the first-order condition, the optimal solution is obtained, and Theorem 5 is as follows.
Theorem 5.
When β < 2 b k λ , there exists a unique equilibrium solution:
t N C * = a β β b c 3 b k λ β 2 ;   w N C * = a k λ + 2 b c k λ β 2 c 3 b k λ β 2 ;
p N C * = 2 a k λ + b c k λ β 2 c 3 b k λ β 2 ;   q N C * = a b k λ b 2 c k λ 3 b k λ β 2
The profits of supply chain members are:
π s N C * = k λ ( 2 b k λ β 2 ) ( a b c ) 2 2 ( 3 b k λ β 2 ) 2 , π r N C * = b k 2 λ 2 ( a b c ) 2 ( 3 b k λ β 2 ) 2
π s c N C * = k λ ( 4 b k λ β 2 ) ( a b c ) 2 2 ( 3 b k λ β 2 ) 2
Compared with the Nash equilibrium result when there is no contract, we get the following proposition (Proposition 12).
Proposition 12.
When β 2 3 b k < λ < 1 , t N C * > t N * , the cost-sharing contract can motivate suppliers to improve product traceability.
The mathematical proof is provided in Appendix A.
Proposition 12 shows that, as long as retailers share some of the traceability costs, suppliers will improve their traceability levels.
According to supply chain coordination theory, when a supply chain reaches a coordinated state, the optimal decision is equal to the centralized decision. Comparing traceability under the vertical Nash game with traceability under centralized decision making yields the following proposition (Proposition 13).
Proposition 13.
When 2 3 b k β < 2 b k , product supply chain traceability can reach the same level as under centralized decision making, and supply chain profits are higher than when there is no contract. Therefore, in terms of optimizing food supply chain traceability, a cost-sharing contract can achieve supply chain coordination, and the optimal cost-sharing ratio is λ = 2/3.
The mathematical proof is provided in Appendix A.
Further, comparing the profits of suppliers and retailers with those under no contract yields the following proposition (Proposition 14).
Proposition 14.
Since both suppliers and retailers have higher profits than when there is no contract, a cost-sharing contract under the vertical Nash game can effectively incentivize suppliers and retailers to improve product traceability.
The mathematical proof is provided in Appendix A.
Propositions 12–14 indicate that cost-sharing contracts under the vertical Nash game can effectively motivate suppliers to improve product traceability. When consumer preferences reach a certain threshold, cost-sharing contracts can achieve supply chain coordination in optimizing food supply chain traceability.

6.1.2. Scenario S

Let us consider the case where retailers share traceability costs in supplier-led supply chains; in this model, the decision-making sequence is as follows. The supplier and retailer negotiate and sign a contract, with the supplier bearing a proportion λ of the traceability costs and the retailer sharing a proportion 1 λ of the traceability costs. The supplier then determines the traceability level t and the wholesale price w , and the retailer determines the retail price p based on the supplier’s decision. The profit functions of the supplier and retailer are the same as Equations (4) and (5). Applying the reverse order solution, we obtain the following theorem (Theorem 6).
Theorem 6.
When β < 2 b k λ , there exists a unique equilibrium solution:
t S C * = a β β b c 4 b k λ β 2 ;   w S C * = 2 a k λ + 2 b c k λ β 2 c 4 b k λ β 2
p S C * = 3 a k λ + b c k λ c β 2 4 b k λ β 2 ,   q S C * = a b k λ b 2 c k λ 4 b k λ β 2
The profits of the supply chain members are:
π s S C * = k λ ( a b c ) 2 2 ( 4 b k λ β 2 ) , π r S C * = a b c 2 ( 2 b k λ 2 k 1 λ β 2 ) 2 ( 4 b k λ β 2 ) 2
π s c S C * = k λ ( a b c ) 2 2 ( 4 b k λ β 2 ) + a b c 2 ( 2 b k λ 2 k 1 λ β 2 ) 2 ( 4 b k λ β 2 ) 2
According to supply chain coordination theory, comparing traceability under a cost-sharing contract with that under centralized decision making, we obtain the following proposition (Proposition 15).
Proposition 15.
Under supplier-led conditions, when traceability reaches the level of traceability under centralized decision making, supply chain profits are lower than those under centralized decision making. As such, a supplier-led cost-sharing contract cannot achieve supply chain coordination.
The mathematical proof is provided in Appendix A.
Comparing traceability under a cost-sharing contract with that under no contract, we obtain the following proposition (Proposition 16).
Proposition 16.
When β 2 4 b k < λ < 1 , a cost-sharing contract can incentivize suppliers to improve product traceability.
The mathematical proof is provided in Appendix A.
Further analysis considers the retailer’s incentive compatibility constraints while ensuring optimal retailer profits.
Taking the first-order derivative of λ with respect to π r S C * yields
π r S C * λ = 2 b λ k 2 + k β 2 2 a b c 2 4 b k λ β 2 2 + b k 8 b k 2 λ 2 + 4 k 1 λ β 2 a b c 2 4 b k λ β 2 3
Taking the second-order derivative of π r S C * with respect to λ , we obtain:
2 π r S C * λ 2 = b 2 k 2 96 b k 2 λ 2 48 k 1 λ β 2 a b c 2 4 b k λ β 2 4 b k 32 b λ k 2 + 8 k β 2 a b c 2 4 b k λ β 2 3                             + 2 b k 2 a b c 2 4 b k λ β 2 2
Because 2 π r S C * λ 2 < 0 , π r S C * is a strictly concave function of λ . From the first-order condition, we obtain
λ * = 8 b k β 2 8 b k
Substituting λ * = 8 b k β 2 8 b k into the equilibrium solutions of Theorem 6, we obtain the following theorem (Theorem 7).
Theorem 7.
Considering the incentive compatibility constraints of retailers, while ensuring the optimal profit of retailers, the optimal cost sharing ratio is λ * = 8 b k β 2 8 b k . The equilibrium solutions of each term are:
t S C * * = 2 a b c β 8 b k 3 β 2
w S C * * = 8 b k a + b c β 2 a + 5 b c 2 b 8 b k 3 β 2
p S C * * = 8 b k a + b c 3 β 2 a + 3 b c 4 b 8 b k 3 β 2
π s S C * * = 8 b k β 2 a b c 2 8 b 8 b k 3 β 2
π r S C * * = 8 b k + β 2 a b c 2 16 b 8 b k 3 β 2
Finding the first-order partial derivative of the optimal cost-sharing ratio λ * with respect to the traceability cost coefficient k and the consumer traceability preference β yields λ * k = β 2 8 b k 2 > 0 , λ * β = β 4 b k < 0 , yielding the following proposition (Proposition 17).
Proposition 17.
The proportion of traceability costs that suppliers must share is a decreasing function of the traceability cost coefficient and an increasing function of the consumer traceability preference.
Proposition 17 shows that, when the traceability cost coefficient is large, the proportion of traceability costs that suppliers must share is large, and, in this case, the proportion of traceability costs that retailers are willing to share is small. When the consumer traceability preference increases, the proportion of traceability costs that retailers are willing to share increases.
Comparing the traceability level, wholesale price, and retail price in the absence of a contract, we obtain the following proposition (Proposition 18).
Proposition 18.
Incentive-compatible cost-sharing contracts can improve supply chain traceability while simultaneously increasing wholesale and retail prices.
The mathematical proof is provided in Appendix A.
Proposition 18 shows that a cost-sharing contract improves supply chain traceability compared to a no-contract decision while simultaneously increasing wholesale and retail prices. This increases the cost of traceable products for consumers.
Comparing this to the supplier and retailer profits in the absence of a contract, we obtain the following proposition (Proposition 19).
Proposition 19.
Both supplier and retailer profits are higher than in the absence of a contract, so both suppliers and retailers will accept this contract.
The mathematical proof is provided in Appendix A.
Proposition 19 shows that incentive-compatible cost-sharing contracts can coordinate incentives for supply chain members to improve product traceability.
The above propositions demonstrate that, because retailers share some traceability costs, they can incentivize suppliers to improve product traceability without raising wholesale prices. Although this increases both wholesale and retail prices, the improved traceability increases consumer demand, eliminating the double marginalization effect and thus improving profits for both retailers and suppliers. Because retailers are close to consumers in the market, their willingness to share traceability costs increases when they perceive a strong consumer preference for traceability, which is consistent with actual retailer decision-making behavior. For example, Xiamen Green Lily, a supplier of fresh produce to numerous downstream retailers, has established a traceability information system and actively promoted data sharing with downstream retailers to enable product tracking and tracing. Initially, Green Lily covered all traceability costs and provided free traceability scales and other equipment to downstream retailers to facilitate data sharing. As supply chain partnerships develop and consumer preference for traceability grows, some downstream retailers are actively leasing or purchasing related equipment to achieve product traceability.

6.1.3. Scenario R

In a retailer-led food supply chain, given that suppliers invest in and build traceability information systems, let us consider the scenario where retailers share some of the traceability costs. In this model, the decision-making sequence is for suppliers and retailers to negotiate the cost-sharing ratio (maximizing retailer profits). The retailer first determines the retail price p , and the supplier then decides on the traceability level t and wholesale price w .
The profit functions of suppliers and retailers are the same as in Equations (4) and (5). By reversing the solution, we obtain the following theorem (Theorem 8).
Theorem 8.
When β < 2 b k λ , there exists a unique equilibrium solution:
t R C * = β λ a b c 4 b k λ 2 3 β 2 λ + β 2 , w R C * = k λ 2 a b c 4 b k λ 2 3 β 2 λ + β 2 + c
p R C * = 3 a b k λ 2 2 a β 2 λ b c β 2 λ + c k b 2 λ 2 + a β 2 b 4 b k λ 2 3 β 2 λ + β 2 ,
q R * = b k λ 2 a b c 4 b k λ 2 3 β 2 λ + β 2
The profits of the supply chain members are:
π s R C * = ( 2 b k 2 λ 4 k β 2 λ 3 ) a b c 2 2 ( 4 b k λ 2 3 β 2 λ + β 2 ) 2 ,
π r R C * = k λ 2 a b c 2 2 ( 4 b k λ 2 3 β 2 λ + β 2 )
π s c R C * = a b c 2 k λ 2 ( 6 b k λ 2 4 β 2 λ + β 2 ) 2 ( 4 b k λ 2 3 β 2 λ + β 2 ) 2
Compared with the equilibrium solution under centralized decision making, we obtain the following proposition (Proposition 20).
Proposition 20.
In the retailer-led Stackelberg game, when the supply chain traceability equals the centralized decision making, the supply chain profit cannot equal the centralized decision making. As such, the cost-sharing contract cannot achieve supply chain coordination.
Considering incentive compatibility, we determine the optimal cost-sharing ratio while ensuring optimal retailer profits. Taking the first-order derivative of λ with respect to π r R C * yields:
π r R C * λ = k λ 2 6 β 2 16 b k λ a b c 2 8 b k λ 2 + 2 β 2 6 λ β 2 2 + k λ a b c 2 4 b k λ 2 + β 2 3 λ β 2
Taking the second-order derivative of λ with respect to π r R C * yields:
2 π r R C * λ 2 = k λ 2 6 β 2 16 b k λ 12 β 2 32 b k λ a b c 2 8 b k λ 2 + 2 β 2 6 λ β 2 3 + k λ 3 β 2 8 b k λ a b c 2 4 b k λ 2 + β 2 3 λ β 2 2                             + k λ 12 β 2 32 b k λ a b c 2 8 b k λ 2 + 2 β 2 6 λ β 2 2 + k a b c 2 4 b k λ 2 + β 2 3 λ β 2                             16 b k 2 λ 2 a b c 2 8 b k λ 2 + 2 β 2 6 λ β 2 2
Since 2 π r R C * λ 2 > 0 , π r R C * is a strictly concave function of λ . From the first-order conditions, we get
λ * = 2 3
Substituting λ * = 2 3 , we get
π r R C * * = 2 k a b c 2 16 b k 9 β 2
π s R C * * = 4 k 4 b k 3 β 2 a b c 2 16 b k 9 β 2 2
π r R C * * π r R * = 2 k a b c 2 16 b k 9 β 2 k a b c 2 2 4 b k 2 β 2 = β 2 k a b c 2 2 16 b k 9 β 2 4 b k 2 β 2
When β 2 < 16 9 , π r R C * * > π r R * .
π s R C * * π s R * = 4 k 4 b k 3 β 2 a b c 2 16 b k 9 β 2 2 k a b c 2 4 4 b k 2 β 2 = β 2 15 β 2 32 b k 4 16 b k 9 β 2 2 4 b k 2 β 2
When β < 4 3 , π s R C * * < π s R * .
Thus, Pareto improvements cannot be achieved simultaneously for both the retailer and the supplier. The following proposition (Proposition 21) is obtained.
Proposition 21.
Under the Stackelberg game dominated by the retailer, a cost-sharing contract cannot achieve a Pareto improvement in the profits of both parties.
Combining Propositions 20 and 21, we conclude that retailer-led cost-sharing contracts cannot achieve supply chain coordination or simultaneously achieve Pareto improvements in supplier and retailer profits. Therefore, retailer-led cost-sharing contracts fail to provide incentives. This is because, after retailers share traceability costs, they transfer the increased costs to retail prices. Higher retail prices do not directly incentivize suppliers to improve traceability capabilities but instead lead to reduced consumer demand, ultimately reducing supply chain profits.

6.2. Coordination Through Revenue-Sharing Contracts

Let us consider the coordination of revenue-sharing contracts under a Stackelberg game dominated by retailers. Since consumers prefer traceable products, retailers’ revenue increases, and retailers share a portion ( 1 θ ) of their revenue with suppliers. The retailer first decides on the retail price p and the revenue retention ratio θ , while the manufacturer decides on the wholesale price w and the traceability level t .
The supplier’s profit function is:
π s = w + ( 1 θ ) p c a b p + β t 1 2 k t 2
The retailer’s profit function is:
π r = θ p w a b p + β t
By applying the inverse solution method from Equations (6) and (7), we obtain the following theorem (Theorem 9).
Theorem 9.
When 2 b k 2 θ β 2 > 0 , there is a unique equilibrium solution:
t R R * = β ( a b c ) ( 2 θ ) 6 b k 4 β 2 2 b k θ + 2 β 2 θ
w R R * = 2 a β 2 + 6 a b k θ 3 a β 2 θ 3 a b k 3 β 2 b c θ 3 b 2 c k + 2 β 2 b c + a β 2 θ 2 2 a b k θ 2 + β 2 b c θ 2 + 2 b 2 c k θ 2 b β 2 θ + 6 b 2 k 4 b β 2 2 b 2 k θ + c
p R R * = a β 2 θ + 5 a b k 2 a β 2 2 a b k θ + β 2 b c θ + b 2 c k 2 β 2 b c 6 b 2 k 4 b β 2 2 b 2 k θ + 2 b β 2 θ
q R R * = ( a b c ) b k 2 β 2 θ + 6 b k 4 β 2 2 b k θ
π s R R * = k 4 b k 2 b k θ 4 β 2 β 2 θ 2 + 4 β 2 θ ( a b c ) 2 2 2 β 2 θ + 6 b k 4 β 2 2 b k θ 2
π r R R * = k ( a b c ) 2 4 β 2 θ + 3 b k 2 β 2 b k θ
To find the first-order derivative of traceability t R R * with respect to revenue sharing ratio θ , and we obtain the following proposition (Proposition 22).
Proposition 22.
t R R * is a decreasing function of θ . As θ increases, t R R * decreases. That is, the smaller the retailer’s profit retention ratio, the greater the supply chain traceability.
The mathematical proof is provided in Appendix A.
Proposition 22 shows that, as the retailer’s profit retention ratio increases, traceability decreases. The greater the profit ratio the retailer shares with the supplier, the greater the traceability. In other words, a retailer-shared profit contract can improve product traceability.
Based on supply chain coordination theory, comparing decision making under a profit-sharing contract with centralized decision making, we obtain the following proposition (Proposition 23).
Proposition 23.
A profit-sharing contract dominated by a retailer cannot achieve supply chain coordination.
The mathematical proof is provided in Appendix A.
Considering the impact of the profit-sharing ratio θ on the retailer’s profit, we obtain the following proposition (Proposition 24).
Proposition 24.
When b k < β < 2 b k , the retailer has an incentive to share profits; otherwise, it will not.
The mathematical proof is provided in Appendix A.
Proposition 24 indicates that, when consumer preference for traceability is low, retailers have no incentive to share revenue with suppliers. This means that voluntary traceability systems are not yet feasible, and government subsidies are necessary to improve product traceability. When consumer preference for traceability is high, retailers have an incentive to share revenue with suppliers because they can profit from this consumer preference. Therefore, retailers should actively promote product traceability to increase consumer preference for traceability. For example, Tmall Fresh collaborates with upstream suppliers who provide complete product traceability information and bear all traceability costs. Based on its perception of consumer traceability preferences and its prediction of willingness to pay, Tmall Fresh sets retail prices above the general market price based on a premium and promises to share a portion of the revenue with its suppliers. This shared revenue can increase the suppliers’ profits and directly incentivize them to improve product traceability. Improved traceability increases consumer demand, thereby boosting retailers’ profits.

7. Numerical Analysis

7.1. Effects of Consumer Traceability Preference β

on Supply Chain Traceability Performance
This section analyzes the impact of consumer preference coefficient β on food supply chain traceability decisions and profits under three supply chain structures, as well as their influence on the cost-sharing ratio under supplier-led scenario. Under the condition that satisfies the aforementioned equilibrium solution condition ( β < 2 b k ), the model parameters are set as follows: a = 100 , b = 3 , c = 1 ,   k = 2 , β ( 0 , 3.5 ) .
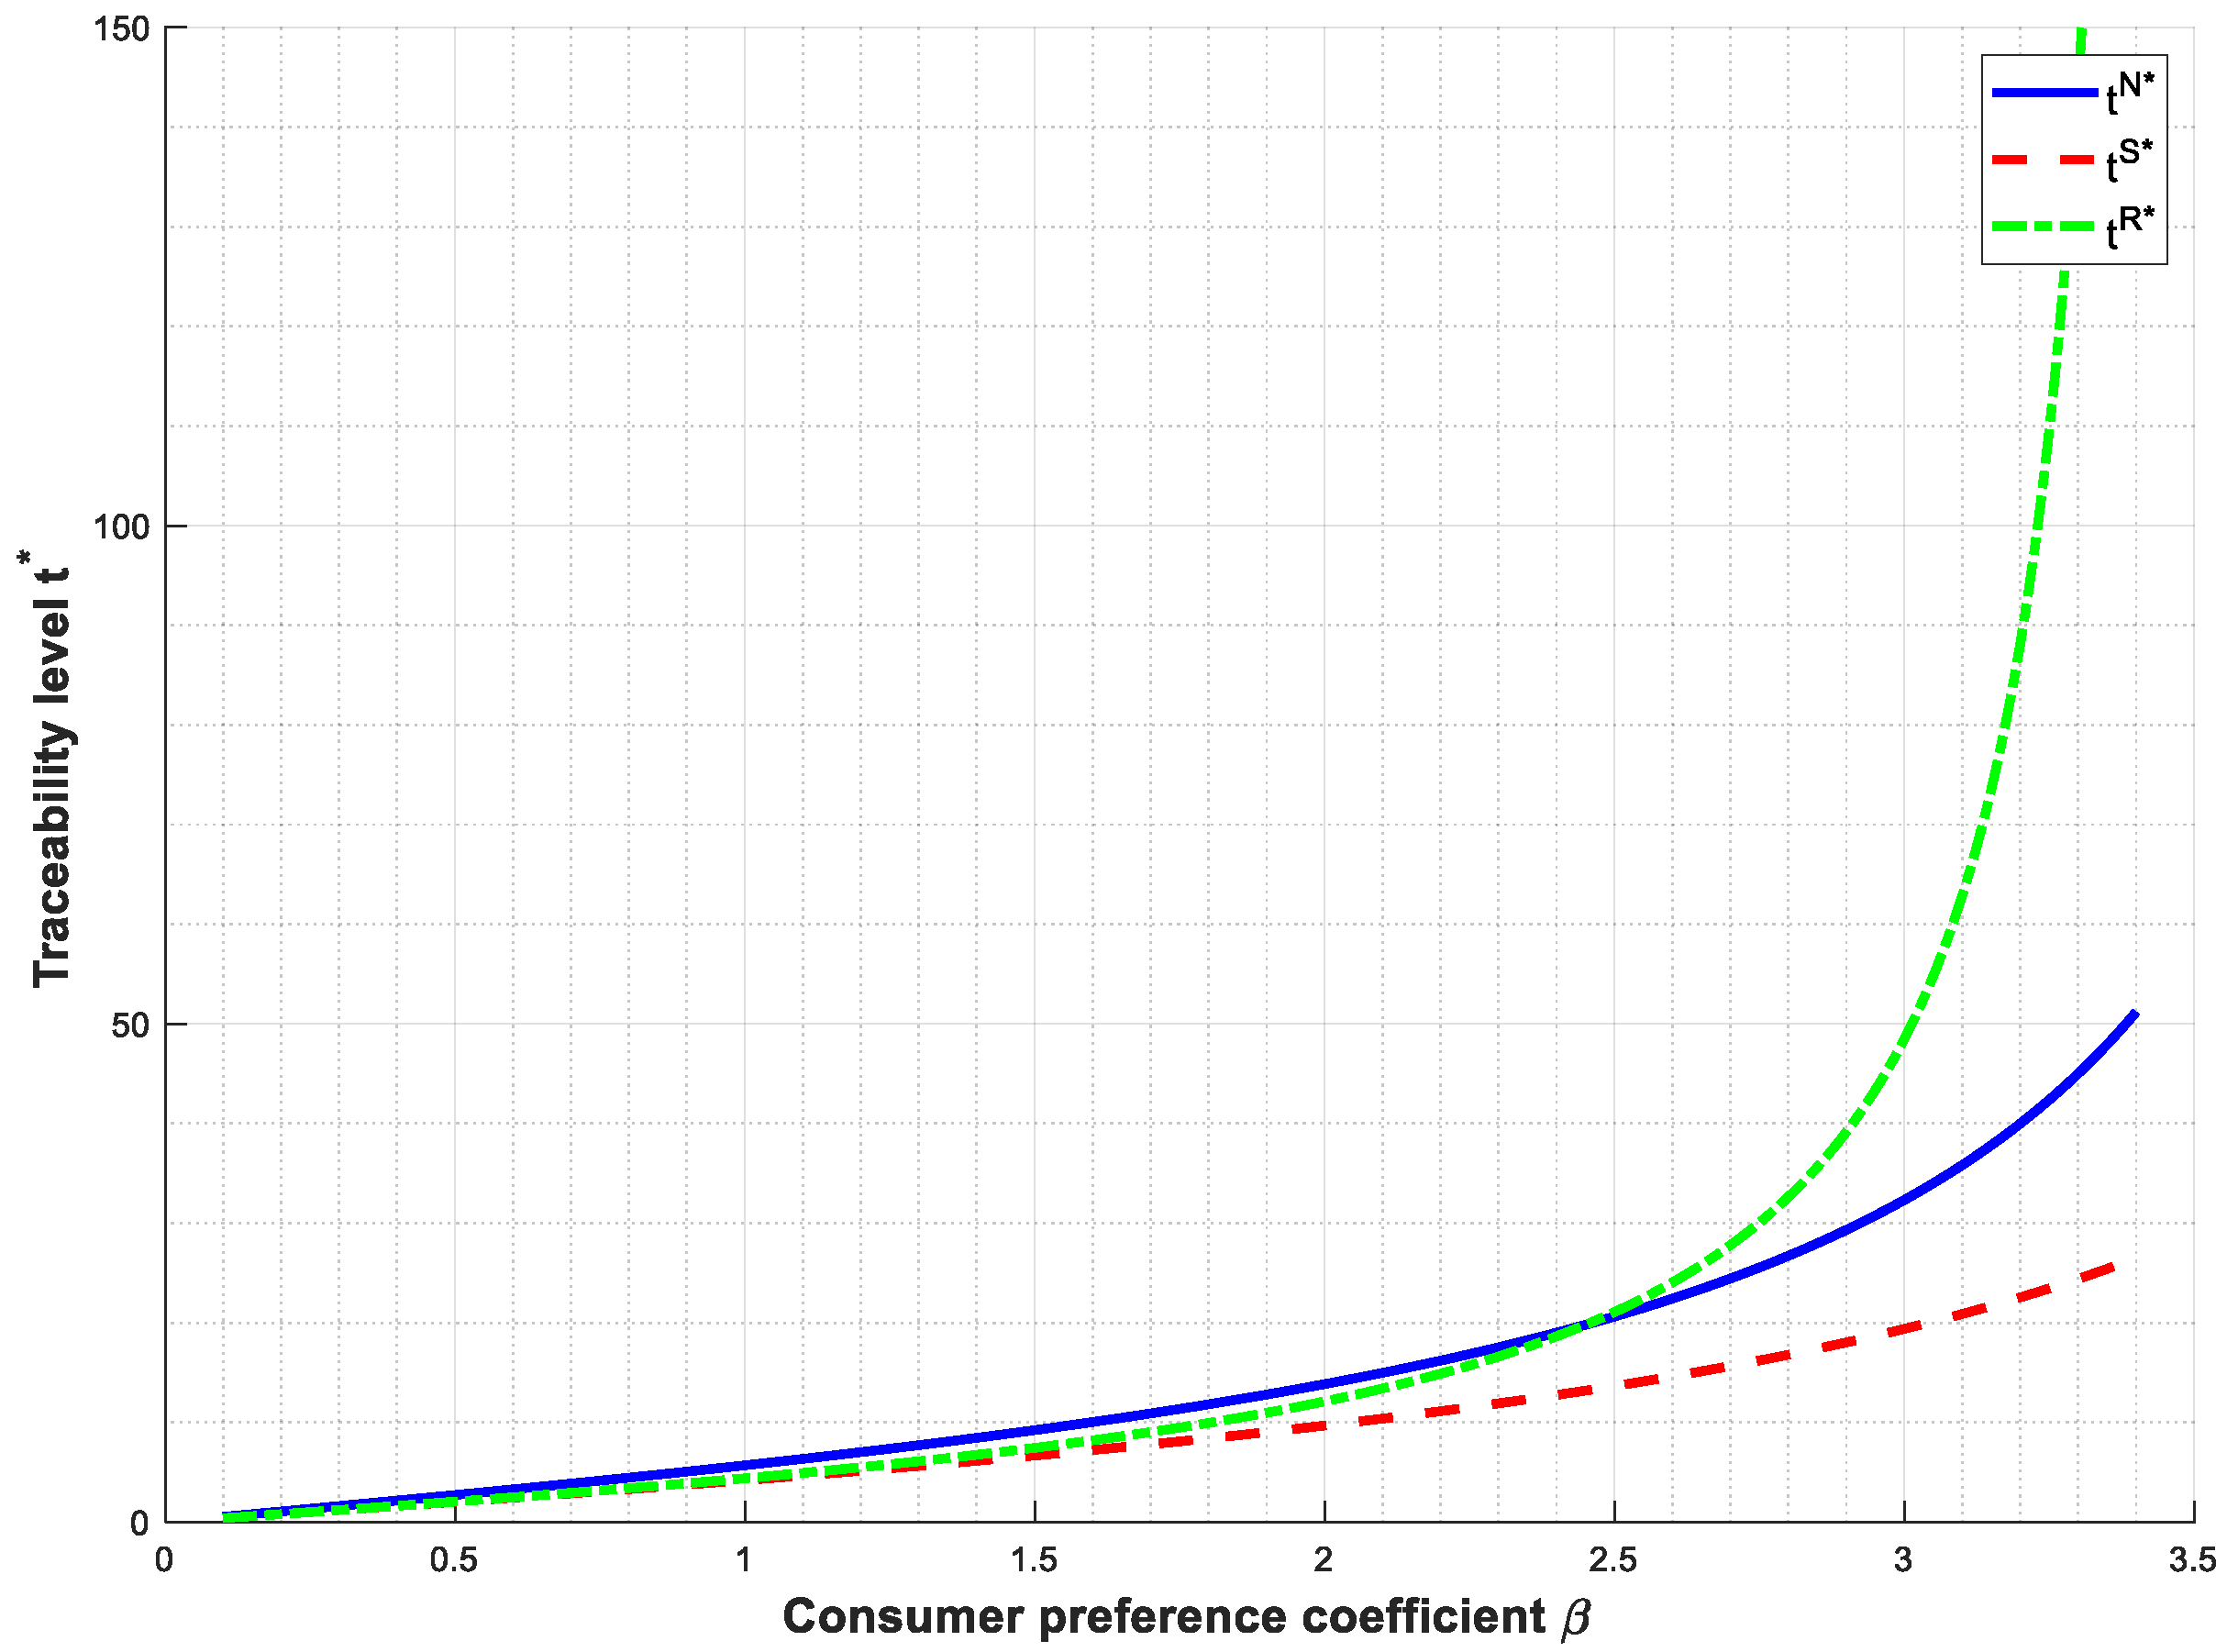
Figure 2 shows that the consumer traceability preference coefficient β has a significant positive impact on the supply chain traceability capability level t * . As β increases, the traceability capability under all three power structures demonstrates exponential growth, indicating that consumer preference is a key market force driving the construction of traceability systems. Furthermore, the intensity of β s impact varies significantly across different power structures. In the Nash power structure, where power is balanced, both parties can benefit from the increase in consumer preference, resulting in the strongest impact intensity. Under the supplier-led supply chains, the impact intensity is moderate, while it is the weakest under the supplier-led supply chains.
As shown in Figure 3, the impact of consumer traceability preference β on supplier profit exhibits significant differences under the three power structures. In the retailer-led supply chain, supplier profit increases at the fastest rate as β grows. Under the supplier- led supply chain, the profit growth is slow. Conversely, in the Nash power structure, the profit does not increase but instead declines. This indicates that an excessively high consumer preference may lead to a demand mismatch, resulting in a decrease in profit.
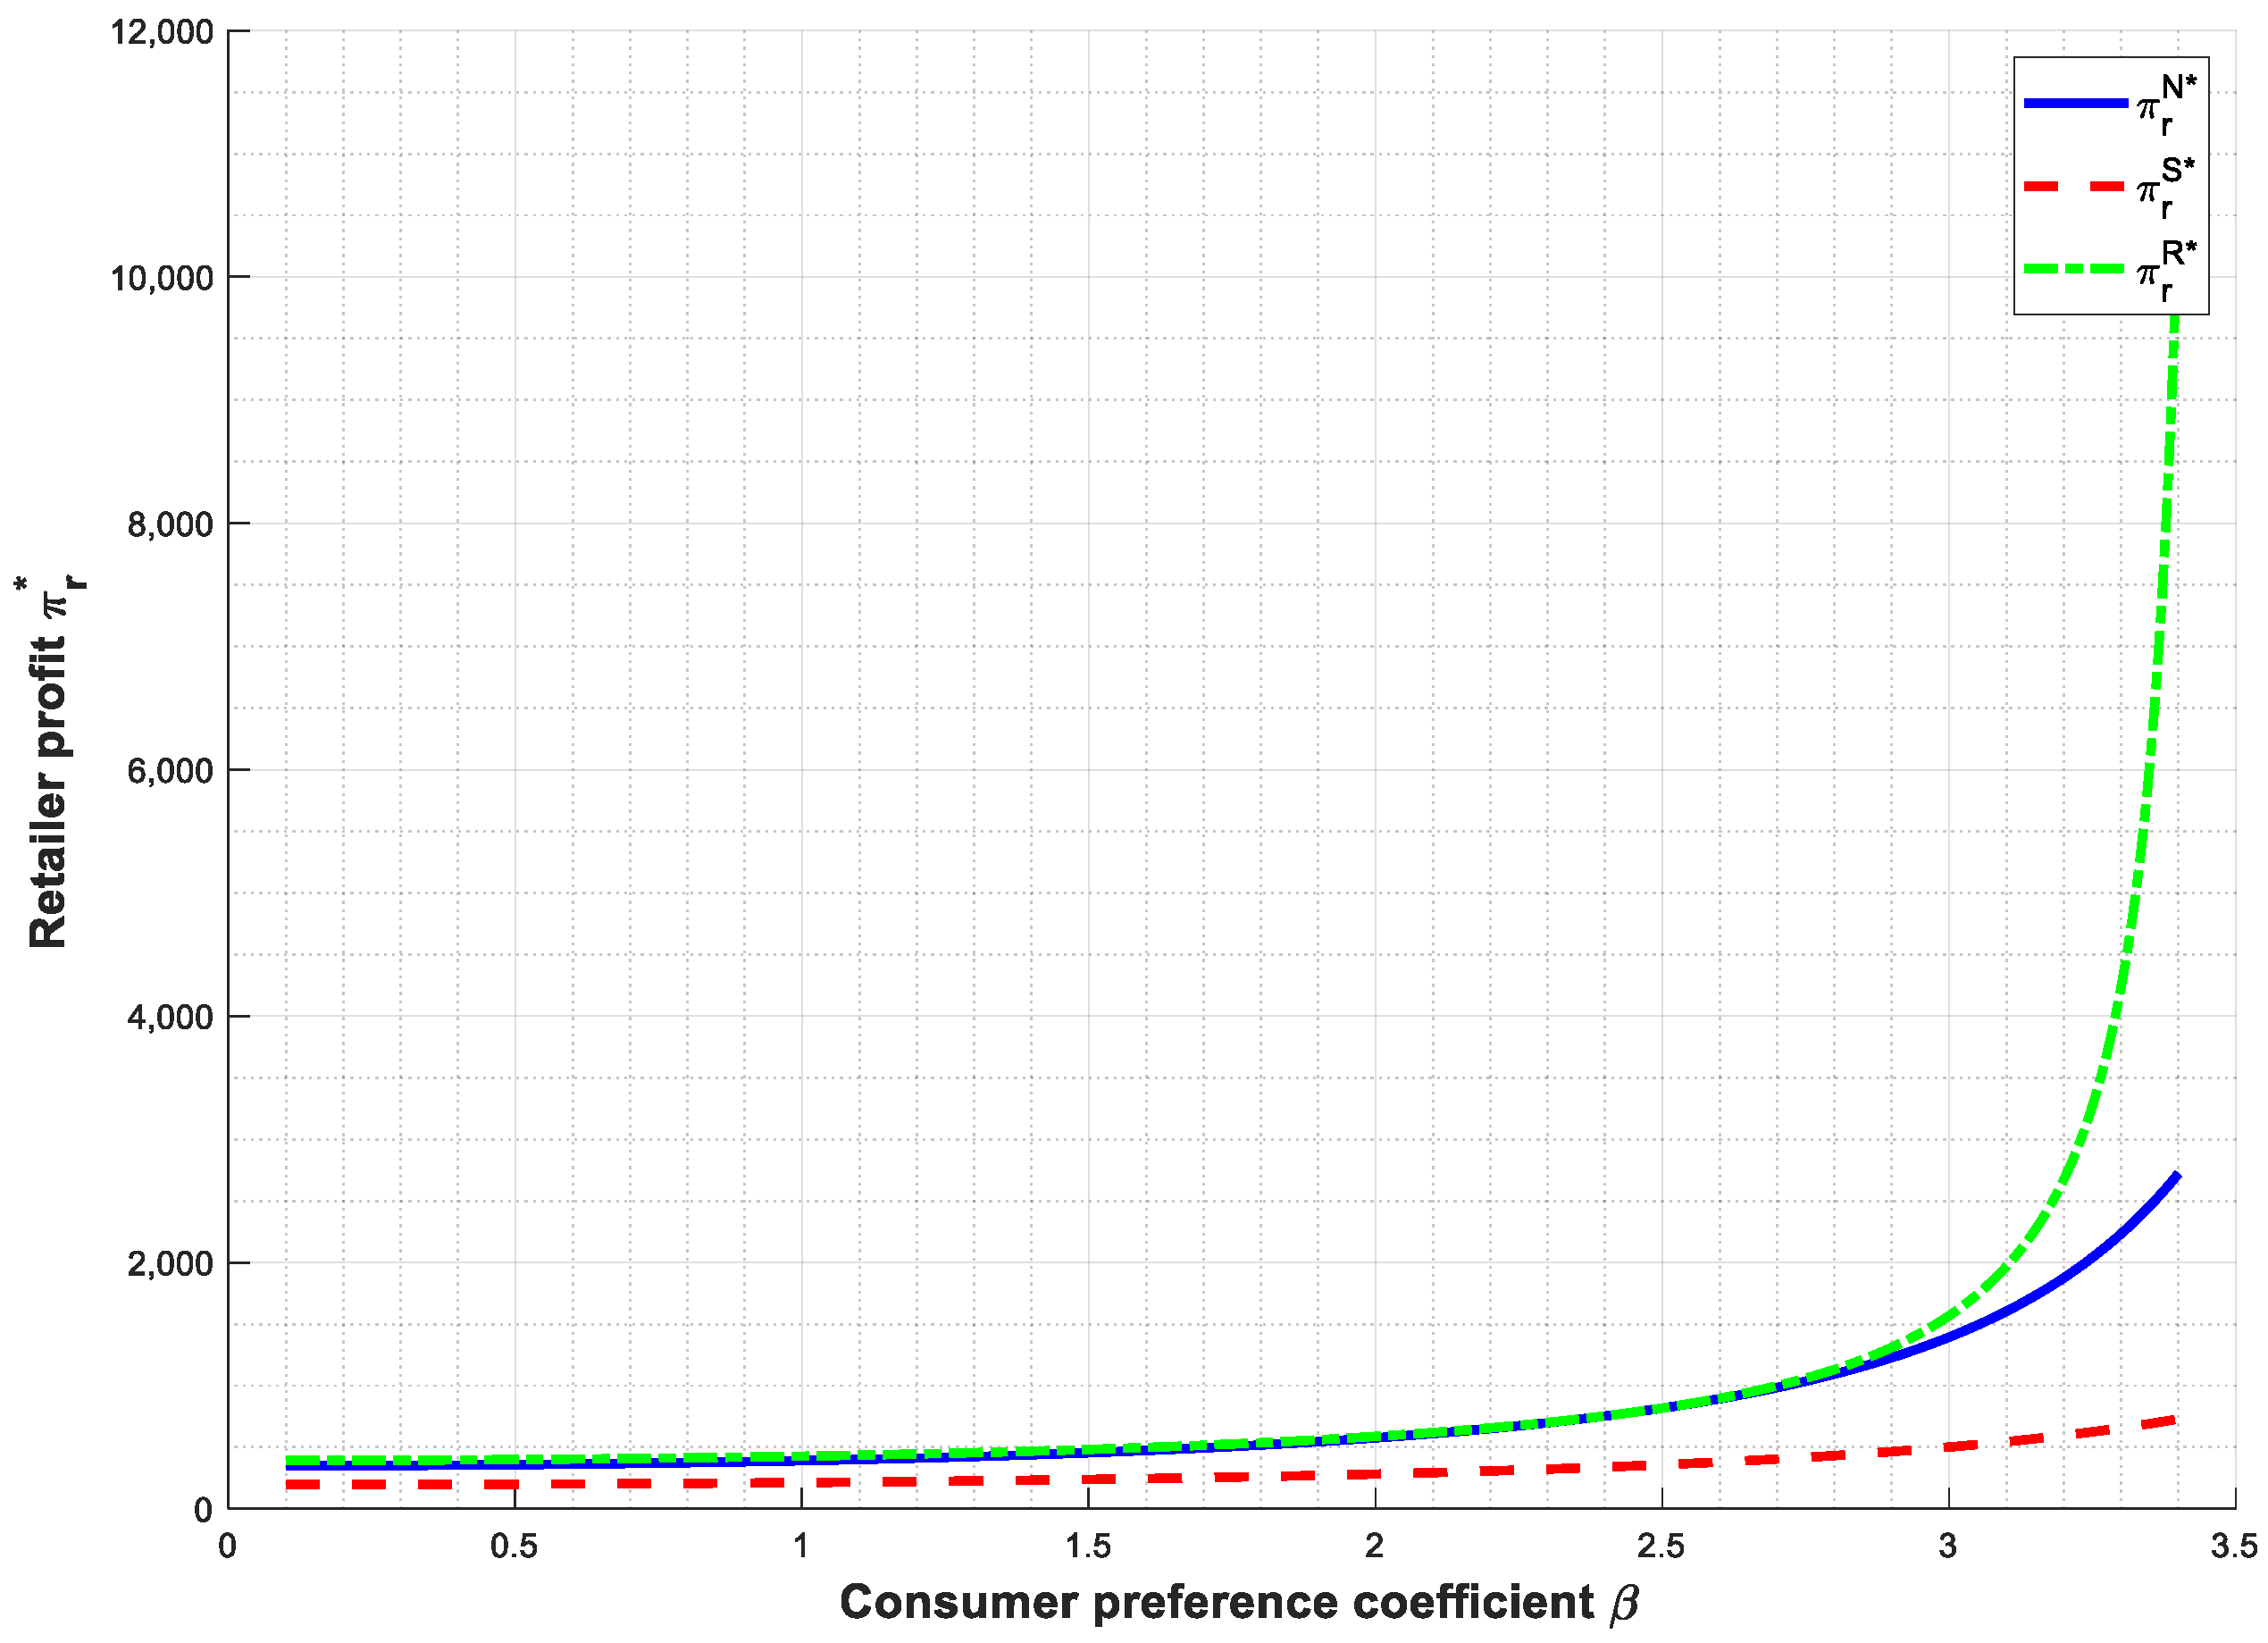
Figure 4 shows that, as consumer traceability preference β increases, retailer profits under all supply chain structures rise. This is because a higher β implies that market demand becomes more sensitive to the retailer’s sales efforts, making those efforts more valuable and thereby increasing profits. When β is sufficiently large, profits under the retailer-led structure increase sharply and significantly exceed those under the Nash and supplier-led structures. This indicates that greater consumer traceability preference enhances the retailer’s profit potential, with the advantage being particularly pronounced under a retailer-led structure.
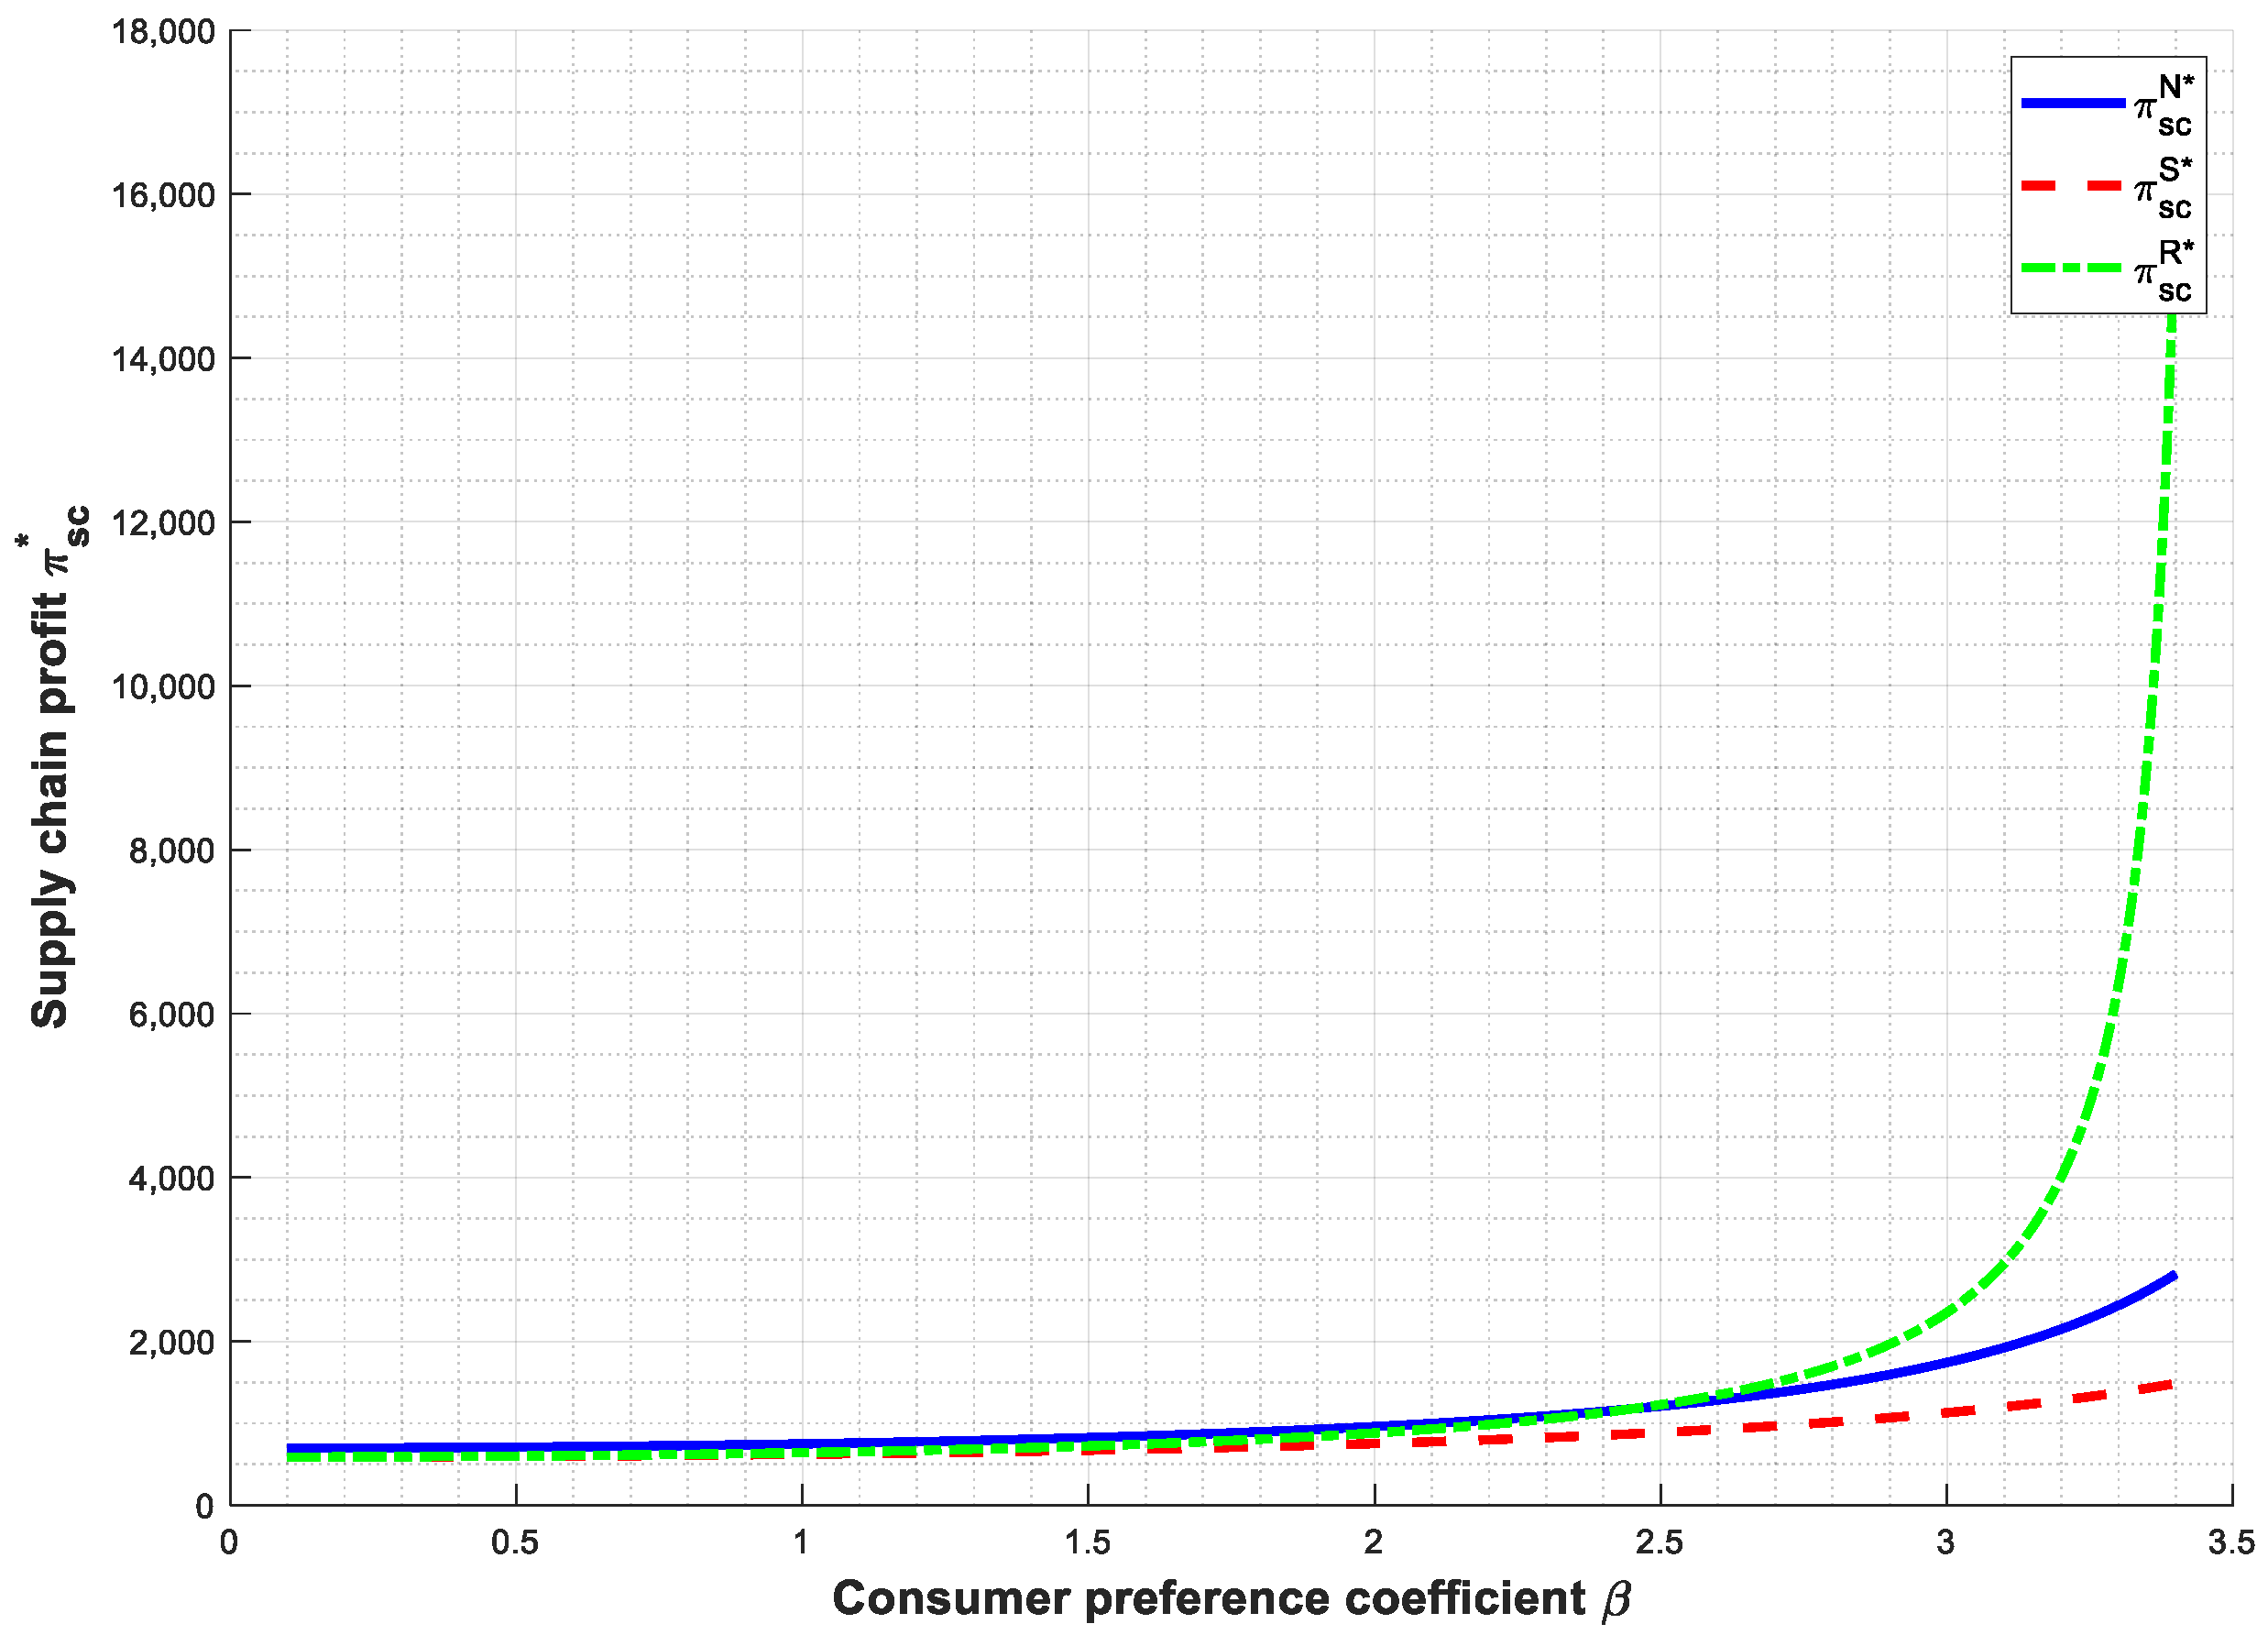
Figure 5 indicates that consumer traceability preference β has a positive impact on profits under all three power structures. This effect is most pronounced under the retailer-led structure.
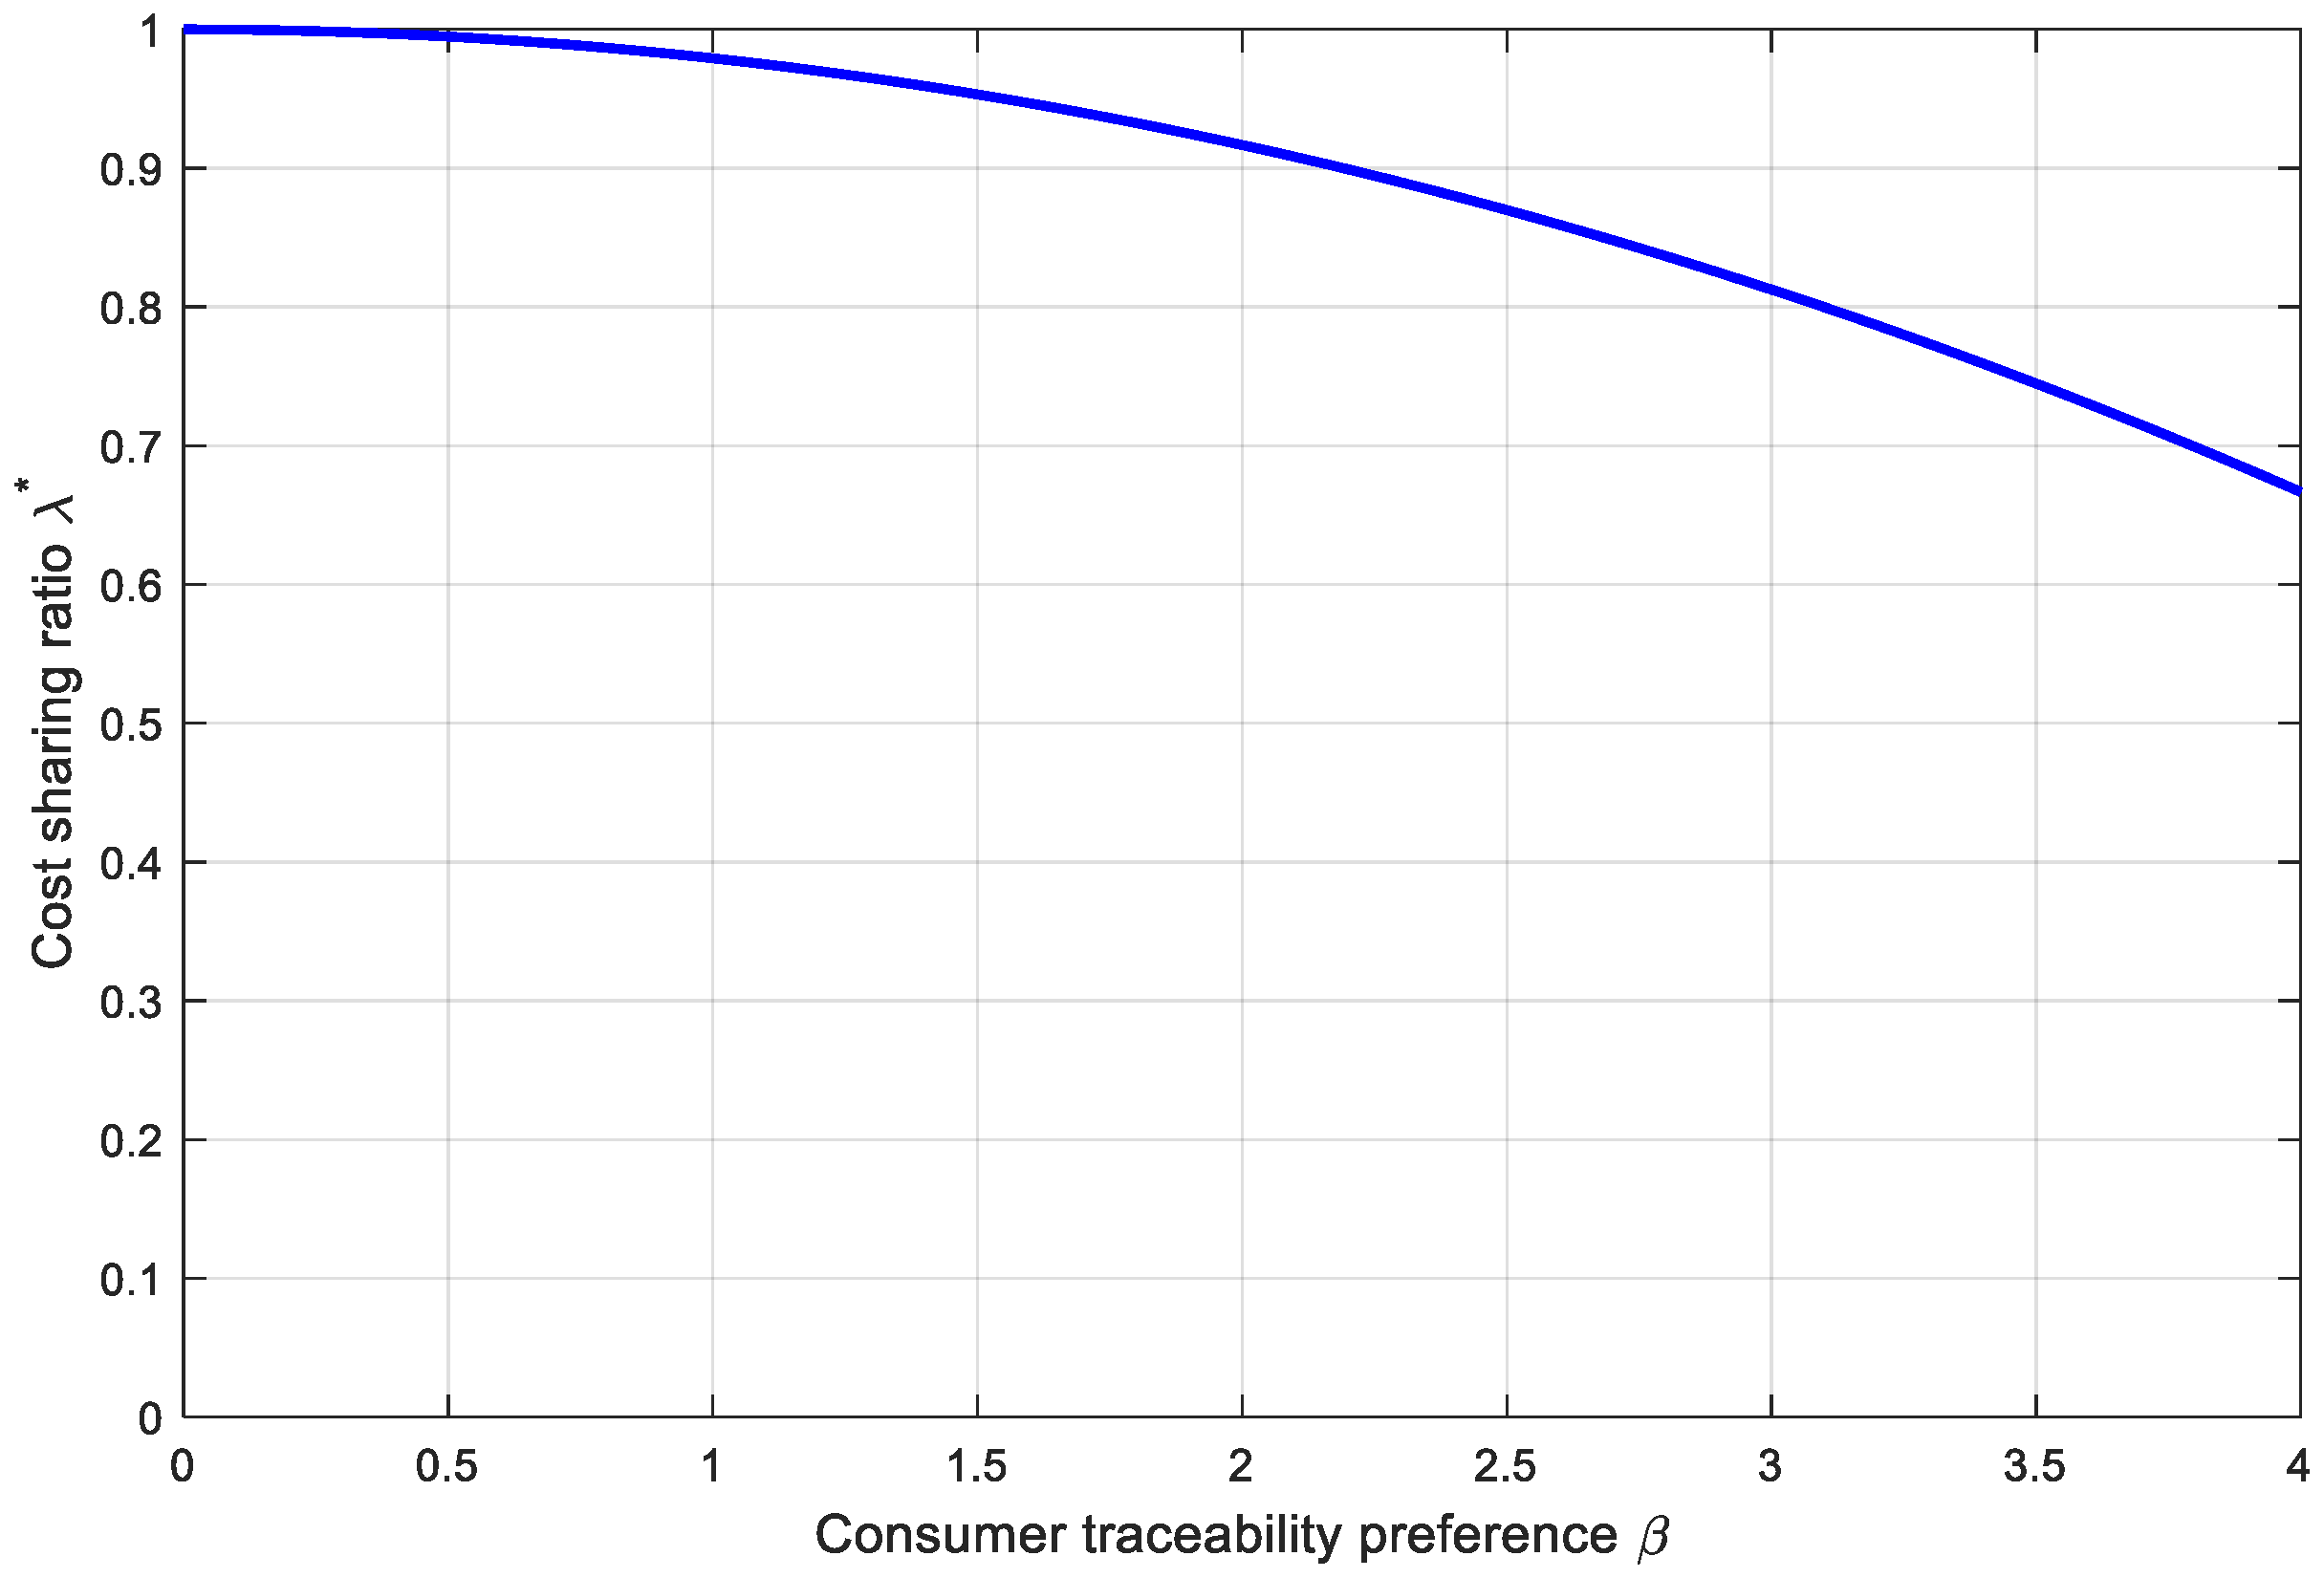
Figure 6 shows a significant negative correlation between consumer traceability preference β and the cost-sharing coefficient λ * under the supplier-led structure. This indicates that, as consumers place greater importance on product traceability, the cost proportion borne by the supplier gradually decreases.

7.2. Effects of Traceability Cost Coefficient k on Supply Chain Traceability Performance

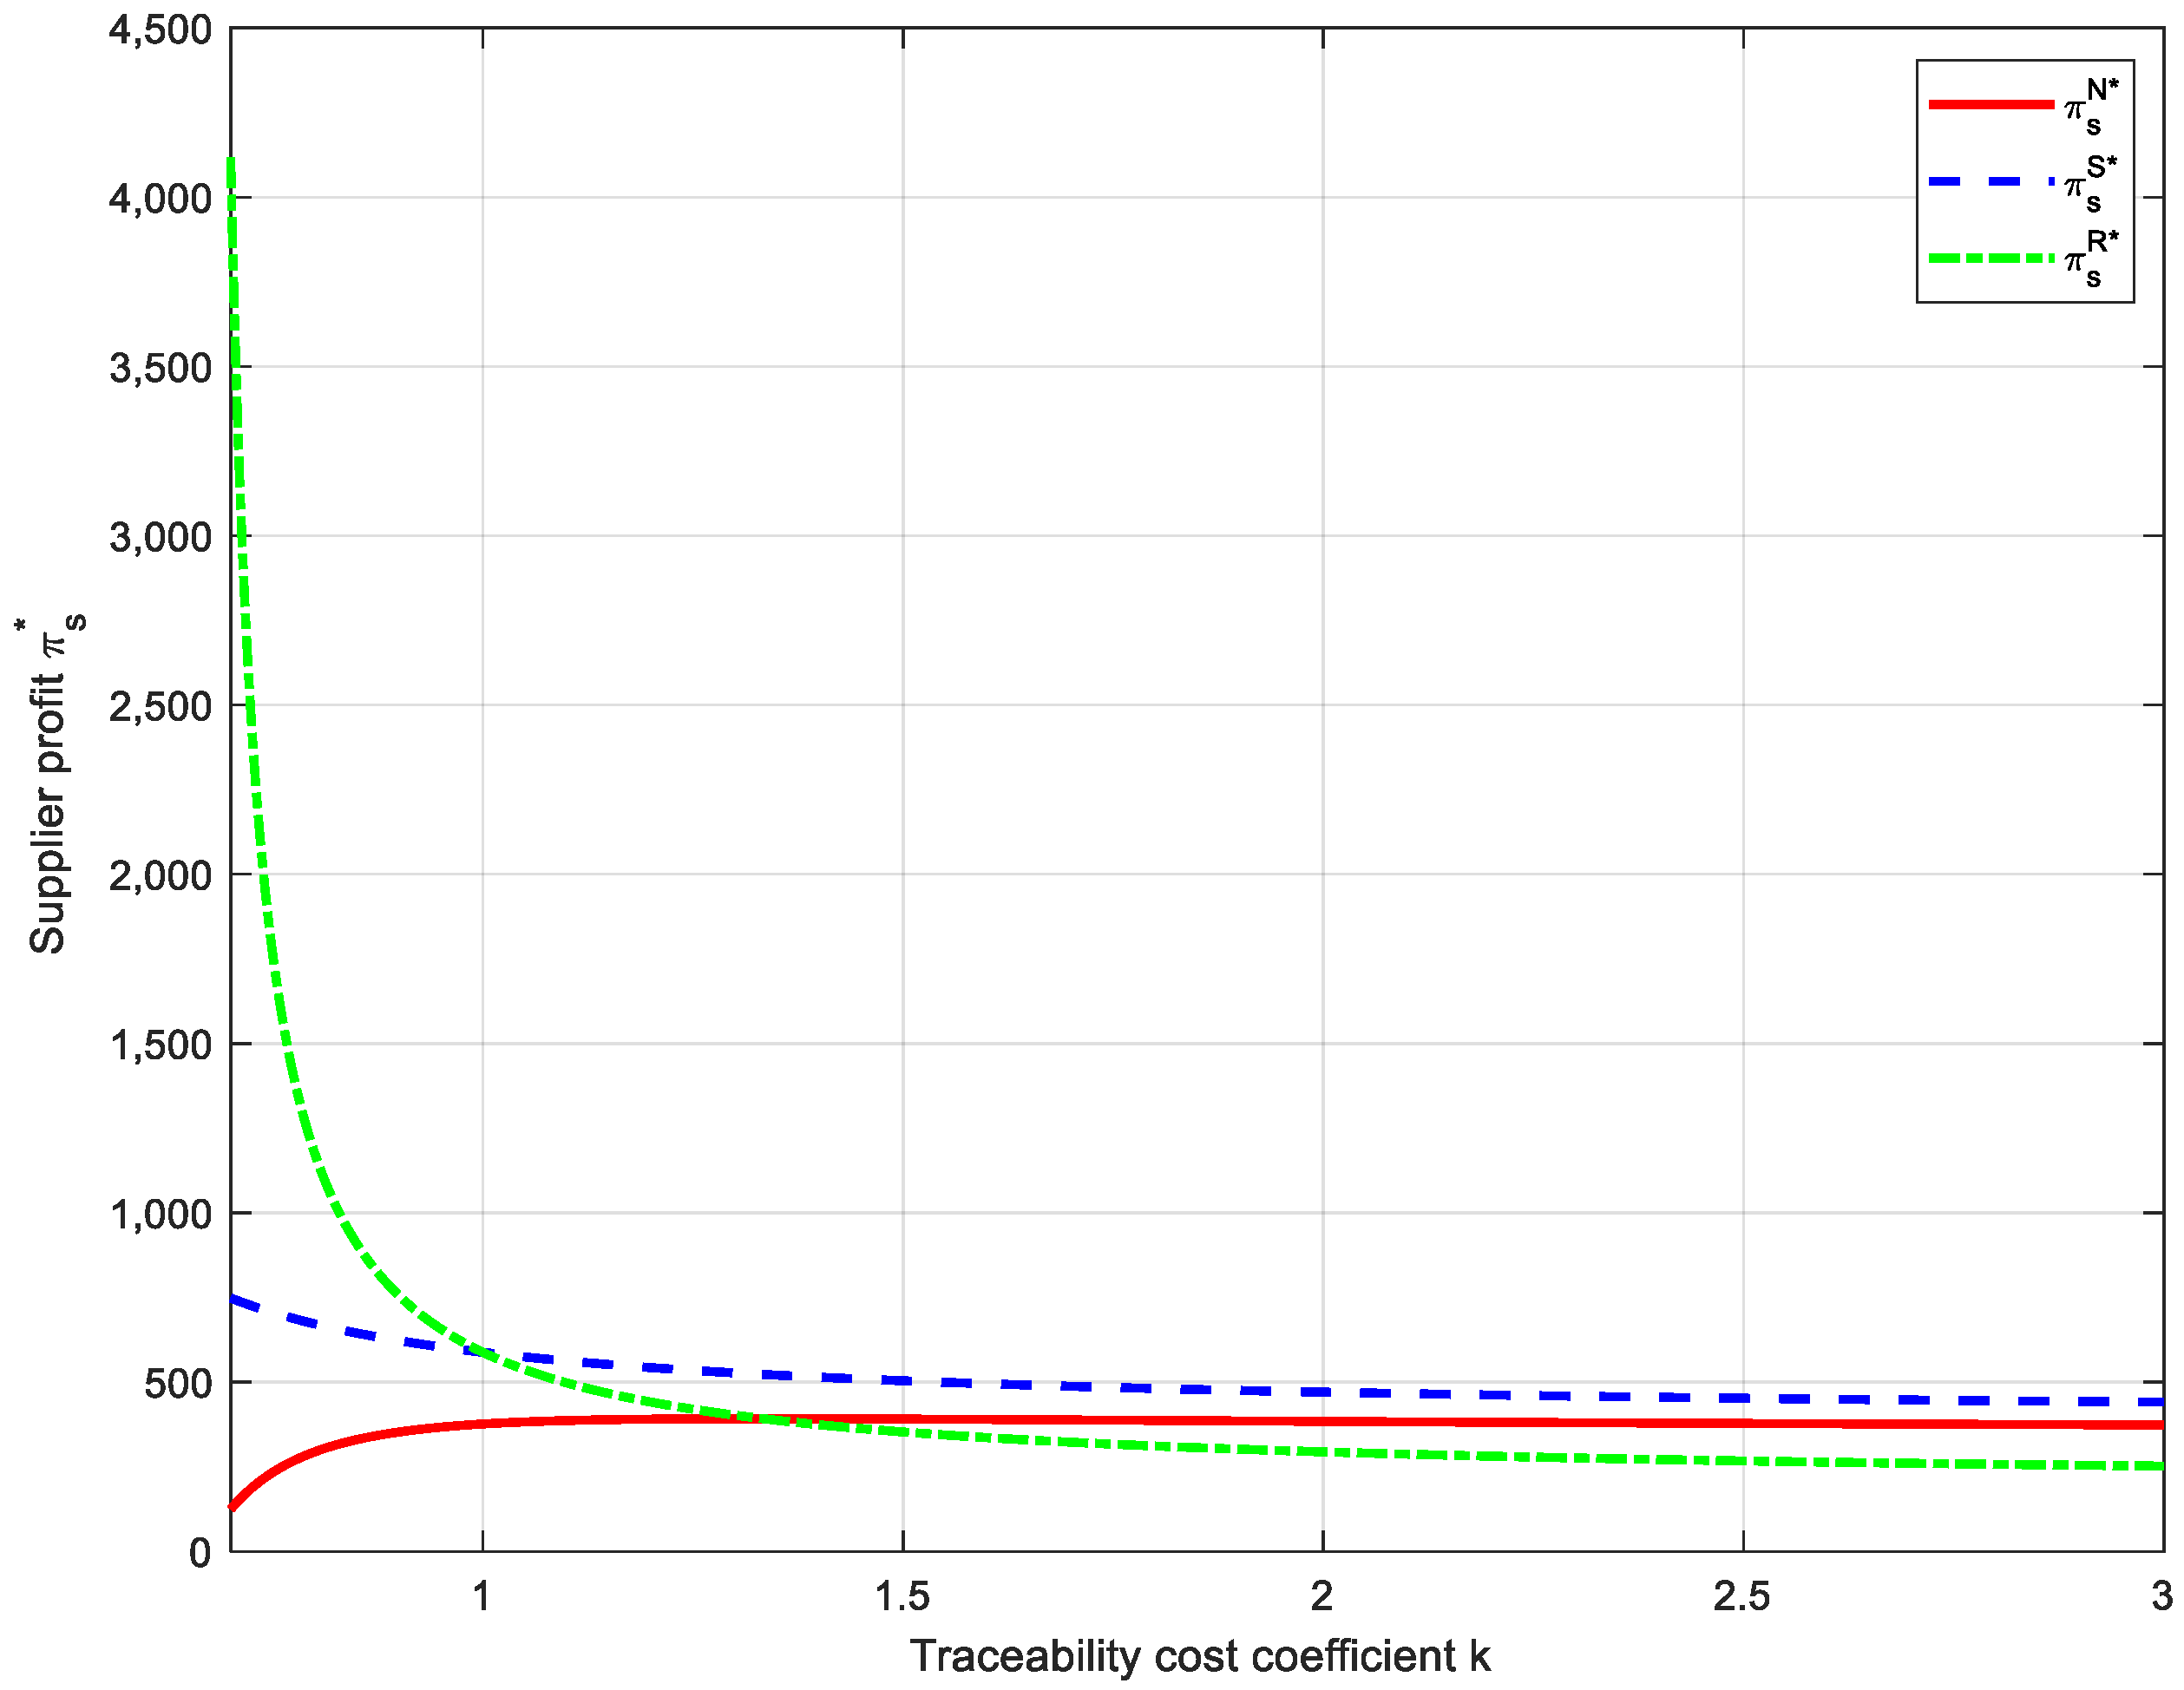
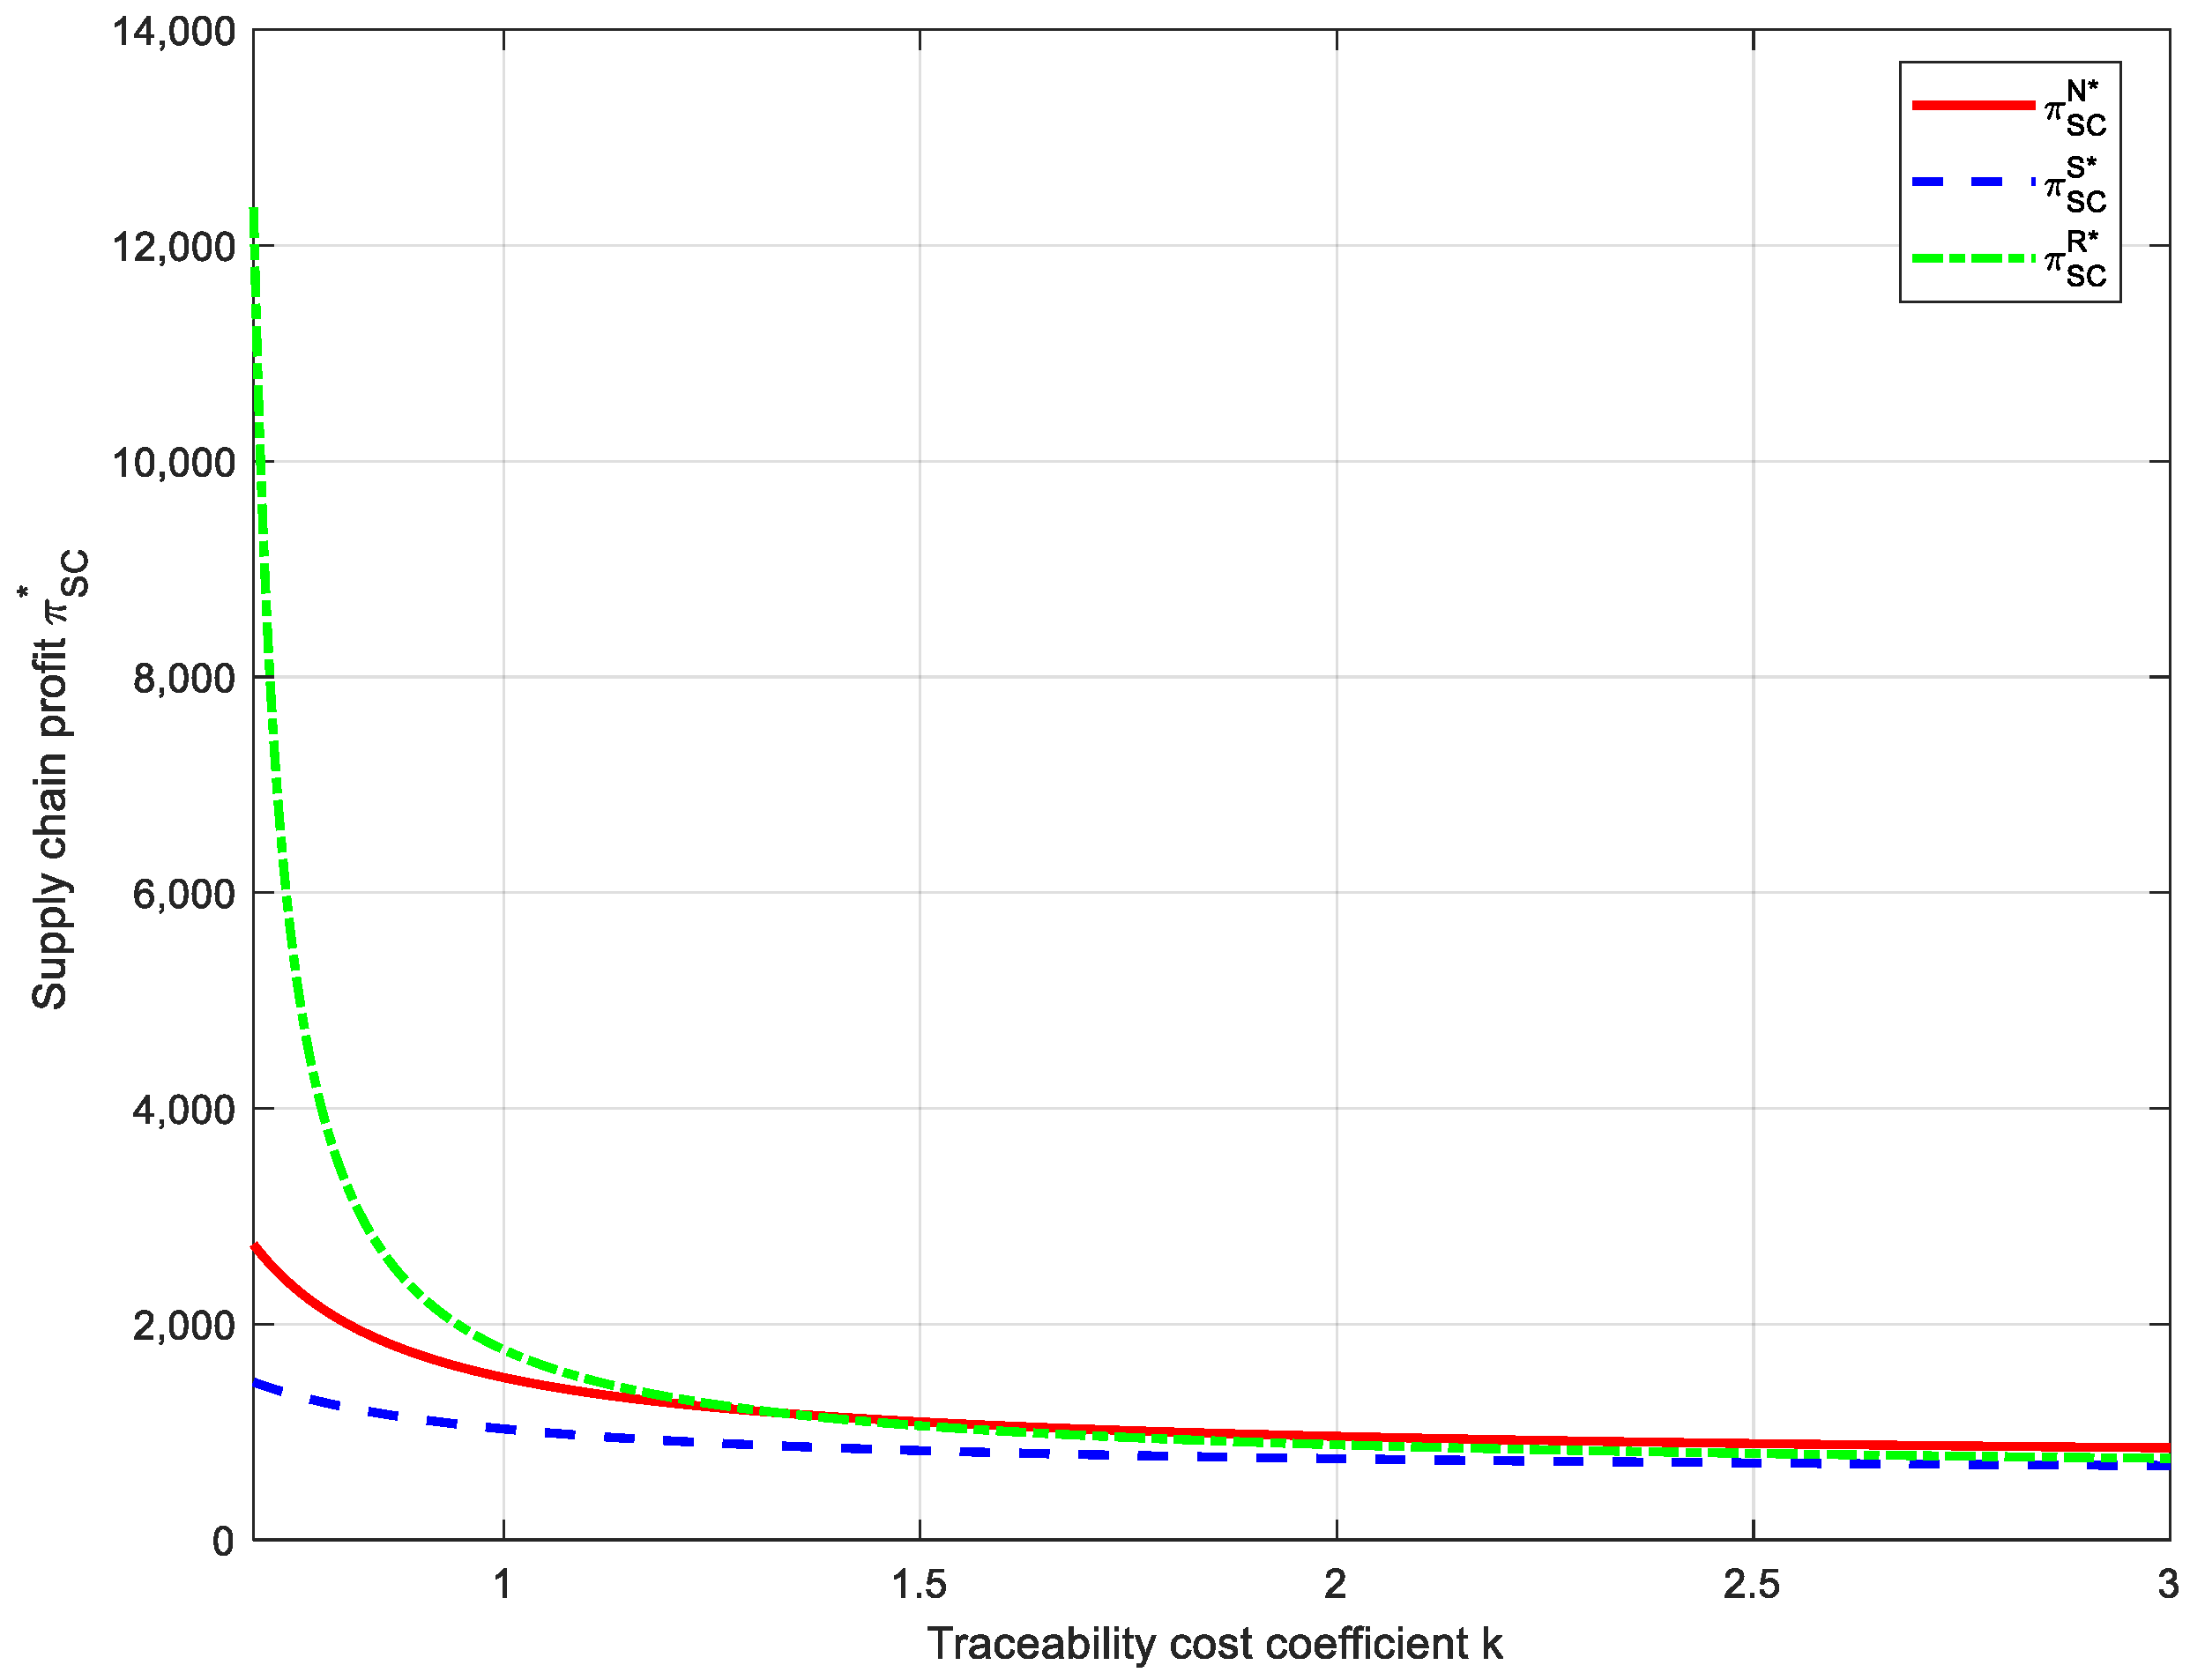
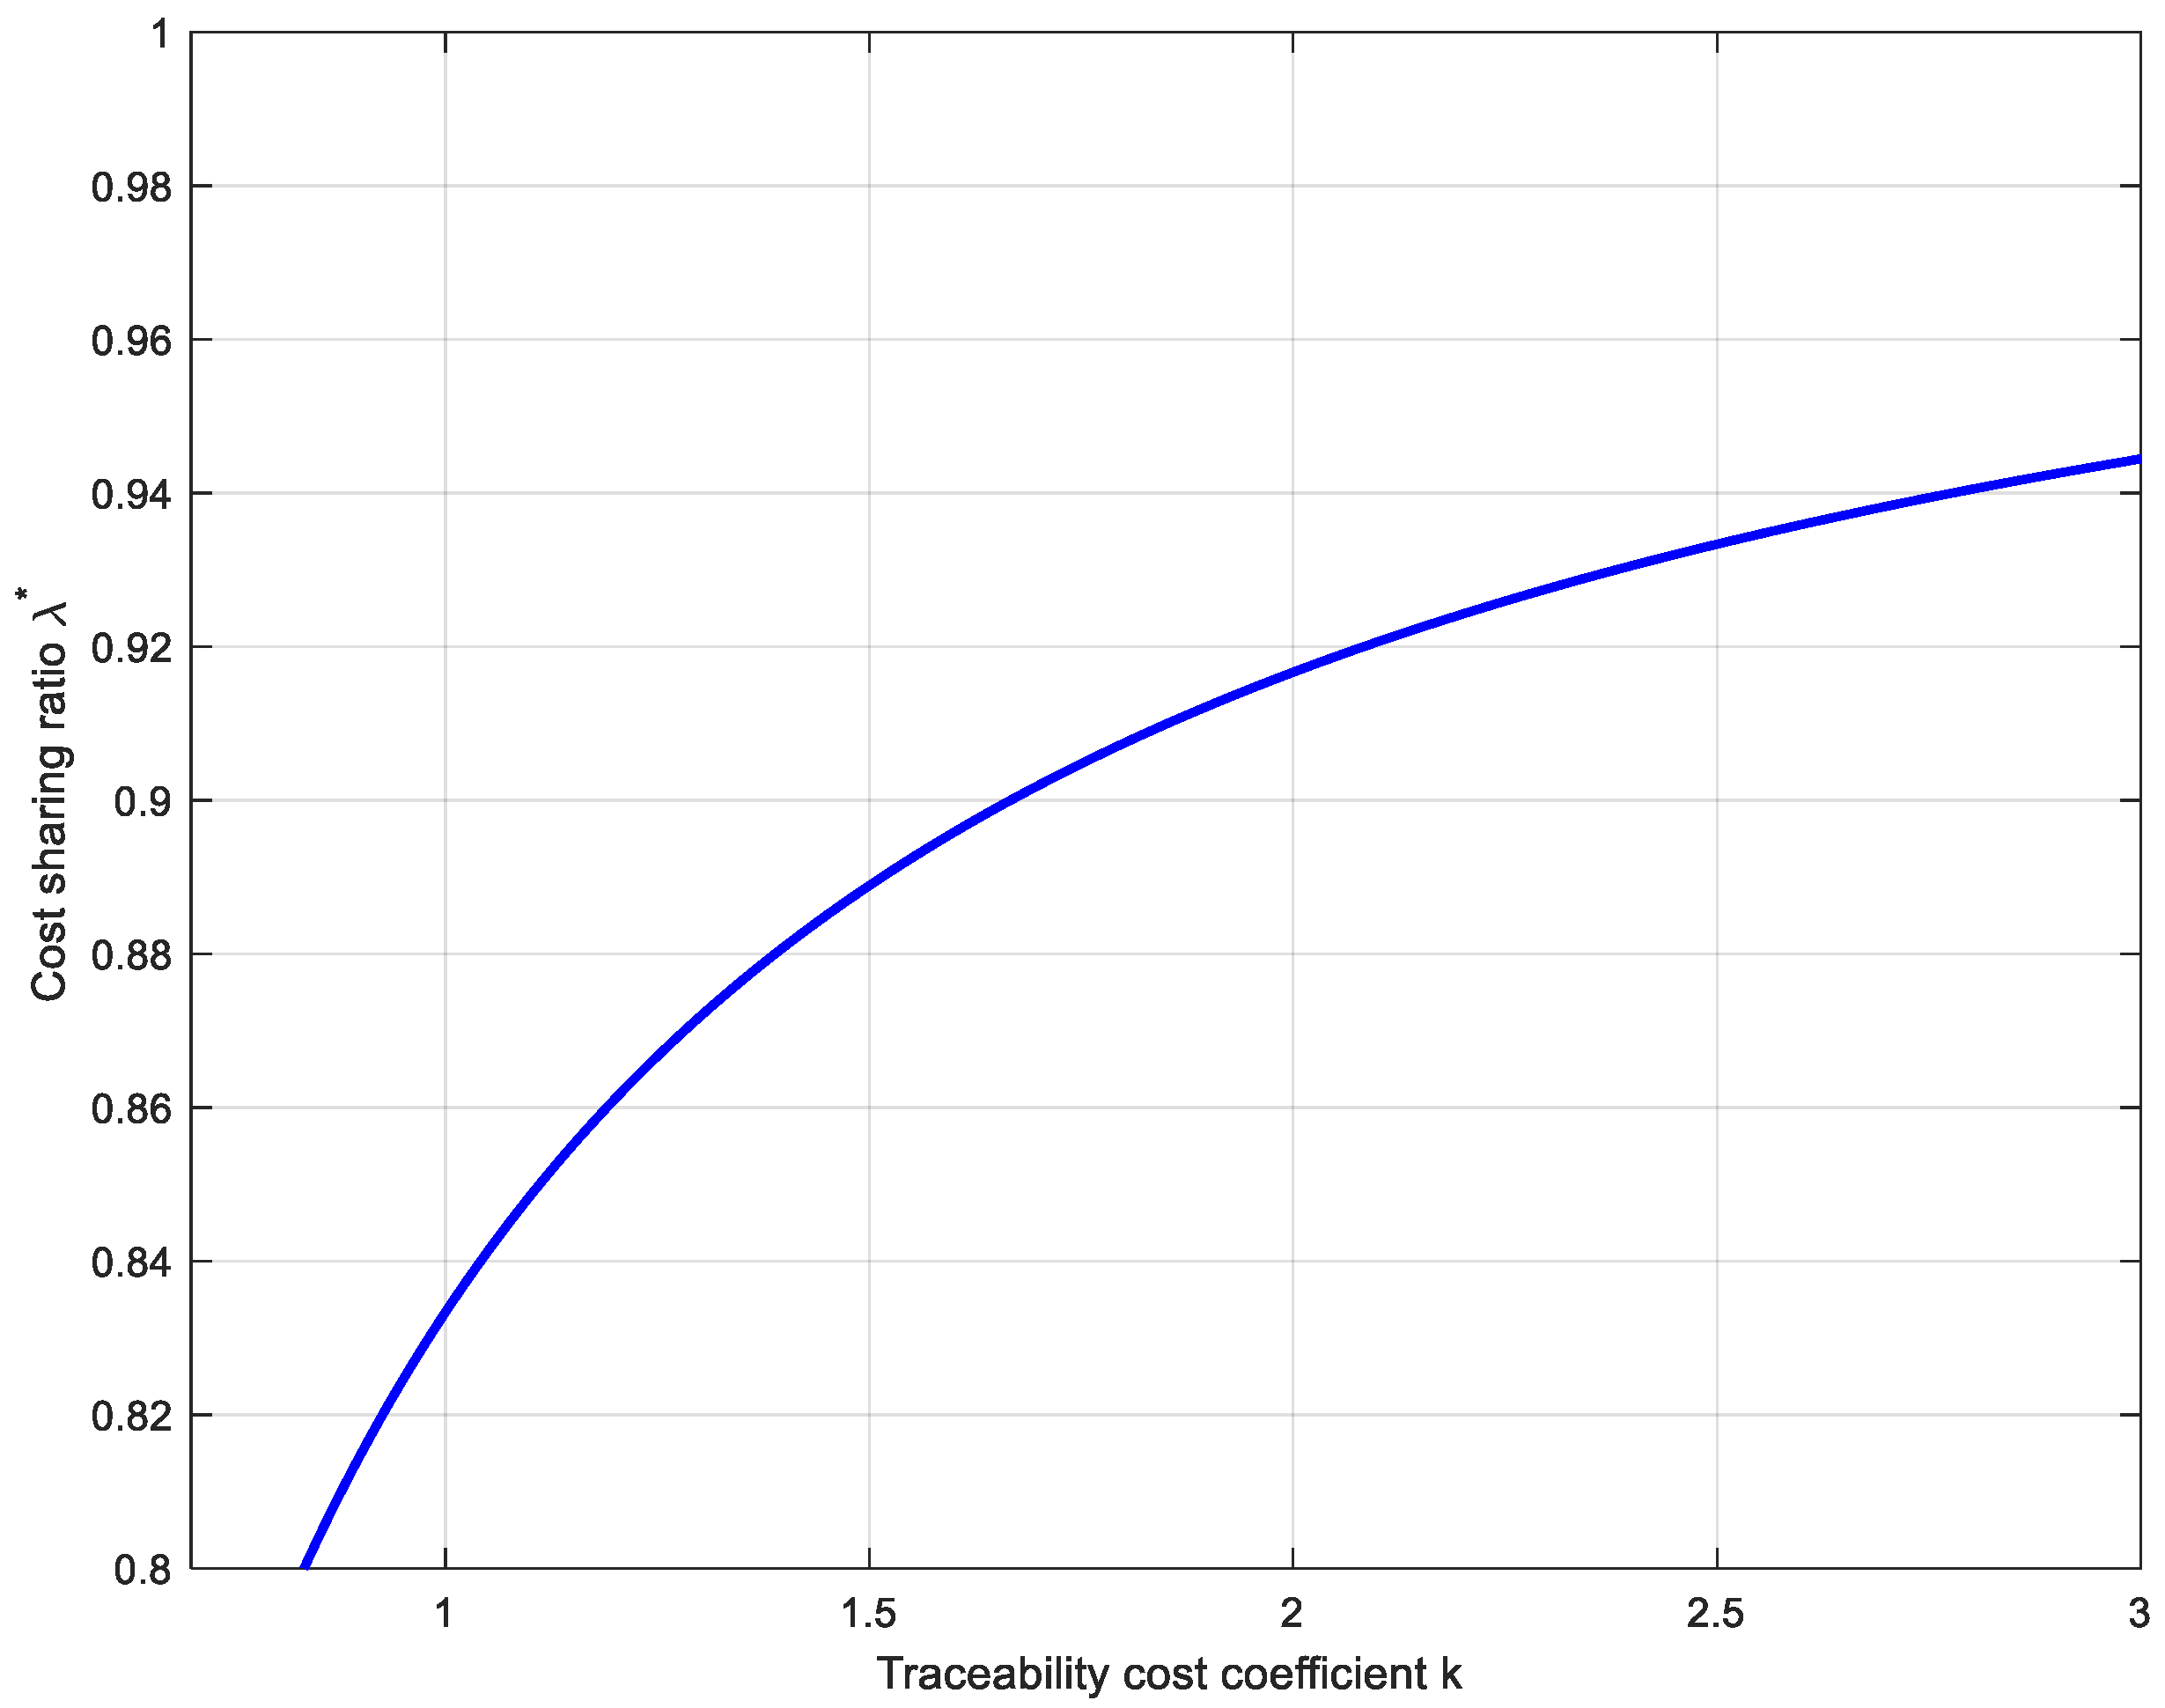
This section analyzes the impact of traceability cost coefficient k on food supply chain traceability decisions and profits under three supply chain structures, as well as their influence on the cost-sharing ratio under supplier-led scenario. Under the condition that satisfies the aforementioned equilibrium solution condition ( β < 2 b k ), the model parameters are set as follows: a = 100 , b = 3 , c = 1 , β = 2 , k ( 0.7 , 3 ) .
Figure 7 shows that, under all three power structures, a negative correlation exists between the traceability cost coefficient k and traceability capability t * . The traceability capability demonstrates the highest sensitivity to the cost coefficient in the retailer-led supply chain. This indicates that even a slight reduction in traceability costs can incentivize suppliers to significantly enhance product traceability capability.
Figure 8, Figure 9 and Figure 10 indicate that, regardless of the power structure, supplier profit, retailer profit, and supply chain profit all decrease monotonically as the traceability cost coefficient k increases. The most pronounced declining trend is observed under the retailer-led structure. This suggests that, in retailer-led supply chains, even a slight reduction in the traceability cost coefficient can lead to the most significant profit improvements for suppliers, retailers, and the entire supply chain.
Figure 11 shows that, under the supplier-led supply chain structure, there exists a significant positive correlation between the traceability cost coefficient ( k ) and the supplier’s cost-sharing ratio ( λ * ). This indicates that, in a supplier-driven supply chain, the level of traceability costs directly determines the proportion of costs that the supplier must bear. The supplier’s dominant position does not necessarily allow for easy cost transfer; on the contrary, to maintain system stability and leadership, the supplier may need to bear the majority of the cost pressure. Therefore, for suppliers in such a power structure, the most fundamental strategy is to reduce the traceability cost coefficient through technological innovation and process optimization.

8. Discussion

8.1. Main Findings

In this study, we investigate agricultural supply chain traceability decisions driven by consumer preferences. We develop a game-theoretic model for a two-tier supply chain (supplier–retailer) and systematically compare three power structures: vertical Nash equilibrium, supplier-led Stackelberg, and retailer-led Stackelberg. Our analysis examines how these structures affect traceability investments, market outcomes, and profit distribution. We further evaluate the coordination effects of cost-sharing and revenue-sharing contracts. Key findings reveal that stronger consumer preference for traceable products consistently drives higher traceability investments across all power structures. This aligns with empirical evidence showing consumers’ willingness to pay traceability premiums, creating market incentives for firms [46,47]. However, unlike much of the existing literature that regards consumer preference as a direct and sufficient driver of traceability, our study shows that these incentives must be filtered through governance and power structures. In other words, consumer preferences provide necessary motivation but cannot alone explain observed variations in traceability outcomes. By explicitly incorporating power dynamics, this study offers new theoretical insight into why similar levels of consumer demand may result in very different traceability capabilities.
When consumer traceability preference is relatively weak, the vertical Nash structure achieves superior traceability levels, market demand, and overall profits compared to other power configurations. These finding challenges conventional views (e.g., Xue and Xu, 2022) [45] that stronger leadership control automatically yields better outcomes. We demonstrate that, under low preference intensity, dominant parties gain insufficient marginal benefits to justify cost absorption, creating incentive misalignment. In contrast, Nash equilibrium’s balanced contributions and shared responsibilities generate more stable outcomes. This insight advances understanding of non-dominant structures’ efficiency potential, prompting reevaluation of symmetric power arrangements. Conversely, when consumer preference strengthens significantly, retailer-led structures demonstrate comprehensive advantages in traceability level, pricing, demand, and total profits. This aligns with Wei and Xu (2022)’s work [45] on retail-driven value creation and validates Resende-Filho and Hurley’s (2012) [3] “downstream-upstream incentive” mechanism. Our results extend this stream of research by showing that retailers not only detect consumer preference shifts but also actively reshape upstream investment incentives. This finding is particularly relevant in China’s evolving agricultural supply chains, where platform retailers dominate rule-setting and pricing, implying that retailers should take the lead in establishing end-to-end traceability systems as part of national food safety strategies.
In supplier-dominated structures, upstream actors bear traceability costs independently while lacking consumer feedback access and pricing flexibility. This creates limited incentives for traceability enhancement, aligning with Zhong et al.’s (2024) [21] findings on insufficient investment willingness among Chinese agricultural producers. This dynamic reinforces the “passive role” of production-side participants in traceability systems. Our findings also resonate with Cui et al. (2019) [48] but further stress that market mechanisms alone cannot ensure authentic information disclosure. This provides theoretical support for the “government guidance + market drivers” approach emphasized in current food safety policies, under which governments can strengthen upstream participation through subsidies, technical empowerment, and information platforms. Under vertical Nash structures, cost-sharing contracts achieve full coordination. When responsibilities and benefits are balanced, such contracts significantly improve traceability capabilities while restoring profits to centralized levels. This aligns with the finding of Morgan et al. (2018) [49], who support the balanced power dynamics with contractual intervention framework, demonstrating that coordination mechanisms function most effectively when power is relatively symmetric. Notably, when consumer preference strengthens, all members benefit from traceability premiums. Equitable cost-sharing then maximizes total profits while stabilizing partnerships. This mechanism provides theoretical grounding for establishing co-investment partnerships between small agricultural producers and regional platforms.
In supplier-dominated structures, contracts enable Pareto improvements but fail to achieve full coordination. Despite implementing cost-sharing contracts, power asymmetry and diluted incentives prevent reaching centralized performance levels. However, appropriately designed cost-sharing ratios can still induce Pareto improvements, motivating suppliers to moderately increase traceability investments. This finding extends the work of Fan et al.’s (2022) [46], who reveal that contract effectiveness operates on a spectrum between incentive enhancement and coordination failure rather than as a binary outcome. Practically, this suggests shifting policy focus from perfect coordination to incremental progress, enabling phased advancements in traceability systems. Under retailer dominance, both cost-sharing and revenue-sharing contracts prove ineffective for coordination or Pareto improvements. Retailers’ full decision-making authority and existing premium advantages eliminate their incentive to transfer benefits to suppliers. Only when consumer preference becomes exceptionally strong might retailers voluntarily share revenues to amplify total profits, validating the view of Resende-Filho and Hurley’s (2012) [3], which emphasized downstream concessions under high-premium conditions. This challenges conventional views treating revenue-sharing as a universal coordination tool. Consequently, in retailer-dominated chains, the critical factor shifts from contractual design to retailers’ strategic integration of traceability responsibilities. This provides theoretical grounding for collaborative models like brand partnerships and co-built supply chain platforms.

8.2. Theoretical Contributions

In this study, we examine agricultural supply chains driven by consumer traceability preferences through a game-theoretic model involving one supplier and one retailer. We systematically analyze optimal traceability decisions, market equilibria, and profit distribution across three power structures while evaluating coordination effects of cost-sharing and revenue-sharing contracts. Compared with prior studies, our work makes four original contributions. First, we model traceability level as an endogenous decision variable rather than an exogenous constraint, advancing beyond prior studies that treated it as a technical parameter (e.g., [17,50]). This approach reveals how power structures and cost allocations shape firms’ investment incentives, complementing existing technical/institutional perspectives. While other studies emphasize institutional design or data architecture, our behavioral decision-making framework explains capability divergence through strategic interactions, establishing a foundation for future research on consumer-driven traceability.
Second, we identify and model threshold effects in consumer preferences, demonstrating their structural dependence. Traceability incentives do not linearly translate into investments; their effectiveness hinges on power configurations. Below critical preference levels, market signals fail to motivate capability improvements. Beyond thresholds, dominant actors fundamentally alter strategies [45]. This non-linear mechanism enriches theoretical understanding of heterogeneous firm behavior and addresses a gap in traditional supply chain models, which often overlook dynamic market feedback effects.
Third, we establish a unified analytical framework comparing centralized, Nash, and Stackelberg structures. Unlike studies focusing on single structures (e.g., retailer-dominance only), our cross-structural analysis reveals how power dynamics shape equilibrium outcomes. This provides an integrated perspective on the “power–incentive–capability” nexus, deepening theoretical comprehension of structural impacts on traceability development. Finally, we demonstrate how contract effectiveness depends on structural contexts. Cost-sharing/revenue-sharing mechanisms show varied efficacy across power structures. In supplier-led chains, contracts enable Pareto improvements (though not full coordination) when properly calibrated. This challenges universal contract prescriptions (e.g., [51]), emphasizing the need for structure-adapted incentive designs rather than pursuing coordination optimality. Overall, these contributions highlight the originality of our study: we shift the focus from purely technical solutions to the interplay of consumer demand, governance, and contract mechanisms in shaping traceability.

8.3. Managerial Implication

Power structures fundamentally shape cost–benefit allocations and investment incentives in traceability systems. Our findings yield four key managerial insights. First, power structure assessment should precede traceability system design. Responsibility allocation and profit distribution mechanisms must align with specific structural contexts—supplier-dominant, retailer-dominant, or symmetric—as each entail’s distinct strategic behaviors. Ignoring power dynamics in contract design risks incentive misalignment and accountability gaps. For instance, supplier-led structures exhibit minimal upstream investment motivation due to unilateral cost burdens, while retailer-led models may marginalize suppliers despite superior capability outcomes. Firms should map business processes, analyze contracts, and evaluate data flows to identify their structural positioning before establishing collaboration frameworks.
Second, cost-sharing contracts are shown to be particularly effective in symmetric or supplier-disadvantaged contexts. Our analysis demonstrates that equitable cost allocation mitigates underinvestment, significantly enhancing traceability capabilities. When consumer preference reaches critical thresholds, near-optimal efficiency comparable to centralized decisions becomes achievable. Cost-sharing ratios should dynamically adapt to absolute traceability costs and bargaining power differentials. This insight is directly actionable for managers seeking to stabilize partnerships and for policymakers considering subsidy designs.
Third, retailer-led chains should reconceptualize traceability as a long-term brand equity strategy. While retailer dominance maximizes capability potential under strong consumer preferences, excluding suppliers undermines system sustainability. Retailers should therefore embed revenue-sharing clauses, data feedback mechanisms, and verified labeling to ensure upstream engagement and consumer trust. This recommendation is especially relevant in the context of China’s platform retailers, whose growing dominance in agri-food distribution positions them as gatekeepers for system-wide traceability.
Finally, policymakers should target structural vulnerabilities directly. In supplier-led chains, governments should provide targeted subsidies and technical empowerment to offset incentive imbalances. Platform retailers can foster compatibility standards and data interoperability to enable collaborative traceability. Regulators should develop structure-specific contract guidelines—including cost-sharing templates and incentive tiering models—to enhance enforceability and policy alignment. These recommendations not only provide practical guidance for firms but also support ongoing food safety policies, ensuring that managerial strategies and public governance are aligned to achieve resilient and transparent agricultural supply chains.

9. Conclusions

This study examines the interplay of consumer preferences, power structures, and contractual mechanisms in shaping traceability decisions and coordination within agricultural supply chains. Through a game-theoretic model of a two-tier supplier-retailer system, we systematically compare traceability investments, market equilibria, and profit distributions across three governance structures, vertical Nash, supplier-led, and retailer-led model, while evaluating the coordination efficacy of cost-sharing and revenue-sharing contracts. Our analysis reveals several findings. First, consumer preference for traceable products exerts broadly positive incentive effects that significantly enhance traceability investment willingness across supply chain tiers, establishing itself as a critical market-driven force for traceability system development. Second, power structures fundamentally determine traceability formation pathways and system performance through threshold-dependent mechanisms: when consumer preference remains weak, vertical Nash structures achieve superior traceability outcomes via cost-sharing and balanced decision making; however, once preference intensity exceeds critical thresholds, retailer-led structures demonstrate dominant performance in demand responsiveness, profit allocation, and capability building by leveraging market proximity and upstream incentivization. Third, supplier-led structures exhibit the weakest traceability outcomes due to highly concentrated cost responsibilities that suppress investment motivation. This limitation proves particularly acute in agricultural chains dominated by small-to-medium suppliers, where market mechanisms alone cannot ensure effective traceability without governmental support through subsidies or technical empowerment. Fourth, contract coordination effectiveness varies substantially across structures. Cost-sharing contracts enable comprehensive optimization of traceability, profits, and coordination efficiency in vertical Nash contexts. While achieving only partial coordination in supplier-led structures, properly calibrated cost-sharing ratios still facilitate Pareto improvements that effectively motivate upstream participation. Conversely, traditional contracts show minimal impact in retailer-led configurations, with traceability improvements emerging only under extreme preference levels when retailers voluntarily share revenues to pursue expanded market returns.
Nevertheless, several limitations should be critically acknowledged. First, the two-tier model abstracts away from the complexity of real-world agricultural supply chains, which typically involve multiple suppliers, intermediaries, and retailers with dynamic coalitions and competing interests. This simplification risks overestimating coordination feasibility and underrepresenting conflicts that emerge in multi-level structures. Future studies should therefore incorporate networked and multi-tier supply chains through complex system modeling to improve external validity. Second, our static treatment of consumer preferences and contract mechanisms overlooks their evolutionary nature. By assuming constant preferences and fixed contract terms, the model underestimates feedback loops from consumer learning, trust building, and regulatory adjustments, potentially biasing the predicted sustainability of coordination outcomes. Dynamic game models or longitudinal data analyses are needed to capture such co-evolution. Third, the assumption of fully rational actors with perfect information excludes behavioral distortions and information asymmetries that are pervasive in agricultural markets. This omission may limit explanatory power in contexts characterized by mistrust, hidden information, or bounded rationality, leading to overly optimistic coordination outcomes. Future research should explicitly integrate uncertainty, behavioral biases, and trust mechanisms using behavioral game theory, laboratory experiments, or field studies. Addressing these limitations would not only strengthen the robustness of theoretical insights but also enhance the applicability of recommendations for real-world decision-makers.

Author Contributions

Conceptualization, W.X., X.Z. and Z.X.; methodology, W.X.; software, W.X.; validation, W.X., X.Z. and Z.X.; formal analysis, W.X. and X.Z.; investigation, W.X. and X.Z.; resources, W.X. and X.Z.; data curation, W.X.; writing—original draft preparation, W.X.; writing—review and editing, W.X. and X.Z.; visualization, W.X. and X.Z.; supervision, X.Z. and Z.X.; project administration, W.X., X.Z. and Z.X.; funding acquisition, W.X., X.Z. and Z.X. All authors have read and agreed to the published version of the manuscript.

Funding

This work is supported by the Project of the National Natural Science Foundation of China (7240020614), the General Project of MOE (Ministry of Education) Foundation for Humanities and Social Sciences (24C10386015), and the Major Project of Social Science Research Base in Fujian Province (No. FJ2023JDZ020).

Institutional Review Board Statement

Not applicable.

Informed Consent Statement

Not applicable.

Data Availability Statement

The original contributions presented in this study are included in the article. Further inquiries can be directed to the corresponding author.

Conflicts of Interest

The authors declare no conflicts of interest.

Appendix A

Proof of Proposition 1.
Under the conditions a b c > 0 and 2 b k β 2 > 0 , the optimal solutions t N * , t S * , and t R *   exhibit strictly positive derivatives with respect to β :
t N * β = 2 β 2 a b c 3 b k β 2 2 + a b c 3 b k β 2 > 0 , t S * β = 2 β 2 a b c 4 b k β 2 2 + a b c 4 b k β 2 > 0 , t R * β = 4 β 2 a b c 4 b k 2 β 2 2 + a b c 4 b k 2 β 2 > 0 ,
Conclusion. t N * β > 0 , t S * β > 0 , t R * β > 0 . □
Proof of Proposition 2.
t * t N * = a β β b c 2 b k β 2 a β β b c 3 b k β 2 > 0 ; q * q N * = a b k b 2 c k 2 b k β 2 a b k b 2 c k 3 b k β 2 > 0 ; π s c * π s c N * = 3 b k β 2 2 2 b k β 2 4 b k β 2 > 1 ; so t * > t N * ; q * > q N * ; π s c * > π s c N * .
p * p N * = a k + b c k β 2 c 2 b k β 2 2 a k + b c k β 2 c 3 b k β 2 = k a b c β 2 b k 2 b k β 2 3 b k β 2 , for a b c > 0 , and 2 b k β 2 > 0 , when β 2 < b k , p * p N * < 0 , that is p * < p N * ; when b k < β 2 < 2 b k , p * p N * > 0 , that is p * > p N * . □
Proof of Proposition 3.
t * t S * = a β β b c 2 b k β 2 a β β b c 4 b k β 2 > 0 ; q * q S * = a b k b 2 c k 2 b k β 2 a b k b 2 c k 4 b k β 2 > 0 ; π s c * π s c S * = 4 b k β 2 2 k 2 b k β 2 6 b k β 2 > 1 ; so t * > t S * ; q * > q S * ; π s c * > π s c S * .
p * p S * = a k + b c k β 2 c 2 b k β 2 3 a k + b c k c β 2 4 b k β 2 = 2 k a b c β 2 b k 2 b k β 2 4 b k β 2 , for a b c > 0 , and 2 b k β 2 > 0 , when β 2 < b k , p * p S * < 0 , that is p * < p S * ; when b k < β 2 < 2 b k , p * p S * > 0 , that is p * > p S * . □
Proof of Proposition 4.
t * t R * = a β β b c 2 b k β 2 a β β b c 4 b k 2 β 2 > 0 ;   q * q R * = a b k b 2 c k 2 b k β 2 a b k b 2 c k 4 b k 2 β 2 > 0 ;   π s c * π s c R * = k a b c 2 2 2 b k β 2 3 k a b c 2 4 4 b k 2 β 2 = 4 3 > 1 , so, t * > t R * ; q * > q R * ;   π s c * > π s c R * .
p * p R * = a k + b c k β 2 c 2 b k β 2 3 a b k a β 2 b c β 2 + c k b 2 b 4 b k 2 β 2 = a b c β 2 b k 2 2 b k β 2 , for a b c > 0 , and 2 b k β 2 > 0 , when β 2 < b k , p * p R * < 0 , that is p * < p R * , when b k < β 2 < 2 b k , p * p R * > 0 , that is p * > p R * . □
Proof of Proposition 5.
When β 2 < 2 b k , t S * t N * = a β β b c 4 b k β 2 a β β b c 3 b k β 2 < 0 , that is t S * < t N * ;
t R * t N * = a β β b c 4 b k 2 β 2 a β β b c 3 b k β 2 , when b k < β 2 < 2 b k , t R * t N * > 0 , that is, t R * > t N * , so, t S * < t N * < t R * ; when β 2 < b k , t R * t N * < 0 , that is, t R * < t N * , and t R * t S * = a β β b c 4 b k 2 β 2 a β β b c 4 b k β 2 > 0 , so we have t S * < t R * < t N * . □
Proof of Proposition 6.
w S * w N * = 2 k a + b c c β 2 4 b k β 2 a k + 2 b c k β 2 c 3 b k β 2 = k a b c 2 b k β 2 4 b k β 2 3 b k β 2 , for a b c > 0 , and 2 b k β 2 > 0 , so, w S * w N * > 0 , when β 2 < 2 b k , w N * < w S * ;
w R * w N * = k a + 3 b c 2 c β 2 4 b k 2 β 2 a k + 2 b c k β 2 c 3 b k β 2 = k a b c β 2 b k 4 b k 2 β 2 3 b k β 2 , for a b c > 0 , and 2 b k β 2 > 0 , when β 2 < b k , w R * w N * < 0 , that is w R * < w N * , when b k < β 2 < 2 b k , w R * w N * > 0 , that is w R * > w N * ;
w R * w S * = k a + 3 b c 2 c β 2 4 b k 2 β 2 2 k a + b c c β 2 4 b k β 2 , for a b c > 0 , and 2 b k β 2 > 0 , when β 2 < 4 3 b k , w R * w S * < 0 , that is w R * < w S * , when 4 3 b k < β 2 < 2 b k , w R * w S * > 0 , that is w R * > w S * ;
Therefore, when β 2 < 2 b k , w N * < w S * ; when 4 3 b k < β 2 < 2 b k , w N * < w S * < w R * ; when b k < β 2 < 4 3 b k , w N * < w R * < w S * ; when β 2 < b k , w R * < w N * < w S * . □
Proof of Proposition 7.
p R * p N * = 3 a b k a β 2 b c β 2 + c k b 2 b 4 b k 2 β 2 2 a k + b c k β 2 c 3 b k β 2 = a b c β 2 b k 2 b 4 b k 2 β 2 3 b k β 2 , for a b c > 0 , and 2 b k β 2 > 0 , so p R * p N * > 0 , that is p R * > p N * ;
p S * p N * = 3 a k + b c k c β 2 4 b k β 2 2 a k + b c k β 2 c 3 b k β 2 = k a b c b k β 2 4 b k β 2 3 b k β 2 , for a b c > 0 , and 2 b k β 2 > 0 , when β 2 < b k , p S * p N * > 0 , that is p S * > p N * , when b k < β 2 < 2 b k , p S * p N * < 0 , that is p S * < p N * ;
p R * p S * = 3 a b k a β 2 b c β 2 + c k b 2 b 4 b k 2 β 2 3 a k + b c k c β 2 4 b k β 2 = β 2 a b c β 2 b k b 4 b k 2 β 2 4 b k β 2 , for a b c > 0 , and 2 b k β 2 > 0 , when β 2 < b k , p R * p S * < 0 , that is p R * < p S * , when b k < β 2 < 2 b k , p R * p S * > 0 , that is p R * > p S * ;
Therefore, when β 2 < 2 b k , p N * < p R * ; when β 2 < b k , p N * < p R * < p S * ;   when b k < β 2 < 2 b k , p S * < p N * < p R * . □
Proof of Proposition 8.
q S * q N * = a b k b 2 c k 4 b k β 2 a b k b 2 c k 3 b k β 2 = b 2 k 2 a b c 4 b k β 2 3 b k β 2 , for a b c > 0 , and 2 b k β 2 > 0 , so q S * q N * < 0 , that is q S * < q N * ;
q R * q N * = a b k b 2 c k 4 b k 2 β 2 a b k b 2 c k 3 b k β 2 = b k a b c β 2 b k 4 b k 2 β 2 3 b k β 2 , for a b c > 0 , and 2 b k β 2 > 0 , when β 2 < b k , q R * q N * < 0 , that is q R * < q N * , when b k < β 2 < 2 b k , q R * q N * > 0 , that is q R * > q N * ;
q R * q S * = a b k b 2 c k 4 b k 2 β 2 a b k b 2 c k 4 b k β 2 = β 2 b k a b c 4 b k 2 β 2 4 b k β 2 , for a b c > 0 , and 2 b k β 2 > 0 , so q R * q S * > 0 , that is q R * > q S * ;
Therefore, when β 2 < 2 b k , q S * < q N * , q S * < q R * ; when β 2 < b k , q S * < q R * < q N * ; when b k < β 2 < 2 b k , q S * < q N * < q R * . □
Proof of Proposition 9.
Let k a b c 2 2 = Δ , for Δ > 0 and 2 b k β 2 > 0 ,
π s S * π s N * = k a b c 2 2 4 b k β 2 k 2 b k β 2 a b c 2 2 3 b k β 2 2 = b 2 k 2 3 b k β 2 2 4 b k β 2 Δ > 0 , that is π s S * > π s N * ;
π s N * π s R * = k 2 b k β 2 a b c 2 2 3 b k β 2 2 k a b c 2 4 4 b k 2 β 2 = 3 β 4 10 b k β 2 + 7 b 2 k 2 2 3 b k β 2 2 4 b k β 2 Δ , when β 2 < b k , π s R * < π s N * ; when b k < β 2 < 2 b k , π s N * < π s R * ;
π s S * π s R * = k a b c 2 2 4 b k β 2 k a b c 2 4 4 b k 2 β 2 = 4 b k 3 β 2 2 4 b k β 2 4 b k 2 β 2 Δ , when β 2 < 4 3 b k , π s S * π s R * < 0 , that is π s S * < π s R * ; when 4 3 b k < β 2 < 2 b k , π s S * π s R * > 0 , that is π s S * < π s R * .
Therefore, when β 2 < 2 b k , π s N * < π s S * ; when β 2 < b k , π s R * < π s N * < π s S * ;   when b k < β 2 < 4 3 b k , π s N * < π s R * < π s S * , when 4 3 b k < β 2 < 2 b k , π s N * < π s S * < π s R * . □
Proof of Proposition 10.
π r N * π r S * = b k 2 a b c 2 3 b k β 2 2 b k 2 a b c 2 4 b k β 2 2 > 0 , so, π r S * < π r N * ;
Let k a b c 2 2 = Δ , for Δ > 0 and 2 b k β 2 > 0 ,
π r R * π r N * = k a b c 2 2 4 b k 2 β 2 b k 2 a b c 2 3 b k β 2 2 = β 2 b k 2 4 b k 2 β 2 3 b k β 2 2 Δ , so π r R * π r N * > 0 , that is π r R * > π r N * ;
π r R * π r S * = k a b c 2 2 4 b k 2 β 2 b k 2 a b c 2 4 b k β 2 2 = 4 b 2 k 2 + β 2 2 b k 2 4 b k 2 β 2 4 b k β 2 2 Δ , so π r R * π r S * > 0 , that is π r R * > π r S * ;
Therefore, when β 2 < 2 b k , π r S * < π r N * < π r R * . □
Proof of Proposition 11.
Let k a b c 2 2 = Δ , for Δ > 0 and 2 b k β 2 > 0 ,
π s c S * π s c N * = k ( 6 b k β 2 ) ( a b c ) 2 2 4 b k β 2 2 k 4 b k β 2 a b c 2 2 3 b k β 2 2 = b 2 k 2 3 β 2 10 b k 4 b k β 2 2 3 b k β 2 2 Δ , so, π s c S * π s c N * < 0 , that is π s c S * < π s c N * ;
π s c R * π s c N * = 3 k ( a b c ) 2 4 ( 4 b k 2 β 2 ) k 4 b k β 2 a b c 2 2 3 b k β 2 2 = 5 b k β 2 β 2 b k 2 4 b k 2 β 2 3 b k β 2 2 Δ , when β 2 < b k , π s c R * π s c N * < 0 , that is π s c R * < π s c N * ; when b k < β 2 < 2 b k , π s c R * π s c N * > 0 , that is π s c R * > π s c N * ;
π s c R * π s c S * = 3 k ( a b c ) 2 4 ( 4 b k 2 β 2 ) k ( 6 b k β 2 ) ( a b c ) 2 2 4 b k β 2 2 = β 2 8 b k β 2 2 4 b k 2 β 2 4 b k β 2 2 Δ , so, π s c R * π s c S * > 0 , that is π s c R * > π s c S * ;
Therefore, when β 2 < 2 b k , π s c S * < π s c N * , π s c S * < π s c R * ; when β 2 < b k , π s c S * < π s c R * < π s c N * ; when b k < β 2 < 2 b k , π s c S * < π s c N * < π s c R * . □
Proof of Proposition 12.
t N C * t N * = a β β b c 3 b k λ β 2 a β β b c 3 b k β 2 = a β β b c 3 b k 1 λ 3 b k λ β 2 3 b k β 2 , when β 2 3 b k < λ < 1 , we will have t N C * t N * > 0 , that is t N C * > t N * . □
Proof of Proposition 13.
According to the coordination condition, equating t N C * = t * , t N C * = a β β b c 3 b k λ β 2 = t * = a β β b c 2 b k β 2 , we obtain λ = 2 3 .
Substituting λ = 2 3 , the profit difference is π s c N C * π s c * = k λ 4 b k λ β 2 a b c 2 2 3 b k λ β 2 2 k a b c 2 2 2 b k β 2 = k 3 β 2 2 b k a b c 2 9 2 b k β 2 2 , when 2 3 b k β 2 < 2 b k , π s c N C * > π s c * . □
Proof of Proposition 14.
For π r N C * π r N * = λ 2 b k λ β 2 3 b k β 2 2 3 b k λ β 2 2 2 b k β 2 , π s N C * π s N * = λ 2 3 b k β 2 2 3 b k λ β 2 2 . When λ = 2 3 , we obtain π r N C * π r N * > 1 , π s N C * π s N * > 1 .
Thus, when both the supplier’s and retailer’s profits exceed their respective decentralized decision-making levels, the coordination condition is satisfied. This demonstrates that the cost-sharing contract effectively incentivizes both supply chain parties to enhance product traceability. □
Proof of Proposition 15.
According to supply chain coordination theory, when the supply chain achieves coordination, its optimal decisions should equal those under centralized decision making.
Beginning with the coordination condition: t S C * = t * , where t S C * = a β β b c 4 b k λ β 2 = t * = a β β b c 2 b k β 2 , we derive the critical parameter: λ = 1 2 ,
Substituting λ = 1 2 into the profit function π s c S C * yields: π s c S C * = k ( a b c ) 2 ( 3 b k 2 β 2 ) 4 ( 2 b k β 2 ) 2 . The ratio of coordinated to centralized profits is: π s c S C * π s c * = 3 b k 2 β 2 2 ( 2 b k β 2 ) 2 < 1 , demonstrating: π s c S C * < π s c * .
Since the coordinated supply chain profit is strictly less than the centralized optimal profit, full supply chain coordination cannot be achieved under this mechanism. □
Proof of Proposition 16.
t S C * t S * = 4 b k β 2 4 b k λ β 2 , when β 2 4 b k < λ < 1 , t S C * t S * > 1 , that is t S C * > t S * . □
Proof of Proposition 18.
For a b c > 0 , and 2 b k β 2 > 0 ,
t S C * * t S * = 2 a b c β 8 b k 3 β 2 a β β b c 4 b k β 2 = β 2 a b c β 8 b k 3 β 2 4 b k β 2 > 0 , that is t S C * * > t S * ;
w S C * * w S * = 8 b k a + b c β 2 a + 5 b c 2 b 8 b k 3 β 2 2 k a + b c c β 2 4 b k β 2 = β 4 a b c 2 b 8 b k 3 β 2 4 b k β 2 > 0 , that is w S C * * > w S * ;
p S C * * p S * = 8 b k a + b c 3 β 2 a + 3 b c 4 b 8 b k 3 β 2 3 a k + b c k c β 2 4 b k β 2 = 3 β 4 a b c 4 b 8 b k 3 β 2 4 b k β 2 > 0 , that is p S C * * > p S * .
Therefore, t S C * * > t S * , w S C * * > w S * , p S C * * > p S * . □
Proof of Proposition 19.
For a b c > 0 , and 2 b k β 2 > 0 , π s S C * * π s S * = 8 b k β 2 a b c 2 8 b 8 b k 3 β 2 k a b c 2 2 4 b k β 2 = β 4 a b c 2 8 b 8 b k 3 β 2 4 b k β 2 > 0 , that is π s S C * * > π s S * ;
π r S C * * π r S * = 8 b k + β 2 a b c 2 16 b 8 b k 3 β 2 b k 2 a b c 2 4 b k β 2 2 = β 6 a b c 2 16 b 8 b k 3 β 2 4 b k β 2 2 > 0 , that is π r S C * * > π r S * ;
Therefore, both the supplier and retailer will rationally accept this contract, as it satisfies their individual participation constraints while improving supply chain coordination. □
Proof of Proposition 20.
According to supply chain coordination theory, when the supply chain achieves coordination, its optimal decisions must equal those under centralized decision making.
By equating the traceability investment levels: t R C * = t * , we derive the first necessary condition: λ 4 b k λ 2 3 β 2 λ + β 2 = 1 2 b k β 2 . Simultaneously, profit equivalence requires: π s c S C * = π s c * , yielding the second condition: λ 2 ( 6 b k λ 2 4 β 2 λ + β 2 ) ( 4 b k λ 2 3 β 2 λ + β 2 ) 2 = 1 2 b k β 2 . Since Conditions 1 and 2 cannot hold simultaneously, perfect supply chain coordination is unattainable under this contractual framework. □
Proof of Proposition 22.
t R R * θ = β 2 θ 2 b k 2 β 2 a b c 2 θ β 2 4 β 2 + 6 b k 2 b k θ 2 + β a b c 2 b k θ 6 b k + 4 β 2 2 θ β 2 = 2 b k β a b c 2 θ β 2 4 β 2 + 6 b k 2 b k θ 2 < 0
Proof of Proposition 23.
According to supply chain coordination theory, coordination is achieved if and only if the optimal decentralized decision equals the centralized optimal decision, i.e., t R R * = t * .
The decentralized decision t R R * is strictly decreasing in θ . At the minimal θ value ( θ = 0 ): t R R * = 1 2 t * < t * .
Therefore, perfect supply chain coordination is provably unattainable under this contractual framework. □
Proof of Proposition 24.
The first-order partial derivative of the supplier’s profit with respect to θ is: π s R R * θ > 0 .
The retailer’s profit derivative is: π r R R * θ = k b k β 2 a b c 2 θ β 2 4 β 2 + 6 b k 2 b k θ 2 , when β 2 < b k , π r R R * θ > 0 , implying the retailer’s profit is maximized at θ = 1 . Thus, the retailer has no incentive to share revenue.
When b k < β 2 < 2 b k , π r R R * θ < 0 , showing that reducing θ increases the retailer’s profit. Consequently, the retailer will voluntarily decrease its revenue retention ratio to share benefits with the supplier. □

References

  1. Regattieri, A.; Gamberi, M.; Manzini, R. Traceability of food products: General framework and experimental evidence. J. Food Eng. 2007, 81, 347–356. [Google Scholar] [CrossRef]
  2. Aung, M.M.; Chang, Y.S. Traceability in a food supply chain: Safety and quality perspectives. Food Control 2014, 39, 172–184. [Google Scholar] [CrossRef]
  3. Resende-Filho, M.A.; Hurley, T.M. Information asymmetry and traceability incentives for food safety. Int. J. Prod. Econ. 2012, 139, 596–603. [Google Scholar] [CrossRef]
  4. Saberi, S.; Kouhizadeh, M.; Sarkis, J.; Shen, L. Blockchain technology and its relationships to sustainable supply chain management. Int. J. Prod. Res. 2019, 57, 2117–2135. [Google Scholar] [CrossRef]
  5. Golan, E.; Krissoff, B.; Kuchler, F. Traceability in the US Food Supply: Economic Theory and Industry Studies; United States Department of Agriculture, Economic Research Service: Washington, DC, USA, 2004. [Google Scholar]
  6. Feng, H.; Wang, X.; Duan, Y.; Zhang, J.; Zhang, X. Applying blockchain technology to improve agri-food traceability A review of development methods, benefits and challenges. J. Clean. Prod. 2020, 260, 121031. [Google Scholar] [CrossRef]
  7. Dabbene, F.; Gay, P.; Tortia, C. Traceability issues in food supply chain management: A review. Biosyst. Eng. 2014, 120, 65–80. [Google Scholar] [CrossRef]
  8. Iyengar, G.; Saleh, F.; Sethuraman, J.; Wang, W. Blockchain Adoption in a Supply Chain with Manufacturer. Manag. Sci. 2023, 70, 6158–6178. [Google Scholar] [CrossRef]
  9. Opara, L.U. Traceability in agriculture and food supply chain: A review of basic concepts, technological implications, and future prospects. Eur. J. Oper. Res. 2003, 1, 101–106. [Google Scholar]
  10. Zhou, X.Y.; Pullman, M.; Xu, Z.D. The impact of food supply chain traceability on sustainability. Oper. Manag. Res. 2021, 15, 93–115. [Google Scholar] [CrossRef]
  11. Zhang, A.; Mankad, A.; Ariyawardana, A. Establishing confidence in food safety: Is traceability a solution? J. Consum. Prot. Food Saf. 2020, 15, 99–107. [Google Scholar] [CrossRef]
  12. Angulo, A.M.; Gil, J.M. Consumer willingness to pay for traceable meat. Agric. Econ. 2007, 37, 219–230. [Google Scholar]
  13. Dickinson, D.L.; Bailey, D. Meat Traceability: Are U.S. consumers willing to pay for it. J. Agric. Resour. Econ. 2002, 27, 348–364. [Google Scholar]
  14. Wang, F.; Zhang, J.; Mu, W.; Fu, Z.; Zhang, X. Consumers’ perception toward quality and safety of fishery products, Beijing, China. Food Control 2009, 20, 918–922. [Google Scholar] [CrossRef]
  15. Jin, S.S.; Zhang, Y.; Xu, Y.N. Amount of information and the willingness of consumers to pay for food traceability in China. Food Control 2017, 77, 163–170. [Google Scholar] [CrossRef]
  16. Hobbs, J.E. Traceability and supply chain coordination in the agri-food sector. Annu. Rev. Resour. Econ. 2020, 12, 225–246. [Google Scholar]
  17. Manos, B.; Manikas, I. Traceability in the Greek fresh produce sector drivers and constraints. Br. Food J. 2010, 112, 640–652. [Google Scholar] [CrossRef]
  18. Opara, L.; Mazaud, F. Food traceability from field to plate. Outlook Agric. 2001, 30, 239–247. [Google Scholar] [CrossRef]
  19. Stranieri, S.; Orsi, L.; Banterle, A. Traceability and risks an extended transaction cost perspective. Supply Chain. Manag. Int. J. 2017, 22, 145–159. [Google Scholar] [CrossRef]
  20. Mcentire, J.; Arens, S.; Bernstein, M.; Bugusu, B.; Busta, F.; Cole, M.; Davis, A.; Fisher, W.; Geisert, S.; Jensen, H.; et al. Traceability (Product Tracing) in Food Systems: An IFT report submitted to the FDA, volume 1: Technical aspects and recommendations. Compr. Rev. Food Sci. Food Saf. 2010, 9, 159–175. [Google Scholar]
  21. Zhong, J.; Cheng, H.; Jia, F. Adoption decision of agricultural product traceability system in small and micro enterprises. Ind. Manag. Data Syst. 2024, 124, 1263–1298. [Google Scholar] [CrossRef]
  22. Heyder, M.; Theuvsena, L.; Hollmann-Hespos, T. Investments in tracking and tracing systems in the food industry: A PLS analysis. Food Policy 2012, 37, 102–113. [Google Scholar] [CrossRef]
  23. Mattevi, M.; Jones, J.A. Traceability in the food supply chain Awareness and attitudes of UK Small and Medium-sized Enterprises. Food Control 2016, 64, 120–127. [Google Scholar] [CrossRef]
  24. Cui, Y.; Gaur, V.; Liu, J.C. Supply Chain Transparency and Blockchain Design. Manag. Sci. 2023, 70, 3245–3263. [Google Scholar] [CrossRef]
  25. Yang, M.D.; Min, S.; Qing, P. Consumer Preferences and Willingness to Pay for A Blockchain-Based Food Traceability System: A Case Study of Fresh Pork in China. J. Consum. Prot. Food Saf. 2025, 20, 19–28. [Google Scholar] [CrossRef]
  26. Duong, C.D.; Nguyen, T.H.; Ngo, T.V.N.; Tran, Q.Y.; Nguyen, M.H.; Pham, T.T.P. How does Blockchain-Based Food Traceability System Drive Consumers’ Repurchase and Word-of-Mouth Intentions toward Organic Food: A Curvilinear Role of Producer-Retailer (in) Congruence. Asia Pac. J. Mark. Logist. 2025, 37, 1357–1383. [Google Scholar] [CrossRef]
  27. Resende-Filho, M.A.; Buhr, B.L. A principal-agent model for evaluating the economic value of a traceability system A case study with injection-site lesion control in fed cattle. Am. J. Agric. Econ. 2008, 90, 1091–1102. [Google Scholar] [CrossRef]
  28. Zheng, Y.; Xu, Y.; Qiu, Z. Blockchain traceability adoption in agricultural supply chain coordination: An evolutionary game analysis. Agriculture 2023, 13, 184. [Google Scholar] [CrossRef]
  29. Song, Y.; Lv, C.; Liu, J. Quality and safety traceability system of agricultural products based on Multi-agent. J. Intell. Fuzzy Syst. 2018, 35, 2731–2740. [Google Scholar] [CrossRef]
  30. Shi, R.X.; Zhang, J.; Ru, J. Impacts of Power Structure on Supply Chains with uncertain demand. Prod. Oper. Manag. Soc. 2013, 22, 1232–1249. [Google Scholar] [CrossRef]
  31. Ghosh, D.; Shah, J. A comparative analysis of greening policies across supply chain structures. Int. J. Prod. Econ. 2012, 135, 568–583. [Google Scholar] [CrossRef]
  32. Ma, P.; Wang, H.; Shang, J. Supply chain channel strategies with quality and marketing effort-dependent demand. Int. J. Prod. Econ. 2013, 144, 572–581. [Google Scholar] [CrossRef]
  33. Gao, J.; Han, H.; Hou, L.; Wang, H. Pricing and effort decisions in a closed-loop supply chain under different channel power structures. J. Clean. Prod. 2016, 112, 2043–2057. [Google Scholar] [CrossRef]
  34. Li, M.; Mizuno, S.J. Dynamic pricing and inventory management of a dual-channel supply chain under different power structures. Eur. J. Oper. Res. 2022, 303, 273–285. [Google Scholar] [CrossRef]
  35. Vasileiou, M.; Kyrgiakos, L.S.; Kleisiari, C.; Lappas, P.; Tsinopoulos, C.; Kleftodimos, G.; Ntemou, A.; Kateris, D.; Moulogianni, C.; Vlontzos, G. Digital Transformation of Food Supply Chain Management Using Blockchain: A Systematic Literature Review Towards Food Safety and Traceability. Bus. Inf. Syst. Eng. 2025; advance online publication. [Google Scholar] [CrossRef]
  36. Lumineau, F.; Shang, G.; Swaminathan, J.M.; Tsoukalas, G.; Wagner, S.M.; Zhao, J.L. Charting the Future of Blockchain in Operations and Supply Chain Management: Opportunities and Challenges. J. Oper. Manag. 2025, 71, 886–892. [Google Scholar] [CrossRef]
  37. Canavari, M.; Centonze, R.; Hingley, M.; Spadoni, R. Traceability as part of competitive strategy in the fruit supply chain. Br. Food J. 2010, 112, 171–186. [Google Scholar] [CrossRef]
  38. Pan, K.; Lai, K.; Leung, S.C.; Xiao, D. Revenue-sharing versus wholesale price mechanisms under different channel. Eur. J. Oper. Res. 2010, 203, 532–538. [Google Scholar] [CrossRef]
  39. Choi, T.M.; Li, Y.J.; Xu, L. Channel leadership, performance and coordination in closed loop. Int. J. Prod. Econ. 2013, 146, 371–380. [Google Scholar] [CrossRef]
  40. Chen, J.X.; Liang, L.; Yang, F. Cooperative quality investment in outsourcing. Int. J. Prod. Econ. 2015, 162, 174–191. [Google Scholar] [CrossRef]
  41. Keskin, N.B.; Li, C.H.; Song, J.S. The Blockchain Newsvendor: Value of Freshness Transparency and Smart Contracts. Manag. Sci. 2024, 71, 6666–6682. [Google Scholar] [CrossRef]
  42. Hobbs, J.E.; Bailey, D.; Dickinson, D.L.; Haghiri, M. Traceability in the Canadian red meat sector: Do consumers care? Can. J. Agric. Econ. 2005, 53, 47–65. [Google Scholar] [CrossRef]
  43. Zhang, C.P.; Bai, J.F.; Wahl, T.I. Consumers’ willingness to pay for traceable pork, milk, and cooking oil in Nanjing, China. Food Control 2012, 27, 21–28. [Google Scholar] [CrossRef]
  44. Ma, P.; Wang, H.; Shang, J. Contract Design for Two-Stage Supply Chain Coordination: Integrating Manufacturer-Quality and Retailer-Marketing Efforts. Int. J. Prod. Econ. 2013, 146, 745–755. [Google Scholar] [CrossRef]
  45. Xue, W.; Xu, Z. The impacts of government subsidies and consumer preferences on food supply chain traceability under different power structures. Sustainability 2023, 15, 470. [Google Scholar] [CrossRef]
  46. Fan, Z.P.; Wu, X.Y.; Cao, B.B. Considering the traceability awareness of consumers: Should the supply chain adopt the blockchain technology? Ann. Oper. Res. 2022, 309, 837–860. [Google Scholar] [CrossRef]
  47. Vriezen, R.; Plishka, M.; Cranfield, J. Consumer willingness to pay for traceable food products: A scoping review. Br. Food J. 2023, 125, 1631–1665. [Google Scholar] [CrossRef]
  48. Cui, Y.; Hu, M.; Liu, J. Values of Traceability in Supply Chains. Manuf. Serv. Oper. Manag. 2020, 22, 1–18. [Google Scholar] [CrossRef]
  49. Morgan, R.; Doran, D.; Morgan, S.J. Strong contracts: The relationship between power and action. Int. J. Oper. Prod. Manag. 2018, 38, 272–294. [Google Scholar] [CrossRef]
  50. Shou, Y.; Zhao, X.; Dai, J.; Xu, D. Matching traceability and supply chain coordination: Achieving operational innovation for superior performance. Transp. Res. Part E Logist. Transp. Rev. 2021, 145, 102181. [Google Scholar] [CrossRef]
  51. Zhou, X.; Zhu, Q.; Xu, Z. The role of contractual and relational governance for the success of digital traceability: Evidence from Chinese food producers. Int. J. Prod. Econ. 2023, 255, 108659. [Google Scholar] [CrossRef]
Figure 1. Diagram of supply chain structure.
Sustainability 17 09460 g001
Figure 2. Effect of Consumer Traceability Preference β on Traceability Level.
Sustainability 17 09460 g002
Figure 3. Effect of Consumer Traceability Preference β on Supplier Profit.
Sustainability 17 09460 g003
Figure 4. Effect of Consumer Traceability Preference β on Retailer Profit.
Sustainability 17 09460 g004
Figure 5. Effect of Consumer Traceability Preference β on Supply Chain Profit.
Sustainability 17 09460 g005
Figure 6. Effect of Consumer Traceability Preference β on Cost-Sharing Coefficient.
Sustainability 17 09460 g006
Figure 7. Effect of Traceability Cost Coefficient k on Traceability Level.
Sustainability 17 09460 g007
Figure 8. Effect of Traceability Cost Coefficient k on Supplier Profit.
Sustainability 17 09460 g008
Figure 9. Effect of Traceability Cost Coefficient k on Retailer Profit.
Sustainability 17 09460 g009
Figure 10. Effect of Traceability Cost Coefficient k on Supply Chain Profit.
Sustainability 17 09460 g010
Figure 11. Effect of Traceability Cost Coefficient k on Cost-Sharing Coefficient.
Sustainability 17 09460 g011
Table 1. Model parameters and definitions.
SymbolDefinition
Decision variablewManufacturer’s unit wholesale price
pRetailer’s unit retail price
tTraceability level
Other parameters and variablescManufacturer’s unit production cost
kTraceability cost coefficient
aPotential market demand
bConsumer price sensitivity coefficient
β Consumer preference coefficient for traceable products
qMarket demand
C t Traceability cost
π s Manufacturer’s profit
π r Retailer’s profit
π s c Supply chain profit
SuperscriptNVertical Nash game
SManufacturer-dominated
RRetailer-dominated
Table 2. Comparison of various equalization results.
Equilibrium ResultsConditions
t t S * < t R * < t N * β < b k
t S * < t N * < t R * b k < β < 2 b k
w w R * < w N * < w S * β < b k
w N * < w R * < w S * b k < β < 2 b k 3
w N * < w S * < w R * 2 b k 3 < β < 2 b k
p p N * < p R * < p S * β < b k
p S * < p N * < p R * b k < β < 2 b k
q q S * < q R * < q N * β 2 < b k
q S * < q N * < q R * b k < β < 2 b k
π s π s R * < π s N * < π s S * β < b k
π s N * < π s R * < π s S * b k < β < 2 b k 3
π s N * < π s S * < π s R * 2 b k 3 < β < 2 b k
π r π r S * < π r N * < π r R * β < 2 b k
π s c π s c S * < π s c R * < π s c N * β < b k
π s c S * < π s c N * < π s c R * b k < β < 2 b k
Disclaimer/Publisher’s Note: The statements, opinions and data contained in all publications are solely those of the individual author(s) and contributor(s) and not of MDPI and/or the editor(s). MDPI and/or the editor(s) disclaim responsibility for any injury to people or property resulting from any ideas, methods, instructions or products referred to in the content.