Article

Innovative Design of PLA Sandbag–Fiber Mesh Composite Wind Fences and Synergistic Windbreak Performance

1
School of Soil and Water Conservation, Beijing Forestry University, Beijing 100083, China
2
Key Laboratory of State Forestry and Grassland Administration on Soil and Water Conservation, Beijing 100083, China
3
Pastoral Water Conservancy Science Research Institute, The Ministry of Water Resources, Hohhot 010020, China
4
Eco–Environmental Change and Integrated Management Field Observation and Research Station of Inner Mongolia, Yellow River Great Bend Region, Bayannur 015000, China
*
Author to whom correspondence should be addressed.
Sustainability 2025, 17(21), 9418; https://doi.org/10.3390/su17219418
Submission received: 16 September 2025 / Revised: 12 October 2025 / Accepted: 16 October 2025 / Published: 23 October 2025

Abstract

Wind and sand disaster prevention is a critical challenge for global environmental sustainability, with mechanical wind fences being key engineering measures. Current fences, including solid and permeable types, often struggle to balance environmental impact, windbreak efficiency, and stability. Solid fences provide effective sand control but have limited windbreak efficiency, while permeable fences improve airflow but require deep burial and are prone to erosion on uneven terrain. This study proposes a novel composite wind fence with a polylactic acid (PLA) sandbag base and a fiber mesh top, combining stability and permeability. We assessed windbreak performance using computational fluid dynamics simulations and verified results through wind tunnel experiments. Results show that the novel composite wind fence enhances windbreak efficiency and stability by optimizing airflow distribution, with the PLA sandbag base suppressing high–speed airflow and mesh fence weakening of leeward side vortices. Under wind speeds of 10 m/s, 18 m/s, and 28 m/s, the effective protection distance of the novel composite wind fence improved by 22.33% to 36.51%, 10.96% to 34.22%, and 0.94% to 28.98%, respectively, compared to single PLA and mesh wind fence. The optimal row spacing for the novel wind fences in three rows is 12 h when the incoming wind speed is 10 m/s, while the recommended spacings are 8 h and 6 h for wind speeds of 18 m/s and 28 m/s, respectively, ensuring continuous and effective protection. These findings present a novel wind fence technology with improved wind resistance, a more stable structure, and prolonged protective effects, offering an effective solution for environmental conservation initiatives aimed at preventing wind and sand disasters while promoting the sustainability of ecosystems.

1. Introduction

Wind erosion and sand burial are major environmental hazards in arid and semi–arid regions, posing significant threats to regional ecological security, transportation infrastructure, agricultural and pastoral production, and the sustainable livelihoods of local communities [1,2,3]. Effective prevention and control of wind and sand hazards are critical objectives in the establishment of sustainable ecological security systems [4,5]. With the deepening of ecological and environmental construction projects in China, desertification control efforts are progressively advancing, leading to increasing implementation challenges and growing demands for engineering and technical measures. In this context, wind fences serve as a key engineering measure for windbreak and sand fixation, with growing performance requirements [6,7,8]. The core function of wind fences is to alter the near–surface wind field structure, reduce wind speed, and weaken the sand transport capacity of the wind and sand flow, thereby achieving sand dune stabilization and preventing wind and sand hazards [9]. However, due to limitations in raw material resources, traditional grass–grid wind fences can no longer meet practical demands. At the same time, existing eco–friendly wind fences face application challenges, such as the rapid degradation of certain materials, leading to insufficient durability. Therefore, there is an urgent need to develop novel wind fence materials that combine both high windbreak efficiency and environmental sustainability.
In current windbreak and sand fixation engineering practices, commonly used wind fences are mainly classified into solid wind fences, such as clay, gravel, and sandbag wind fences, and permeable wind fences, such as grass–grid, straw, and nylon mesh wind fences. Biodegradable material wind fences, represented by polylactic acid (PLA), have emerged as a promising option in wind and sand control engineering across various regions worldwide, owing to their characteristics of environmental friendliness and the ability to utilize locally sourced materials for “sand–to–sand” solutions [10,11] (Figure 1a). Recent studies have examined the behavior of polylactic acid (PLA) materials, particularly with respect to their mechanical properties and biodegradability, further supporting their suitability for wind and sand control engineering [12,13,14]. However, as the airflow passes through the cylindrical structure of PLA wind fences, it follows a pattern similar to a streamlined form, resulting in minimal disturbance to the airflow. This leads to insufficient wind speed reduction near the surface, making it difficult to achieve the required effective protection distance. It is worth noting that some studies have attempted to enhance the protective performance of wind fences through winged designs [15], but these materials often lack degradability. Nevertheless, biodegradable PLA materials struggle to support the implementation of winged structures due to insufficient mechanical strength. Therefore, there is an urgent need to develop wind fences that combine environmental friendliness, structural stability, and high windbreak efficiency. Permeable wind fences offer significant advantages in regulating the near–surface wind field structure due to their excellent airflow permeability [16,17] (Figure 1b). However, their engineering installation requires considerable burial depth, and in areas with uneven terrain, they are prone to erosion due to insufficient ground contact.
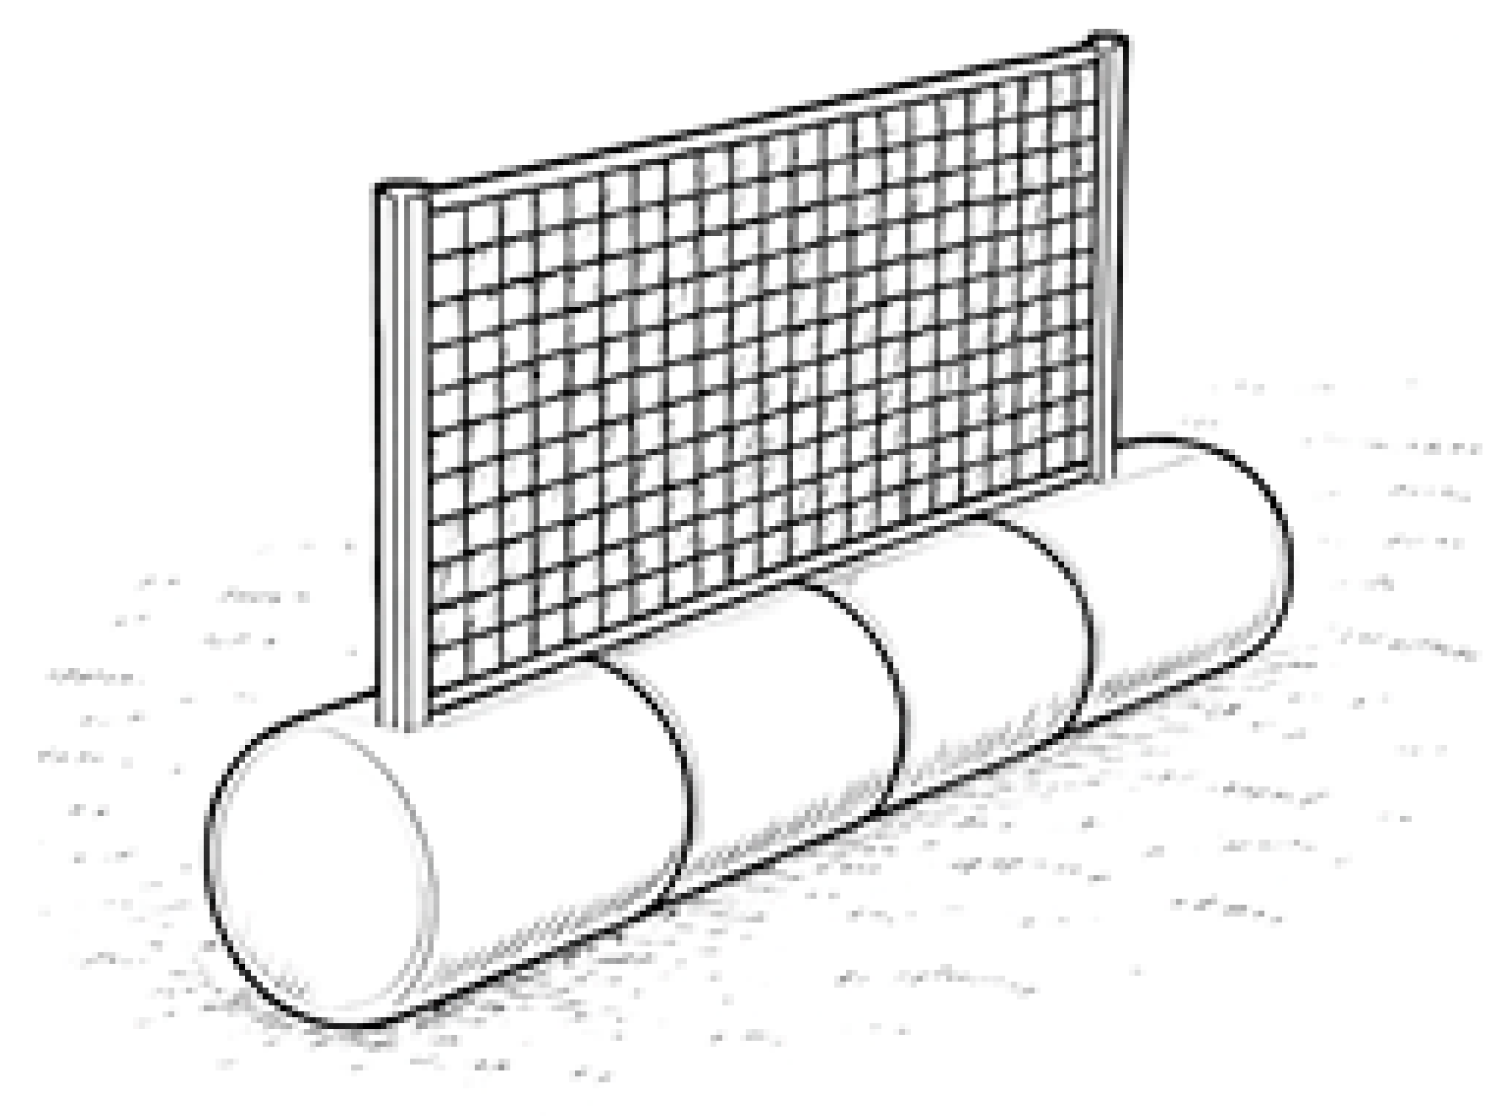
Therefore, this study proposes a novel composite wind fence, integrating the PLA sandbag at the base and biodegradable fiber mesh at the top. The aim is to strengthen windbreak and sand fixation efficiency while ensuring environmental sustainability and engineering practicability through structural optimization and innovation. The design concept is based on the synergistic integration of two types of sustainable wind fence materials, combining the structural stability of PLA sandbags with the permeability characteristics of fiber mesh. Specifically, the lower PLA sandbags provide stable base support, while the upper fiber mesh optimizes airflow structure and reduces vortex intensity. It is expected that this structure will synergistically leverage the stability and permeability advantages of biodegradable materials, enhancing the overall flow field structure. This approach not only provides a “sand–to–sand” solution by utilizing the flexibility and weight characteristics of PLA sandbags to allow the wind fence to closely conform to the ground but also achieves airflow regulation through the use of fiber mesh. This provides a sustainable technical approach for windbreak and sand fixation engineering, as well as the material usage cycle, ultimately resulting in superior overall protective performance. In terms of structural implementation, this study envisions directly inserting the fixed posts of the fiber mesh wind fence into the sandbag body. Compared to a single fiber mesh wind fence, which relies on deep burial to resist wind loads, this combination method provides vertical anchoring force through the weight of the sandbags (Figure 2). At the same time, the sand–filled sandbags enhance the lateral anchoring capacity by increasing the circumferential stress around the posts. This significantly improves the stability of the wind fence unit.
Analyzing how composite wind fence structures influence wind and sand flows, along with quantifying their windbreak performance, is essential for optimizing design. Field observations are limited by sparse measurement points and interference from multiple environmental factors, while wind tunnel experiments face constraints in parameter comprehensiveness. Computational Fluid Dynamics (CFD) simulations, with their high resolution for analyzing complex three–dimensional (3D) flow fields and efficient multi–parameter analysis, have become a powerful tool for studying the windbreak effects of wind fences [18]. CFD can accurately capture key fluid dynamics processes such as airflow separation, reattachment, and turbulence development around the wind fence, providing precise analysis of airflow movement mechanisms [19].
Given these considerations, the aim of this study is to utilize high–precision 3D CFD simulations to systematically investigate the wind field regulation mechanism of the “PLA sandbag–Fiber mesh” composite wind fence and quantitatively assess its windbreak performance. The specific objectives of this study are as follows: (1) construct and validate a numerical simulation model of the novel composite wind fence structure; (2) simulate and visualize the wind speed field, turbulence field, and flow field structure around wind fences, explaining its fluid dynamics mechanism for windbreak and sand fixation; (3) quantitatively calculate key wind field parameters such as windbreak efficiency and effective protection distance at critical locations; (4) evaluate the performance advantages of the novel composite wind fence over single–material wind fences through parameter comparisons and explore its windbreak mechanism; and (5) investigate the wind and sand flow dynamics and the underlying mechanical mechanisms, as well as the optimal inter–row spacing in a multi–row wind fence layout. The findings of this study will provide a novel wind fence technology with greater potential for application in wind and sand control projects, offering a solid theoretical foundation for its promotion and widespread use. This research will be of significant importance in enhancing the effectiveness of ecological wind fence construction and promoting sustainable management in sandy areas.

2. Research Methodology

2.1. Boundary Conditions and Computational Domain Setup

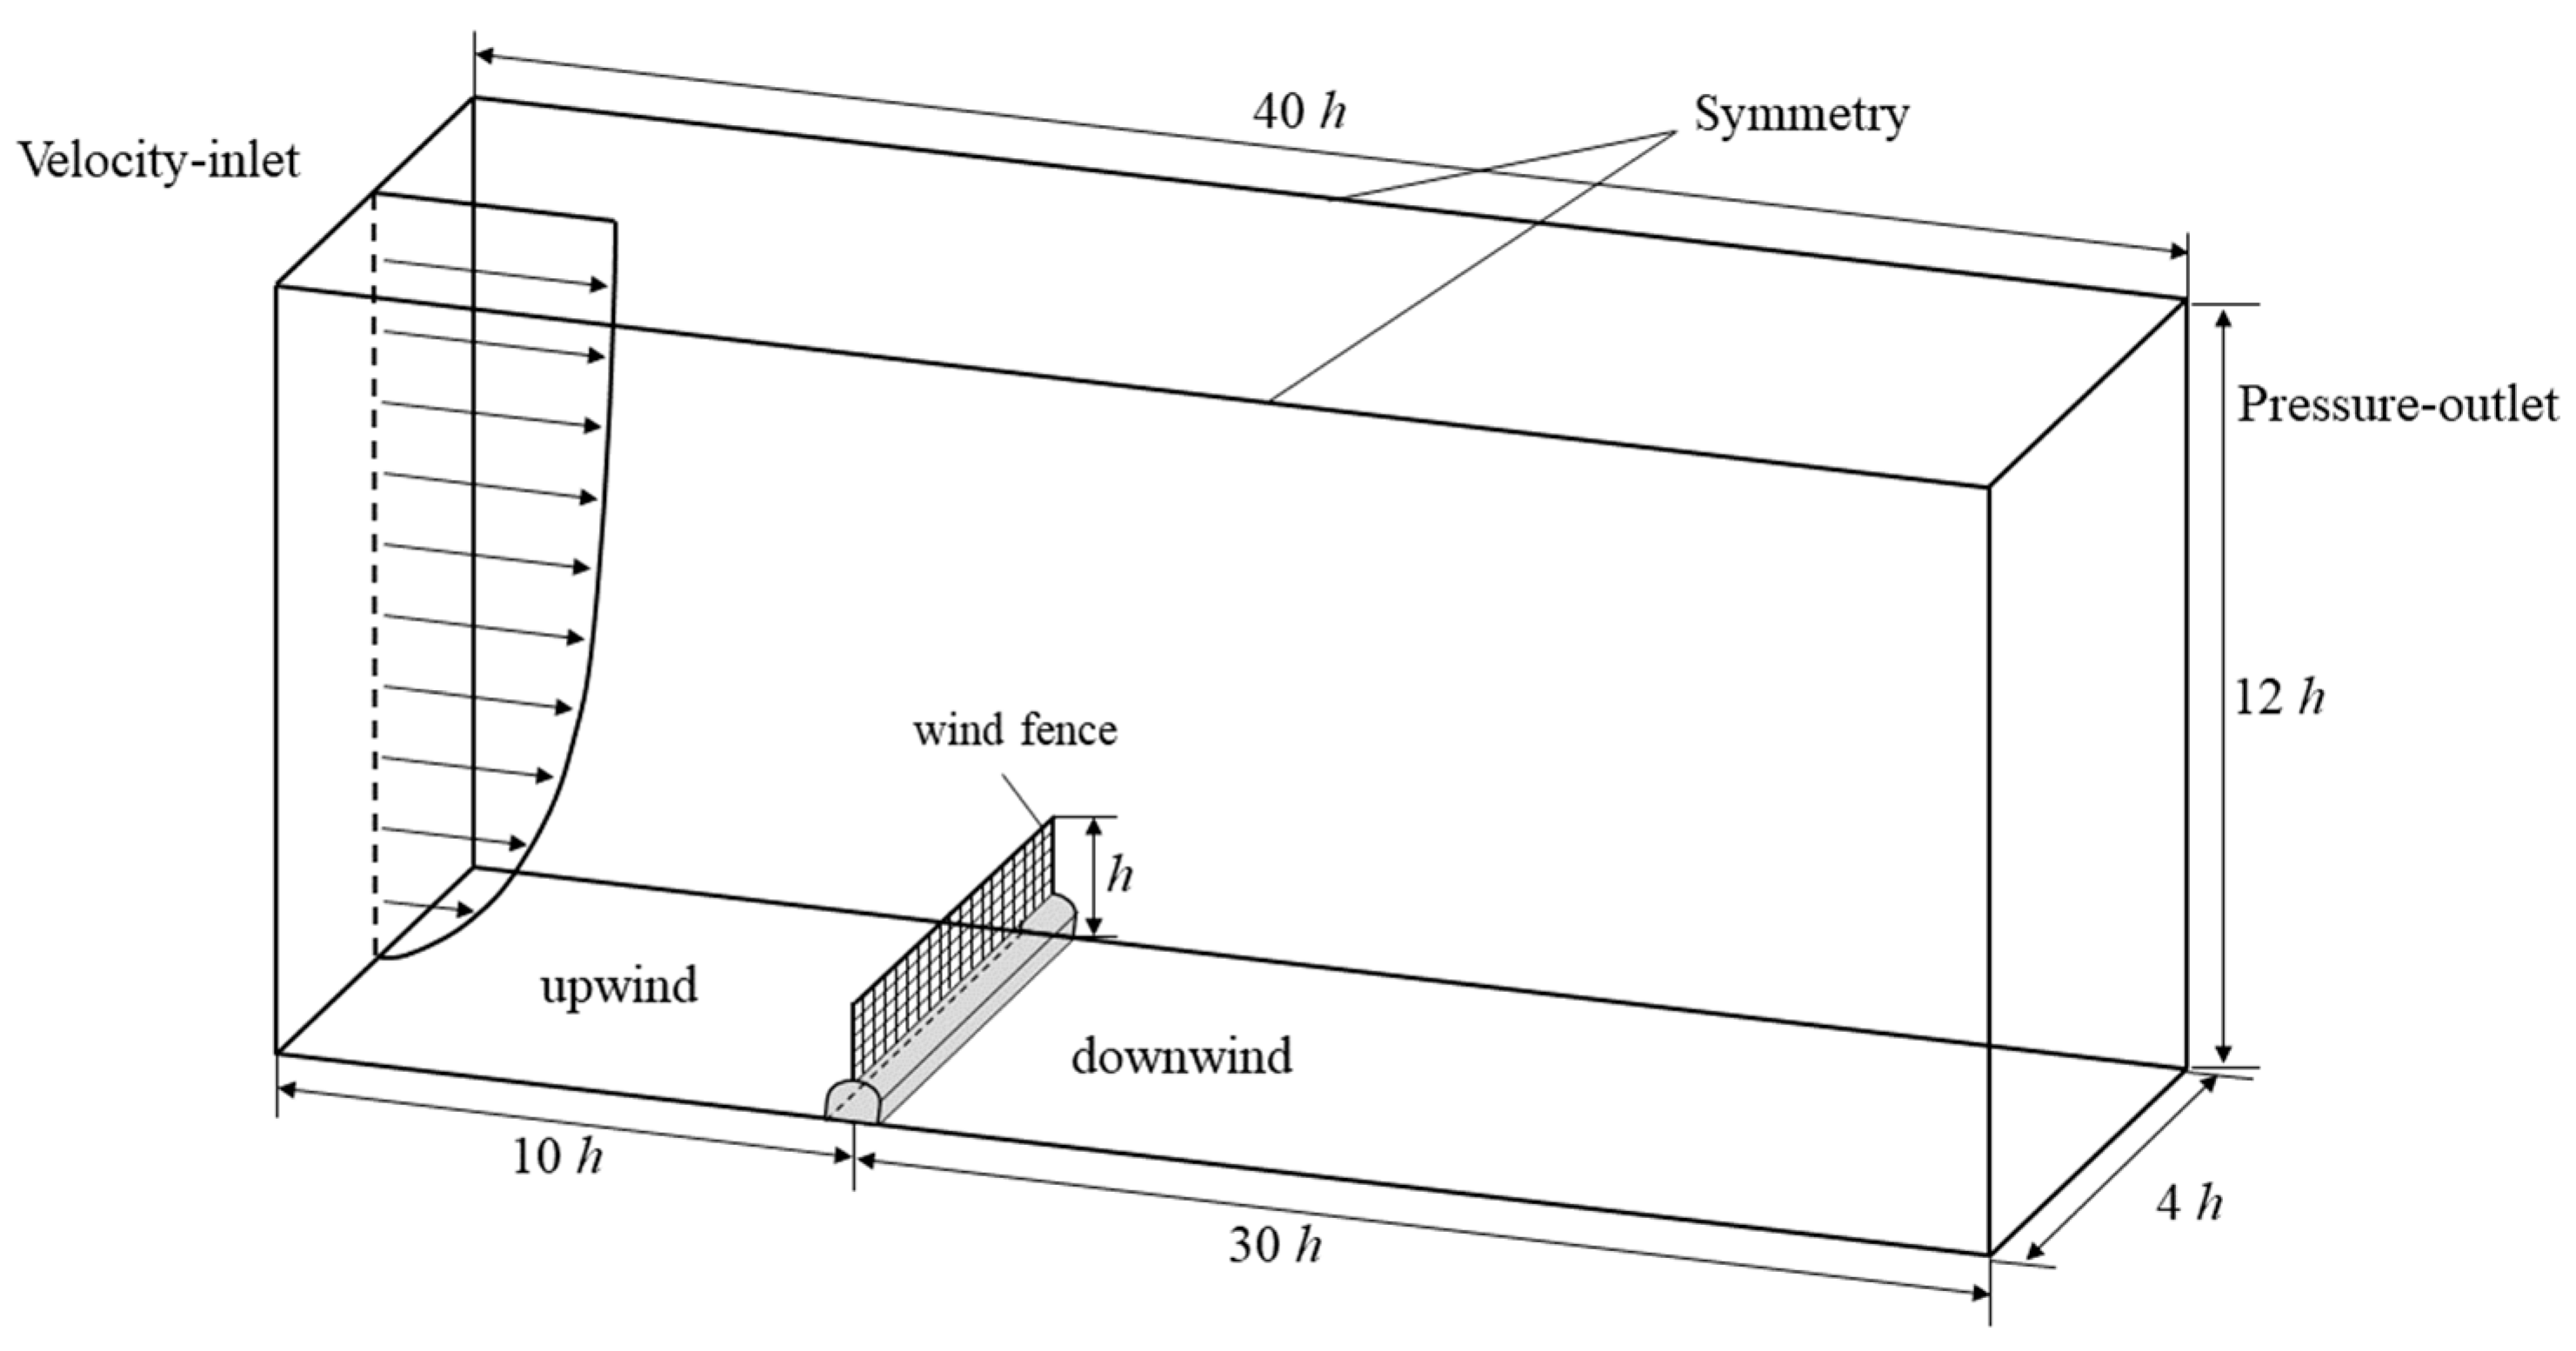
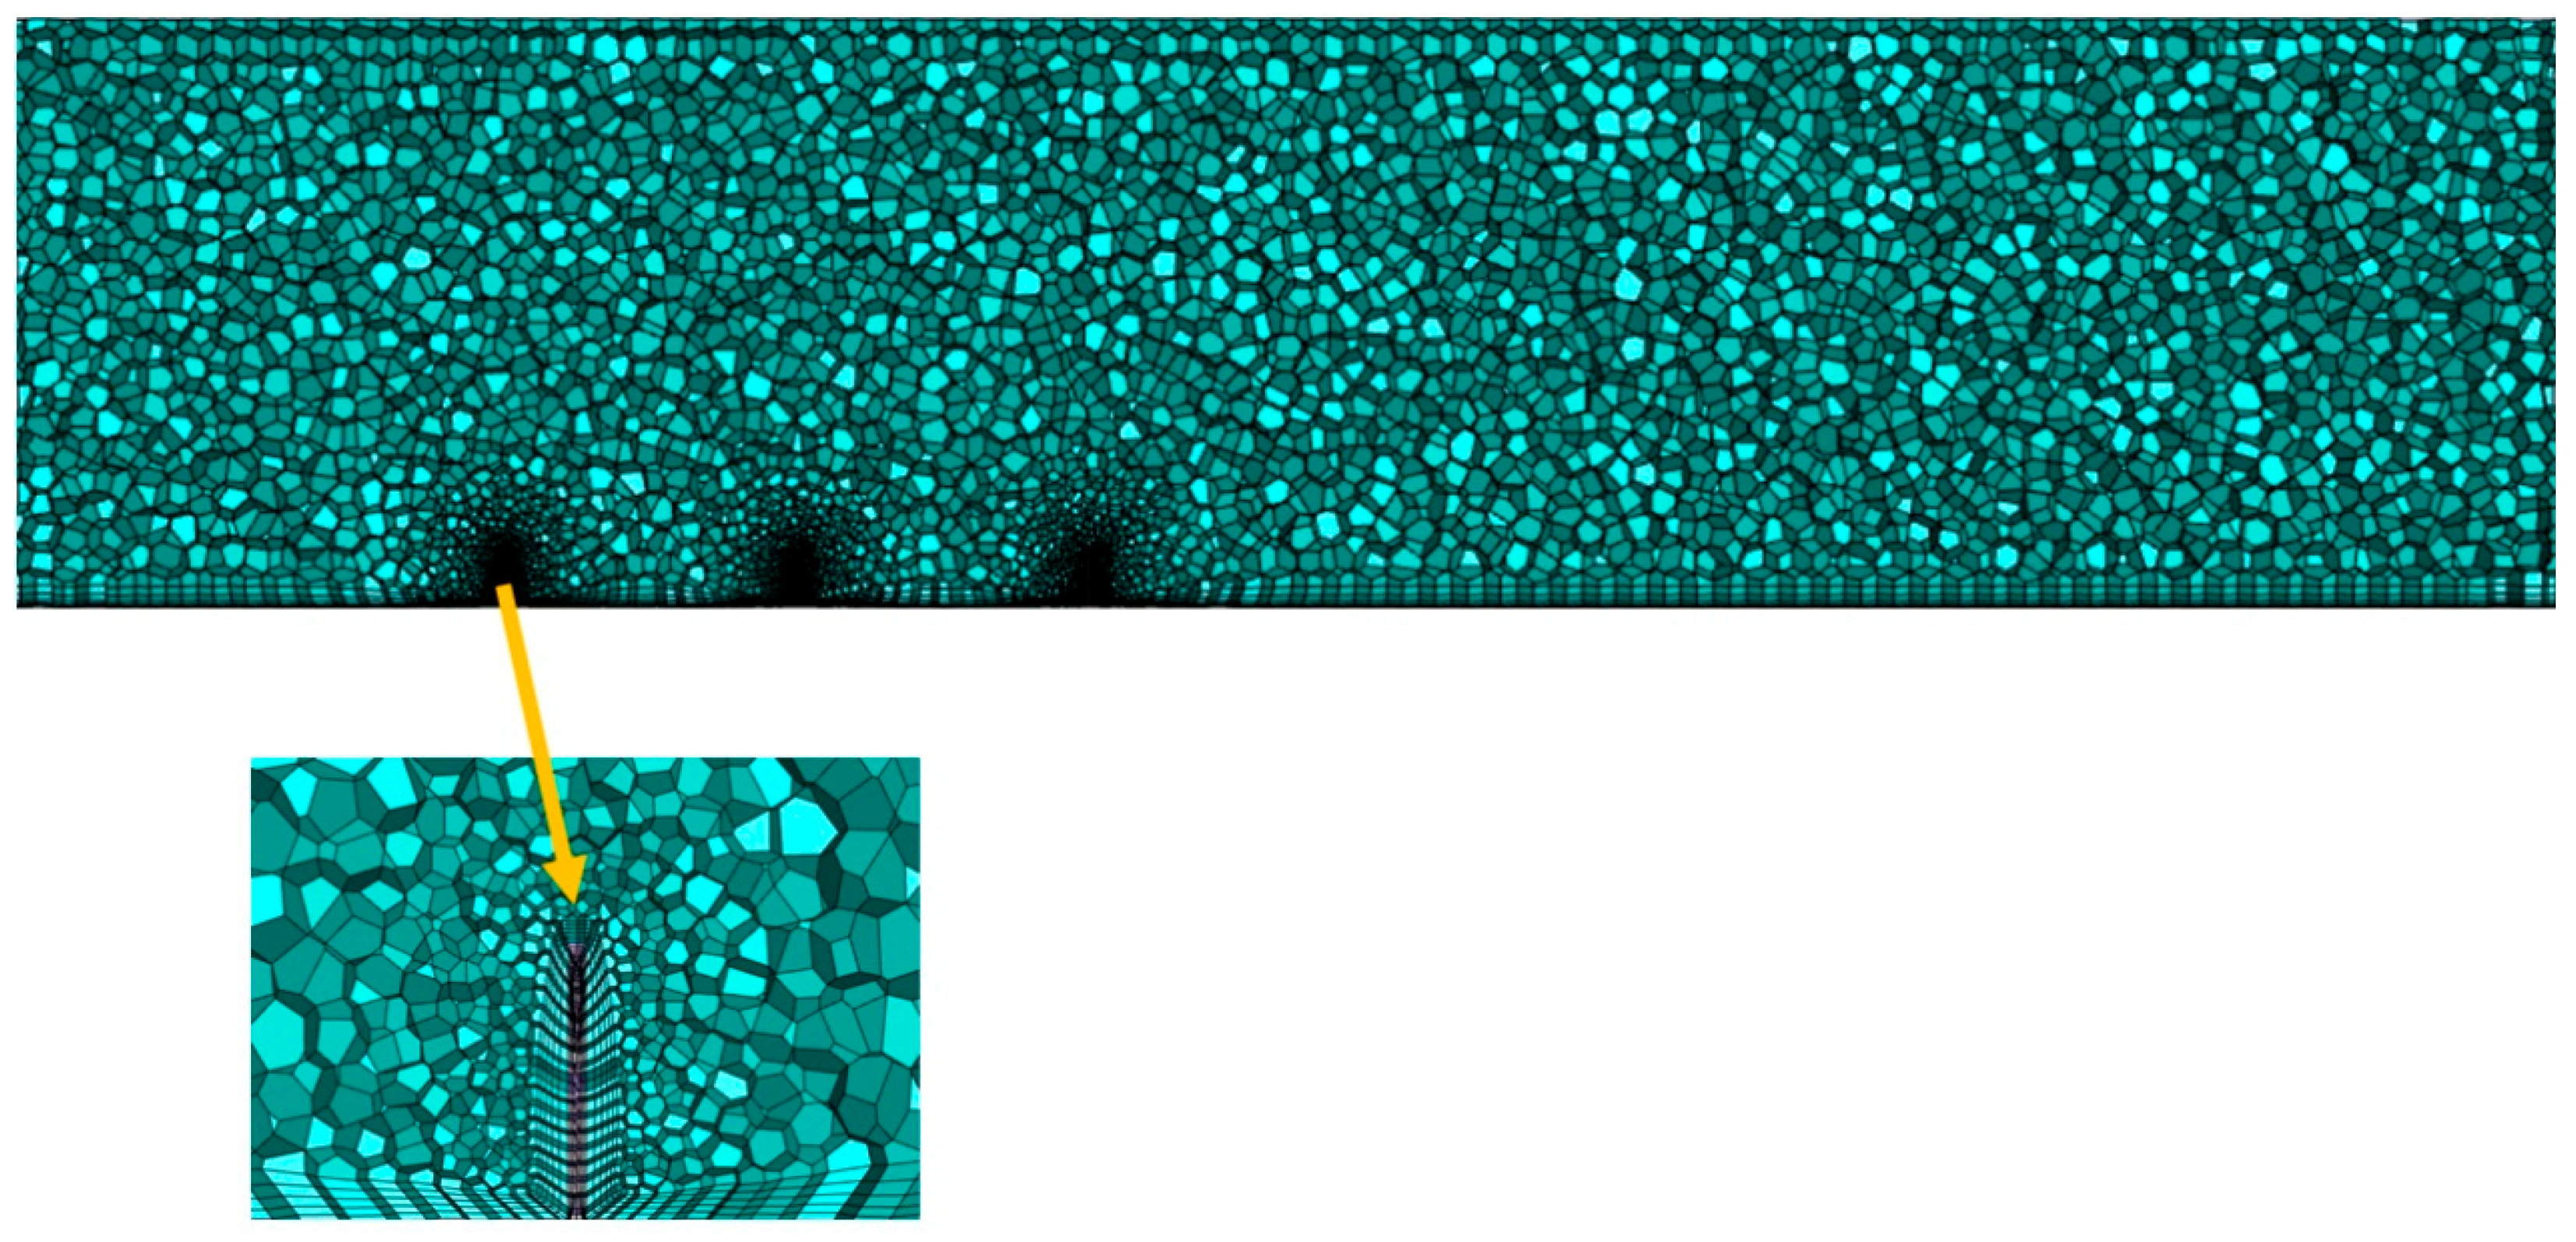
In this study, a flat sand surface flow field model was constructed using Spaceclaim. The computational domain is a 3D numerical wind tunnel, and we employed a 1:1 scale model for the simulations using Ansys Fluent 2020 R2 software to more accurately capture the impact of wind fences on wind and sand flow in real environments. The wind fence height is set at h = 0.3 m, with the computational domain having the following dimensions: height H = 12 h, width W = 4 h, and length L = 40 h. The left boundary of the domain is defined as a velocity inlet, the right boundary is defined as pressure outlet, the top surface is modeled as a no–slip boundary, and the front and rear boundaries are set as symmetry planes, with a zero–pressure gradient condition applied at the outlet, as shown in Figure 3. Computational mesh is generated using Fluent Meshing with polyhedral elements (Figure 4), and a grid independence test is performed, which includes three different grid schemes. The final mesh parameters are determined with a maximum cell size of 0.05 m, and a minimum cell size of 0.001 m. Local refinement is applied around both the obstacle surface and the ground, with five layers of boundary layer mesh, where the first layer thickness is 0.0003 m. The optimized global mesh consists of between 9 million and 18 million cells.
The velocity profile formula for the velocity inlet in the computational domain is as follows [20]:
u y u * = 1 κ l n y y 0
In the formula, u y represents the horizontal velocity at height y . The wind speeds at a height of 2 m are 10, 18, and 28 m/s in this study. u * is the friction velocity, κ = 0.4 is the von Kármán constant, y is the height above the ground, and y 0 represents the aerodynamic roughness of the underlying surface.
This study solves the Reynolds–Averaged Navier–Stokes (RANS) equations using CFD numerical simulations [21]. It is assumed that the airflow is incompressible and a non–Newtonian fluid, the atmospheric turbulent boundary layer is in a neutrally stable state, and the effects of heat and mass transfer are neglected. The turbulence model used is the Realizable kε model [22]. At the same time, the Enhanced Wall Treatment (EWT) model is used, which incorporates a modified boundary layer analysis theory to construct a refined near–wall flow solution framework in the simulation. The SIMPLEC algorithm is employed for pressure–velocity coupling, with gradient terms spatially reconstructed using the least–squares method. Both convection and diffusion terms are discretized using the third–order QUICK scheme. The iterative convergence criteria for the velocity and pressure fields are set to a residual threshold of 10−4, ensuring that the flow field solution meets the required accuracy. The specific parameters are shown in Table 1.

2.2. Model Setup

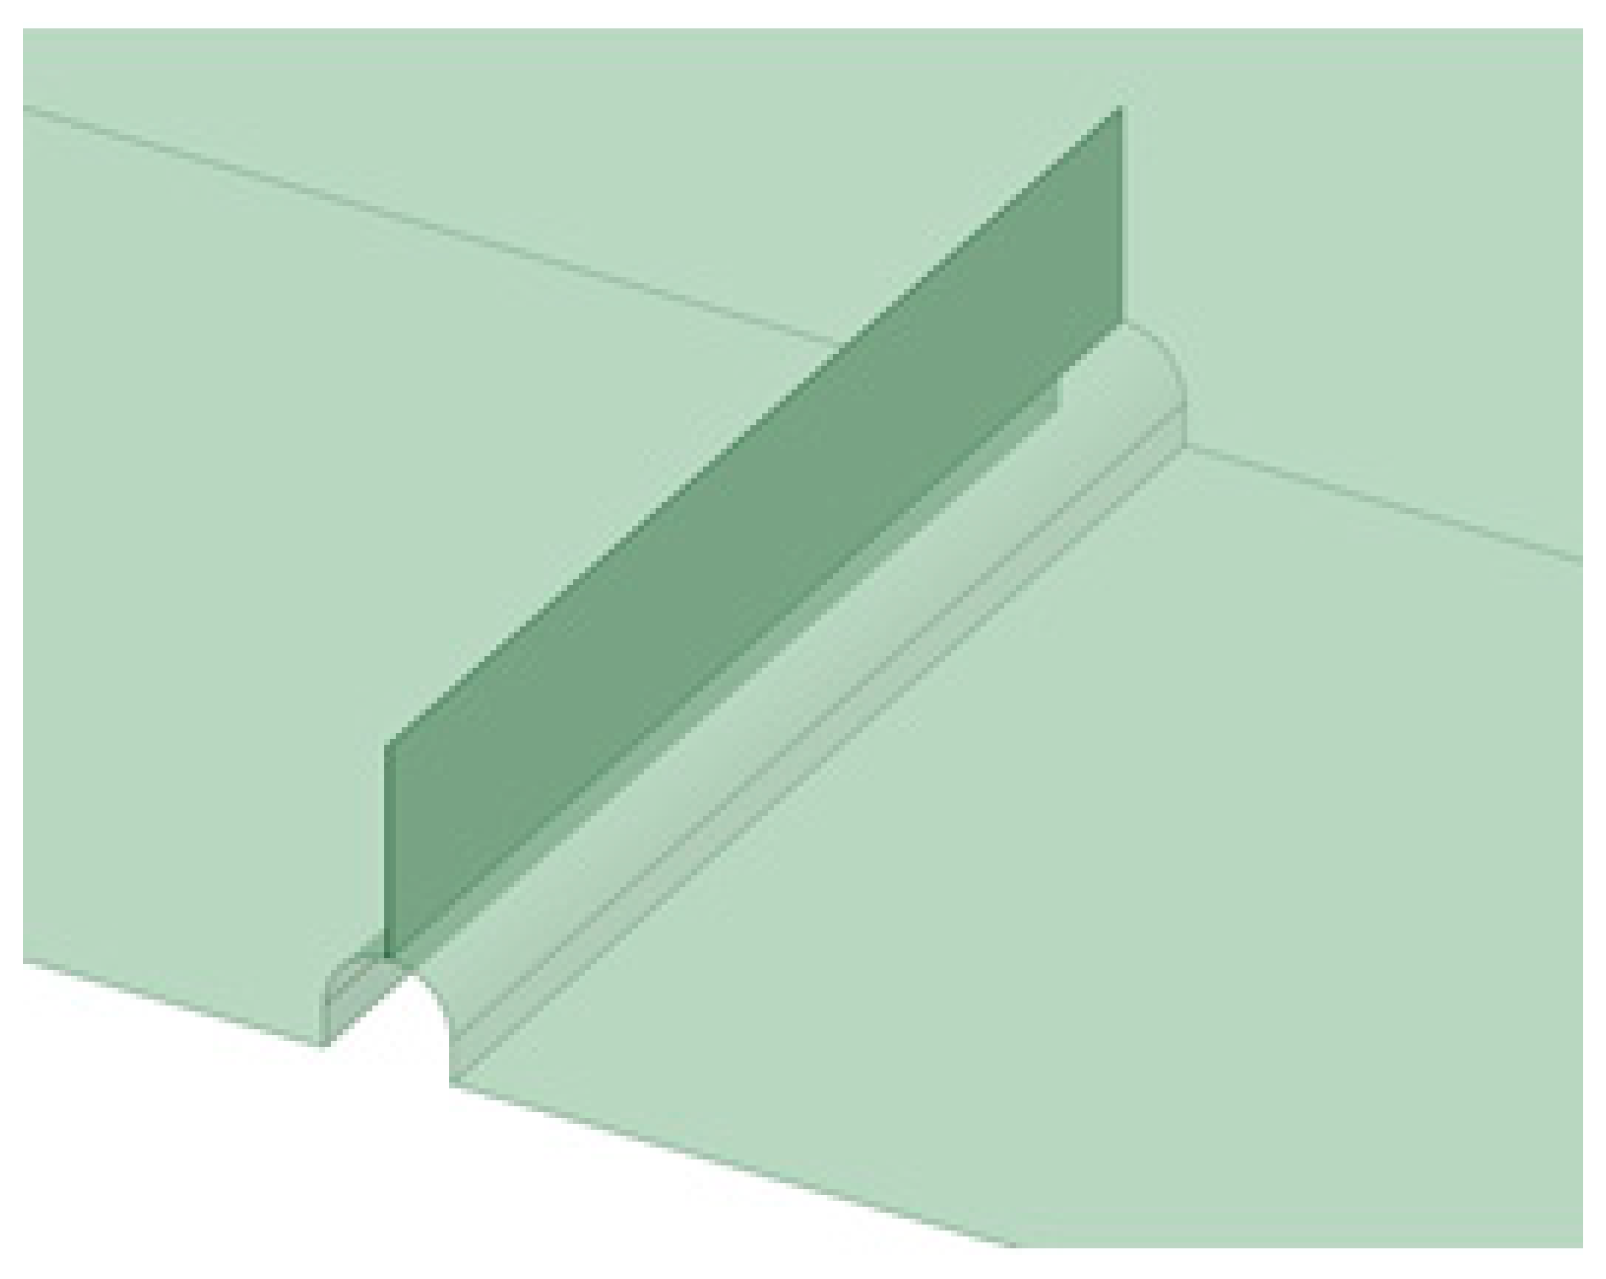
Permeable mesh wind fences offer effective wind and sand control but may face stability issues, while PLA sandbags provide structural stability but cause minimal disturbance to airflow. To address the limitations of traditional single–structure wind fences in practical applications, this study proposes a novel composite wind fence, comprising a sandbag base structure and a permeable mesh component. (Figure 5). This innovative design combines the features of two types of wind fence: the bottom 0.1 m of the sandbag forms a discrete roughness element array that induces flow separation at near–surface heights, and the 0.2 m permeable mesh above dissipates momentum according to the Darcy–Weisbach model.
Based on our previous research, we found that the coupling effect between the porosity of the permeable mesh wind fence and the incoming wind speed has a significant impact on the effective protection distance. Under the same wind speed conditions, the effective protection distance of the wind fence initially increases and then decreases as porosity increases. As the wind speed rises, the optimal porosity for the permeable mesh wind fence continuously decreases. Therefore, this study selects three threshold wind speeds of 10 m/s for moderate wind, 18 m/s for strong wind, and 28 m/s for extreme wind, with each speed corresponding to optimal porosities of 45%, 25% and 15% for the permeable mesh wind fence [23]. These conditions are used to further investigate the windbreak and sand fixation performance of the novel composite wind fence. The variations in wind speed at three vertical heights of 0.05 m, 0.10 m, and 0.15 m were analyzed to investigate the impact of the novel composite wind fence on changes in the flow field.

2.3. The Evaluation Parameters for Windbreak Performance of Wind Fences

2.3.1. Effective Protection Distance

The effective protection distance (Ds) is used to quantitatively evaluate the windbreak efficiency of wind fences. It is generally defined as the distance over which the wind speed decreases from the threshold wind speed (Ut) to a value greater than zero. In practical applications, a reasonably effective protection distance ensures both effective wind and sand control while minimizing economic costs. Based on previous research, Ut is defined in this study as the wind speed at a height of 2 m that decreases to 5 m/s, a widely accepted standard [24].

2.3.2. Windbreak Efficiency

Windbreak efficiency is an important indicator for evaluating the wind protection effectiveness of wind fences. In this study, considering that the boundary conditions can affect wind speed, we calculate the horizontal wind speed at different heights of the vertical plane. Windbreak efficiency refers to the difference in wind speed measured under the same conditions for bare sand and the wind fence configuration. It is calculated by the ratio of the difference between the horizontal wind speed of bare sand ( v k j ) and the horizontal wind speed under the wind fence configuration ( v k i j ) to the horizontal wind speed of bare sand. The formula is as follows [25]:
E k i j = v k j v k i j v k j × 100 %
In the formula, E k i j represents the windbreak efficiency at the coordinate point ( i , j ) under the k wind speed. v k j and v k i j are the measured average wind speeds (m/s) at the same height on the bare sand surface and under the wind fence configuration, respectively.

2.3.3. Turbulence Kinetic Energy

Turbulent kinetic energy (TKE) is a fundamental physical quantity used to characterize the intensity of turbulent fluctuations. It represents the time–averaged statistical measure of the turbulent fluctuation kinetic energy per unit mass of the fluid, and its physical definition is derived from the Reynolds decomposition [26]:
T K E = 1 2 μ 2 ¯ + ϑ 2 ¯ + ω 2 ¯
In the equation, μ 2 ¯ , ϑ 2 ¯ , ω 2 ¯ represent the components of the Reynolds normal stress, corresponding to the variances of the streamwise, lateral, and vertical fluctuating velocities, respectively.
In this study, the TKE values are directly obtained through numerical simulation software. This indicator quantifies the energy scale of turbulent vortices and directly reflects the energy exchange and dissipation characteristics of the flow field around the wind fence. By analyzing the spatial distribution of TKE, it is possible to identify zones of intense turbulent mixing, energy transport pathways, and key dynamic zones for particle entrainment. This provides a physical basis for assessing the impact mechanism of wind fence structures on wind and sand transport.

2.4. CFD Model Validation

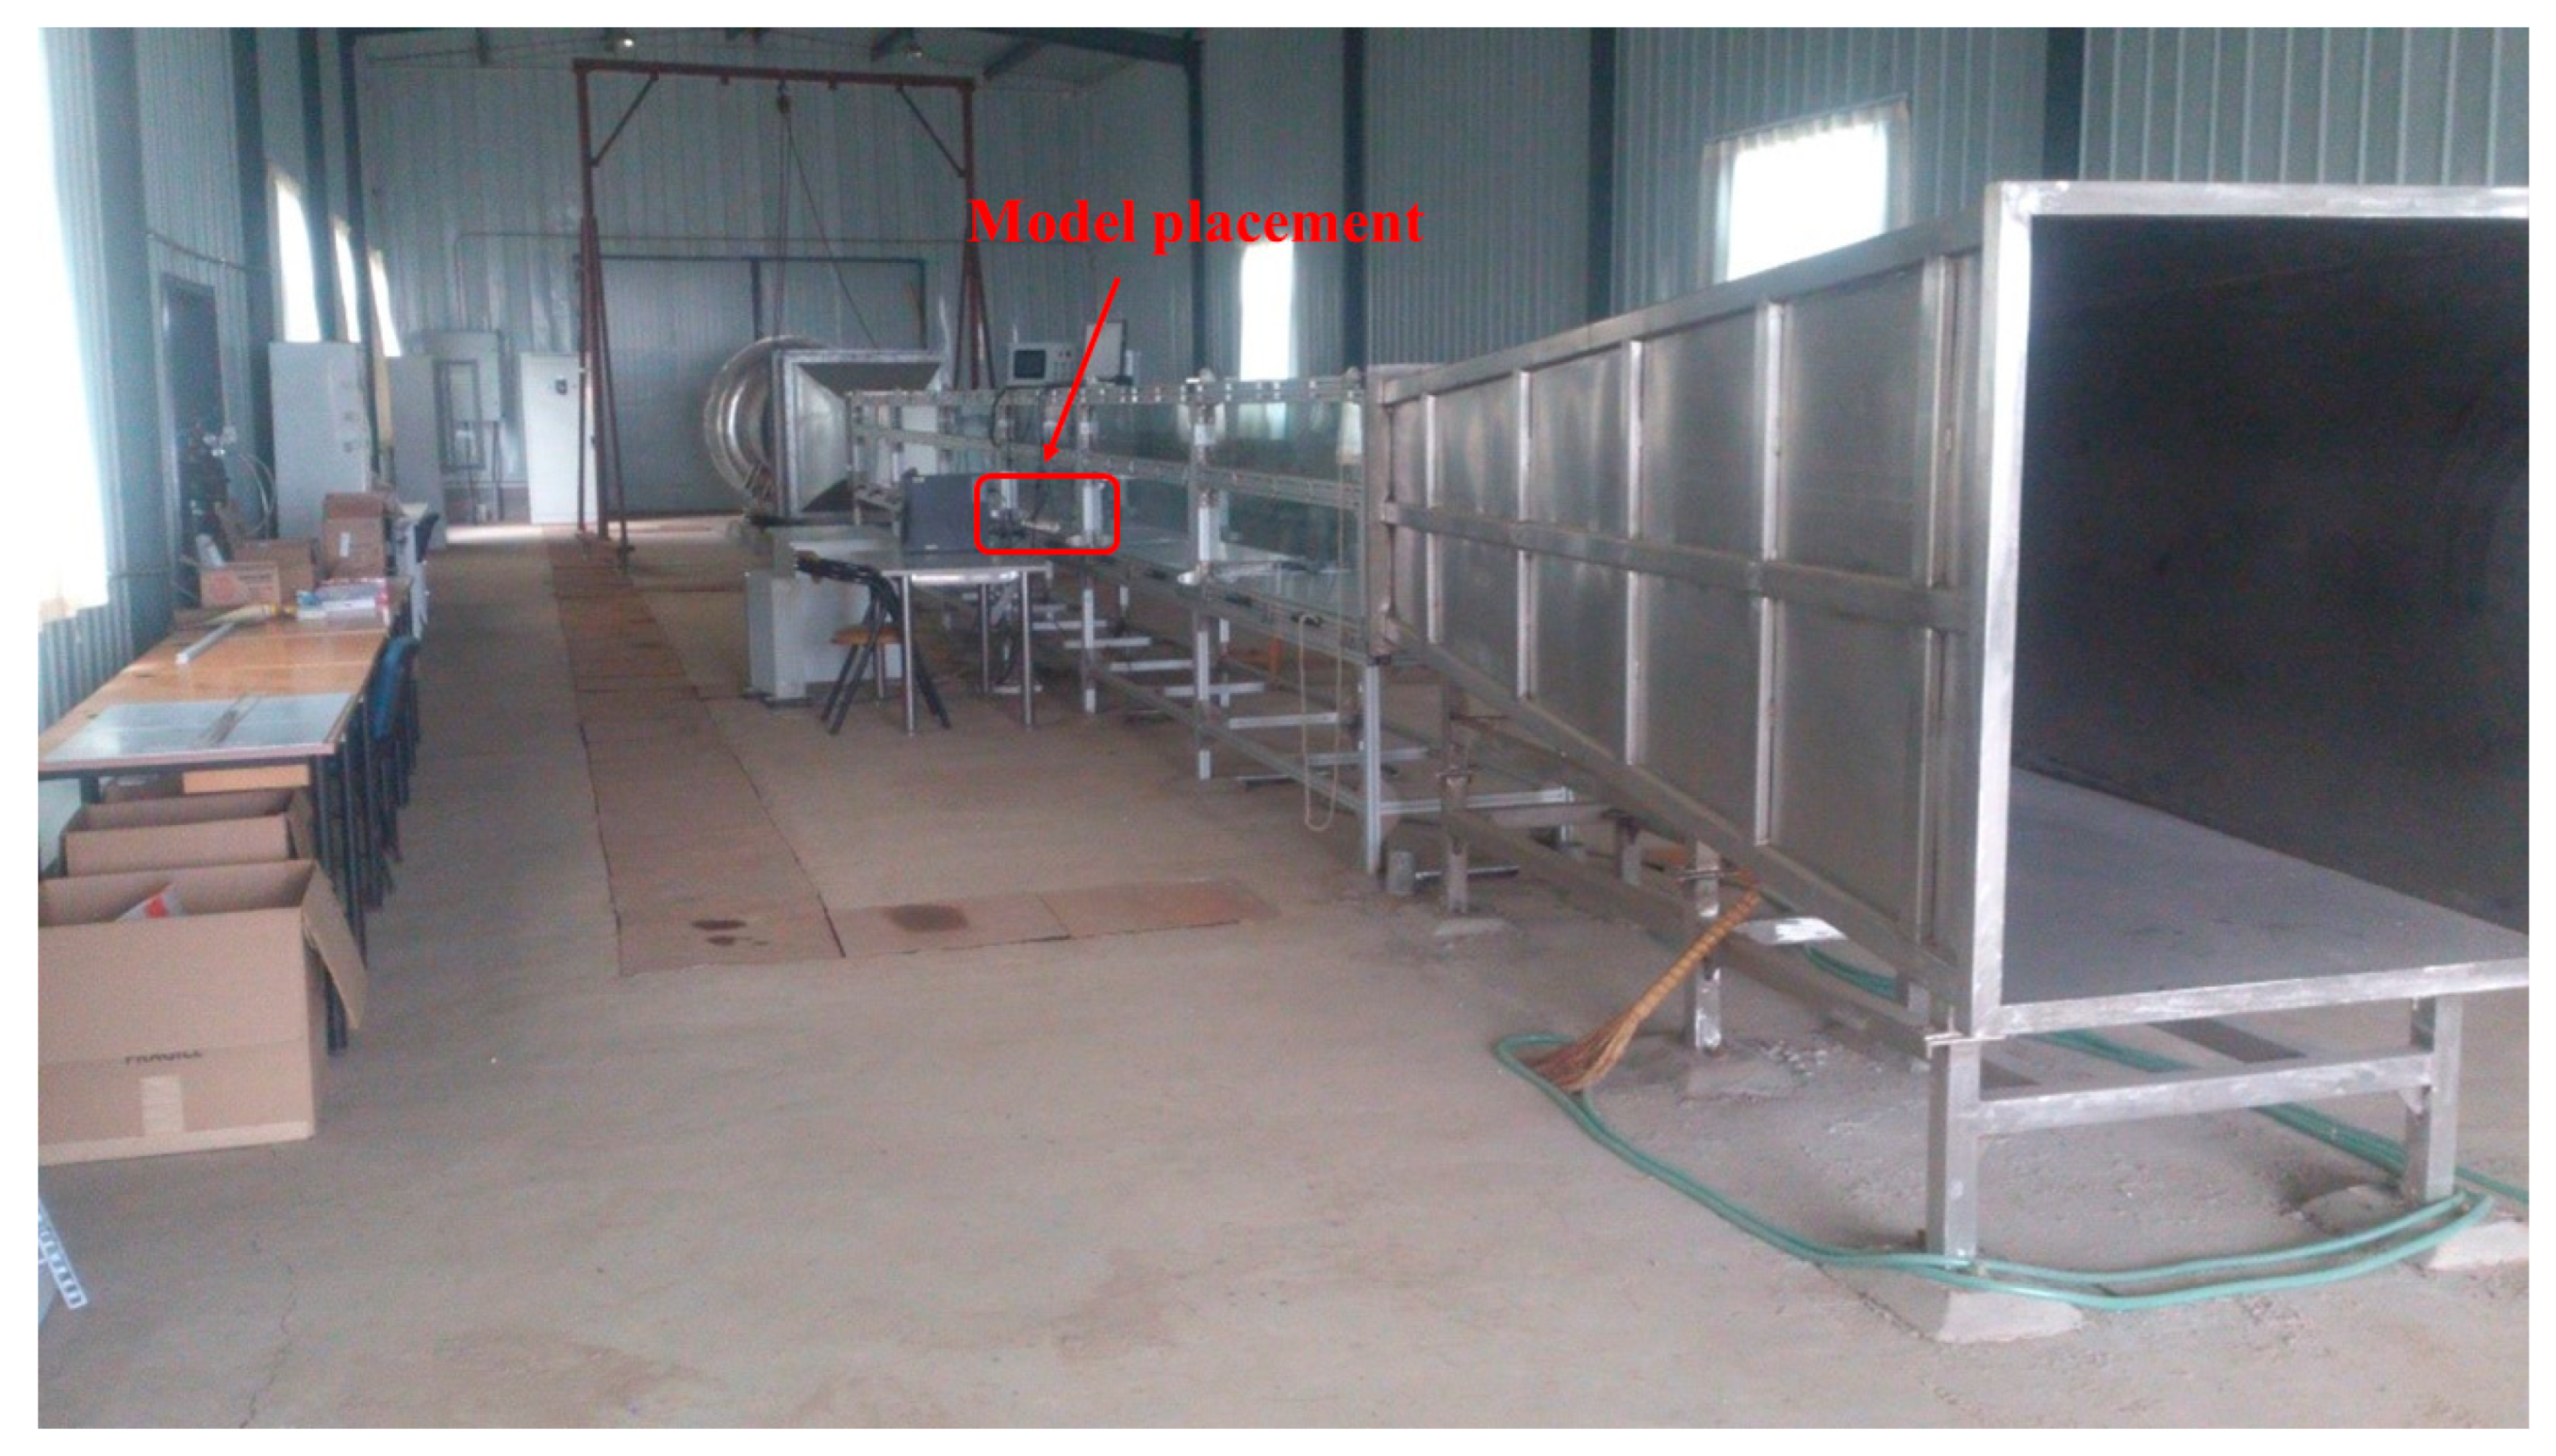
The accuracy of the numerical simulation is validated by comparing the simulated velocity results with wind tunnel measurements. The wind tunnel experiments were conducted at the Jiufeng Wind and Sand Physics Laboratory of Beijing Forestry University. The wind tunnel has a total length of 24 m, divided into the following sections: a 1.5 m acceleration section, a 2.9 m fan section, a 0.9 m transition section, a 1.5 m turbulence section, a 1.5 m contraction section, a 12 m test section, and a 3.7 m diffusion section (Figure 6).
The cross–sectional dimensions of the wind tunnel test section were 0.6 m × 0.6 m, with turbulence intensity in the effective test section kept below 1.5%. The wind fence had an actual height of 0.3 m, and the model was scaled at a 1:10 ratio. Wind speed at a height of 0.2 m above the floor of the wind tunnel was set to 10, 18, and 28 m/s, ensuring that the conditions for geometric, kinematic, and dynamic similarity were met. Based on preliminary experimental results [23], three mesh wind fence cases were selected for validation: 10 m/s with a porosity of 45%, 18 m/s with a porosity of 25%, and 28 m/s with a porosity of 15%. The wind speed profiles at three positions, −5 h, 10 h, and 20 h, were compared with the results from numerical simulations (Figure 7).
At the x = −5 h section, the wind speed distribution obtained from the numerical simulation is in good agreement with the wind tunnel experimental results (R2 = 0.93). Although there is some deviation between the wind speed profiles at x = 10 h and x = 20 h compared to the experimental values, especially at heights above 2 h from the ground, our study focuses on the impact of the wind fence on the flow field below 2 h from the surface. Furthermore, these differences fall within the acceptable error range for engineering applications. The systematic validation conducted above demonstrates that the numerical simulations used in this study have high reliability and computational accuracy.

3. Results

3.1. Analysis of the Dynamic Differences Between Novel Composite Wind Fences and Single–Material Wind Fences

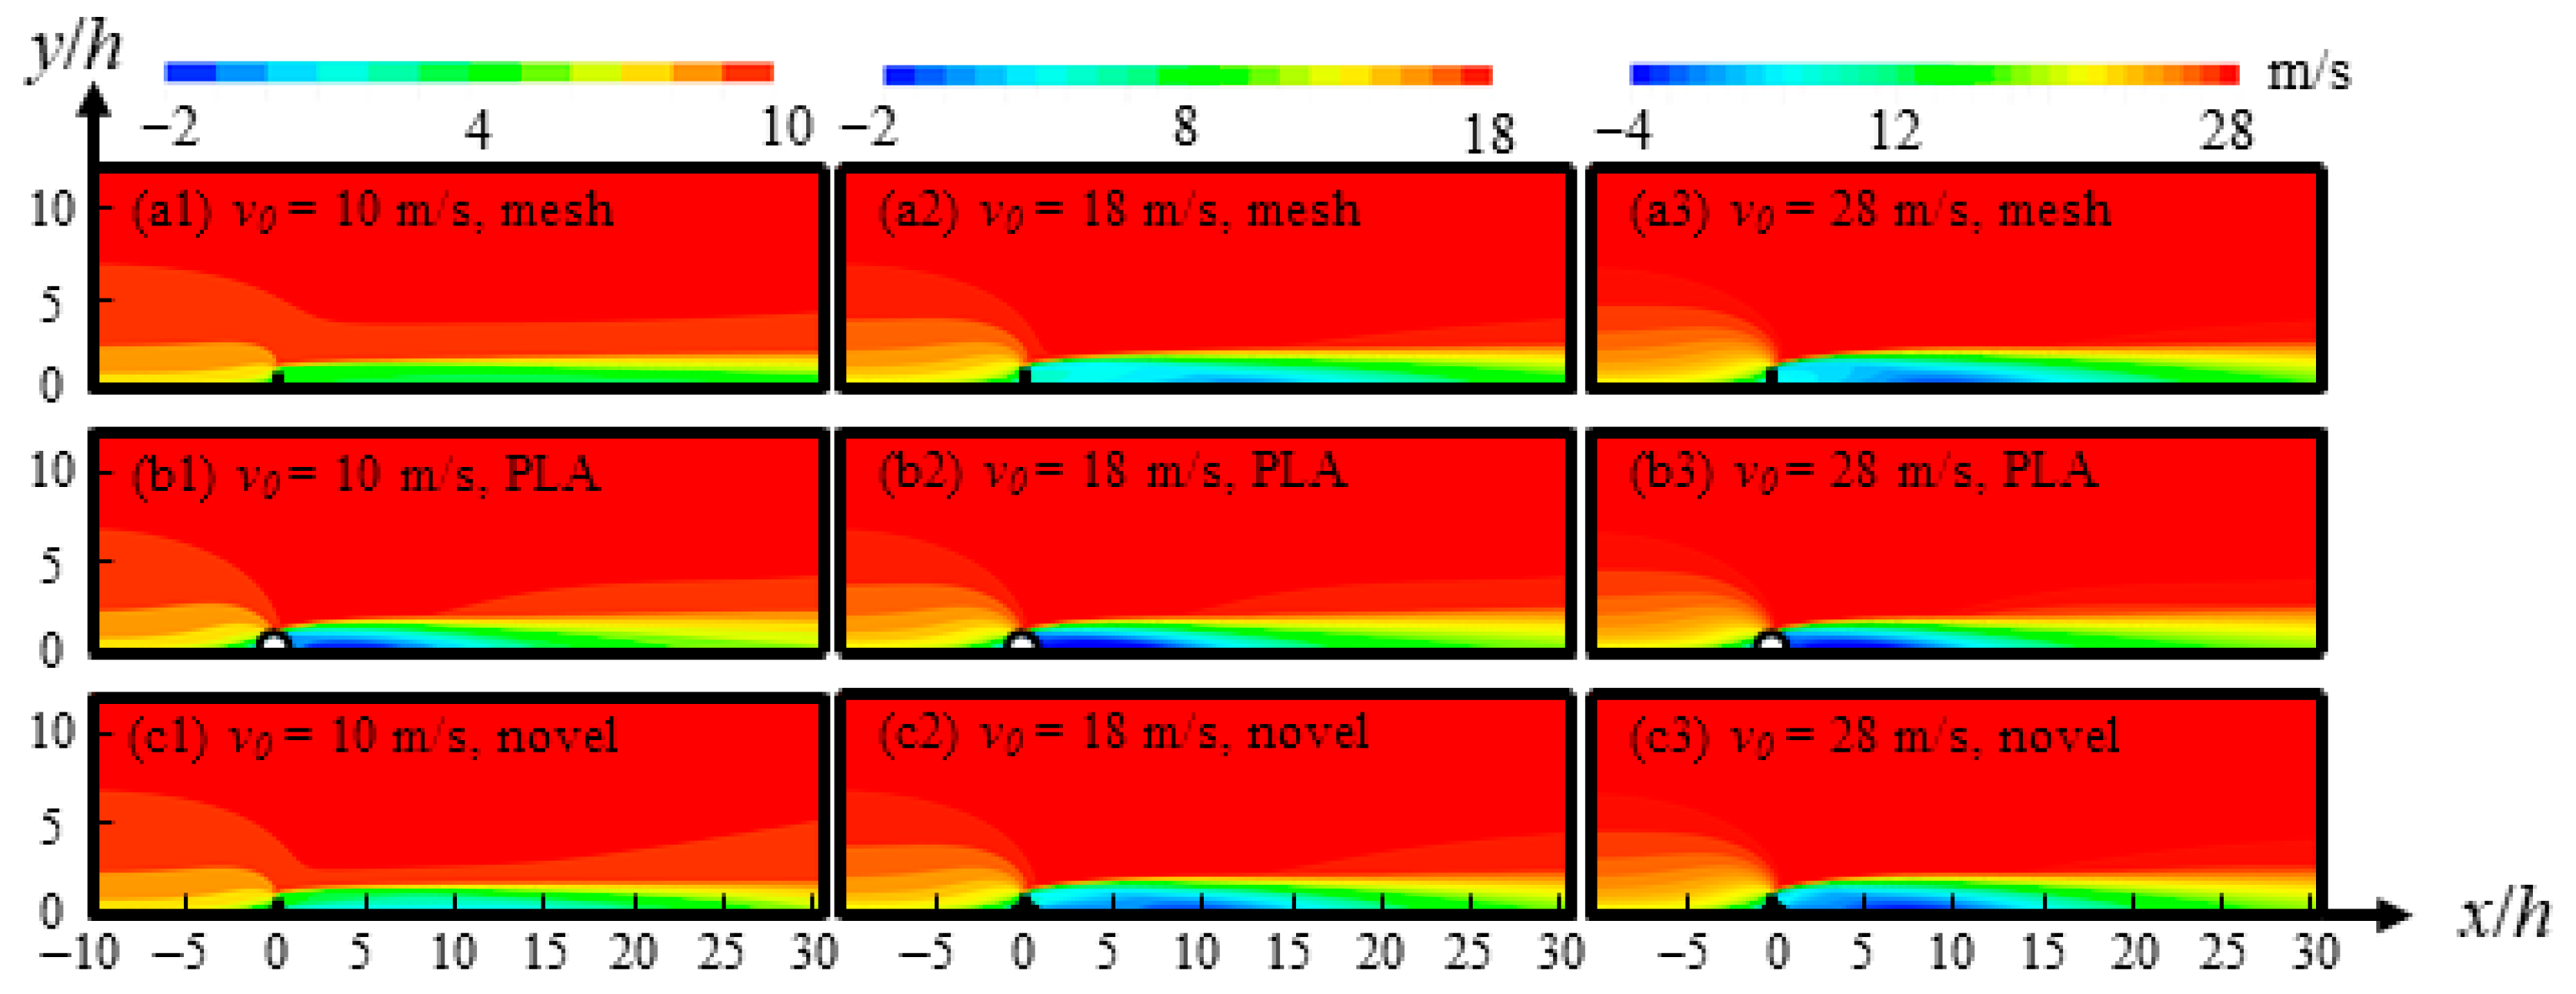
Aeolian dynamics research indicates that the influence of surface roughness elements on the near–surface wind field follows the principle of Reynolds stress redistribution [27]. Figure 8 presents the wind speed distribution maps for windbreak mesh wind fence, sandbag wind fence, and novel composite wind fence under three different wind conditions: moderate wind, strong wind, and extreme wind. In this picture, a represents the windbreak mesh wind fence, b represents the PLA sandbag wind fence, and c represents the novel composite wind fence. PLA sandbag wind fence triggers flow separation due to abrupt changes in surface roughness, forming a Kármán vortex street that leads to kinetic energy dissipation [28]. However, excessive flow disturbance can generate a reverse pressure gradient, resulting in large–scale recirculation zones downstream. In contrast, the porous windbreak mesh wind fence, described by the Brinkman equation for the penetrating flow field [29], reduces wind speed through gradual momentum attenuation [30], but it has a critical porosity that limits its maximum deceleration rate [31].
The 3D flow field reconstruction technique based on CFD simulations reveals the regulatory mechanism of the novel composite wind fence on near–surface turbulent structures. Compared to the PLA sandbag wind fence, the novel wind fence structure significantly shifts the peak position of the vortex from 0.8 h down to 0.4 h. This phenomenon results from the kinetic energy redistribution effect triggered by the novel composite wind fence: a combination of flow separation in the sandbag wind fence and gradual momentum attenuation in the windbreak mesh wind fence transforms large–scale vortices into micro–scale eddies. This flow field reconstruction effectively suppresses the development of characteristic hoof vortices in the 1–5 h region behind traditional wind fences, reducing their vortex height from 0.4 h to 0.07 h. This multi–scale turbulence suppression effect is attributed to the synergistic mechanism of the two–layer composite wind fence structure, which achieves progressive energy dissipation of wind and sand flow through a gradient in wind speed and porosity. This significantly reduces the transport potential energy of the wind flow, demonstrating a notable performance improvement in windbreak and sand fixation engineering.

3.2. The Variation Characteristics of Wind Speed and Windbreak Efficiency at Different Horizontal Positions of Three Wind Fence Types

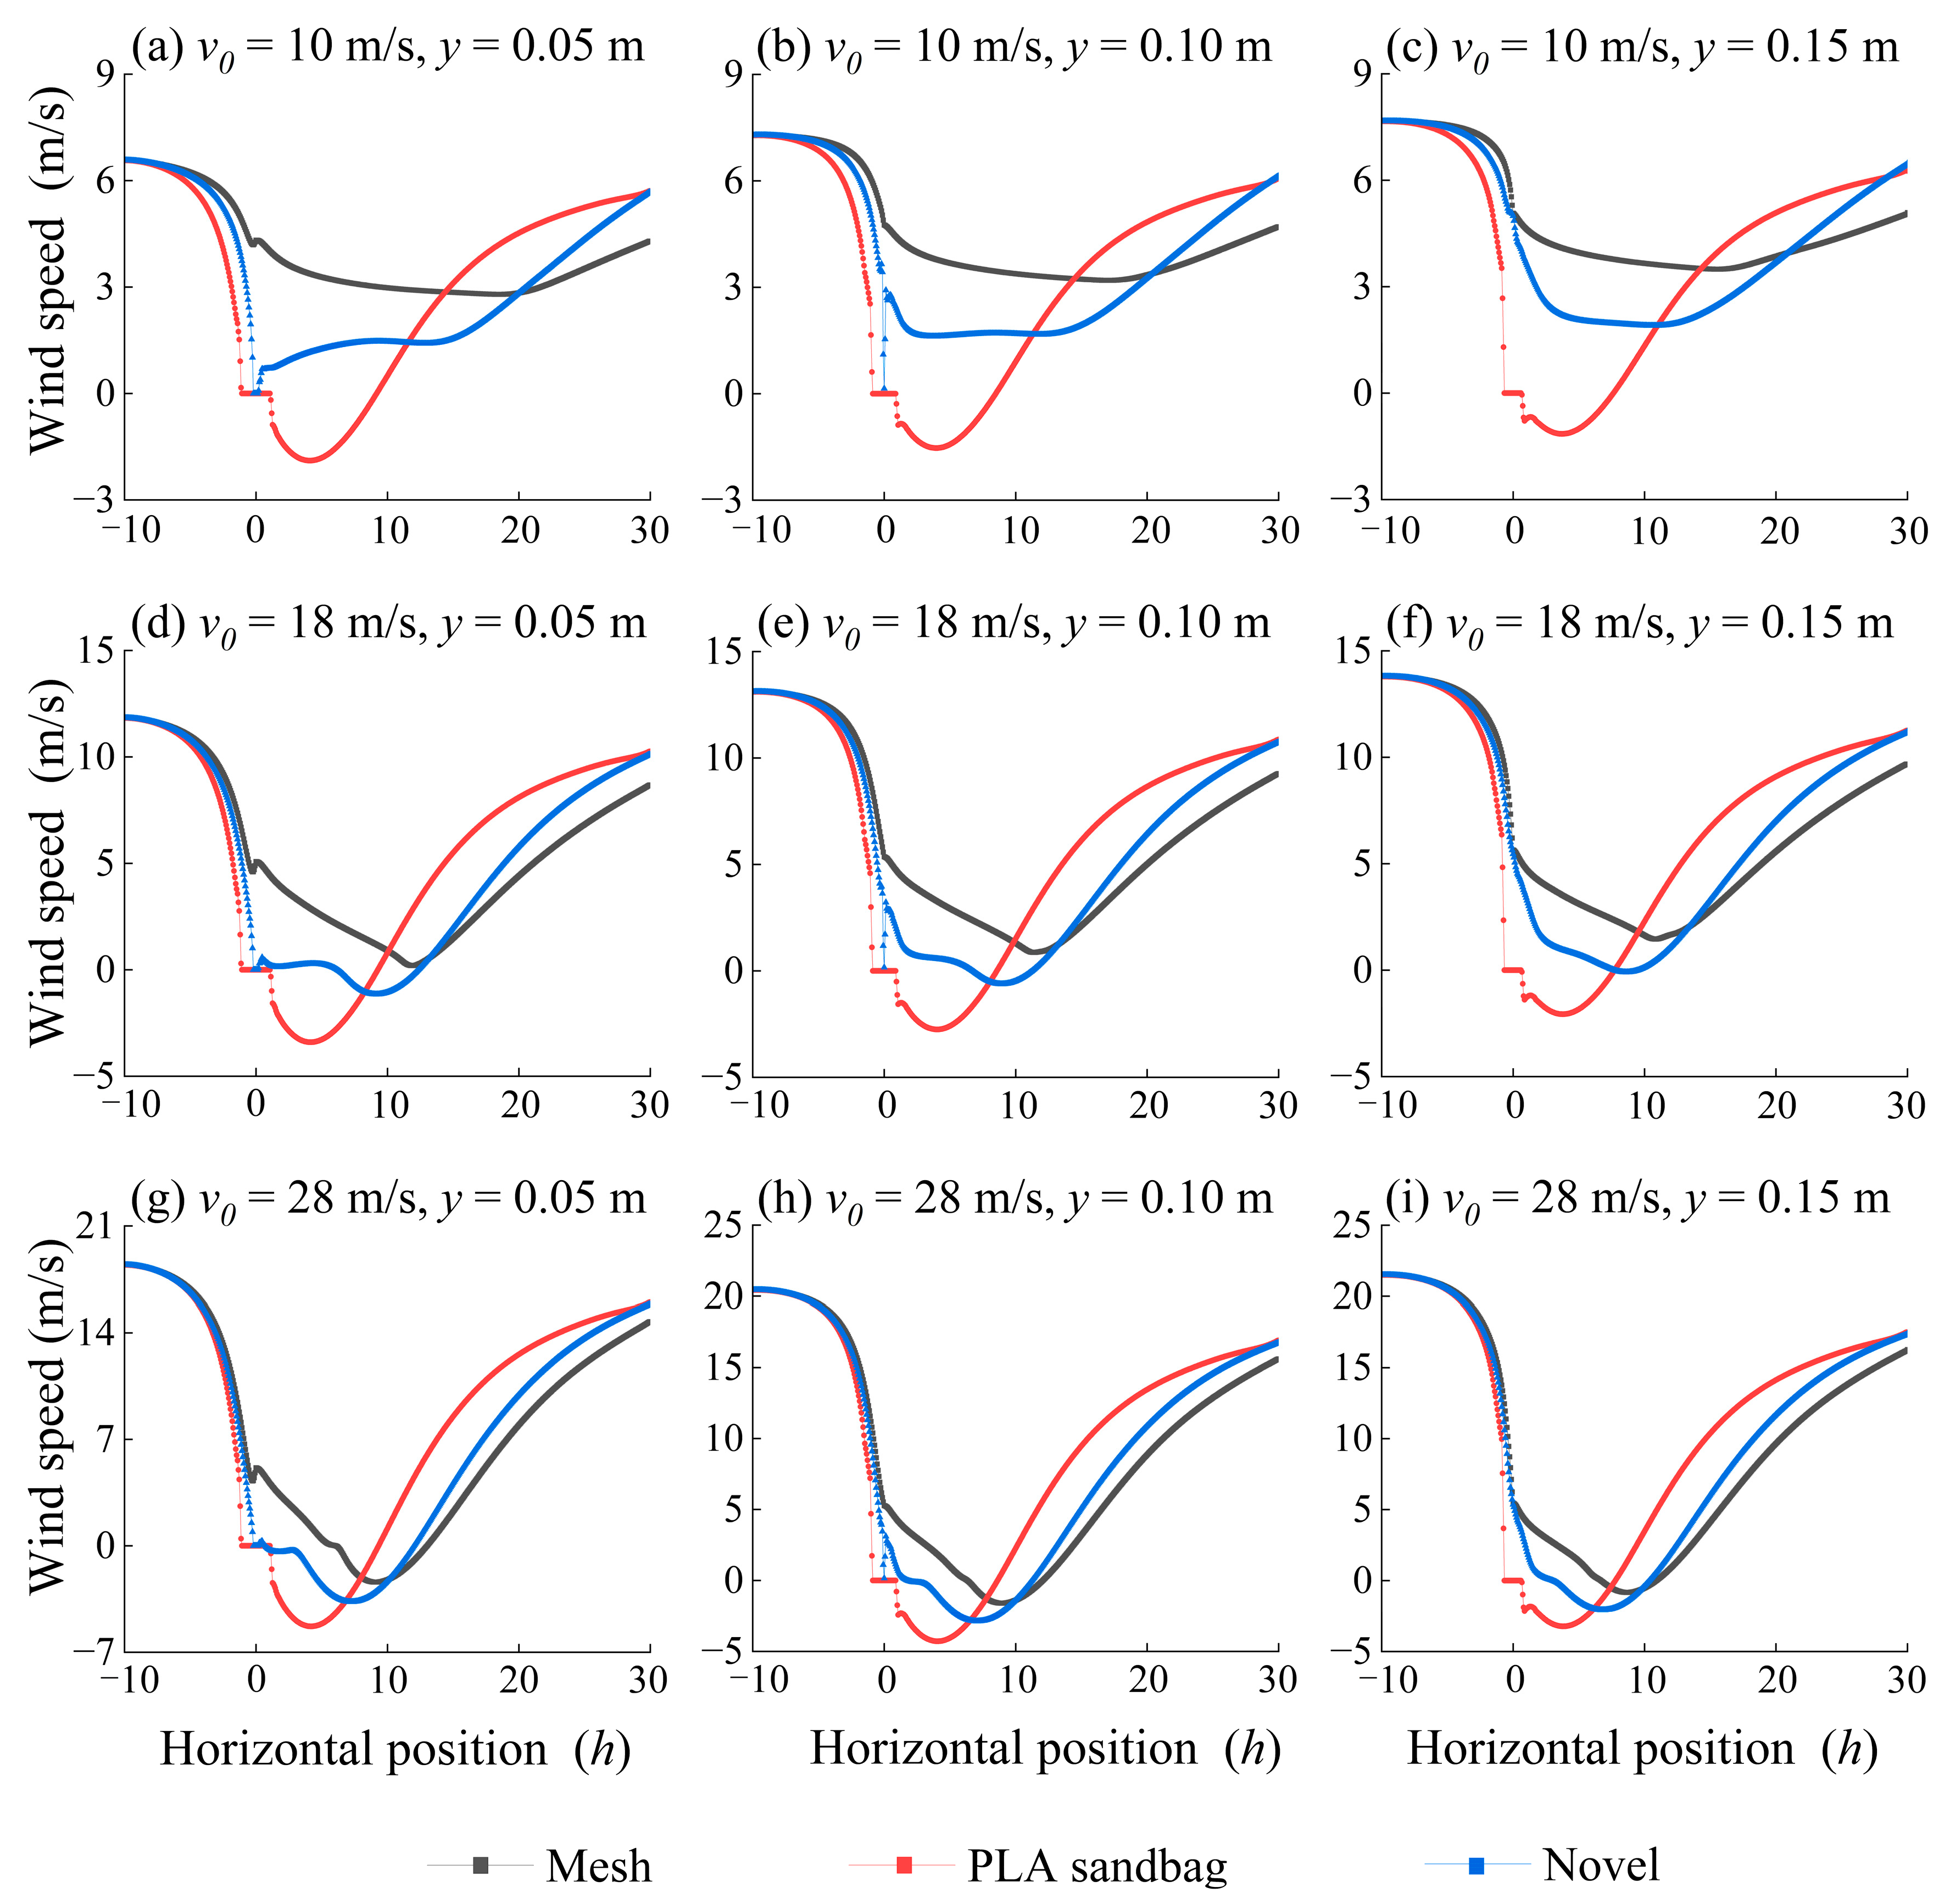
The wind speed variation characteristics of the mesh wind fence, PLA sandbag wind fence, and novel composite wind fence are shown in Figure 9. Overall, as the airflow gradually approaches the wind fence, a turning point in the airflow change appears at the windward side of the wind fence at −2 h. The wind speed rapidly decreases as the airflow passes through the wind fence, creating a weak wind zone behind the wind fence, which then gradually recovers to the incoming wind speed. The overall wind speed variation follows a “decrease–gradual increase–stabilization” trend. As the incoming wind speed increases, the range of wind speed fluctuations becomes more pronounced.
A comparison of the wind speed variation characteristics of the mesh wind fence, PLA sandbag wind fence, and novel composite wind fence under different wind speed conditions reveals that the wind speed on the leeward side of the three wind fences initially decreases and then recovers. With respect to the rate of wind speed reduction, the PLA sandbag wind fence exhibits the fastest decrease across all wind speed conditions, followed by the novel composite wind fence, with the mesh wind fence showing the slowest rate of reduction. The rate of wind speed recovery follows the same pattern. Furthermore, the comparison of wind speed fluctuation amplitudes shows that the wind speed fluctuations around the sandbag wind fence are the most pronounced, followed by the novel composite wind fence, with the mesh wind fence exhibiting the smoothest fluctuations.
In terms of the minimum wind speed and its location on the leeward side, under different wind speed conditions, the sandbag wind fence exhibits the lowest minimum wind speed, and its occurrence is closest to the wind fence. Meanwhile, the mesh wind fence has the highest minimum wind speed, and its occurrence is the farthest from the wind fence. As the incoming wind speed gradually increases, the minimum wind speed on the leeward side of the three wind fences decreases, and the location of this minimum wind speed moves closer to the wind fence.
To investigate the variation in windbreak efficiency of the mesh, PLA sandbag, and novel composite wind fence at different horizontal positions, the average windbreak efficiency values near the ground were obtained for each type of wind fence. Since the impact of the wind fence on the airflow field is primarily concentrated near the surface, wind speed values were collected at intervals of 0.01 m within the height range of y = 0–0.3 m. The near–surface zones are then divided into three height intervals: y = 0–0.1 m, y = 0.1–0.2 m, and y = 0.2–0.3 m. The average wind speed values for each interval were calculated.
The analysis results indicate that the “PLA sandbag–fiber mesh” composite novel wind fence exhibits the optimal and most stable comprehensive windbreak performance, with its average windbreak efficiency values being higher than those of the mesh wind fences and sandbag wind fences at most horizontal positions and height intervals (Figure 10). It is worth mentioning that although the sandbag wind fence shows higher absolute windbreak efficiency values at certain positions compared to the novel wind fence, these wind speed values are mostly negative, indicating the presence of reverse flow in these zones. In such cases, the windbreak efficiency values cannot be relied upon as a reliable basis for evaluating the protective effect of the wind fence, and a comprehensive assessment should incorporate the specific wind speeds and directions shown in Figure 9.
Further analysis of the vertical distribution characteristics of windbreak efficiency near the ground reveals that the windbreak efficiency for all wind fence types shows a clear decreasing trend with increasing height. Specifically, the average windbreak efficiency is highest in the y = 0–0.1 m height range, followed by y = 0.1–0.2 m, and lowest in the y = 0.2–0.3 m range. Overall, the layer–averaged results clearly demonstrate the trend of windbreak efficiency variation with height, highlighting the advantage of the novel composite wind fence in maintaining windbreak efficiency within the near–surface vertical space.

3.3. Variation in Wind Speed Profiles for the Three Types of Wind Fences

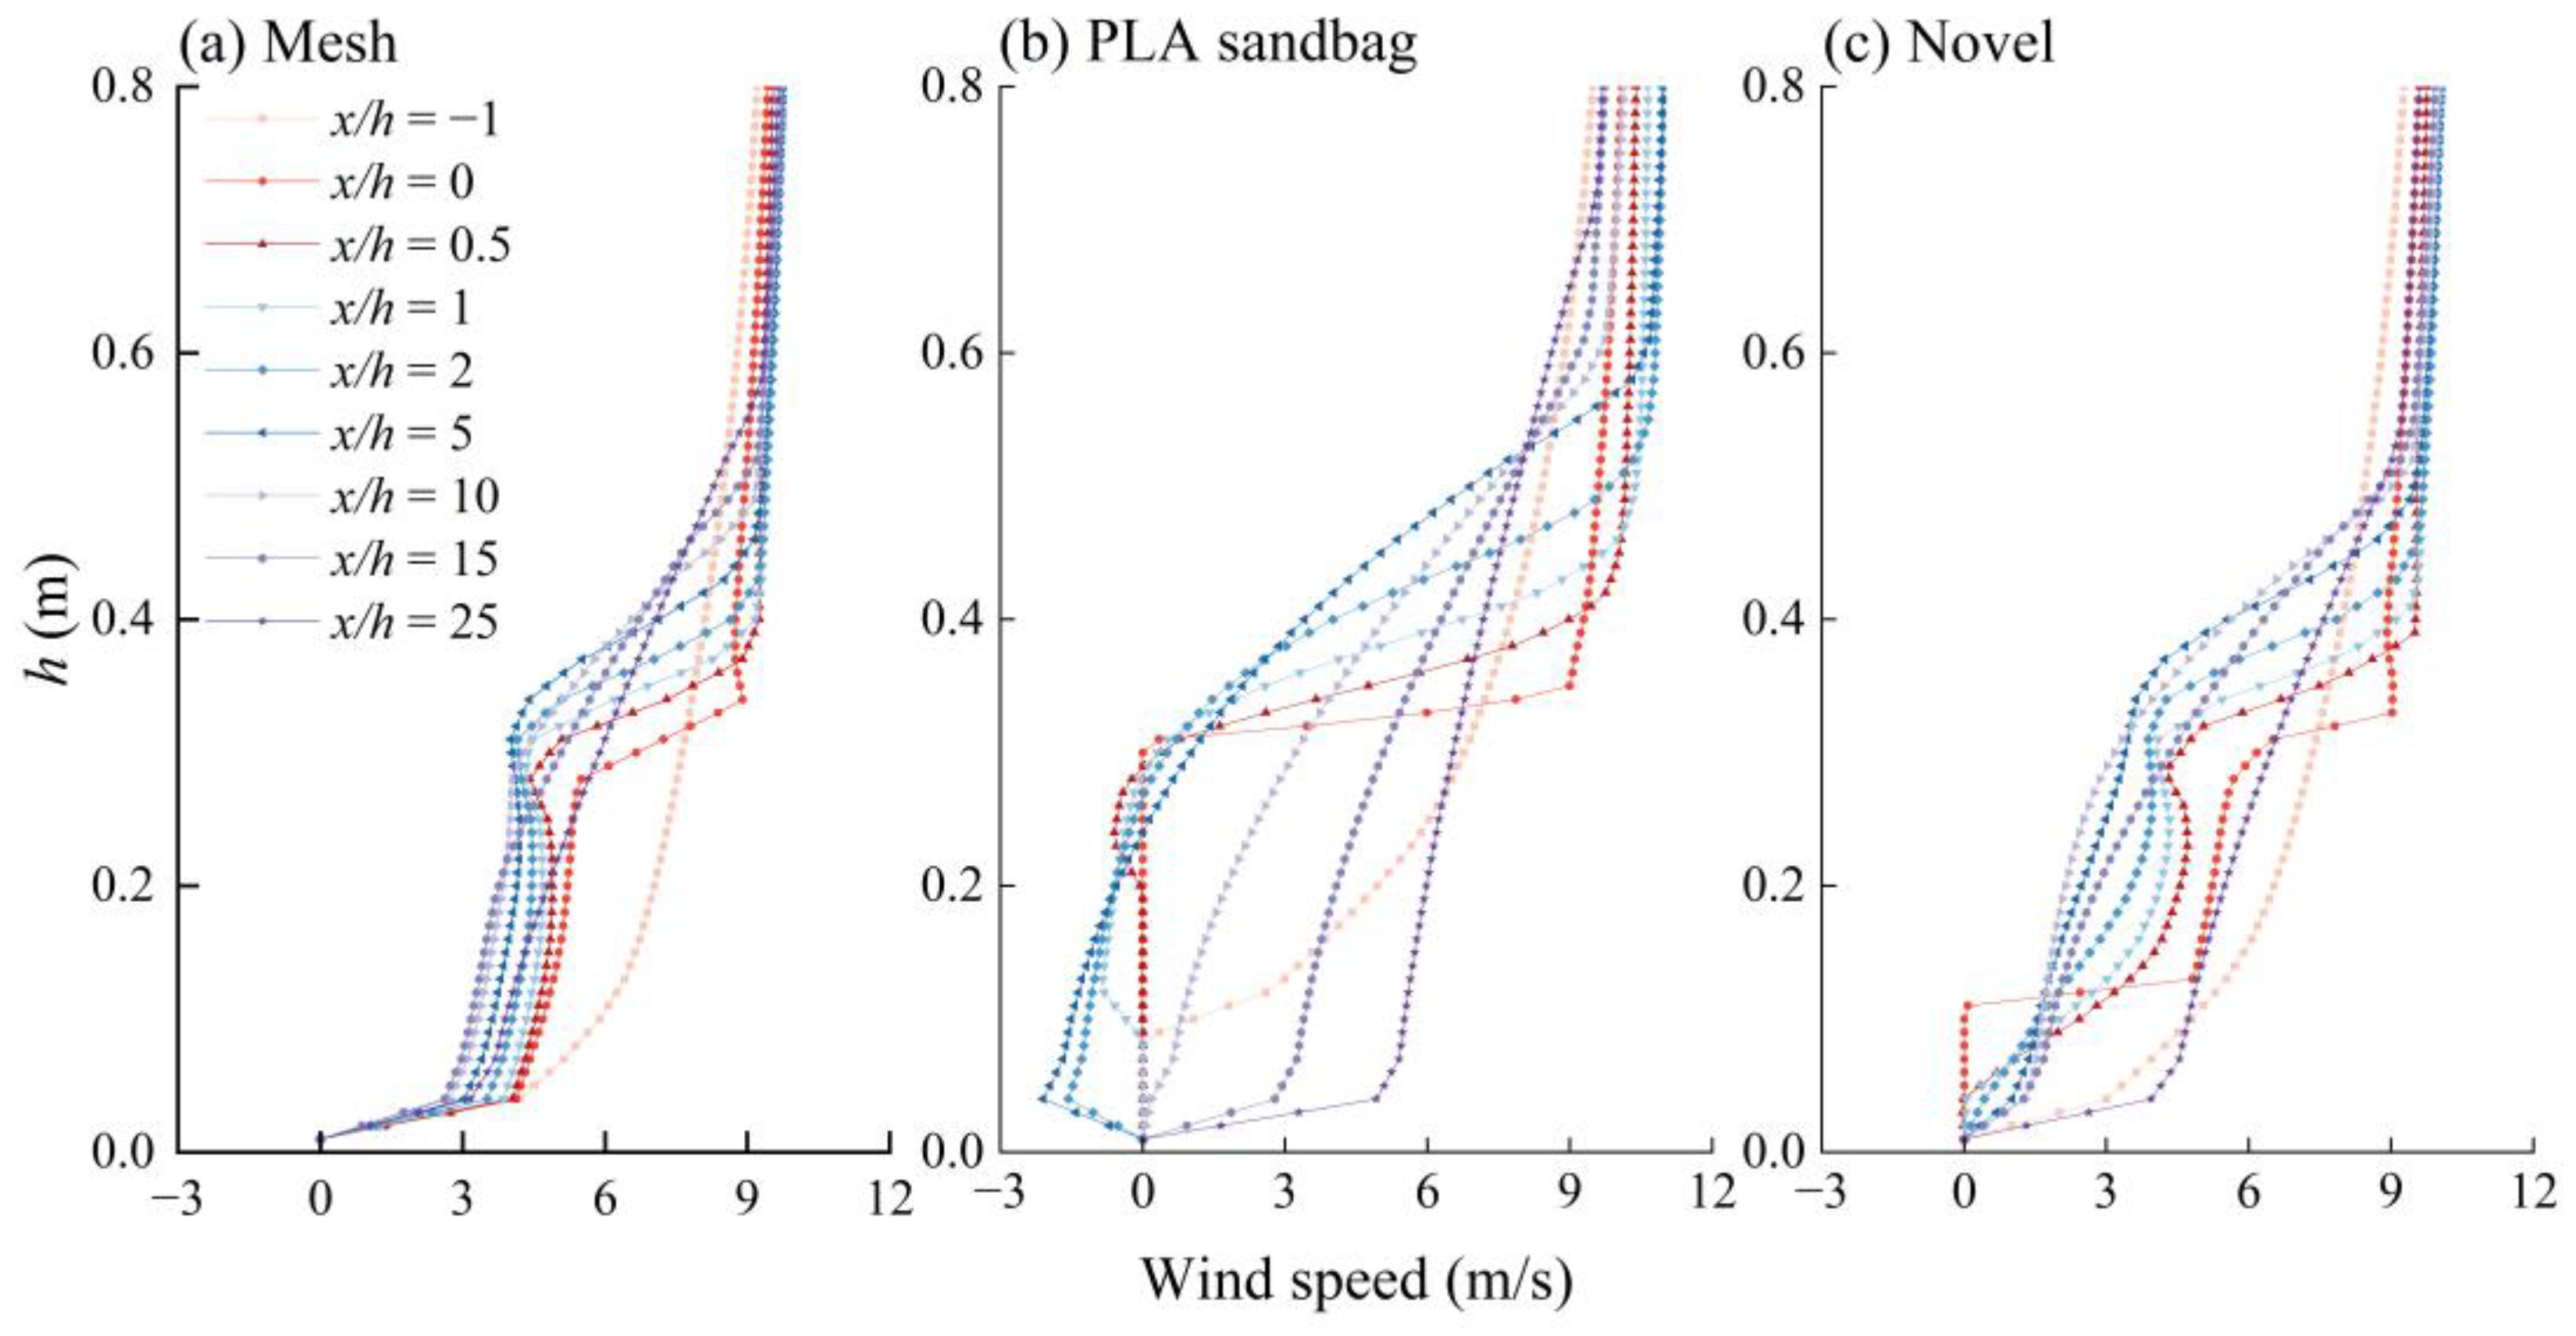
The wind speed profiles around the three types of wind fence—the mesh wind fence (Figure 11a), PLA sandbag wind fence (Figure 11b), and the novel composite wind fence (Figure 11c)—exhibit a distinct “S” shape distribution pattern. On the windward side of the wind fence, at a distance of 1 h from the wind fence, no significant wind speed changes are observed for all three types of wind fence, and the wind speed profile closely matches the field wind speed profile. On the leeward side of the wind fence, the sandbag wind fence shows a noticeable reverse flow in the 0–5 h range, indicating the presence of a vortex zone within this range. As the distance from the wind fence increases on the leeward side, the slope of the wind speed variation gradually decreases.
As for the affected height, the wind speed influences the height range for the mesh wind fence, and the novel composite wind fence is around 0.5 m. Above this height, the wind speed quickly recovers, and the profile rapidly returns to a state close to the incoming wind profile. In contrast, the sandbag wind fence has an effective height range of around 0.6 m, with more intense airflow disturbances. The novel composite wind fence exhibits strong deceleration and a steep slope similar to the sandbag wind fence at the near–surface level, which helps suppress sand entrainment. However, at the upper layers, it avoids the strong acceleration peaks seen with the sandbag wind fence and more closely follows the wind speed profile changes in the mesh wind fence, reducing overall wind speed fluctuations and turbulent disturbances in the flow field.
Overall, the wind speed profile of the mesh wind fence indicates strong airflow permeability. The sandbag wind fence profile exhibits strong airflow disturbance characteristics, while the wind speed profile of the novel composite wind fence clearly reflects the structural division of labor between the sandbag base and the upper mesh wind fence. The sandbag base dominates the near–surface airflow changes, enhancing near–surface shear through solid blockage, resulting in a greater reduction in near–surface wind speed compared to the mesh wind fence. The upper mesh structure governs the airflow changes in the mid–to–upper layers, significantly attenuating the severe airflow variations typical of the sandbag wind fence, leading to a smoother airflow transition.

3.4. Effective Protection Distance of the Novel Composite Structural Wind Fence

As shown in Table 2, the novel composite wind fence, consisting of a PLA sandbag base and an upper fiber mesh, provides a longer effective protection distance compared to single–structure wind fences under different incoming wind speed conditions. As the wind speed increases, the effective protection distance for all three types of wind fences shows a decreasing trend. Under moderate, strong, and extreme wind conditions, the effective protection distances for the novel composite wind fence are 21.2 h, 16.2 h, and 13.9 h, respectively. Compared to the mesh wind fence, the effective protection distances represent an increase of 22.31%, 10.96%, and 0.97%, while for the PLA sandbag wind fence, the increases are 36.48%, 34.25%, and 29.01%, respectively.

3.5. Variation in Turbulence Characteristics Around the Novel Wind Fence

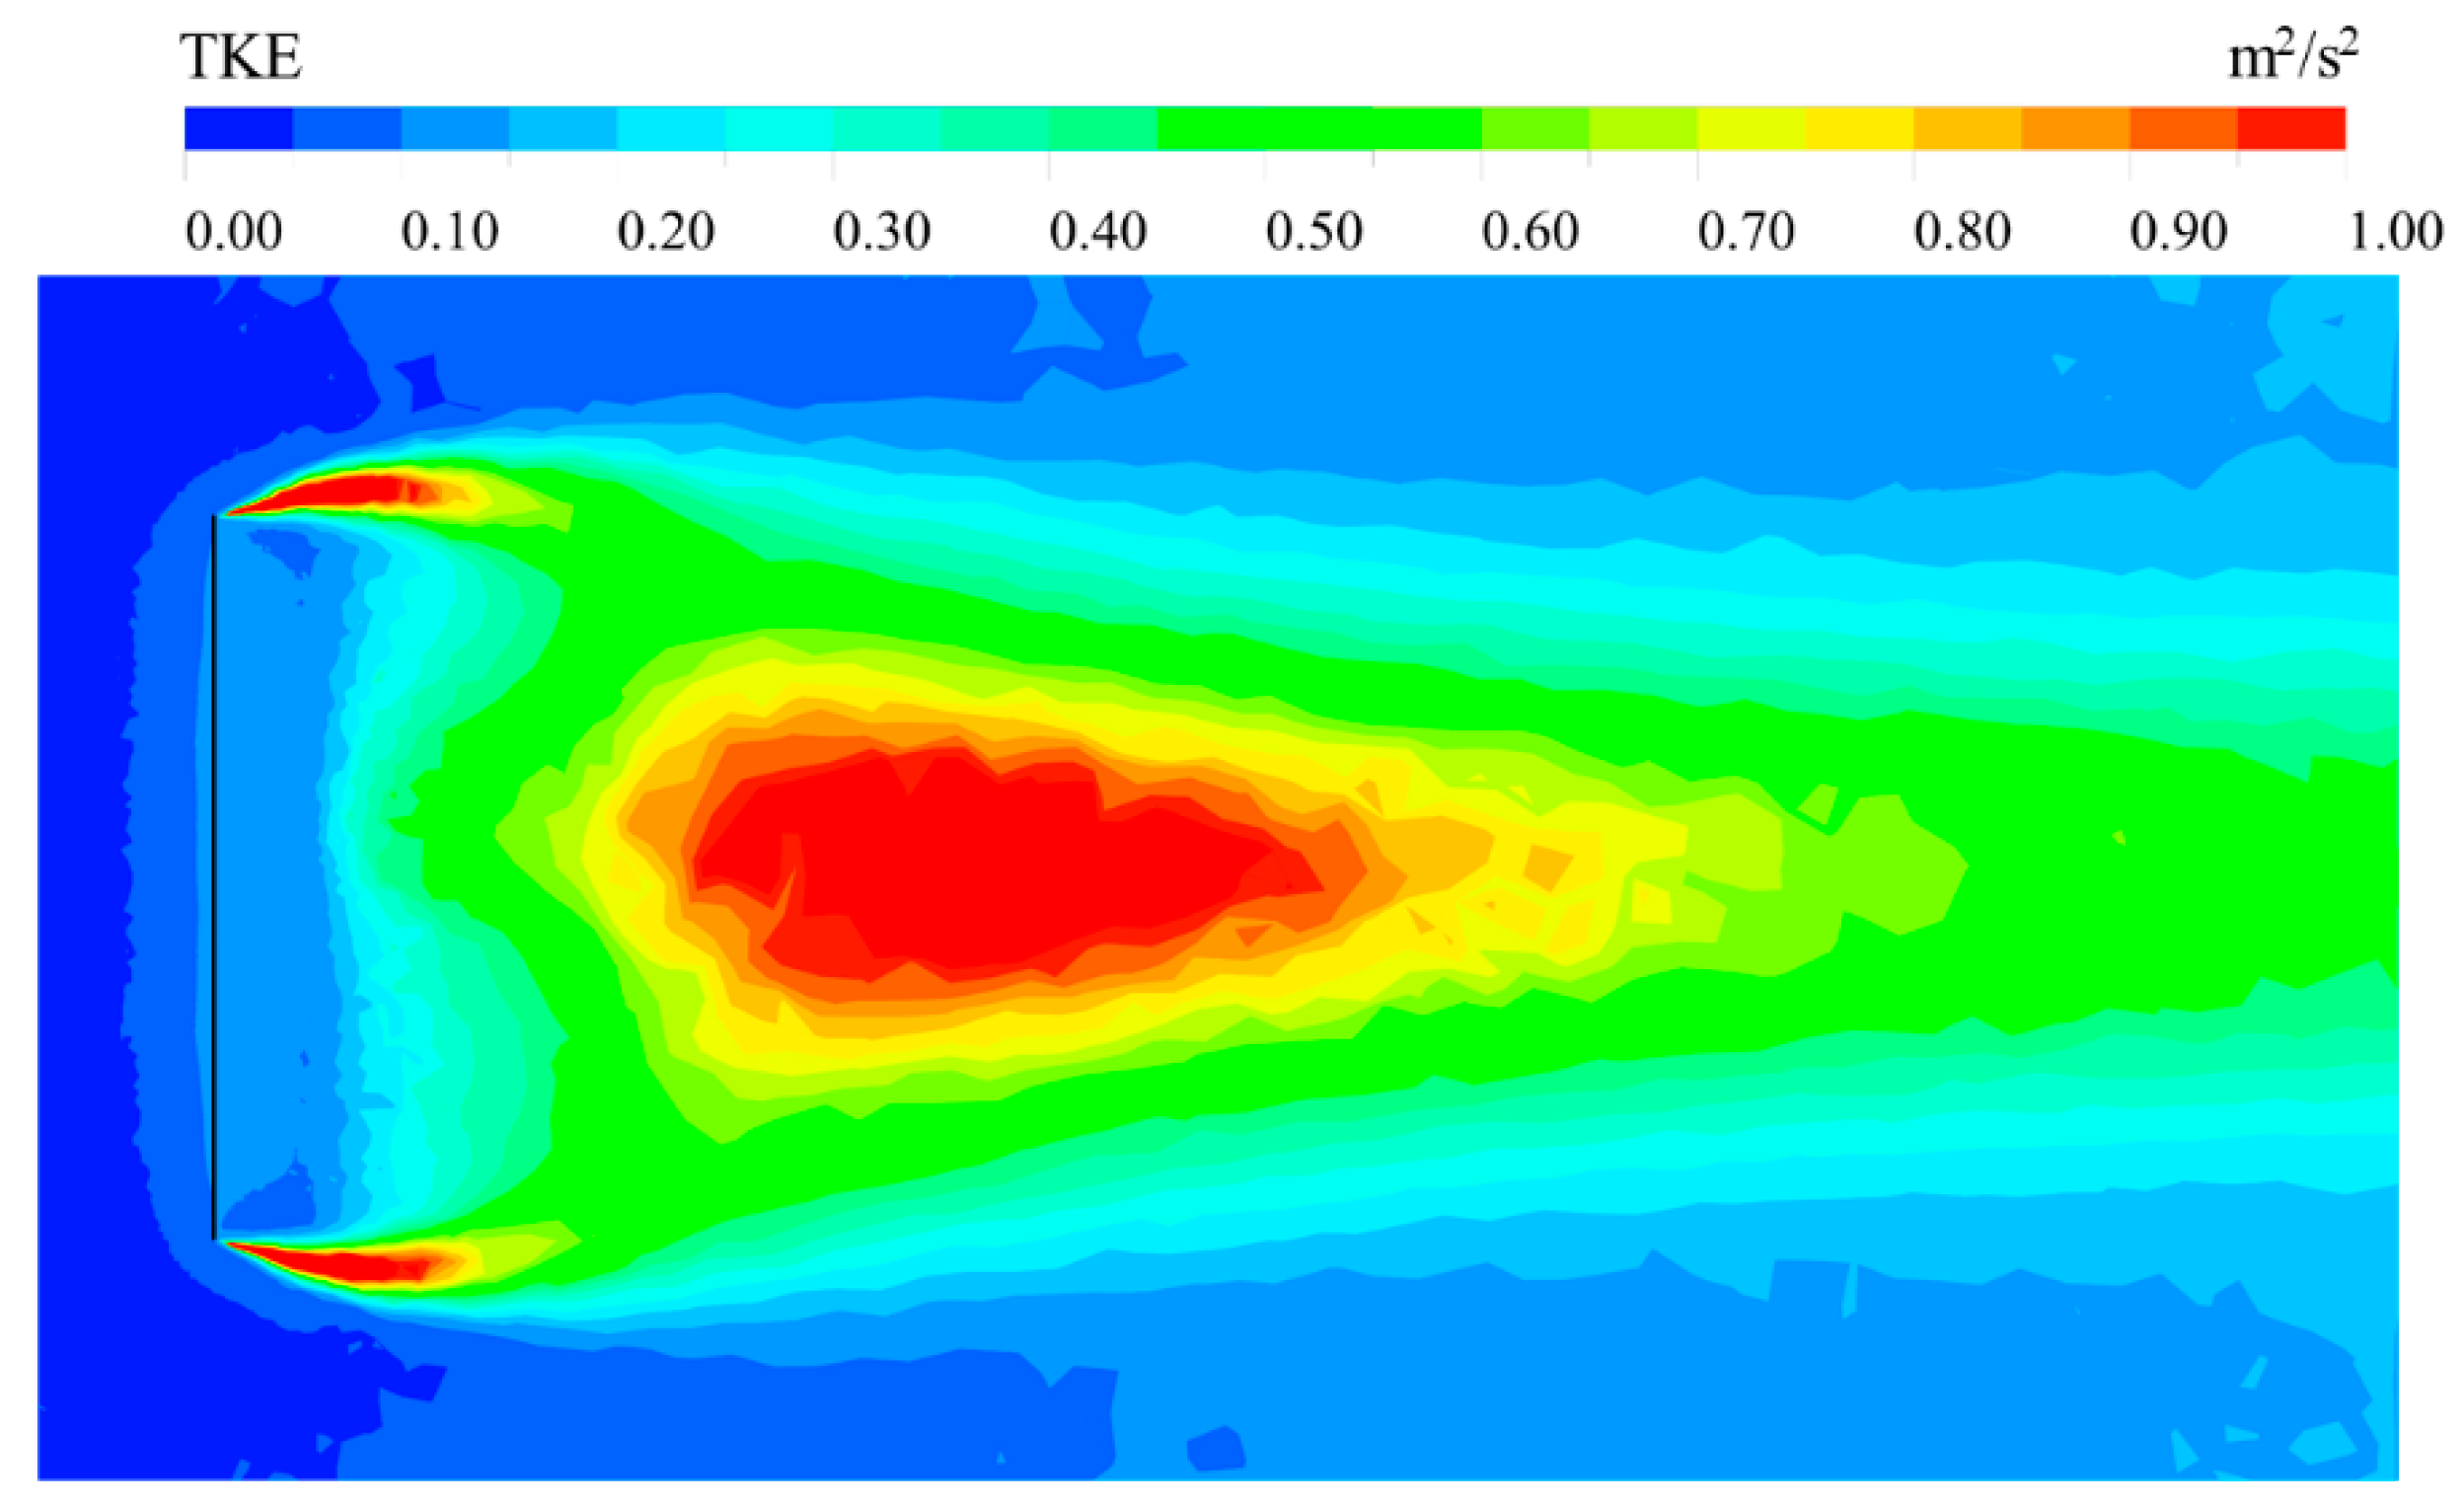
Under an incoming wind speed of 10 m/s, the distribution of TKE around the “PLA sandbag–fiber mesh” composite wind fence is shown in Figure 12. From the figure, it can be seen that near the leeward side of the wind fence, TKE is relatively high, forming a significant zone of high TKE values, indicating strong flow separation and vortex development in this area. As the distance from the wind fence increases, TKE gradually weakens, reflecting the dissipation process of turbulent energy. Compared to single–structure wind fence, the peak TKE for the mesh wind fence occurs at position (0, 0.58) with a peak value of 0.31822, the PLA sandbag wind fence has a TKE peak of 5.979 at position (2.3, 0.36), the novel composite wind fence has a TKE peak at position (0.4, 0.06) with a value of 0.9549.

3.6. Windbreak Performance of Multi–Row Novel Wind Fences

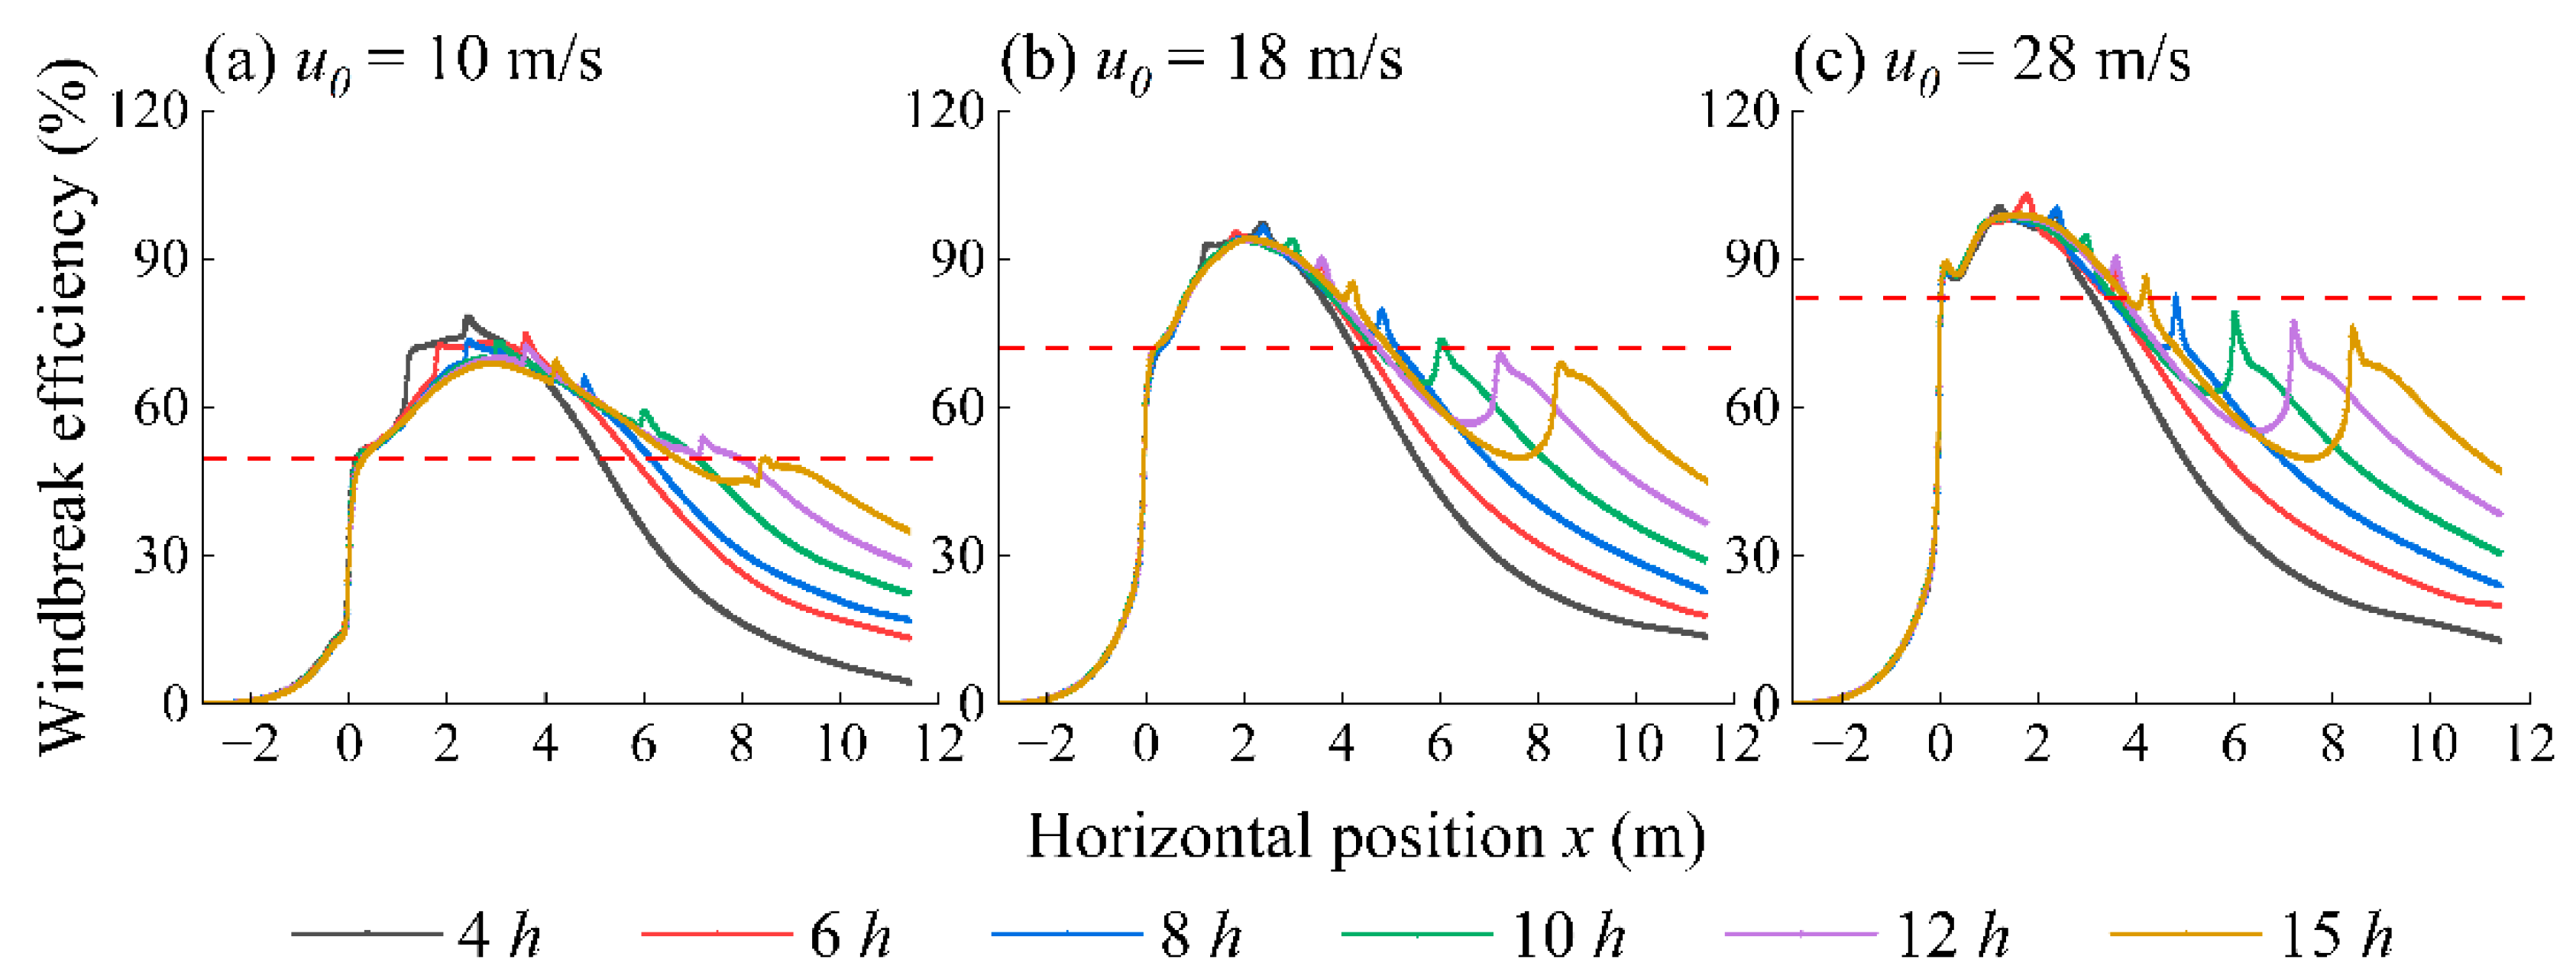
When the novel wind fence is arranged in three continuous rows, the windbreak efficiency of the wind fence groups exhibits a unimodal change characterized by an “initial steep rise followed by a gradual decline” with respect to the horizontal position x under three typical wind speeds (Figure 13). At a distance of 2 m on the windward side of the wind fence, a significant increase in windbreak efficiency is observed, indicating that the wind fence effectively obstructs the incoming wind. On the leeward side of the wind fence, the windbreak efficiency increases to a peak value and then gradually decreases under all six row spacing conditions. As the incoming wind speed increases, the windbreak efficiency of the wind fence generally shows an upward trend across different inter–row spacings. When the row spacing exceeds 10 h, the windbreak efficiency curve on the leeward side of the wind fence exhibits secondary peaks. When the incoming wind speed is 10 m/s, the maximum windbreak efficiency reaches approximately 80%. As the incoming wind speed increases to 18 m/s and 28 m/s, the peak windbreak efficiency increases to about 95% and nearly 100%, respectively. In addition, the slope of the decrease in wind protection efficiency increases with the wind speed, suggesting that the windbreak efficiency diminishes more rapidly under high wind speeds, resulting in a relatively shorter effective protection distance.
The results indicate that smaller inter–row spacings are favorable for strong wind resistance in the near field, while larger inter–row spacings within a certain range help extend the protective range of the wind fence groups in the far field. Under high wind speed conditions, the protective advantage on the leeward side due to inter–row spacing becomes more pronounced. When the inter–row spacing of the three–row sand fences is small, the windbreak efficiency of the wind fence groups is strongest in the transition zone but decreases rapidly afterward. Taking an incoming wind speed of 10 m/s as an example, as the inter–row spacing gradually increases, although the peak windbreak efficiency slightly decreases, the windbreak efficiency on the leeward side of the wind fences significantly improves in the horizontal position range of 3–11.4 m. Notably, at the far end, around the horizontal position x of 10 m, the windbreak efficiency increases as the inter–row spacing increases within the study range. Overall, to ensure effective windbreak while achieving material and cost savings, it is recommended to arrange the three–row sand fences with inter–row spacings of 12 h, 8 h, and 6 h under moderate wind conditions of 10 m/s, strong winds of 18 m/s, and extreme winds of 28 m/s, respectively.
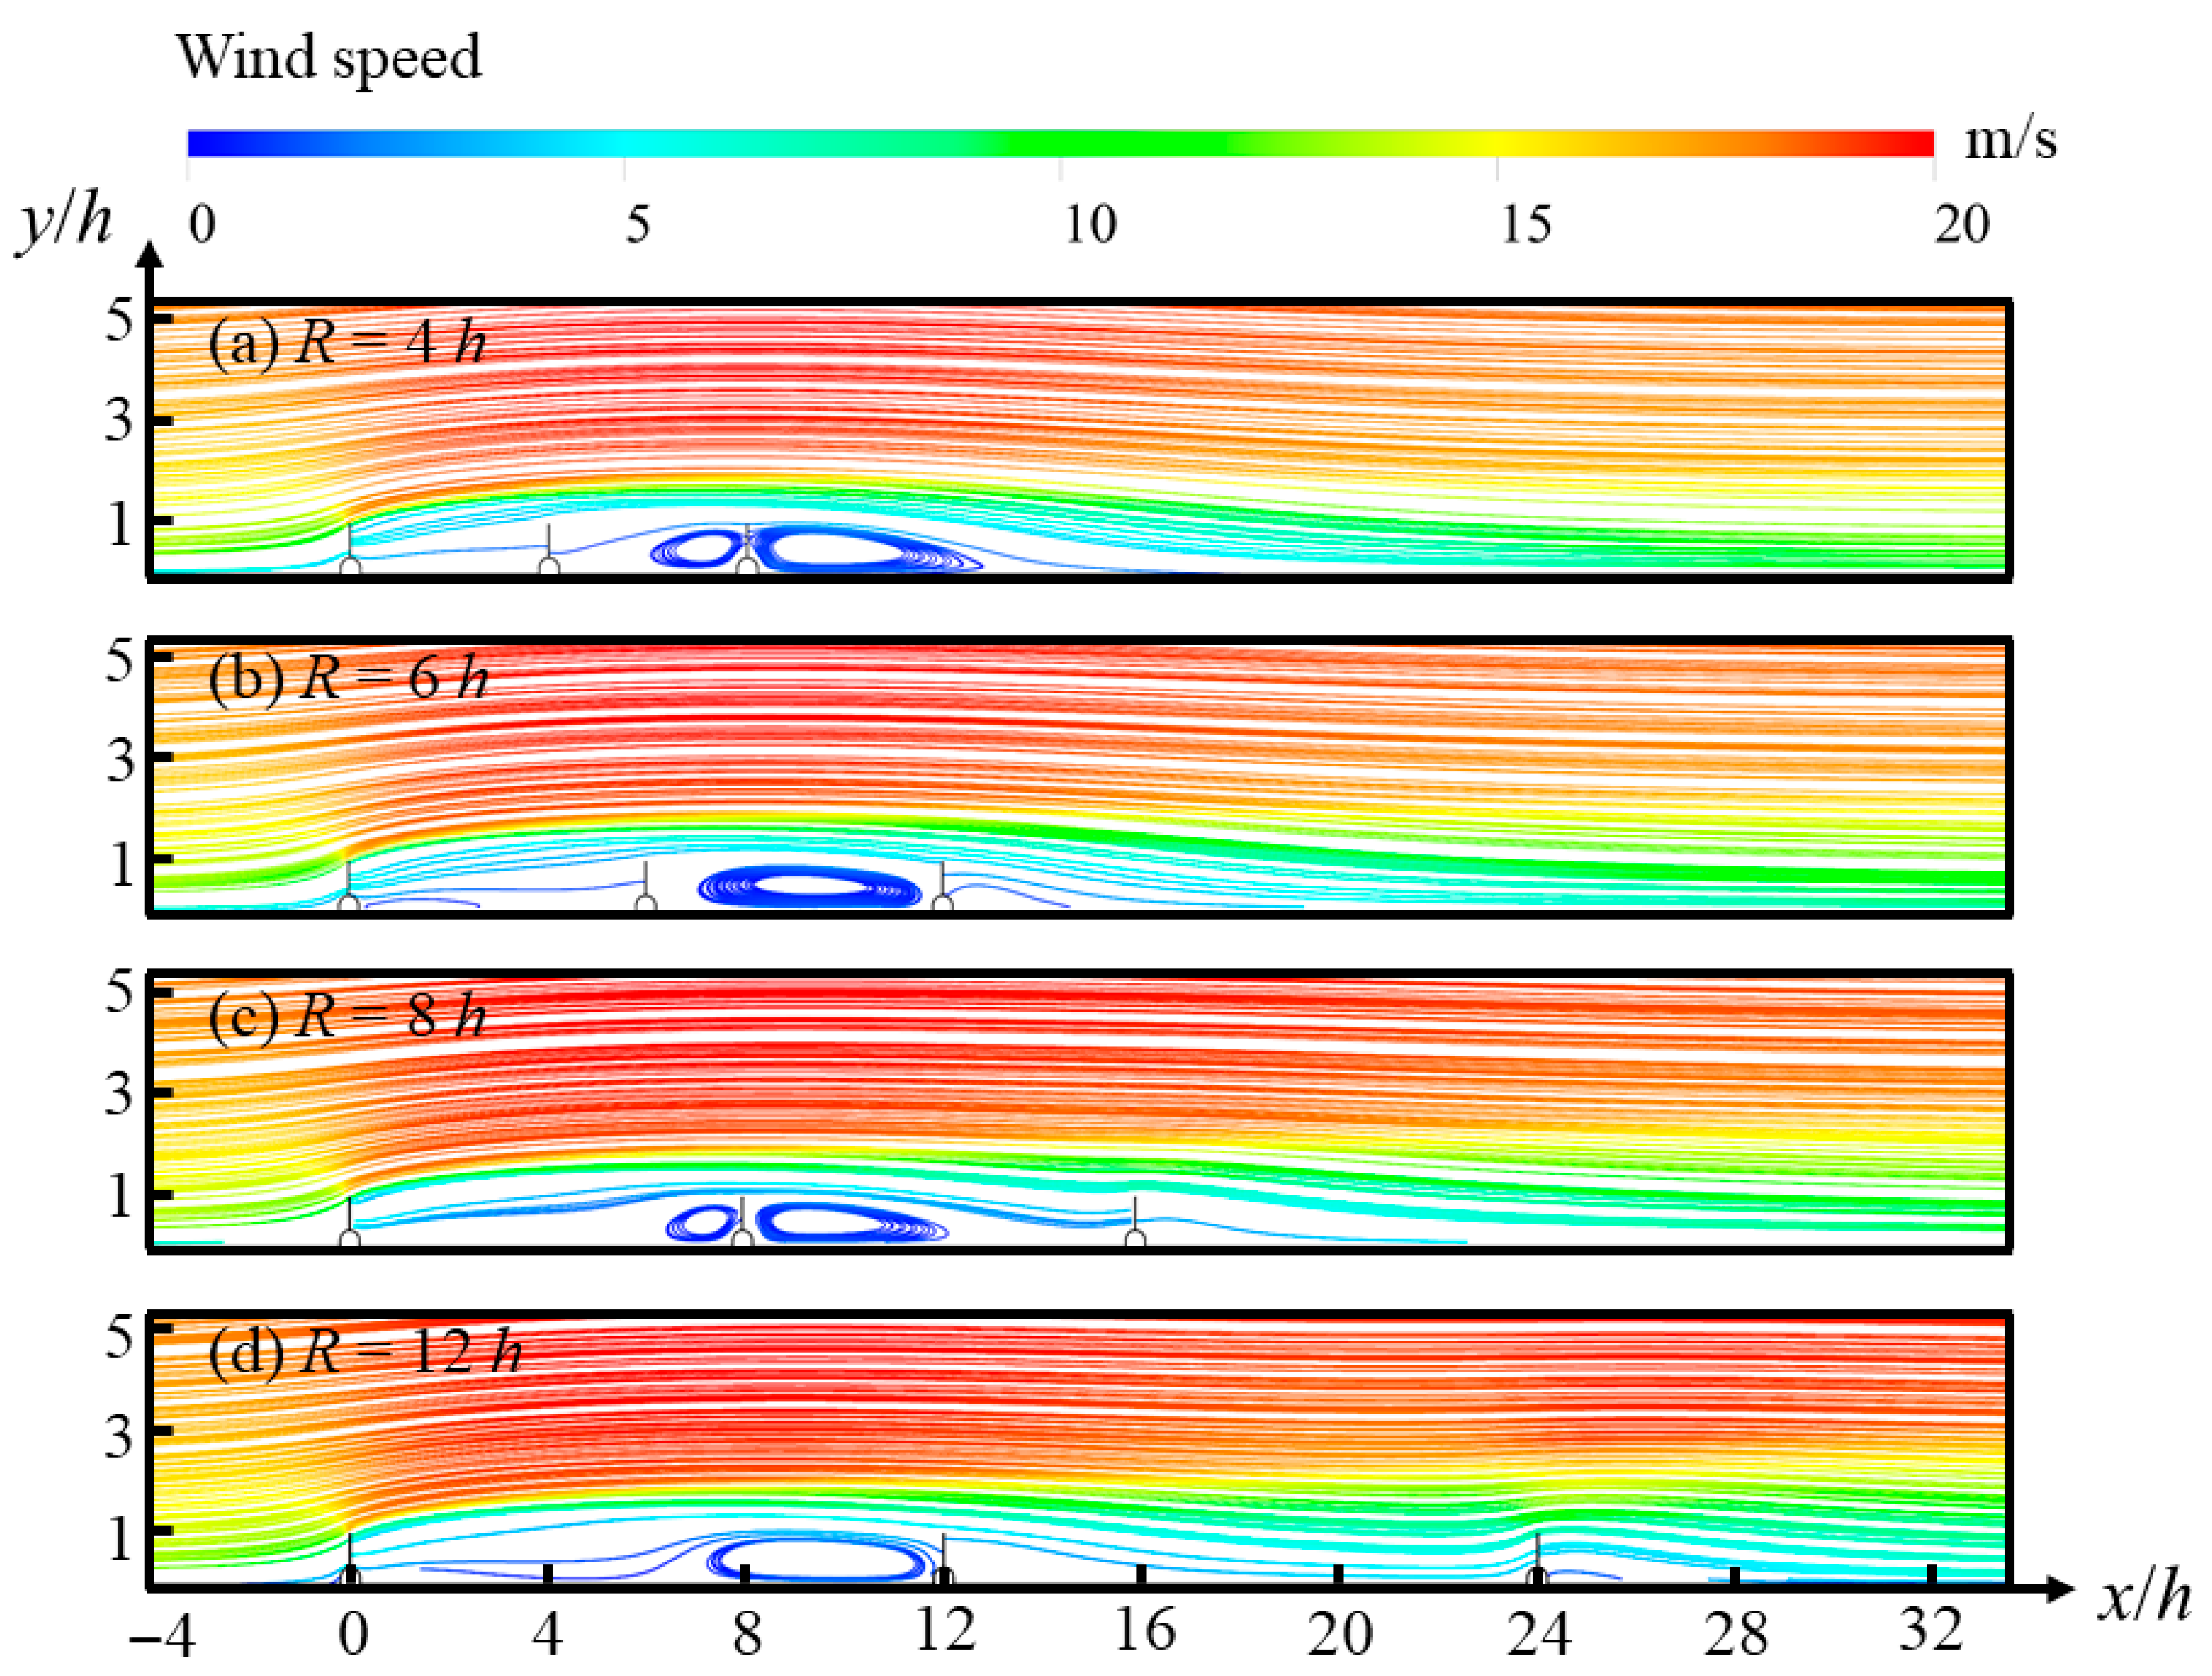
With an incoming wind speed of 18 m/s, the image shows the streamline diagram of the novel wind fences arranged in three rows under varying spacing conditions (Figure 14). In configurations with smaller row spacing, the gap effect creates a distinct acceleration zone between the wind fences, and the recirculation flow is highly turbulent. Increasing the row spacing to an appropriate extent allows the airflow to pass through smoothly and effectively reduces wind speed. As the row spacing increases, the wind speed distribution area expands significantly, indicating that, within a reasonable range, larger row spacing helps to extend the wind protection range of the wind fence groups. However, when the row spacing becomes too large, the airflow accelerates after passing through the first row of wind fences, before reaching the second row. This indicates a disruption in the protective effect between the rows of wind fences, leading to discontinuity in wind protection.

4. Discussion

4.1. Airflow Structure and Synergistic Protection Performance of the Composite Wind Fence

The protective mechanism of wind fences arises from the resistance they impose on the wind field, resulting in a net loss of momentum in the incompressible airflow [32]. As a crucial design parameter for novel composite wind fences, the porosity of the mesh windbreak directly affects its protective performance. Studies have shown that when the porosity of the mesh is between 0 and 15%, the airflow resistance increases, leading to the formation of vortex zones on the leeward side [33]. Turbulence enhances the ability of the wind field to erode and transport surface sand particles [34], thus shortening the effective protection distance. When the porosity exceeds 45%, permeability increases [35] and turbulence intensity decreases [36], which weakens airflow resistance and shortens the effective protection distance. This result regarding the regulation of airflow separation by porosity [37] provides a key foundation for the parameter design of the “PLA sandbag–fiber mesh” novel composite wind fence. Therefore, in the engineering application of the novel composite wind fence, it is necessary to optimize the porosity of the fiber mesh in accordance with local wind speed conditions and protective objectives, allowing it to work synergistically with the PLA base to achieve the optimal comprehensive protective effect.
The novel wind fence integrates the windbreak and sand fixation effects of both fiber mesh wind fences and PLA sandbag wind fences. PLA sandbag wind fences, due to their “semi–streamlined” shape when airflow passes through, induce relatively low disturbance to the airflow, making it difficult for their effective protection distance to meet actual needs [38]. Although mesh wind fences have good permeability, they are challenging to implement in areas with terrain fluctuations, and they are prone to erosion due to their inability to tightly conform to the ground [39]. Based on this, the novel wind fence proposed in this study reinforces the base using PLA sandbag wind fences and utilizes the upper fiber mesh for flow guidance. This design allows for the optimization of the windbreak effect of the mesh wind fence through reasonable adjustments of porosity, while leveraging the weight and flexibility of the PLA sandbags to ensure a close fit with the ground, preventing erosion from damaging the wind fence. The PLA sandbag at the bottom of the novel composite wind fence elevates the flow separation point and effectively suppresses near–surface wind speed, creating a stable sand control zone while significantly reducing the risk of erosion at the base. Meanwhile, the upper mesh, due to its permeability, allows the airflow separated and lifted by the sandbags to pass through more smoothly and diffuse downstream. This significantly weakens the intensity and scale of the leeward side vortex. This synergistic effect results in a noticeable reduction in the size of the main recirculation zone on the leeward side of the composite wind fence, with the flow reattachment point delayed to a farther distance.
The results from the numerical simulation indicate that the “PLA sandbag–fiber mesh” composite wind fence achieves effective protection distances of 6.36 m, 4.86 m, and 4.18 m under 10 m/s, 18 m/s, and 28 m/s wind speeds, respectively. These distances are significantly longer than those of the single mesh wind fence, which provides protection distances of 17.33 h, 14.60 h, and 13.8 h, and the single sandbag wind fence, which achieves protection distances of 15.53 h, 12.07 h, and 10.80 h (Table 2). The core dynamic mechanism behind this advantage lies in the synergistic effect between the PLA sandbag base and the mesh wind fence, which significantly optimizes the flow field structure around the wind fence. Mesh wind fences are prone to failure in strong winds due to their flexible structure, but reinforcing the bottom with PLA sandbags can enhance their windbreak and sand–fixing effectiveness. The increase in protection distance can reduce the construction cost and provide more space for vegetation restoration in large–scale wind fence projects [38,40]. The findings of this study can provide valuable insights into land management strategies in arid regions, promoting the integrated development of desertification control and the enhancement of biodiversity in degraded ecosystems.

4.2. Flow Dynamics and Protective Effectiveness in Multi–Row Configurations

In the practical deployment of wind fences, multi–row configurations are commonly used due to the significant wind speed variations and uneven energy distribution when airflow first encounters the wind fences [41]. In the design of multi–row wind fences, the interactions between rows are coordinated [42]. Row spacing is a key parameter influencing the windbreak and sand fixation effectiveness of the fences [43]. When the spacing is too small, the wind speed between the wind fences may increase due to the gap effect, thereby increasing the risk of secondary wind erosion. In addition, the protective effects of multiple rows of wind fences overlap, leading to material waste and higher project costs. Conversely, when the spacing is too large, the airflow may recover to above the threshold for sand movement before reaching the second row [44], leading to discontinuous protection and compromising the overall effectiveness [45]. In practical engineering applications, it is essential to balance the structure of multiple rows to effectively block the incoming airflow. By optimizing the row spacing, the low–speed wake zones of each row can effectively connect, enhancing the windbreak and sand fixation performance while also reducing material usage and costs. As the incoming wind speed increases, the protective effect of the wind fences diminishes. Therefore, adjusting the row spacing appropriately can counteract the negative effects of high wind speeds and ensure the effective protection range of the wind fences.
The advantages of the novel composite wind fences primarily lie in their long service life, durability, and controllable porosity. The selection of porosity can be tailored according to the specific needs of wind and sand control in different regions, aiming to achieve an optimal balance between protective benefits and sand control costs. However, the durability of the novel wind fences in field environments and the impact of varying climatic factors on their performance require further investigation. Through improvements in their structural design, the novel composite wind fence not only significantly enhances the durability and stability of windbreak and sand fixation effects but also provides a solid foundation for integrating locally adapted biological measures and systematic vegetation restoration strategies, thereby promoting sustainability by fostering long–term environmental protection and ecological stability. This combination fosters soil improvement, moisture retention, and plant growth in areas prone to wind and sand, thus promoting a more comprehensive and sustainable approach to ecosystem restoration.

5. Conclusions

This study systematically investigates the windbreak performance and mechanisms of the “PLA sandbag–fiber mesh” novel composite wind fence through CFD simulations. The main conclusions are as follows:
(1) The novel composite structure wind fence significantly optimizes the airflow field distribution and enhances comprehensive windbreak efficiency. The PLA sandbag base effectively suppresses high–speed airflow near the surface, improving the stability of the wind fence structure. The upper mesh guides airflow smoothly, weakening the intensity of the leeward side vortex. The synergistic effect of both components results in a more stable airflow field structure.
(2) Under a moderate wind speed of 10 m/s, the novel composite wind fence achieves an effective protection distance of 21.20 h, which is 22.33% to 36.51% greater than the single mesh wind fence, at 17.33 h, and the sandbag wind fence at 15.53 h. When the incoming wind speed increases to 18 m/s, the effective protection distance of the novel composite wind fence reaches 16.20 h, an improvement of 10.96% to 34.22% compared to the single mesh wind fence, which is 14.60 h, and the sandbag wind fence, which is 12.07 h. Under extreme wind conditions of 28 m/s, the novel composite wind fence provides an effective protection distance of 13.93 h, which is 0.94% to 28.98% longer than the single mesh wind fence at 13.80 h and the sandbag wind fence at 10.80 h.
(3) When the incoming wind speed is 10 m/s, the optimal row spacing for a three–row configuration of the novel wind fences is 12 h to mitigate the gap effect and prevent the overlap of protected zones. For incoming wind speeds of 18 m/s and 28 m/s, the recommended optimal row spacings are 8 h and 6 h, respectively, to ensure the continuity and effectiveness of the protective performance.
(4) This study innovatively integrates the base stability of PLA sandbags with the permeability and flow guidance properties of fiber mesh, overcoming the limitations of single–structure wind fences in balancing windbreak efficiency, flow field stability, and long–term sustainability. This provides a theoretically reliable and design–controllable novel solution for wind and sand control projects, contributing to sustainability by improving environmental stability and promoting long–term ecological balance. The research findings also offer new solutions for dune management, as well as the protection of transportation infrastructure in desert regions.

Author Contributions

Conceptualization, M.Q., L.C., X.G. and G.D.; methodology, M.Q. and L.C.; software, M.Q. and L.C.; validation, X.G. and G.D.; investigation, M.Q., L.C. and J.L.; resources, X.G. and G.D.; data curation, M.Q., L.C. and G.D.; writing—original draft preparation, M.Q.; writing—review and editing, M.Q. and L.C.; visualization, M.Q. and L.C.; supervision, X.G. and G.D.; project administration, X.G., G.D. and J.L.; funding acquisition, X.G., G.D. and J.L. All authors have read and agreed to the published version of the manuscript.

Funding

This research was funded by the Key Science–Technology Project of Inner Mongolia, grant number 2024JBGS0013–01 and grant number 2022YFHH0131.

Institutional Review Board Statement

Not applicable.

Informed Consent Statement

Not applicable.

Data Availability Statement

The data are contained within the article.

Conflicts of Interest

The authors declare no conflicts of interest.

References

  1. Teng, Y.M.; Zhan, J.Y.; Liu, W.; Sun, Y.X.; Agyemang, F.B.; Liang, L.; Li, Z.H. Spatiotemporal dynamics and drivers of wind erosion on the Qinghai–Tibet Plateau, China. Ecol. Indic. 2021, 123, 107340. [Google Scholar] [CrossRef]
  2. Nordstrom, K.F.; Hotta, S. Wind erosion from cropland in the USA: A review of problems, solutions and prospects. Geoderma 2004, 121, 157–167. [Google Scholar] [CrossRef]
  3. Wu, X.G.; Fan, J.Q.; Sun, L.; Zhang, H.F.; Xu, Y.; Yao, Y.F.; Yan, X.D.; Zhou, J.; Jia, Y.S.; Chi, W.F. Wind erosion and its ecological effects on soil in the northern piedmont of the Yinshan Mountains. Ecol. Indic. 2021, 128, 107825. [Google Scholar] [CrossRef]
  4. Reynolds, J.F.; Smith, D.M.S.; Lambin, E.F.; Turner, B.; Mortimore, M.; Batterbury, S.P.; Downing, T.E.; Dowlatabadi, H.; Fernández, R.J.; Herrick, J.E. Global desertification: Building a science for dryland development. Science 2007, 316, 847–851. [Google Scholar] [CrossRef] [PubMed]
  5. Li, J.H.; Cui, M.; Cai, Q.; Liu, Y.G.; Bo, W.J. Spatiotemporal patterns and drivers of trade–offs and synergy in the Beijing–Tianjin sand source control project: A bayesian belief network–based analysis. Sustainability 2024, 16, 1617. [Google Scholar] [CrossRef]
  6. Xin, G.W.; Huang, N.; Zhang, J.; Dun, H.C. Investigations into the design of sand control fence for Gobi buildings. Aeolian Res. 2021, 49, 100662. [Google Scholar] [CrossRef]
  7. He, C.; Liu, B.; Yin, D.; Li, M.; Hu, C.; Xiao, X.; Duan, Y.; Fang, M.; Hou, P. Study on the shelter and sand control effect of new porous sand barriers from recycled wind turbine blades. Int. Soil Water Conserv. Res. 2025, 13, 475–485. [Google Scholar] [CrossRef]
  8. Sun, J.; Wang, S.; Liu, Y.Z.; Meng, J.J.; Hong, J.Z.; Wang, J.; Chang, P.; Liu, H.B.; Zhang, B.Y.; Li, Y. Experimental study on a combined sand barrier: Integration of porous mesh plate and novel porous sand–fixing bricks. J. Wind Eng. Ind. Aerodyn. 2024, 251, 105809. [Google Scholar] [CrossRef]
  9. Jia, G.P.; Zuo, H.J.; Wang, H.B.; Yan, M.; Yao, Y.F.; Han, X.Y.; Liu, F. Numerical simulation and experiment of wind–sand movement characteristics around high vertical nylon mesh sand barriers. Trans. Chin. Soc. Agric. Eng. 2020, 36, 109–117. [Google Scholar] [CrossRef]
  10. Shi, L.; Li, H.Y.; Zhao, Y.X.; Ren, Y.Y.; He, J.J.; Yu, F.Q.; Eerdun, H. Benefit evaluation of wind prevention and sand fixation under the combined measures of sand barrier in mobile dunes in Mu Us sandy land. Arid. Zone Res. 2023, 40, 268–279. [Google Scholar] [CrossRef]
  11. Bagherpour, M.; Zare, S.; Liu, H.J.; Ekhtesasi, M.R.; Samani, A.A.N. Developing natural based biodegradable sand barriers for mitigation of aeolian sands. J. Environ. Manag. 2025, 394, 127525. [Google Scholar] [CrossRef] [PubMed]
  12. Li, Y.L.; Cai, Z.L.; Liu, F.R. Development of biobased materials applications. In Research and Applications of Bio–Based Degradable Materials; Springer: Singapore, 2025; pp. 287–320. [Google Scholar] [CrossRef]
  13. Naser, A.Z.; Deiab, I.; Darras, B.M. Poly (lactic acid)(PLA) and polyhydroxyalkanoates (PHAs), green alternatives to petroleum–based plastics: A review. RSC Adv. 2021, 11, 17151–17196. [Google Scholar] [CrossRef]
  14. Cislaghi, A.; Sala, P.; Borgonovo, G.; Gandolfi, C.; Bischetti, G.B. Towards more sustainable materials for geo–environmental engineering: The case of geogrids. Sustainability 2021, 13, 2585. [Google Scholar] [CrossRef]
  15. Han, X.Y. Study on Mechanism and Benefit of Wing Bag Sand Barrier. Ph.D. Thesis, Inner Mongolia Agricultural University, Hohhot, China, 2022. [Google Scholar] [CrossRef]
  16. Zhang, M.; Li, Q.; Hou, J.Y.; Ji, S. Evaluation of protection benefit of sand barrier fence with different heights on desert highway. PLoS ONE 2025, 20, e0324869. [Google Scholar] [CrossRef] [PubMed]
  17. Chen, B.Y.; Cheng, J.J.; Xin, L.G.; Wang, R. Effectiveness of hole plate–type sand barriers in reducing aeolian sediment flux: Evaluation of effect of hole size. Aeolian Res. 2019, 38, 1–12. [Google Scholar] [CrossRef]
  18. Zong, Q.; Wu, X.X. A review of computational fluid dynamics (CFD) methodology and analysis on airflow and sand transport over aeolian landforms. Catena 2024, 241, 108010. [Google Scholar] [CrossRef]
  19. Fan, P.P.; Wu, X.X. Flow field simulation and protective effectiveness research on sand barriers by computational fluid dynamics (CFD)—A review. J. Wind Eng. Ind. Aerodyn. 2025, 259, 106024. [Google Scholar] [CrossRef]
  20. Dong, H.G.; Cheng, J.J.; Li, Y.P.; Chen, Y.Q.; Zhang, R.Y.; Chen, D.H. Erosion and deposition patterns over a wind-blown sand dune behind a high vertical-type sand fence. Land Degrad. Dev. 2024, 35, 5452–5469. [Google Scholar] [CrossRef]
  21. Patankar, S.V.; Spalding, D.B. A calculation procedure for heat, mass and momentum transfer in three dimensional parabolic flows. In Numerical Prediction of Flow, Heat Transfer, Turbulence and Combustion; Elsevier: Amsterdam, The Netherlands, 1983; pp. 54–73. [Google Scholar] [CrossRef]
  22. Shih, T.H.; Liou, W.W.; Shabbir, A.; Yang, Z.G.; Zhu, J. A new k–epsilon eddy viscosity model for high Reynolds number turbulent flows. Comput. Fluids 1994, 24, 227–238. [Google Scholar] [CrossRef]
  23. Cai, L.K.; Ding, G.D.; Qu, M.Y. Evaluation of the porosity–wind speed coupling mechanism and wind erosion control efficiency of mesh sand barriers based on numerical simulation. J. Arid Land Resour. Environ. 2025, 39, 104–115. [Google Scholar] [CrossRef]
  24. Dong, Z.B.; Qian, G.Q.; Luo, W.Y.; Wang, H.T. Threshold velocity for wind erosion: The effects of porous fences. Environ. Geol. 2006, 51, 471–475. [Google Scholar] [CrossRef]
  25. Jia, G.P. Fluent Numerical Simulation of Protective Effectiveness of Double–Row Nylon Sand–Blocking Net. Master’s Thesis, Inner Mongolia Agricultural University, Hohhot, China, 2019. [Google Scholar] [CrossRef]
  26. Rohanizadegan, M.; Petrone, R.M.; Pomeroy, J.W.; Kosovic, B. Analysis of turbulence and turbulence kinetic energy dynamics in complex terrain. J. Geophys. Res. Atmos. 2025, 130, e2023JD040558. [Google Scholar] [CrossRef]
  27. King, J.; Nickling, W.G.; Gillies, J.A. Investigations of the law–of–the–wall over sparse roughness elements. J. Geophys. Res. Earth Surf. 2008, 113, F2. [Google Scholar] [CrossRef]
  28. Neuman, C.M.; Sanderson, R.S.; Sutton, S. Vortex shedding and morphodynamic response of bed surfaces containing non–erodible roughness elements. Geomorphology 2013, 198, 45–56. [Google Scholar] [CrossRef]
  29. Durlofsky, L.; Brady, J.F. Analysis of the Brinkman equation as a model for flow in porous media. Phys. Fluids 1987, 30, 3329. [Google Scholar] [CrossRef]
  30. Zhang, K.; Zhang, H.L.; Deng, Y.H.; Qu, J.J.; Wang, Z.H.; Li, S. Effects of sand sedimentation and wind erosion around sand barrier: Numerical simulation and wind tunnel test studies. J. Mt. Sci. 2023, 20, 962–978. [Google Scholar] [CrossRef]
  31. Wang, F.; Liu, S.X.; Jiang, Y.J.; Duan, W.J. Research on the effect of sand barriers on highways in desert areas on sand control. Sustainability 2023, 15, 13906. [Google Scholar] [CrossRef]
  32. Cornelis, W.M.; Gabriëls, D. Optimal windbreak design for wind–erosion control. J. Arid Environ. 2005, 61, 315–332. [Google Scholar] [CrossRef]
  33. Bruno, L.; Fransos, D.; Giudice, A.L. Solid barriers for windblown sand mitigation: Aerodynamic behavior and conceptual design guidelines. J. Wind Eng. Ind. Aerodyn. 2018, 173, 79–90. [Google Scholar] [CrossRef]
  34. Xiao, X. Evolution of Aeolian Dune Systems Considering Turbulent Fluctuations and Topographic Effects. Ph.D. Thesis, Lanzhou University, Lanzhou, China, 2024. [Google Scholar] [CrossRef]
  35. Wilson, J.D. Numerical studies of flow through a windbreak. J. Wind Eng. Ind. Aerodyn. 1985, 21, 119–154. [Google Scholar] [CrossRef]
  36. Wang, W.B.; Huang, N.; Dun, H.C. Analysis of wind–sand movement over sand dune with different railway forms downstream. Chin. J. Theor. Appl. Mech. 2020, 52, 680–688. [Google Scholar] [CrossRef]
  37. Dong, Z.B.; Luo, W.Y.; Qian, G.Q.; Wang, H.T. Evaluating the optimal porosity of fences for reducing wind erosion. Sci. Cold Arid Reg. 2011, 3, 1–12. [Google Scholar] [CrossRef]
  38. Zhou, Y.G.; Li, H.Y.; Wu, Z.F.; Wang, Z.R.; Yin, J.; Qing, D.M.N.; Eerdun, H. Sand fixation mechanism and effect evaluation of sand barriers in Mu Us sandy land, China. Chin. Sci. Bull. 2023, 68, 1312–1329. [Google Scholar] [CrossRef]
  39. Ma, X.X.; Wang, H.F.; Li, S.Y.; Kang, X.G.; Sun, N. Comparison of sand–protecting efficiency and terrain adapted of two checkerboard barriers. Bull. Soil Water Conserv. 2015, 35, 344–349. [Google Scholar] [CrossRef]
  40. Zou, H.; Yang, W.B.; Zhu, B.; Liu, D.Y.; Zhou, M.; Yang, B. Low–coverage desertification control: Theory and practice. Acta Ecol. Sin. 2025, 45, 1070–1076. [Google Scholar] [CrossRef]
  41. Abdallah, M.N.I.; Qulin, T.; Ramadan, M.; Habumuremyi, P. Mitigation measures for wind erosion and sand deposition in desert railways: A geospatial analysis of sand accumulation risk. Sustainability 2025, 17, 4016. [Google Scholar] [CrossRef]
  42. Zhang, K.; Zhao, P.W.; Zhao, J.C.; Zhang, X.X. Protective effect of multi–row HDPE board sand fences: A wind tunnel study. Int. Soil Water Conserv. Res. 2021, 9, 103–115. [Google Scholar] [CrossRef]
  43. Peng, H.; Jin, A.F.; Zhang, S.Z.; Zheng, B. Numerical simulation and parameter optimization of a new reed–nylon net combined sand fence. Sustainability 2023, 15, 13920. [Google Scholar] [CrossRef]
  44. Wu, X.X.; Guo, Z.Y.; Wang, R.D.; Fan, P.P.; Xiang, H.X.; Zou, X.Y.; Yin, J.; Fang, H. Optimal design for wind fence based on 3D numerical simulation. Agric. For. Meteorol. 2022, 323, 109072. [Google Scholar] [CrossRef]
  45. Chen, B.Y.; Cheng, J.J.; Li, S.Y. Reasonable spacing of high–parallel reed sand barriers along the Xinjiang S214 provincial highway. Arid Zone Res. 2020, 37, 782–789. [Google Scholar] [CrossRef]
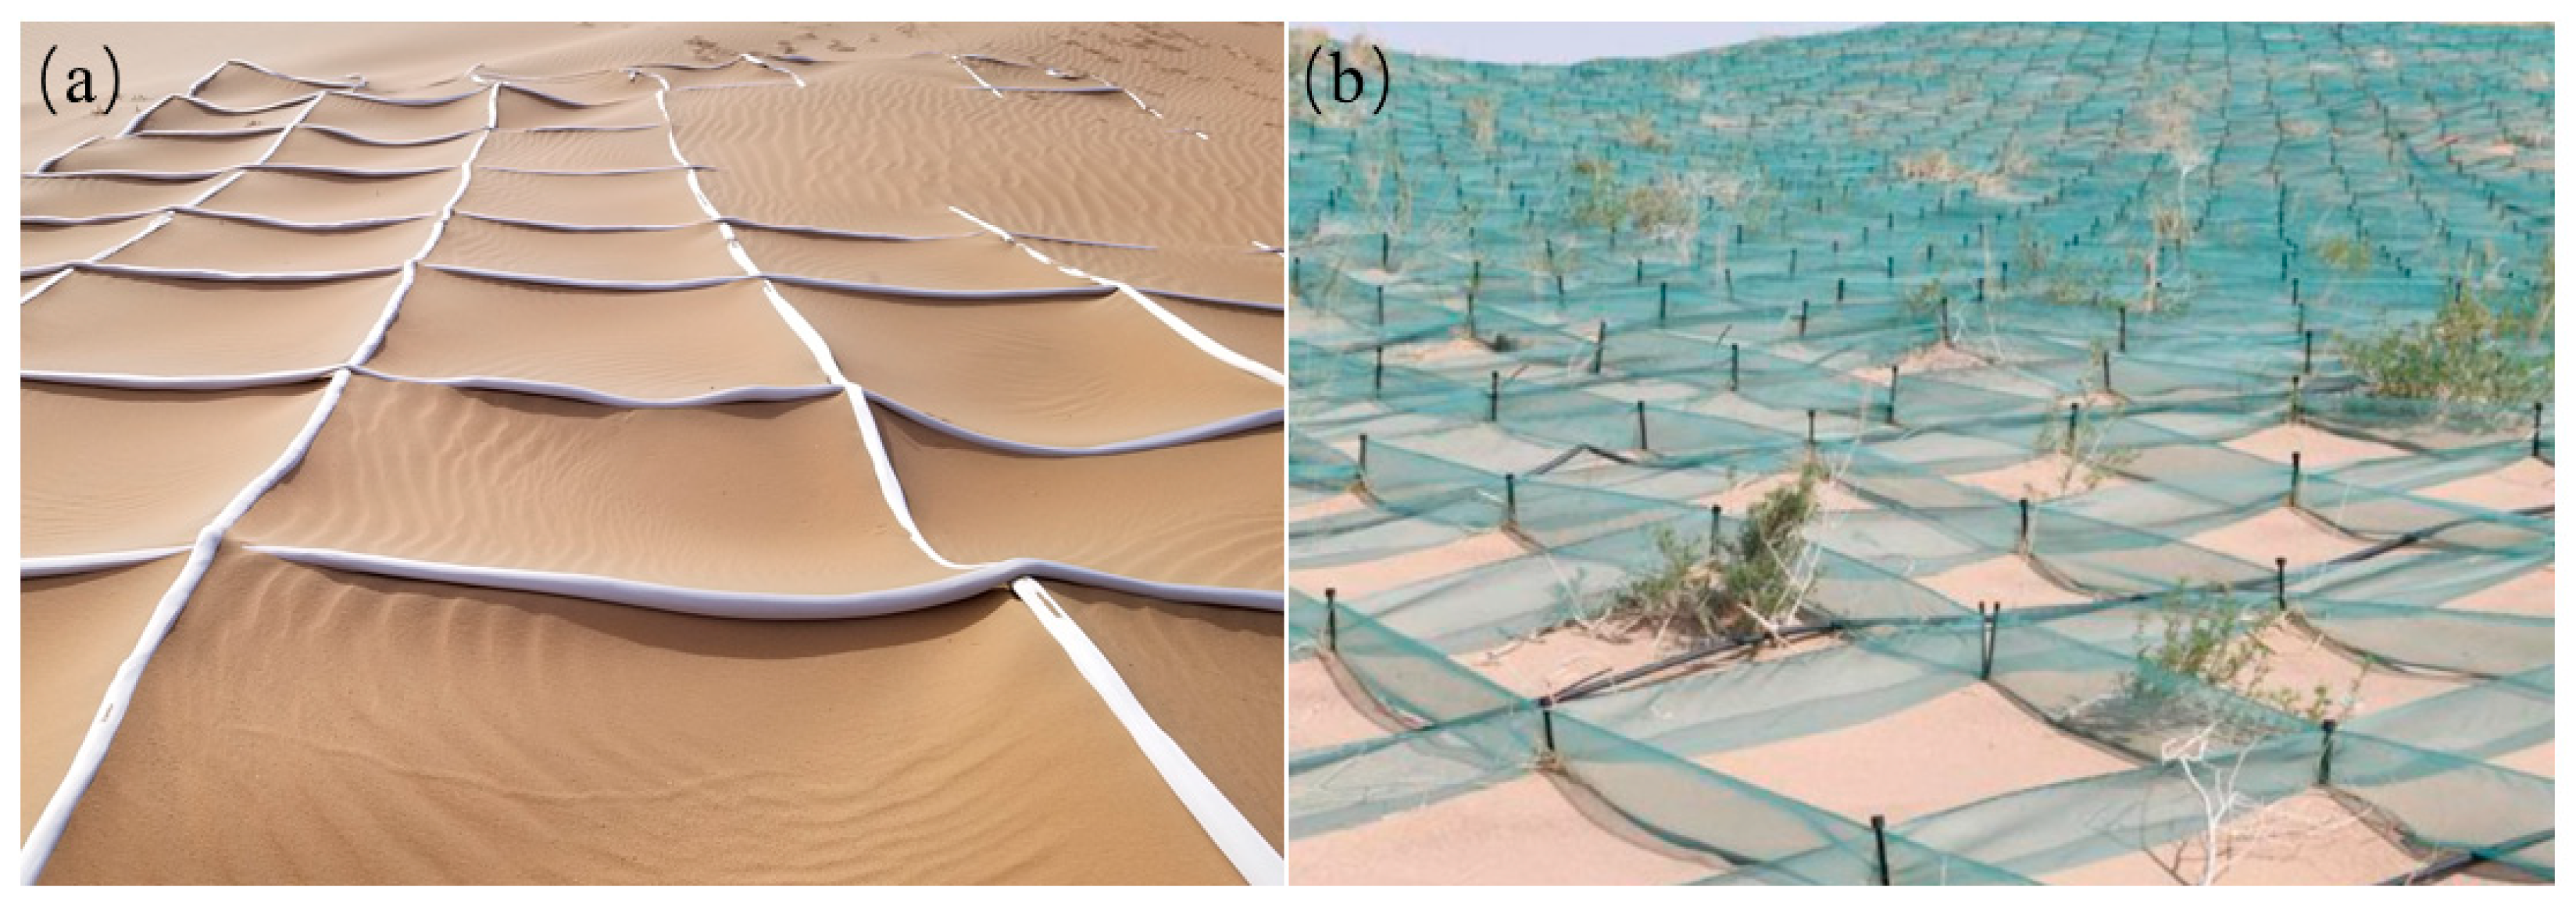
Figure 1. Application of PLA wind fences and permeable wind fences in engineering practices. (a) PLA wind fences; (b) permeable wind fences.
Sustainability 17 09418 g001
Figure 2. Schematic of the PLA sandbag–fiber mesh composite wind fence structure.
Sustainability 17 09418 g002
Figure 3. Schematic of the simulated flow field computation.
Sustainability 17 09418 g003
Figure 4. Case diagram of mesh generation (using mesh wind fences as an example).
Sustainability 17 09418 g004
Figure 5. Schematic of the three–dimensional numerical simulation model of the novel composite wind fence.
Sustainability 17 09418 g005
Figure 6. Wind tunnel of Beijing Forestry University.
Sustainability 17 09418 g006
Figure 7. Validation of wind tunnel experimental and simulated wind speeds around the wind fence.
Sustainability 17 09418 g007
Figure 8. Comparison of wind speed distribution contour maps for mesh wind fence, PLA wind fence, and novel composite wind fence.
Sustainability 17 09418 g008
Figure 9. Wind speed variation characteristics of mesh wind fence, PLA sandbag wind fence, and novel composite wind fence.
Sustainability 17 09418 g009
Figure 10. Windbreak efficiency of three wind fences at different heights and horizontal positions with an incoming wind speed of 10 m/s (%).
Sustainability 17 09418 g010
Figure 11. Variation in wind speed profiles for three types of wind fence.
Sustainability 17 09418 g011
Figure 12. Variation in TKE around the novel wind fence.
Sustainability 17 09418 g012
Figure 13. Variation in windbreak efficiency of the three–row wind fences with different inter–row spacing configurations under different incoming wind speed conditions.
Sustainability 17 09418 g013
Figure 14. Streamline diagram of the novel wind fences arranged in three rows under different spacing conditions (R represents the row spacing).
Sustainability 17 09418 g014
Table 1. Parameters for numerical simulation setup.
ParameterValueParameterValue
Aerodynamic roughness/m0.00003Turbulent viscosity ratio10
Roughness constant0.5Convergence criterion<10−4
Air density/(kg·m−3)1.225Temperature/K288.16
Air viscosity1.7894 × 10−5Turbulence intensity0.05
Table 2. Variation in effective protection distance for three types of wind fences under three typical wind speed conditions (m).
Incoming Wind SpeedMeshSandbagNovel
10 m/s5.204.666.36
18 m/s4.383.624.86
28 m/s4.143.244.18
Disclaimer/Publisher’s Note: The statements, opinions and data contained in all publications are solely those of the individual author(s) and contributor(s) and not of MDPI and/or the editor(s). MDPI and/or the editor(s) disclaim responsibility for any injury to people or property resulting from any ideas, methods, instructions or products referred to in the content.