Article

Urban Phenomena in Lesser Poland Through GIS-Based Metrics: An Exceptional Form of Urban Sprawl Challenging Sustainable Development

by
Marek Gachowski
1,* and
Łukasz Walusiak
2
1
Department of Architecture, Faculty of Architecture, Civil Engineering and Applied Arts, Academy of Silesia, ul. Rolna 43, 40-555 Katowice, Poland
2
Department of Computer Science, Faculty of Architecture, Civil Engineering and Applied Arts, Academy of Silesia, ul. Rolna 43, 40-555 Katowice, Poland
*
Author to whom correspondence should be addressed.
Sustainability 2025, 17(21), 9394; https://doi.org/10.3390/su17219394
Submission received: 7 August 2025 / Revised: 28 September 2025 / Accepted: 16 October 2025 / Published: 22 October 2025
(This article belongs to the Special Issue Urbanization and Environmental Sustainability—2nd Edition)

Abstract

Urban sprawl has been the subject of extensive scholarly investigation, as it is widely regarded as an unfavourable phenomenon with profound socio-economic consequences. Its fundamental forms have been delineated through specific Spatial Form Metrics (SFMs). In southern Poland, there exists a region whose dispersed development pattern is particularly distinctive. Owing to its considerable size—exceeding 5500 km2—it was deemed appropriate to analyse this area using the metrics and categories conventionally applied in urban sprawl research. The findings reveal a settlement pattern often described in the literature as resembling a ‘leopard skin’. Key urban parameters—such as density, intensity, dispersion, and clustering—were most effectively characterised by Shannon entropy levels calculated for these categories. In all instances, the entropy values proved to be very high, indicating minimal variation in development form across the study area. This outcome reflects the prevalence of numerous small, closely spaced building clusters, without the emergence of major concentrations capable of serving as nuclei for service centres with a developed public realm. As a result, structures that would ordinarily provide higher-order services and foster social integration fail to materialise. The implications for the open landscape are pronounced and predominantly negative: both agricultural landscapes and the still-existing, though limited, semi-natural landscapes are severely fragmented by scattered, unstructured building clusters. This fragmentation undermines rational agricultural management and impedes the conservation of self-regenerating areas that approximate the natural landscape. Against this backdrop, the present study examines the built-up structure of Area X in order to delineate pathways for a transition from environmentally detrimental settlement patterns towards forms of development that not only ensure the sustenance of urban life but also align with the broader principles of sustainable urban development, thereby safeguarding the continuity of urban life as a fundamental condition for long-term urban resilience.

1. Introduction

In the current discourse on urbanism, the primary streams focus on reconstructing the city as a coherent socio-urban system. Various forms of this revitalisation are commonly named—often for broader, including media, recognition—as the smart city, resilient city, 15 min city, and so forth. The most comprehensive term, and therefore the one best suited to the present context, seems to be the concept of the regenerative city, referred to as Ecopolis [1].
Consequently, topics relating to phenomena that negatively affect the cohesion and life-supporting capacity of both Urbis and Orbis are also examined and described. Thus, urbanism debates frequently address one of the most detrimental phenomena for cities, namely urban sprawl and suburbanisation. At the same time, a partly separate stream concerns the global city, the world city, or planetary urbanisation [2]. These discussions often continue debates initiated in the twentieth century [3,4,5,6]. However, today they take on particular significance in the context of climate change and the dominance of industrialised and globalised methods of food production, which operate in a feedback loop with climate change, as both its cause and its consequence.
In the context of widespread assertions that the global urban population is rapidly increasing, it is particularly important to distinguish between two key concepts related to built-up areas: the city and the urbanised area. These represent two distinct notions, describing fundamentally different forms of spatial organisation for human habitation, although both are inhabited by communities primarily engaged in non-agricultural economic activities and lifestyles [7]. Nonetheless, it is predominantly within cities that an urban way of life is cultivated—arguably the most desirable, as it is the most socially engaging and conducive to the development of social capital [8,9].The exceptional character of the city and urban lifestyle is repeatedly emphasised in the literature cited. It follows that the less urban and the more extensive and dispersed a settlement area is, the less favourable it becomes for the formation of community among its inhabitants. It is justifiable to assert that the most essential feature of the city is that it provides the basis for residents to function in a state of dominant symbiosis, upon which synergistic relationships develop and conditions for emergence arise [10].
The structural aspects of cities have a rich body of literature, detailing the positive functional and social effects of urban environments. Particular attention has recently been drawn to the contributions of the Space Syntax approach [11,12,13,14]. In this context, it is clear that further research on purely urbanised structures, with an emphasis on their negative characteristics and destructive impacts on resident communities, is warranted. Studies of the urban morphology of such areas will provide georeferenced foundations for spatially oriented interdisciplinary research and ensure the quantification of phenomena within the urban subsystem.

2. Research Problem and Aim of the Study

2.1. Area X in Southern Poland—An Exceptional Form of Urban Sprawl?

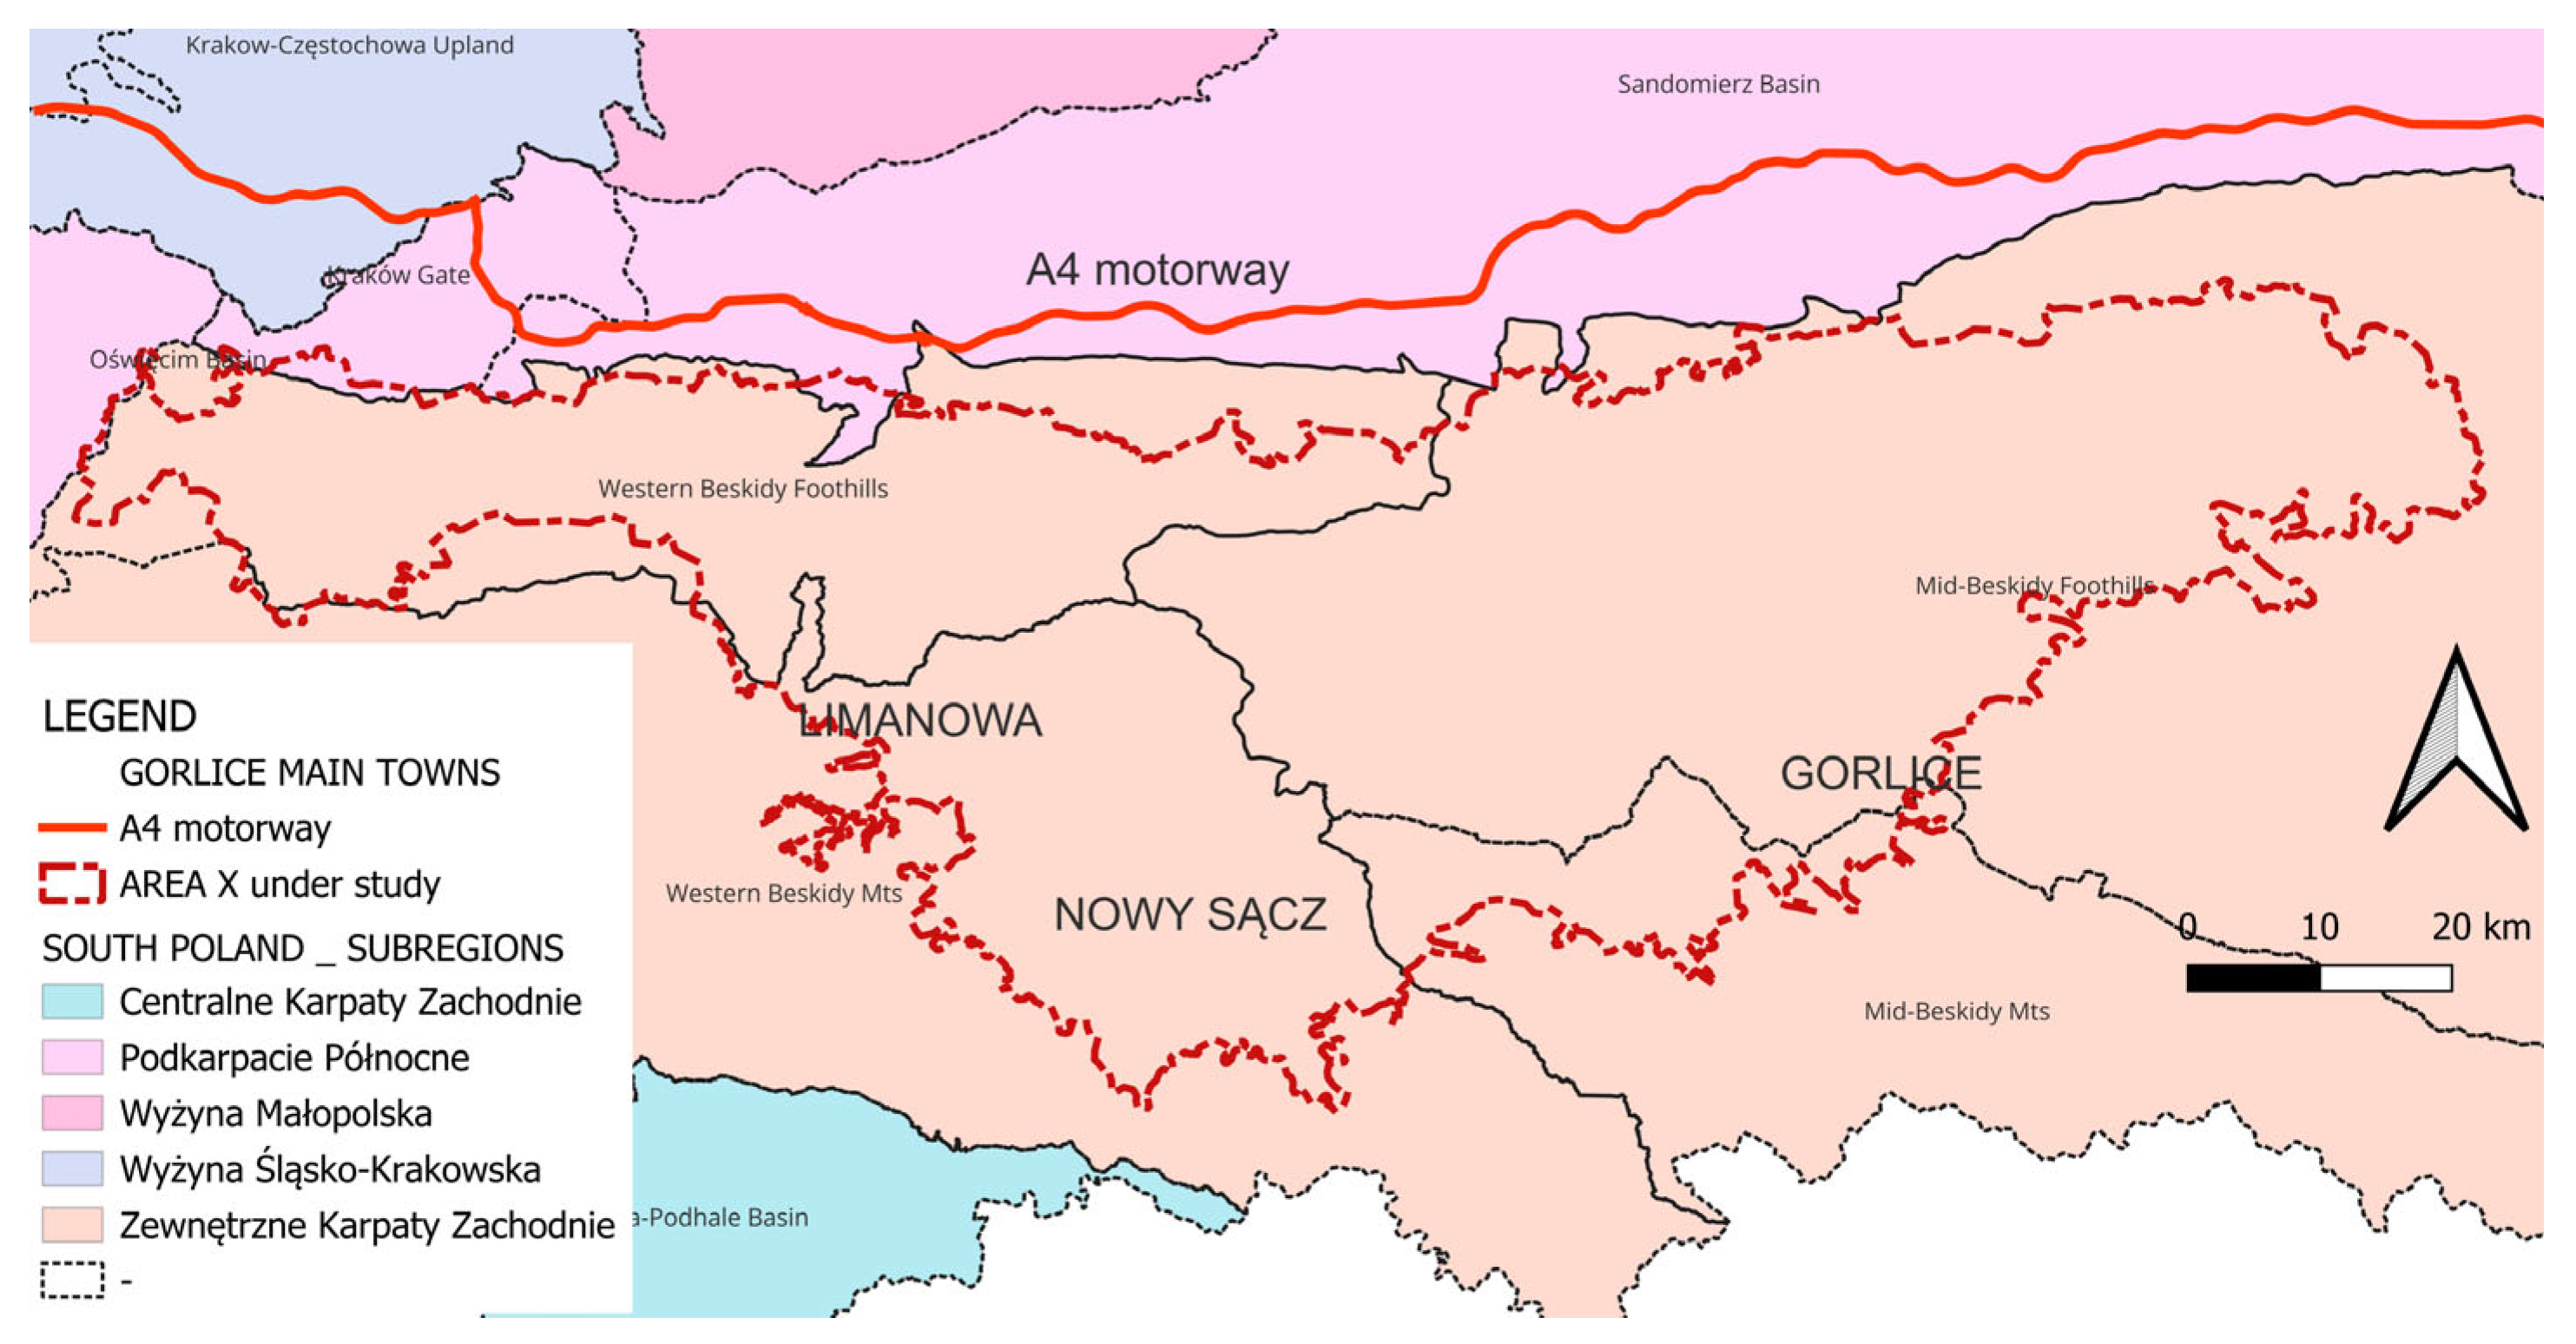
The structure and morphology of built-up areas in Poland, as in many European countries, is highly complex. Regrettably, in the Polish context numerous areas that long ceased to be natural and are now developed have neither remained villages nor, unfortunately, evolved into cities. As is the case worldwide, Poland experiences the phenomenon of urban sprawl, which manifests in a variety of forms. A broad overview of its morphology shows that alongside the classical form of suburbanisation around urban centres, a rather exceptional and unique form of dispersed suburbanisation occurs south of the A4 motorway in the Lesser Poland Voivodeship—for the purposes of this study referred to as “Area X” (Figure 1).
For the purposes of this study, the boundaries of Area X were defined on the basis of its visual delineation using orthophotomap data and information on the built-up structure (building layout) derived from the topographic map. The uniqueness of this area facilitated such a delimitation. Work is currently underway to develop an automated method for the delimitation of such areas, based on morphological data and employing GIS tools (QGIS 3.44.).
The uniqueness of this phenomenon merits detailed investigation to more substantively describe, and in due course to examine and assess, the phenomenon.

2.2. Urban Sprawl as a Research Problem

In recent years, the literature presenting detailed studies of urbanised area structures—often termed morphometric studies—has grown significantly, with a particular focus on suburbanisation phenomena. This trend is supported by the development of tools enabling objective quantitative, and thus qualitative, analyses based on GIS. These methods are largely inspired by implementations of New Science of Cities principles and derivatives developed for studying spatial structures, though predominantly applied to cities and their fragments [15,16,17].
Investigating urban sprawl as a destructive process for cities is essential for planning corrective actions in the first instance, and, on this basis, preventive measures as well. Sprawl is both a formed state (the urban structure) and a process occurring within the resident community [18]. Therefore, research into prevention methods should primarily focus on corrective influence on social processes, while corrective actions should target both the urban and social subsystems [19].
In the context of literature and lived experience, it is reasonable to suspect that the structures described above in southern Poland do not create attractive living conditions; indeed, they do not foster synergy or emergence in the built environment. From this perspective, they do not constitute a favourable living environment that meets the criterion of life-sustaining capacity—the essence of sustainability [20]. Simultaneously, owing to their spatial extent, which we will further detail, these developments significantly expand the Anthropocene of low value while restricting areas that might, at least partially, approach natural conditions (bearing in mind that in the present era truly natural ecosystems no longer exist on Earth) [21]. This complex issue calls for interdisciplinary research, in which urban planners provide the spatial and morphological foundations for studying and documenting social processes. Accordingly, one of the aims of this study is to develop a foundational dataset that describes the urban subsystem in a way that enables multidisciplinary research on the social subsystem, while preserving a strict linkage to the georeferenced structure of the urban subsystem.
Conducting morphometric analyses of the structural variation in urban development in Poland, even in the era of big data and GIS systems, remains a task yet to be accomplished. To plan and successfully implement such analyses across a wide range of research domains, it is essential to begin with focused pilot studies in selected areas, from which insights can inform the broader undertaking. In the initial phases, the selection of research samples must rely more on practical expertise than on systematic analytical procedures. It is clear that these early choices will inevitably involve a degree of subjectivity and will be oriented toward the most salient phenomena.

2.3. Particular Urban Morphology of Area X

It is precisely based on such subjective and individual experience that we have decided, in the first instance, to investigate this area in Lesser Poland, which, in our view, is one of the most unique and specific built-up areas in Poland. It is located in the foothills of the Kraków Upland, between Kraków and Rzeszów—two key cities in southern Poland—yet lies at a considerable distance from both. In the meridional direction, it extends between the A4 motorway corridor (in effect following an ancient east–west trade route) and the mountainous terrain of the Low Beskids. In the latitudinal direction it develops from Andrychów (south-west of Kraków) to Rzeszów. It should be noted that the A4 motorway forms part of the longest European route, E40, stretching from Calais in France to Ridder in Kazakhstan (Figure 2).
What is immediately striking is the exceptionally low-intensity, dispersed form of development, which lacks the hallmarks of classic suburbanisation around major urban centres—Kraków, Tarnów, Dębica, Rzeszów, and Nowy Sącz all lie on the periphery of Area X. Furthermore, this development does not appear to have been shaped by professional or commercial developers. Rather, it predominantly comprises private residential construction undertaken by individual investors, typically on plots either long in their possession or acquired through familial or neighbourly transactions. This distinctive pattern is clearly discernible even in a simple map representation of buildings overlaid with contour lines and orthophotography (Figure 3).
Area X, covering 5567 km2, is home to roughly 897,000 inhabitants. Its average population density is about 161 persons per km2, compared with 226 persons per km2 for the Lesser Poland Voivodeship and 119 persons per km2 for the Subcarpathian Voivodeship. Geometrically, Area X fits within a rectangle measuring 182 km west–east and 52 km north–south.
A complete understanding of Area X would be incomplete without acknowledging the region’s history over the past 250 years. Between 1792 and 1918, as a result of the partitions of Poland, these territories were governed, in succession, by the Habsburg Monarchy, the Austrian Empire, and Austria–Hungary, effectively forming a province of this multi-national state [22].

2.4. State of Research and Literature Review

2.4.1. European Studies of Urban Sprawl

The study of urban sprawl has a well-established body of literature that comprehensively examines various aspects of this phenomenon, both from the perspective of the urban subsystem in relation to itself and vice versa. A summary of this work is provided in the report by the European Environmental Agency [23], which extensively discusses the environmental impacts of sprawl as a process and proposes strategic remedial actions [24].
Sprawl is recognised as a destructive factor in the traditional urban–rural balance in Europe. The ESPON 1.1.2 project report [25] offers a broad overview of the transformations along the urban–rural continuum.
A key research challenge has been the development of methods to measure and thus delineate sprawl. Basic measurement approaches based on classical urban planning indicators—such as building density, dispersion of built-up areas, and the occupational characteristics of inhabitants—have yielded unsatisfactory results. Consequently, the literature has proposed more sophisticated measures integrating these indicators to capture the unique properties of sprawl areas. Numerous methods have been proposed and validated; all grounded in defined multidimensional features of this socio-urban phenomenon.

2.4.2. Metrics for Analysing Urban Sprawl

Sprawl is widely characterised through eight specific descriptive categories also called as Spatial Form Metrics (SFM) [18]:
  • Density (DEN)—low intensity of built-up development.
  • Continuity (CON)—fragmented, discontinuous development.
  • Concentration (CEN)—dispersion of development.
  • Clustering (CLU)—chaotic building distribution lacking clear urban structures.
  • Centrality (CTR)—erosion of dominant urban centres.
  • Nuclearity (NUC)—low degree of nucleation, both mono- and poly-nuclear.
  • Mixed Use (MIX)—separation (zoning) of residential, commercial, and industrial uses with relatively low non-residential share.
  • Proximity (PRX)—separation of places of residence, work, and services.
Since the above categories overlap to some extent, they can be aggregated and adapted to the specificity of the area under study [26].
Analysis of these categories led to the development of a universal sprawl index based on Bayesian factor analysis [27]. Similarly integrative measures include the Weighted Urban Proliferation (WUP) index [28] and the Integrated Sprawl Index [29]. These studies aimed to produce analytical tools that efficiently identify sprawl areas and enable the analysis and understanding of socio-urban phenomena therein.
The goal of these urban-focused sprawl studies is to create a georeferenced urban layer for multidisciplinary research in the social subsystem, with important spatial differentiation of the described phenomena [30,31].

2.4.3. Shannon’s Entropy

A review of the literature indicates that a central pursuit in sprawl research has been identifying the most critical descriptive indicator. Entropy has become a significant research category across many fields beyond thermodynamics, largely thanks to Shannon’s work in 1948 [32]. In urban planning, entropy appears to be a vital concept because it closely relates to the complexity of socio-urban systems [17].
Since entropy measures disorder [16], it is justifiable to regard it as a key concept in studying sprawl and suburbanisation. Empirical evidence suggests that spatially diverse and hierarchical urban structures—i.e., those with higher entropy—are more attractive to inhabitants and more resilient to broader systemic changes [33]. In such differentiated and complex structures, levels of symbiosis, synergy, and emergence are higher. A classic example is Christaller’s central place theory describing settlement networks [34].
For sprawl research, GIS-based methods culminating in entropy analyses have proven crucial [35]. Spatial geographers provide comprehensive reviews of sprawl analysis methods, with Shannon entropy consistently emphasised, and other techniques such as Kostubric’s spatial concentration method also noted [36].
A similar methodological overview appears in the study of 156 European cities regarding sprawl [37]. Shannon entropy is widely used for analyses of various spatial phenomena tied to settlement transformation [38,39] underscoring the importance of selecting appropriate quantitative categories for entropy measurement [18].
The use of Shannon entropy is widespread globally. It has been applied to urban planning studies in Asia—in South Korea [40], Indonesia [41], China [35], and India [42,43]—as well as in Europe for a study of 156 cities [37], in Switzerland [28] and in Canada [38].
Shannon entropy is also used to present distributions and aspects of the social subsystem in reference to the urban subsystem—such as income distributions across regions and subregions in Poland [30].
The literature highlights the negative impact of dispersed development on social interaction levels [8], a dominant though not universal position. Most studies demonstrating a negative correlation between social capital and built density concern non-European contexts, where built structures are often overly dense [44,45,46]. European studies, however, emphasise the negative effects of sprawl on social cohesion [23]. Consequently, low levels of social integration and democratic engagement are observed, although familial and close-neighbour ties—typical of rural areas—persist [47,48]. Similar results have been found in Poland [49]. Notably, older publications sometimes regard sprawl as a new form of settlement organisation [50,51,52,53].
The acceptance of sprawl is decidedly hazardous in the context of the climate crisis. Many authors who once endorsed sprawl have since revised their positions [54]. The environmental consequences of sprawl are extreme, drawing particular attention in Europe [55]. These include uncontrolled environmental exploitation practices (due to low social capital), energy-intensive behaviours by residents resulting from dispersed development (lack of active spatial policies), and fragmentation of undeveloped areas that significantly reduces biosystem resilience [56,57,58,59]. The significance of sprawl in Europe has prompted EU agencies to maintain ongoing monitoring of the built-to-non-built balance, notably through the CORINE database [60].

3. Aim of Research

The purpose of this study is to parameterise and objectify the description of the built-up structure of Area X in order to highlight its highly specific and exceptional form in the Polish context. Such a description is indispensable for revealing the profoundly negative consequences of this settlement pattern for the climate, agricultural production, the natural environment, and the social and economic conditions of life in this region. Ultimately, it serves to demonstrate the fundamental incompatibility of this form of development with the principles of sustainable development.

4. Material and Method

4.1. Material

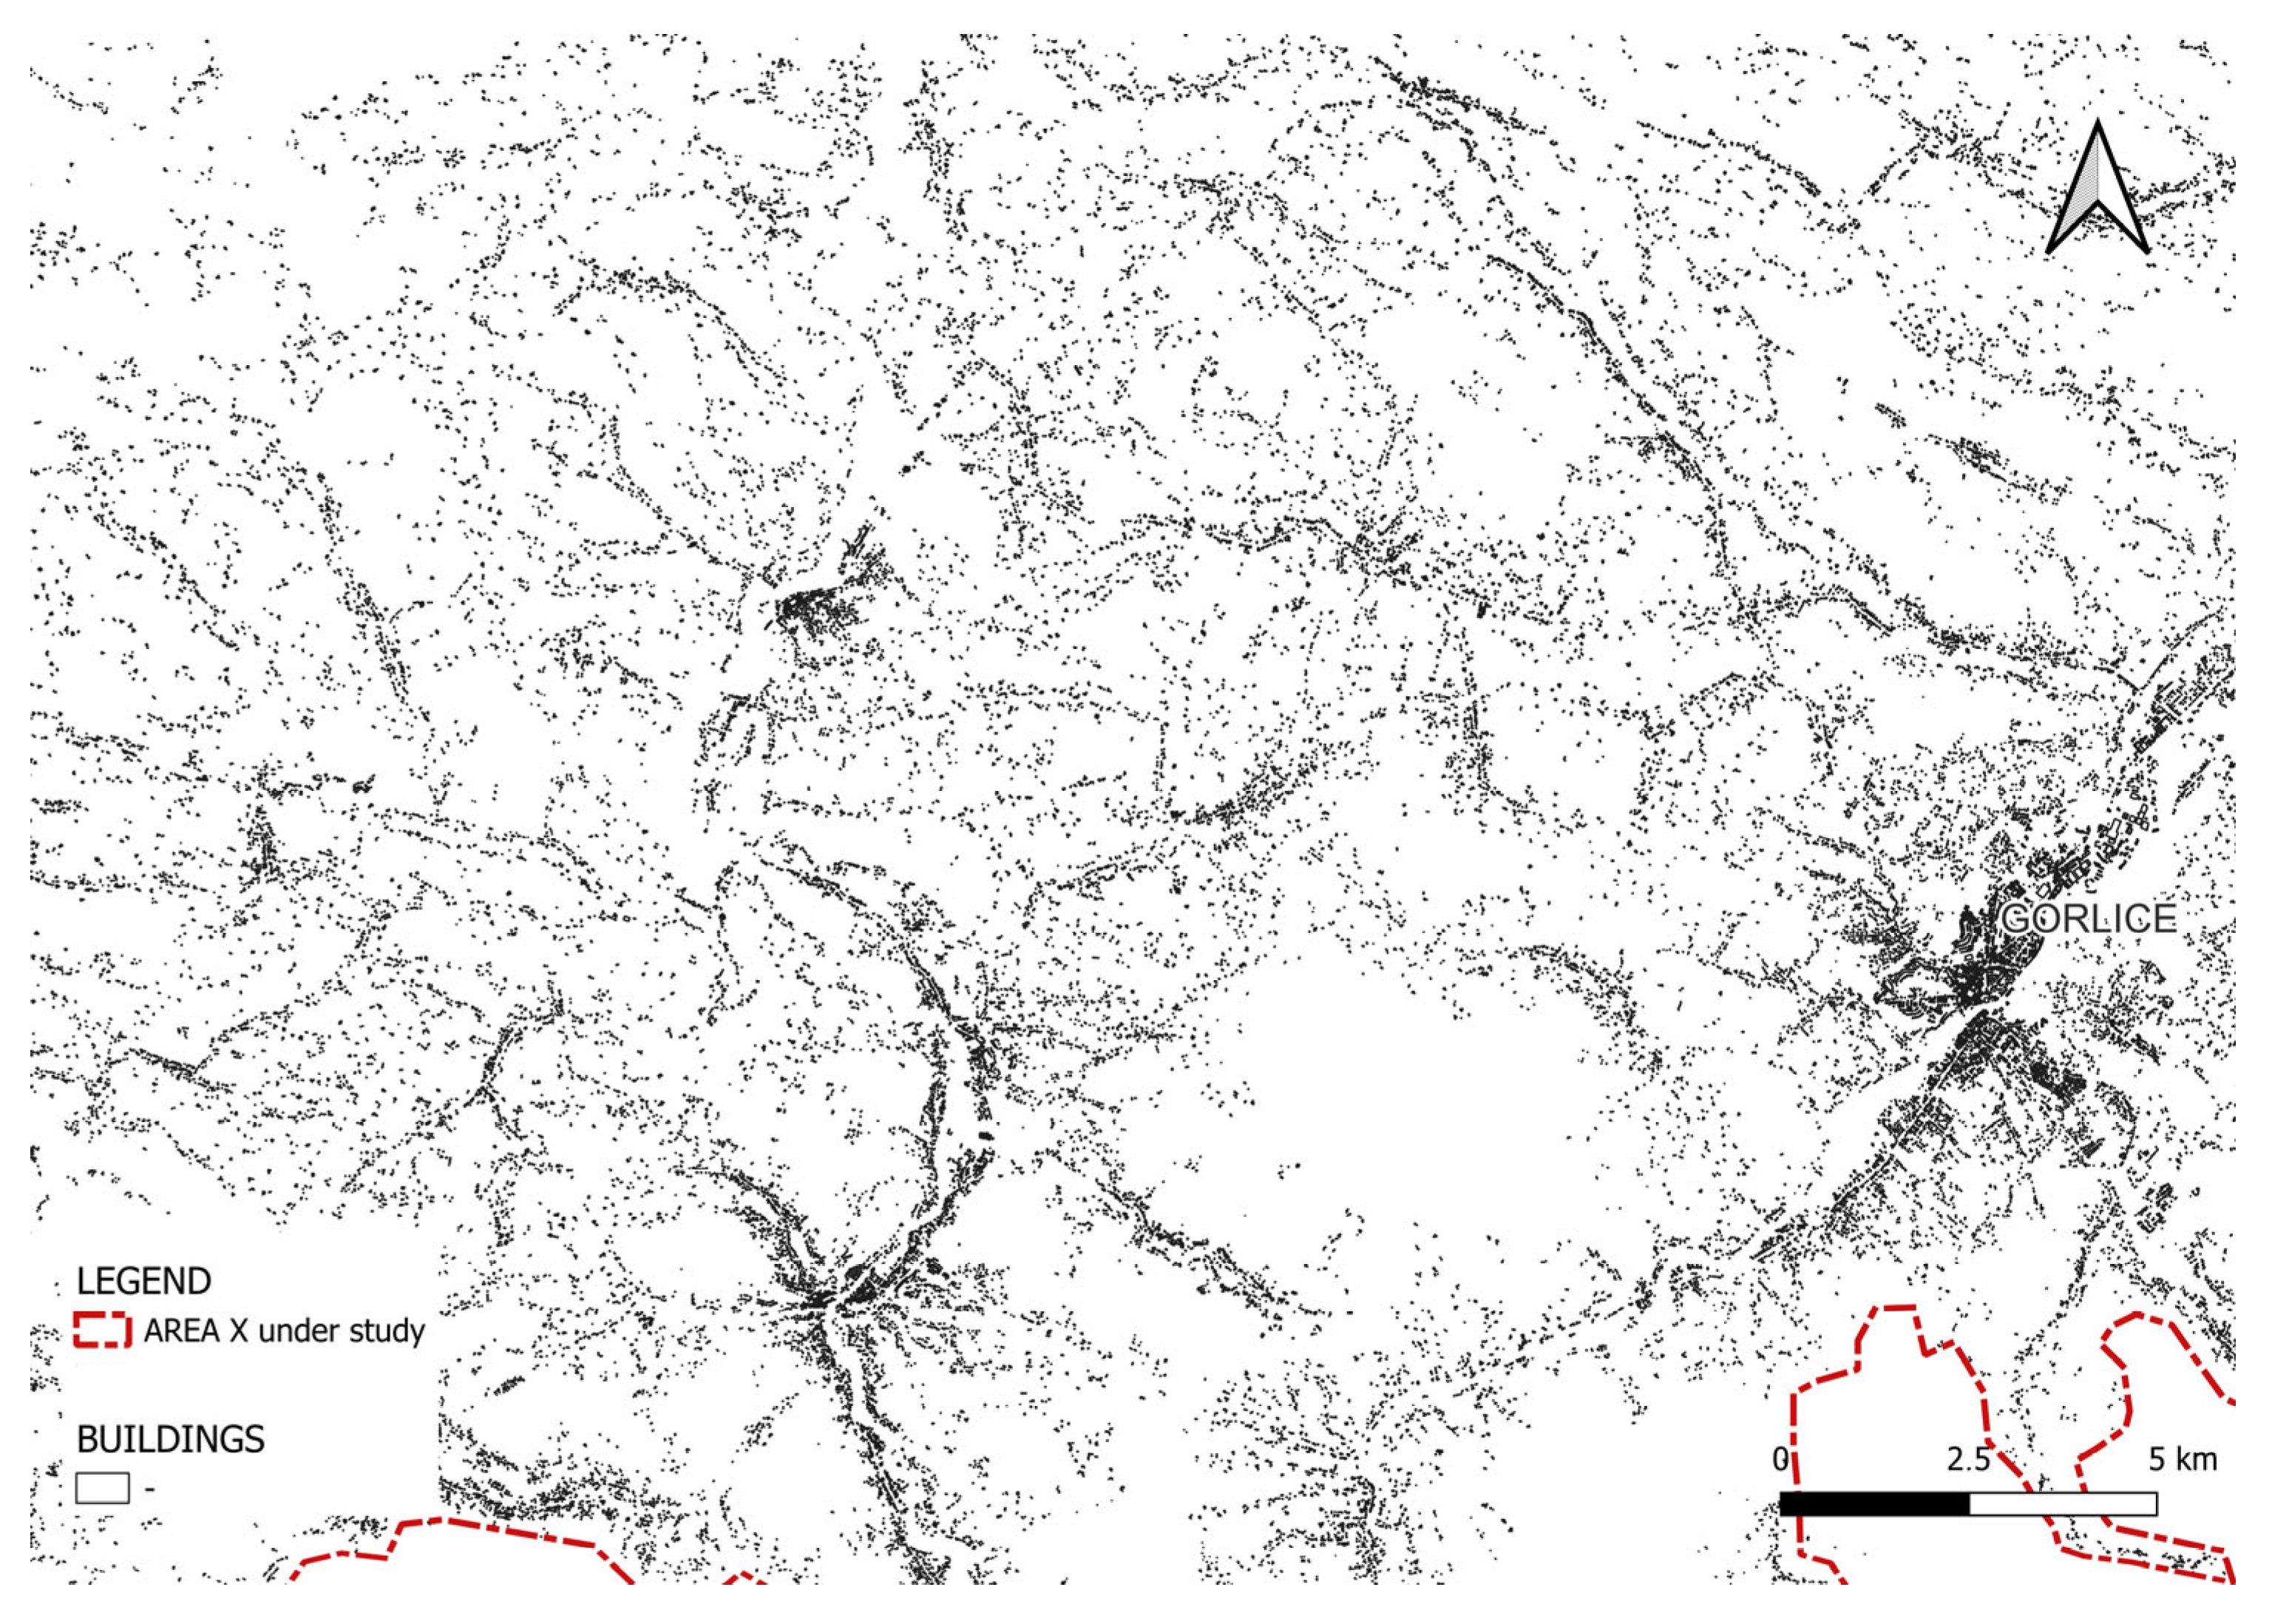
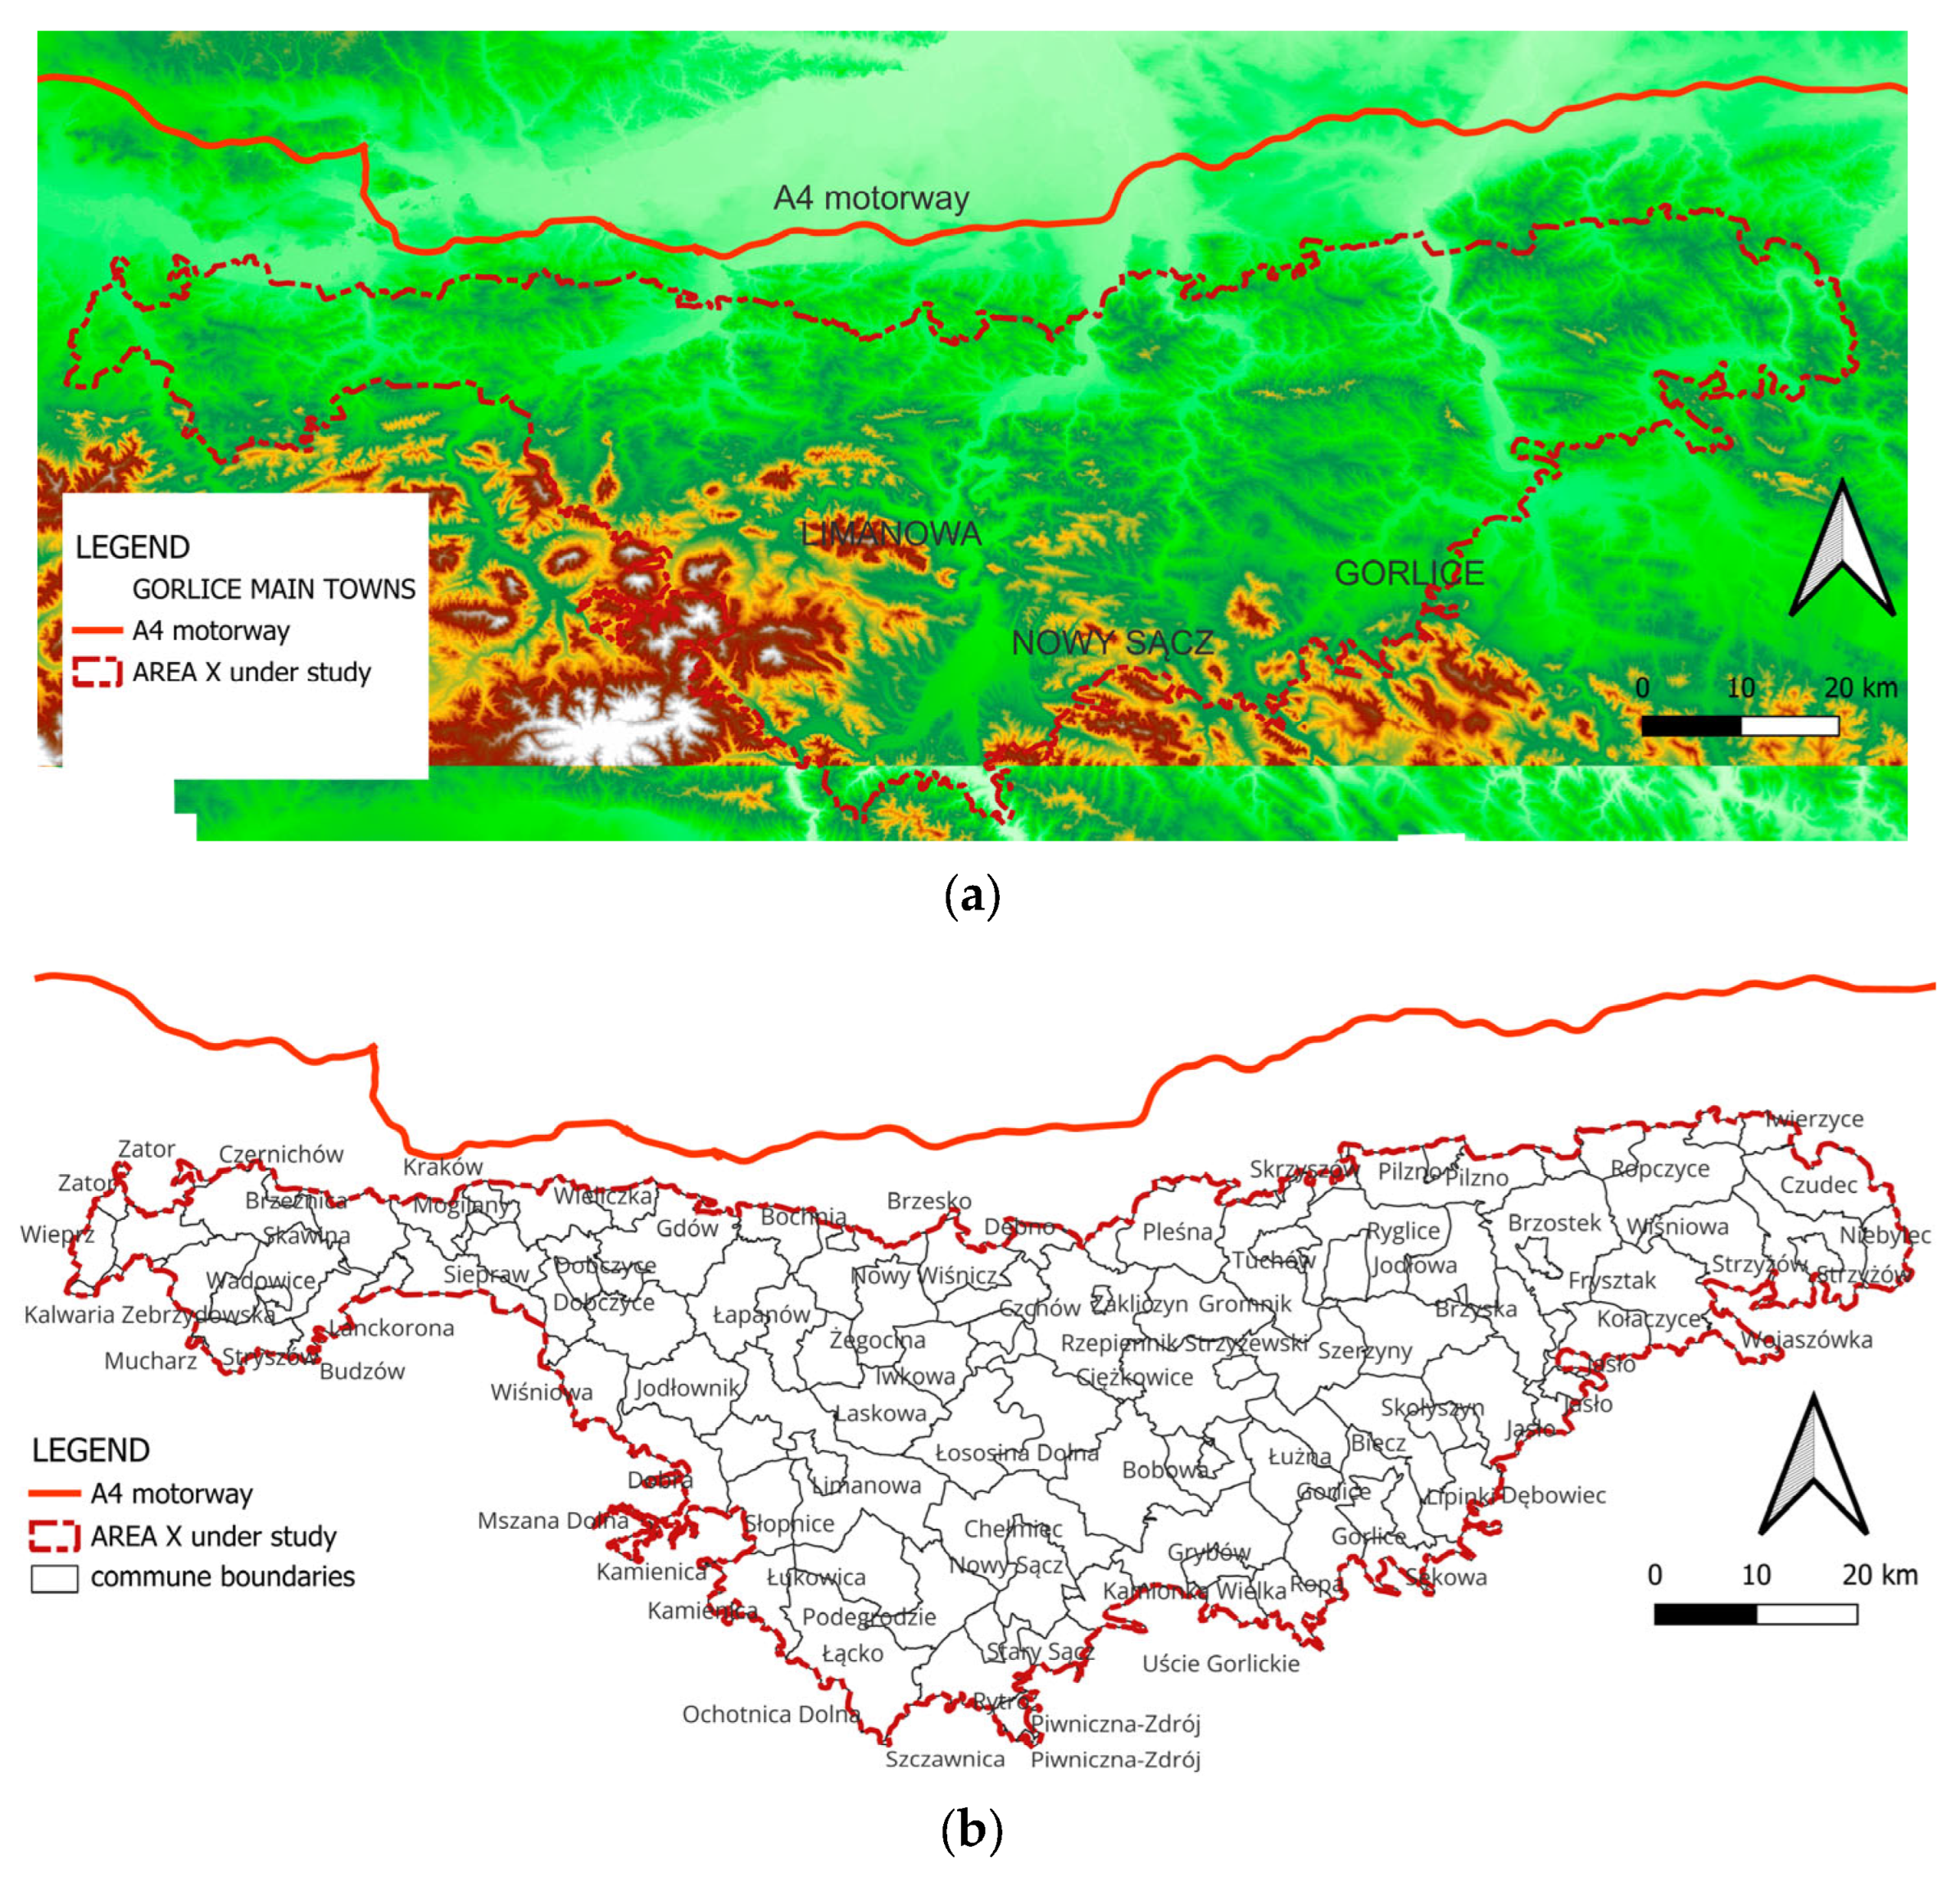
As mentioned in the Introduction, the subject of this study is a specific form of dispersed settlement unique to Lesser Poland (Figure 4). The boundaries of Area X were defined primarily based on the extent of dispersed development (visually assessed on a topographic map) and supplemented by generalized hypsometric data obtained as a GIS database from the publicly accessible national portal of the Head Office of Geodesy and Cartography in Poland (Figure 5).
A critical factor influencing subsequent work was that the acquired data were in the form of a vector spatial database. These data were obtained from sources made available by the Head Office of Geodesy and Cartography (GUGiK): www.geoportal.gov.pl. These vector data are up to date, originating from 2024, while the orthophotomaps are dated to 2023 and 2024. Consequently, a method different from those used for satellite or aerial raster orthophoto maps was necessary for analysis [61,62].
The collected material was prepared and processed using GIS tools (using the native tools of QGIS 3.44 as well as custom procedures developed in Python 3.12.0). Boundaries of Area X were drawn to be as parallel as possible to contour lines. However, deviations were necessary in places where settlement occurred on slopes and elevated plateaux. Notably, Area X largely remains within the Lesser Poland Voivodeship, extending only marginally into the Subcarpathian Voivodeship, despite administrative borders being defined primarily on administrative criteria.
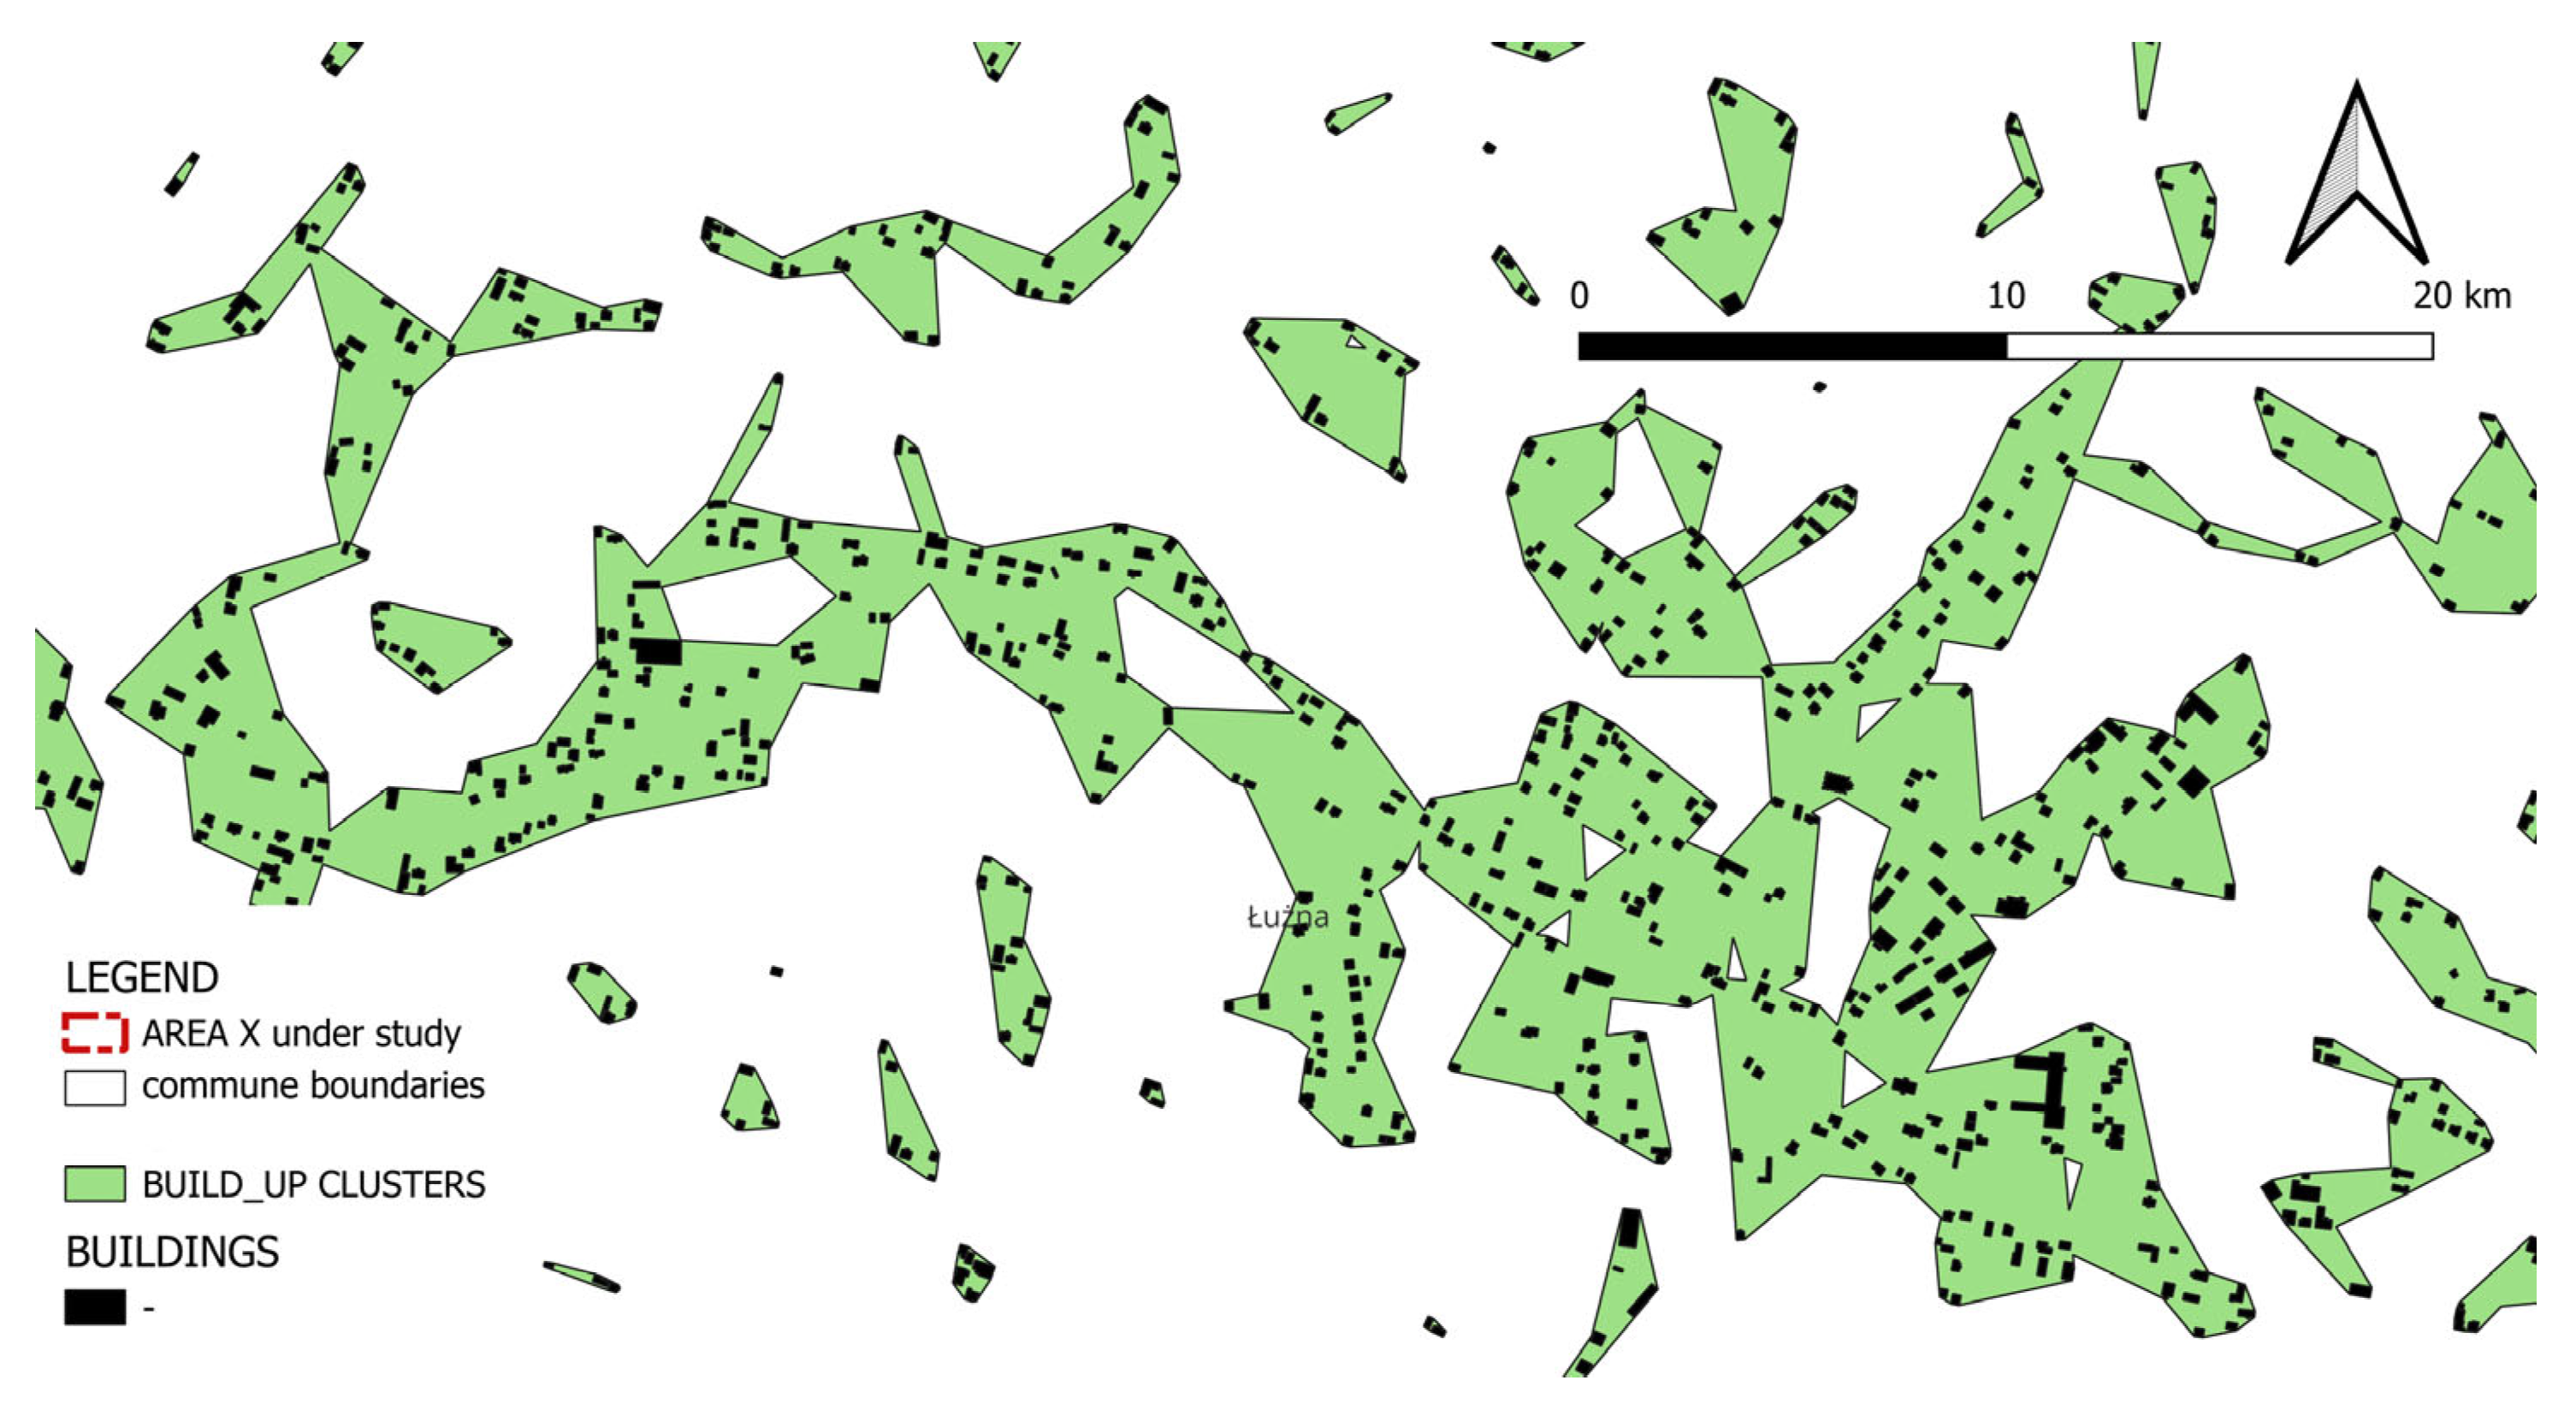
Dispersion of settlement in Area X was assessed using building and clustering data. Buildings were aggregated into settlement clusters if the distance between the nearest corners of any two buildings did not exceed 100 m. A settlement cluster was defined as a group of buildings in which each building lies within 100 m of at least one other building in the group. Aggregation was performed using hierarchical clustering with a single linkage criterion. Individual isolated buildings (more than 100 m from any building or cluster) were intentionally omitted. Buildings located farther than 100 m from the nearest cluster and clusters under 600 m2 in area were excluded (Figure 6).
The basis for further analytical work is thus a topographic map layer containing the building layer, the settlement cluster layer (excluding buildings more than 100 m from clusters), and the road layer, supplemented by contour and hypsometric layers. For each cluster, the number of buildings and total built-up area were calculated. Functional analysis showed that about 80% of buildings in Area X are single-family residences, 8% are farm structures, and the remaining 7% are service and other buildings.
This method of preparing the material in Area X is necessary to ensure reliable results—hence the need to structurally subdivide Area X to enable internal differentiation. Therefore, as part of the methodology, we examined features differentiating Area X by subdividing it into “basic units”—grid cells of 1 km side and 100 ha area (1 km2)—and explored the potential for defining Spatial Form Metrics (SFM) characteristic of Area X based on its internal settlement morphology (e.g., polygons defined by cluster centroids) [63].
The chaotic spatial pattern in Area X made visual delimitation on a topographic map difficult. This prompted the development of a more objective method. It is anticipated that the results of this study will enable the formulation of such principles and tools, which is one of the key objectives of this work.

4.2. Method

Based on the review of publications addressing quantitative and qualitative analyses of sprawl, it was possible to plan a sequence of studies and identify the main research categories deemed capable of measuring the urban parameters characterising development in Area X in a manner most useful for subsequent interdisciplinary research.
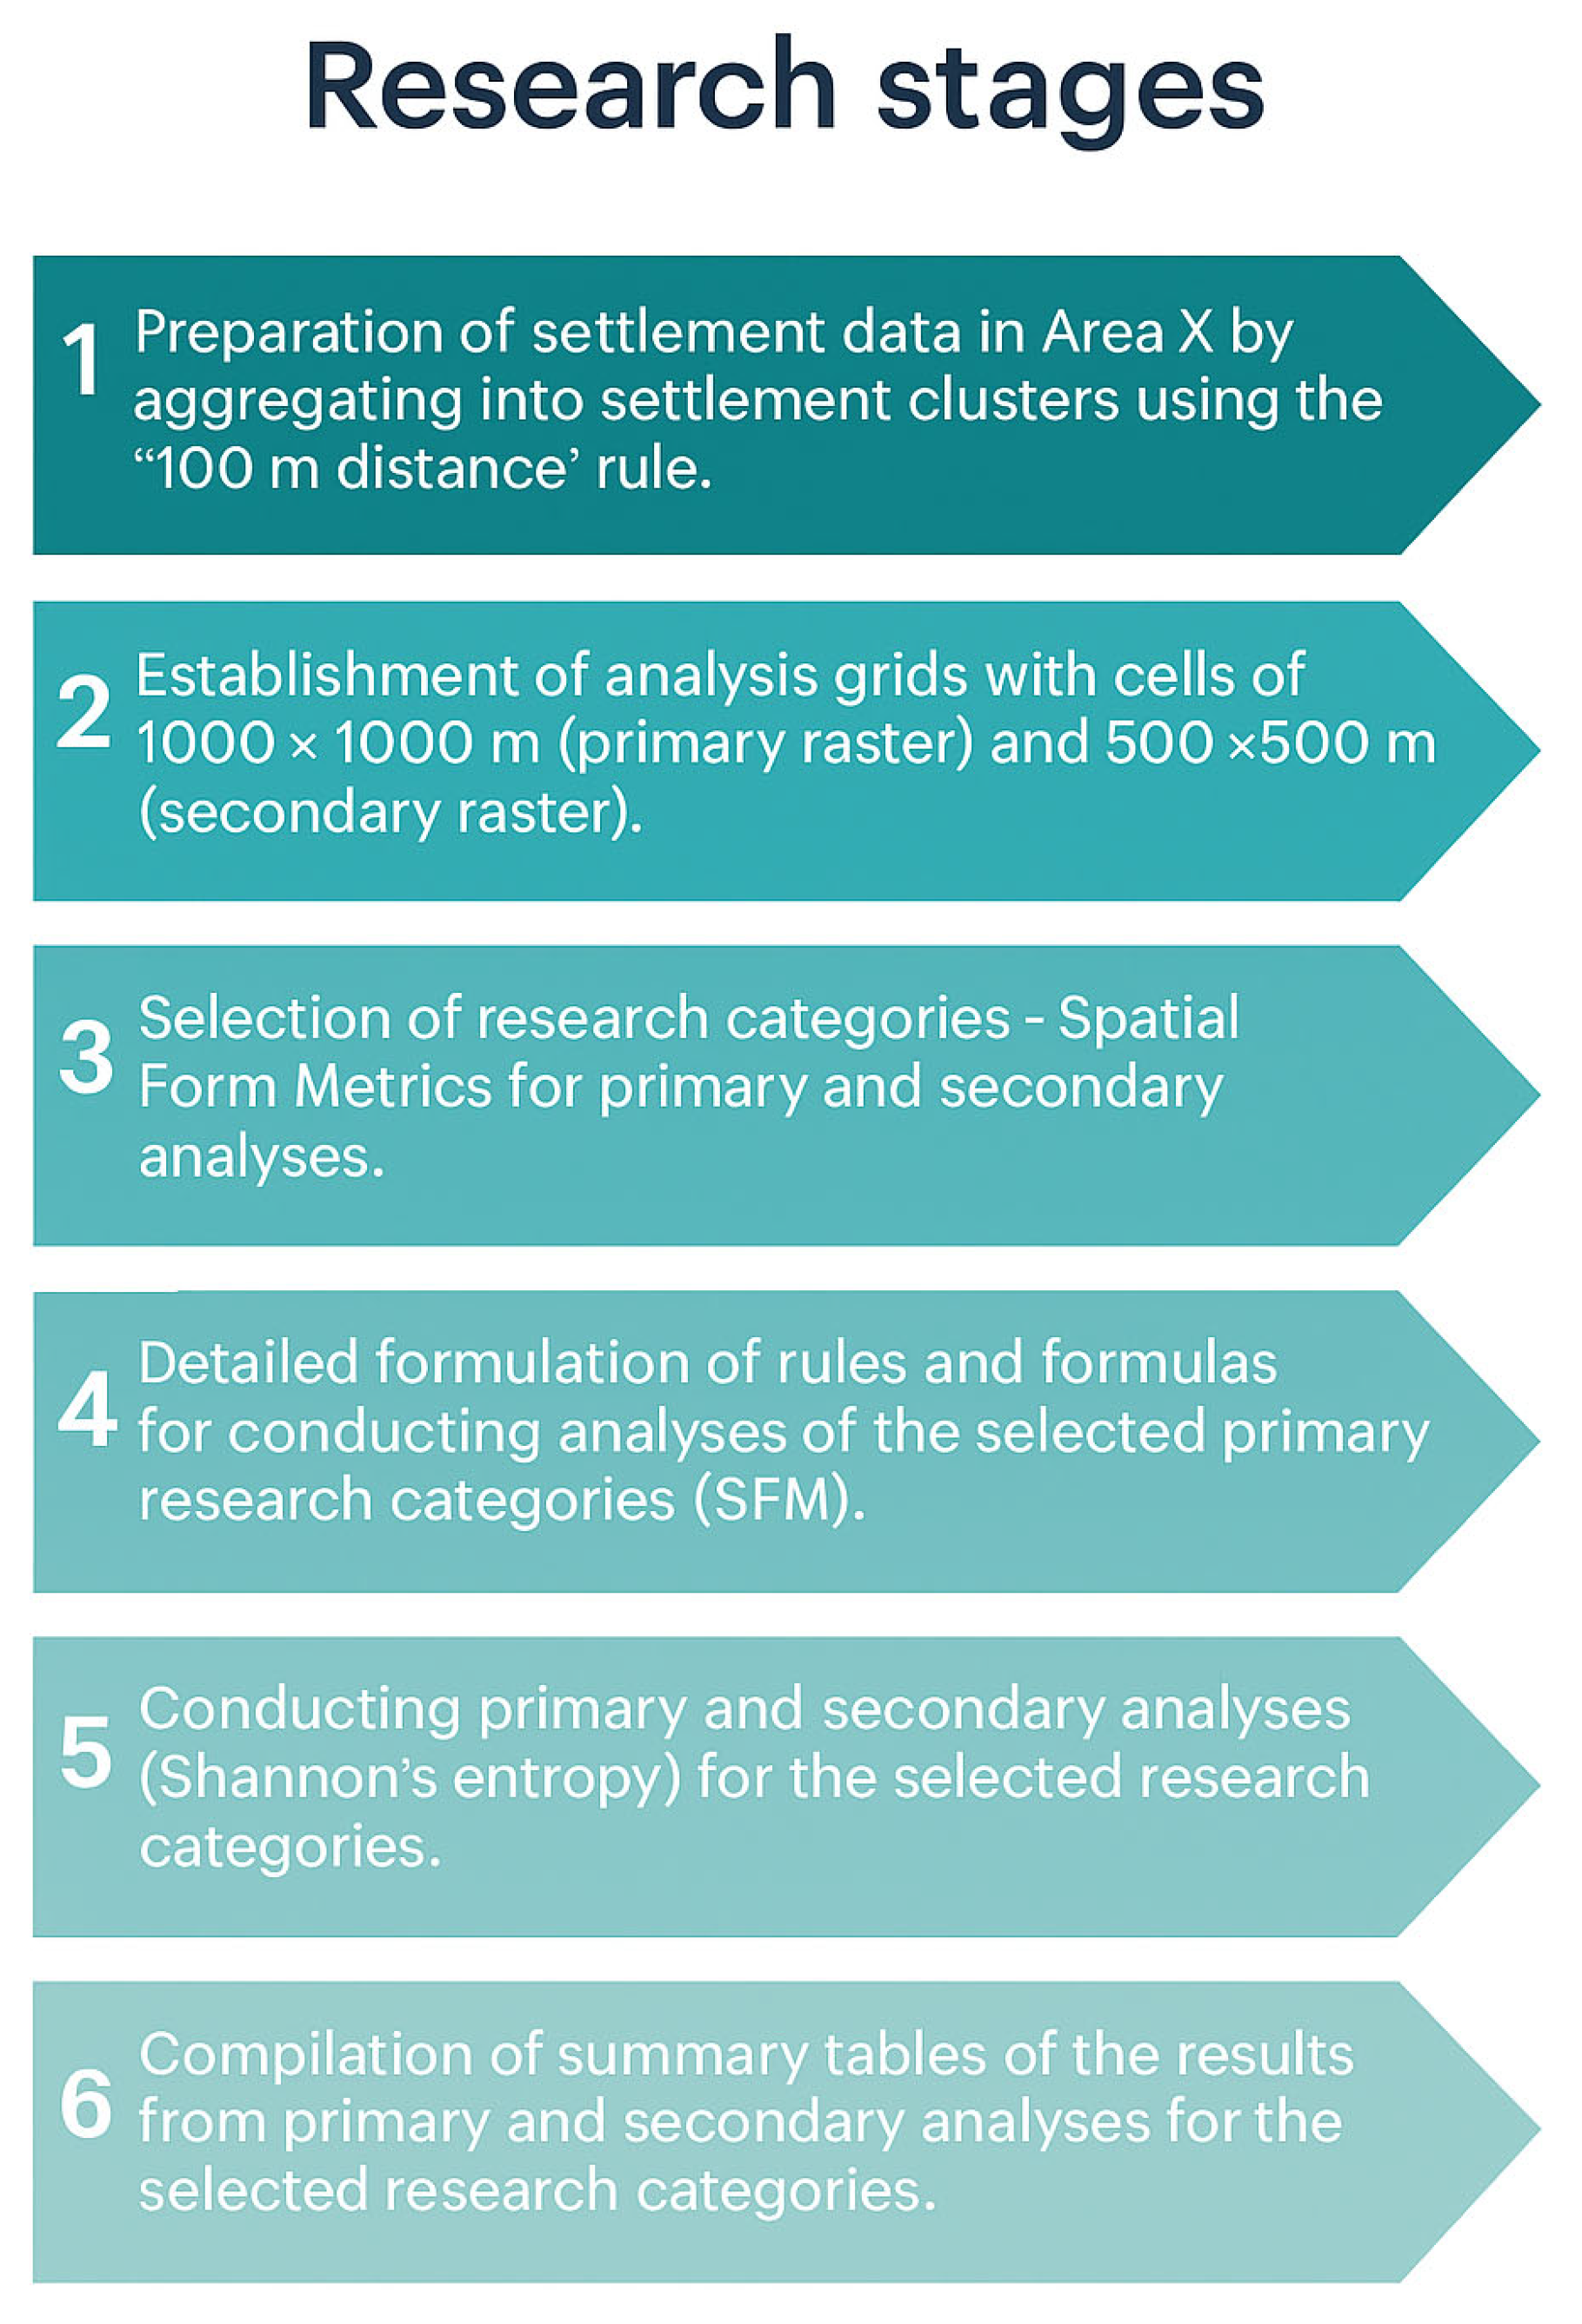
The sequence of actions was planned as follows (Figure 7):

4.3. Primary and Secondary Measures

As noted above, the selected research measures were divided into two groups: primary and secondary analyses.

4.3.1. Primary Analyses

Our foundational metrics are built-up densities/intensities, calculated as:
Density/Intensity (DEN/INT)—built-up density/intensity measured as the number of buildings/clusters or the total built-up area per grid cell of Area X (1 km × 1 km square). To complement this measurement, density/intensity was also measured for subunits obtained by subdividing each reference cell into four parts (500 m × 500 m, area = 0.25 km2).
Given the specific settlement pattern in Area X, morphology was examined in two ways:
Primary measures:
Density DEN1 ( U r ) —measured as a number of buildings N b counted in clusters defined by the “100 m rule” per spatial unit of analysis (SUA) U r :
D E N 1 ( U r ) = N b ( U r ) =   b   B U r 1
where
  • DEN1   ( U r ) —the built-up density in raster cell r
  • N b ( U r ) —the number of buildings in cell r.
Density DEN1 was calculated as the number of buildings in clusters per unit area, following the definition by Galster et al. [18].
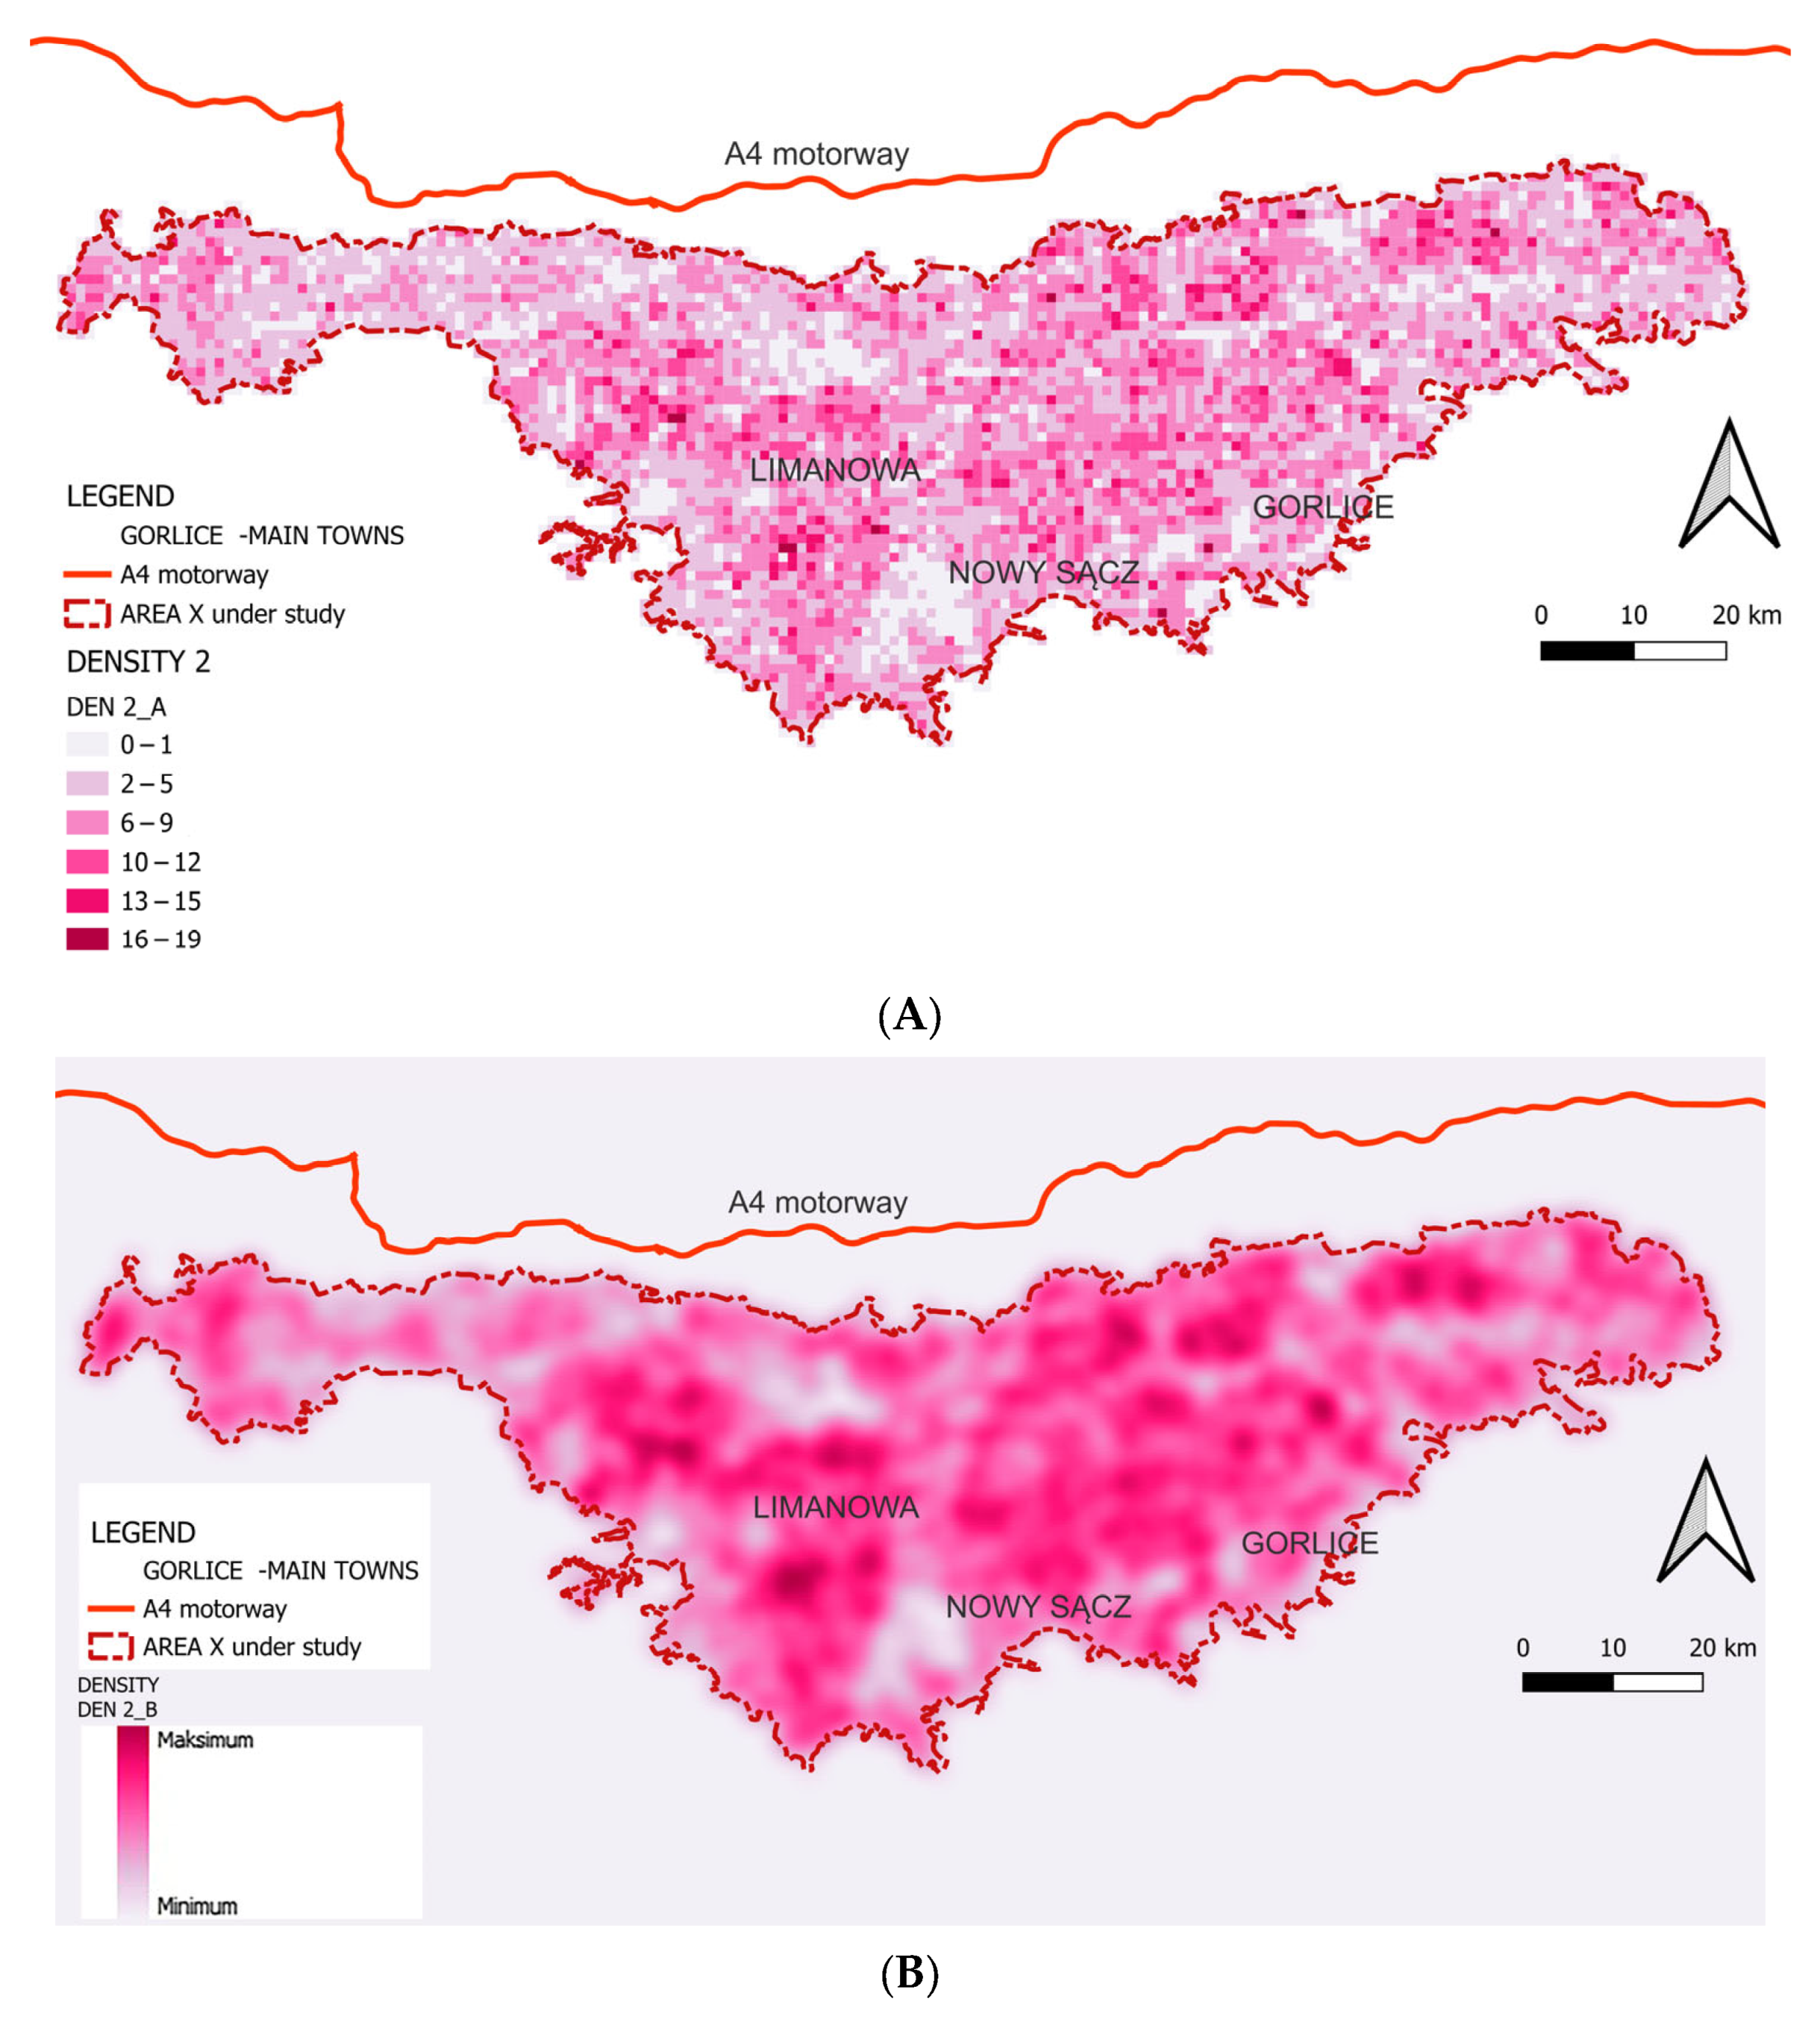
Density DEN2 ( U r ) —measured as a number of building clusters N c defined by the “100 m rule” per SUA U r :
D E N 2 ( U r ) = N c ( U r ) =   c   C U r 1
where
  • DEN2 ( U r ) —the cluster density in raster cell r
  • N c ( U r ) —the number of clusters in cell r.
Density DEN2, expressed as the number of clusters per unit area, was adopted according to Galster et al. [18].
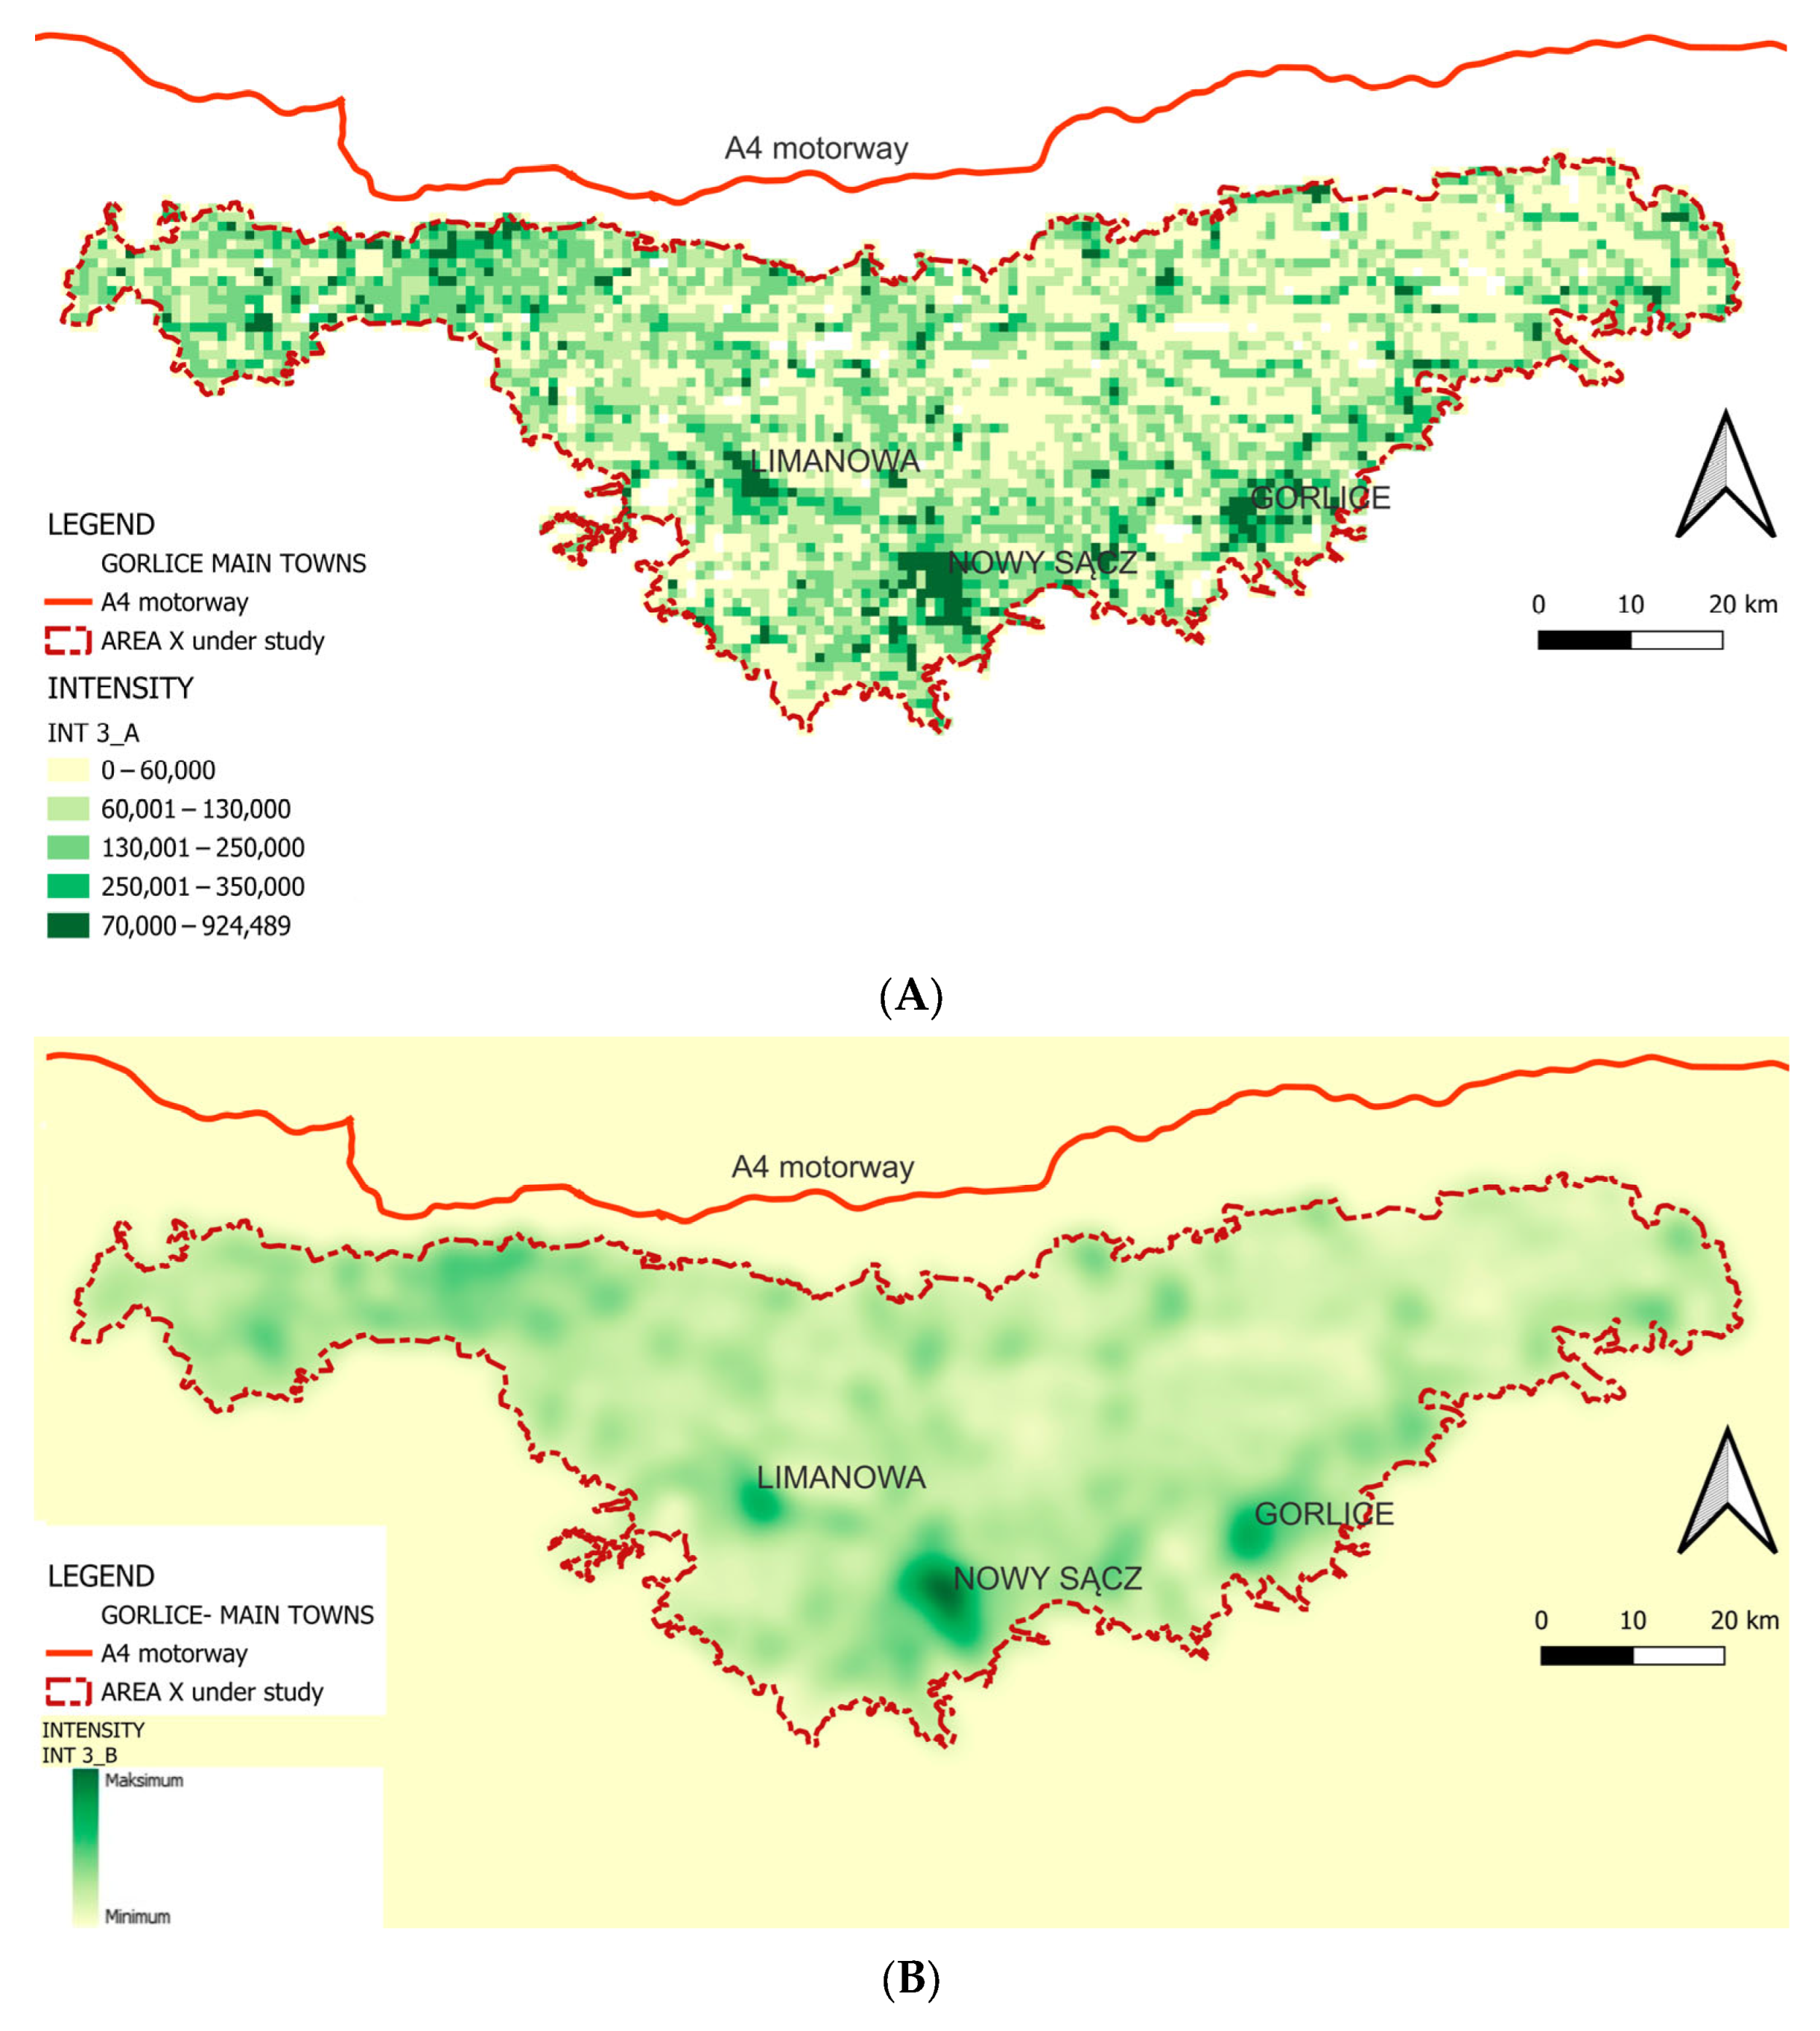
Intensity INT3 ( U r ) —build-up intensity measured as the sum of areas Acr of clusters defined by the “100 m rule” per SUA U r :
I N T 3 ( U r ) = A c ( U r ) =   c   C U r A c  
where
  • INT3   ( U r ) —is the built-up intensity in cell r,
  • A c ( U r ) —is the summed area of clusters in cell r,
  • Ac—is the area of cluster c.
Intensity INT3, measured as the total area of clusters per spatial unit, was calculated based on the approach proposed by Galster et al. [18].
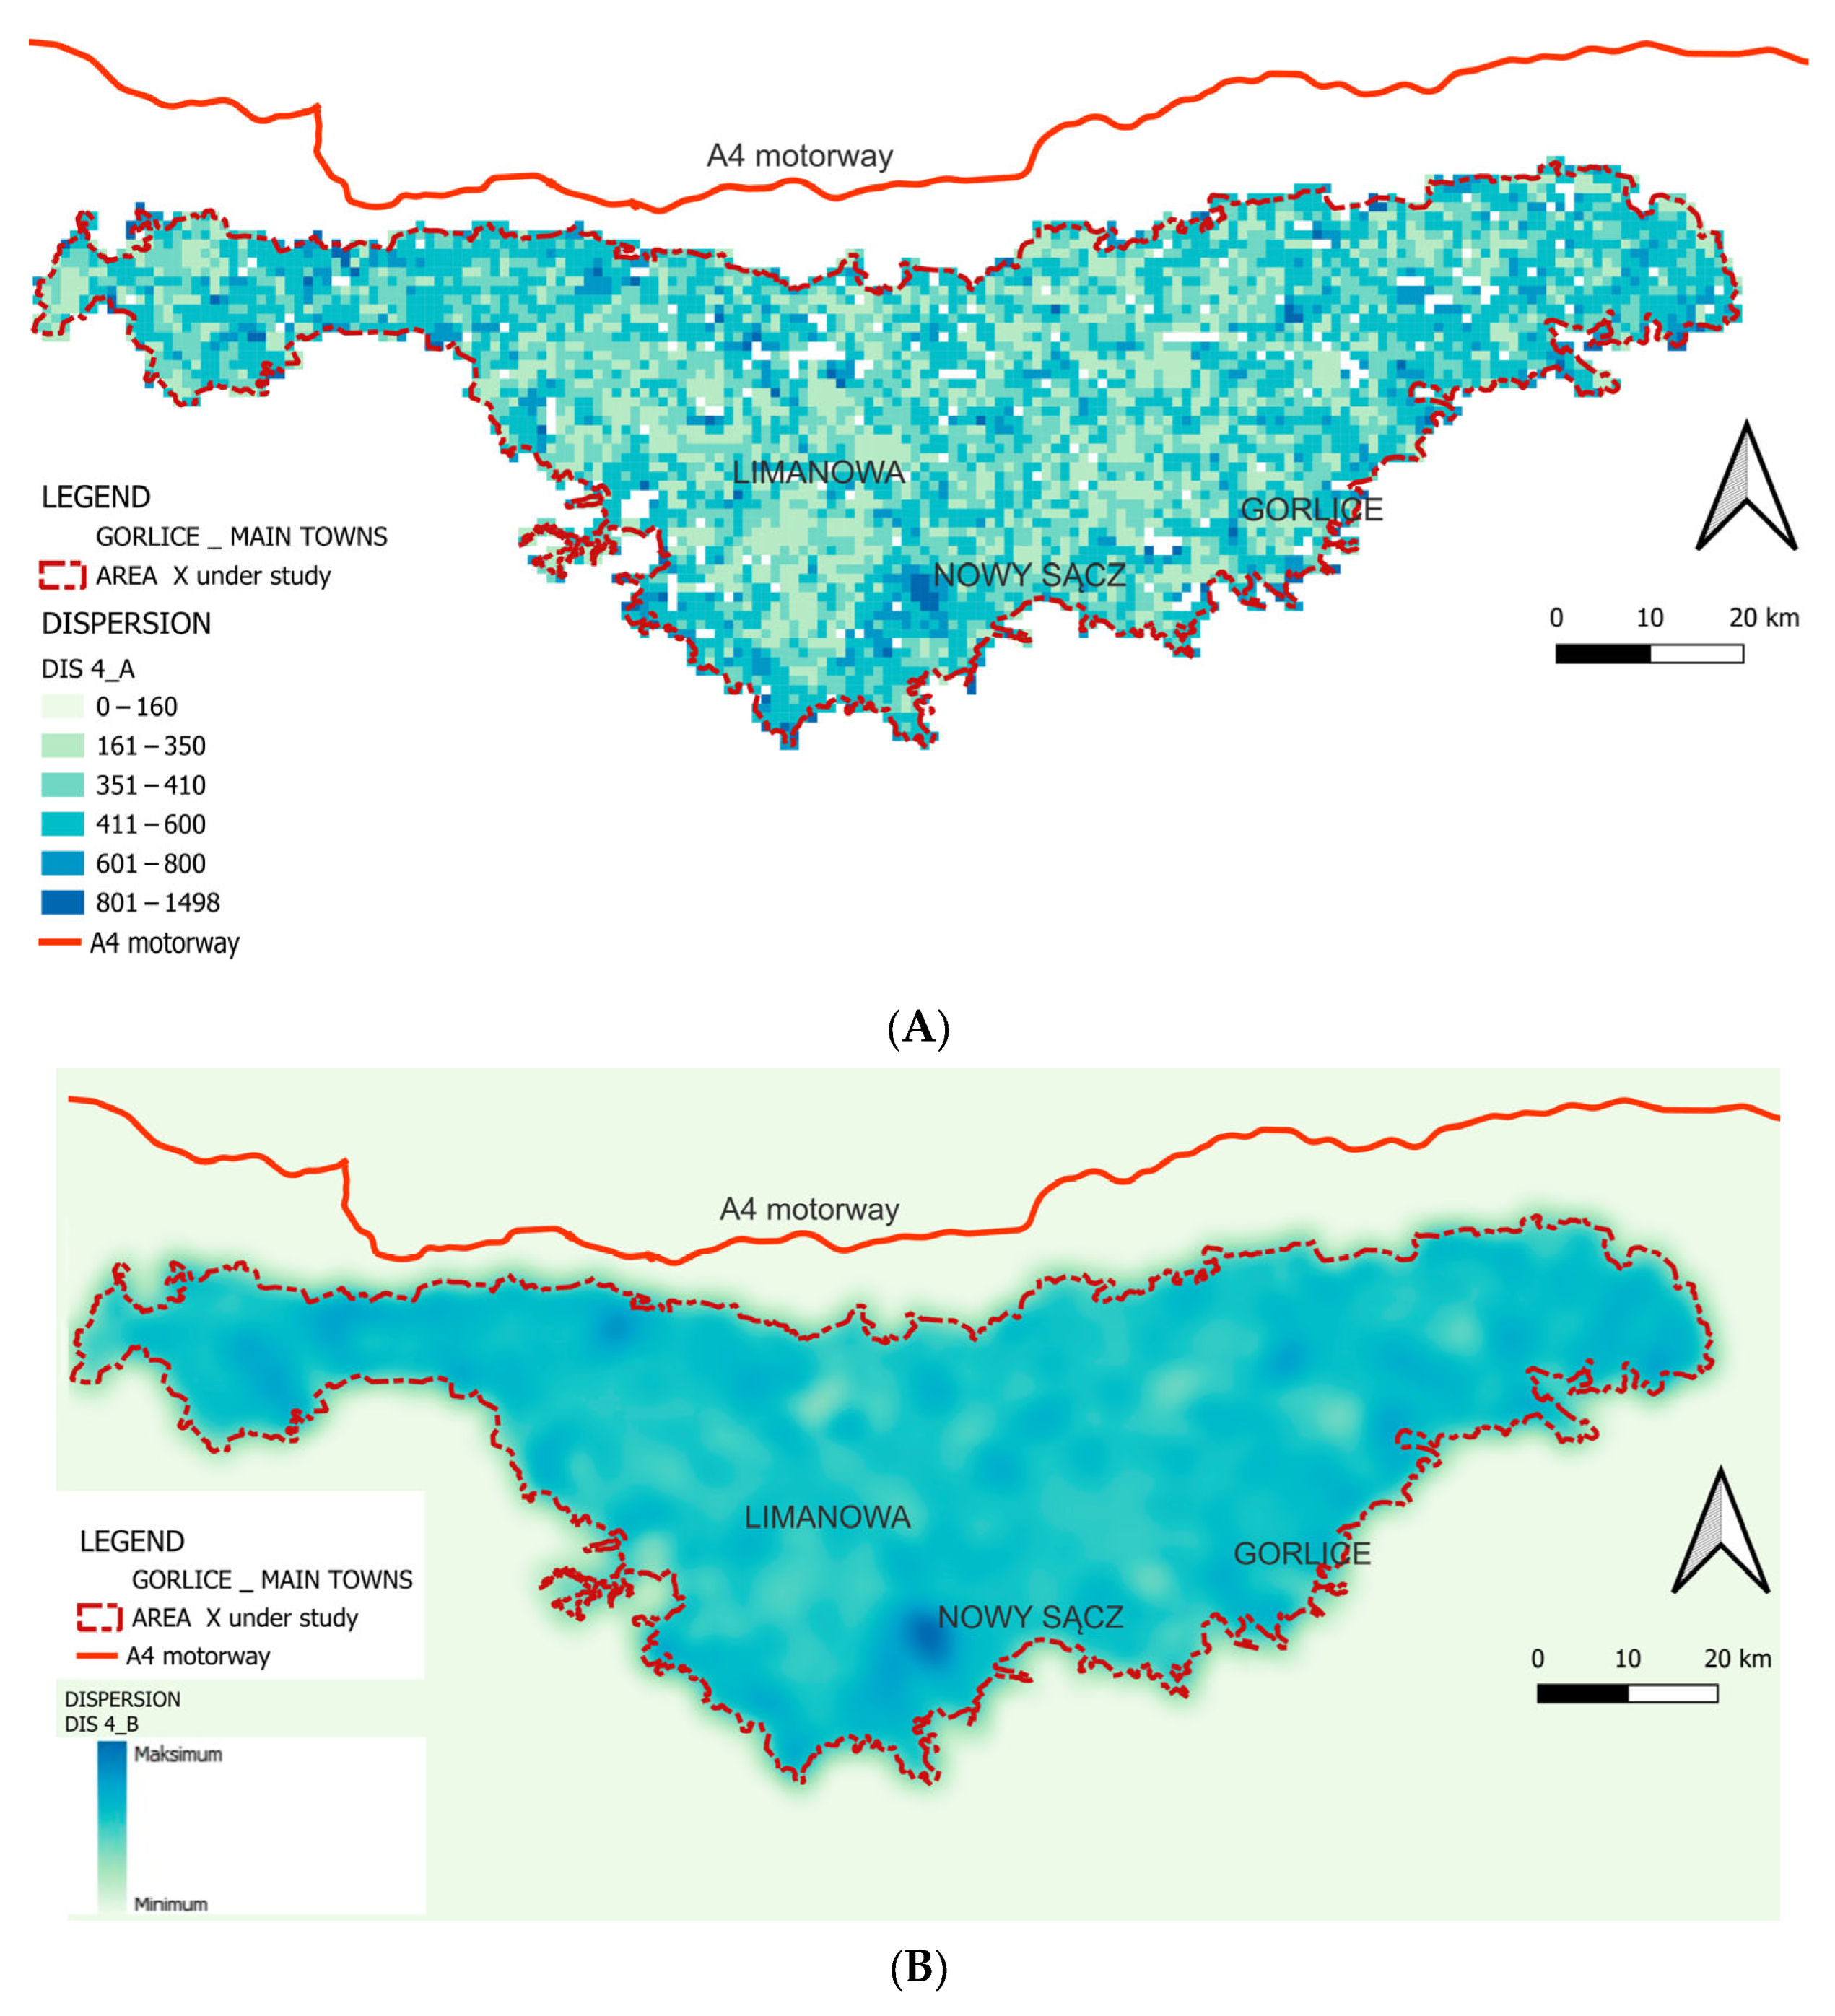
Dispersion DIS4 ( U r ) —settlement dispersion measured as the median of the mean distance Med U r of each centroid of the clusters defined by the “100 m rule” to its six nearest cluster centroids per SUA U r :
D I S 4 ( U r ) =   Med U r D m c = 1 2 D m c n + 1 2 + D m c n + 1 2
where
  • DIS 4 ( U r ) —is the median of average neighbour distances in cell ( U r ) ,
  • D m c —is the mean distance of centroid n to its six nearest centroids.
Measuring dispersion DIS4 ( U r ) enables examination of the variation in continuity CON5 ( U r ) and concentration CEN6 ( U r ) measures within Area X relative to the analysis grid cells. For these measures, a “close neighbour” threshold D c c is introduced, calculated as the mean distance to closest centroids. Dispersion DIS4, defined as the median of mean distances between cluster centroids, was calculated according to Sudra [36].
Continuity CON5 ( U r ) —measured as a ratio of a number of “close neighbourhood” distances Dcc ( U r ) (less than or equal to the mean proximity distance between their centroids in the X region minus the standard deviation) to the total number of neighbourhood distances Dc ( U r ) per SUA U r :
D c   U r = N r N r 1 2
D c c U r = 1 i < j N r 1   d c i , c j d t h r
C O N 5 ( U r ) = D c c   U r D c   U r
where
  • d t h r —mean neighbour distance minus its standard deviation across Area X,
  • D c c U r —number of close neighbourhood distances,
  • D c   U r —number of all neighbourhood distances in the unit Ur.
Continuity CON5 was determined as the ratio of ‘close-neighbour’ distances to total neighbourhood distances, following Galster et al. [18].
Concentration CEN6 U r —measured as the ratio of the number of building complexes (clusters) closely adjacent to each other Ncc in the unit Ur, (located in the vicinity of the distance less than or equal to the average distance between their centroids in area X reduced by the standard deviation) in the relation to the number of all building complexes Nc Ur per SUA Ur:
d t h r =   d X ¯   σ X
N c c   U r = | { c i C U r :   m i n j   i     d c i , c j d t h r } |  
C E N 6 ( U r ) = N c c   U r N c   U r
where
  • C E N ( U r ) t h e   m e a s u r e   o f   c o n c e n t r a t i o n
  • d t h r r—the value of the proximity threshold for the proximity distance,
  • N c c U r —the number of building complexes in close neighbourhood distances,
  • N c U r —the number of complexes in the unit Ur.
Concentration CEN6 was measured as the ratio of neighbouring clusters within the threshold distance, in line with Galster et al. [18].
Clustering CLU7 U r —the aggregation of built-up clusters measured as a standard deviation of the ratios between the intensity of development INT3 in the quarter of the raster cell U r / 4 and the intensity INT3 U r   i n   f u l l   S U A U r in the area X:
R i q = I N T 3 i q I N T 3 i
R i ¯ = 1 n i q R i q
C L U 7 U r = 1 n i q 2   R i q R i ¯
C L U 7 I = 1 N * i   :   S C L U   N U L L S D i C L U   U r
where
  • C L U 7 U r —the clustering level in SUA U r
  • C L U 7 I —the average clustering across Area X
Clustering CLU7, describing the aggregation of built-up clusters, was formulated according to Galster et al. [18].
Other categories from Galster’s list—Centrality (CTR), Nuclearity (NUC), Proximity (PRX), and Mixed Use (MIX)—were not measured due to the predominantly residential nature of Area X and the near absence of urban or service clusters [26].

4.3.2. Secondary Measures—Selection of Shannon’s Entropy

On the basis of preliminary analyses of the nature of area X and on the review of the analytical possibilities of individual categories mentioned in the literature characterizing sprawl areas, the study of Shannon’s entropy was selected as the one which, according to the literature, seems to be the most appropriate for measuring and characterizing area X, due to its development, which in morphological perspective seems to be fundamentally different from the typical area covered by the classic sprawl [36,37].
The classical entropy formulation for spatial analyses was adopted [35,64]:
H s = r n z o n e p r log 1 p r
Shannon entropy (Equation (15)) was calculated according to Shannon [32], following the methodology of Yeh and Li [35] and Nazarnia et al. [38].
And
H s = r n z o n e p r log 1 p r log n
Relative entropy (Equation (16)) followed the formulation by Shannon [32], as applied in urban sprawl research [35,38].
Where
  • H s —Shannon entropy of the feature x for the unit n,
  • H s —Shannon’s relative entropy of the measure of x for the unit n.
  • p r —the proportion of the share of the feature measure x for the raster cell r to the feature measure x for the entire area X
  • n—number of cells SUA of the metering.
Such a choice of method was justified because the division of area X according to the square raster division with a side of 1 km, i.e., cells of equal size and shape (except for the extreme ones through which the area boundary runs), was assumed, so the measurements made will not be distorted by the variability of the surface and shape of the raster cells (SUA) [38,40].
Entropy calculations were applied to the following measures: DEN1, DEN2, INT3, DIS4, CON 5 , CEN6 and CLU7
Equations (8)–(14) represent applications of Shannon entropy [32] to the specific Spatial Form Metrics (DEN1, DEN2, INT3, DIS4, CON5, CEN6, CLU7), following the approach proposed in previous studies [35,38].
Therefore, the entropy distribution for the building density and building intensity will be calculated.
HDEN1—distribution of entropy of building density according to the division raster
H’DEN1—distribution of relative entropy of building density according to the division raster,
HDEN2—distribution of entropy of cluster density according to the division raster,
H’DEN2—distribution of relative entropy of cluster density according to the division raster,
HINT3—distribution of entropy of building intensity according to the division raster,
H’INT3—distribution of relative entropy of the building intensity according to the division raster,
HDIS4—distribution of entropy of the dispersion of buildings according to the division raster,
H’DIS4—distribution of relative entropy of the dispersion of buildings according to the division raster,
HCON5—distribution of entropy of the continuity of building clusters according to the division raster,
H’CON5—distribution of relative entropy of the continuity of building clusters according to the division raster,
HCEN6—distribution of entropy of the concentration of building clusters according to the division raster,
H’CON6—distribution of relative entropy of the concentration of building clusters according to the division raster,
HCLU7—distribution of entropy of the aggregation of build-up clusters according to the division raster,
H’CLU7—distribution of relative entropy of the aggregation of build-up clusters according to the division raster.
For example, the measurement of the entropy of the HDEN1 and H’DEN1 (buildings density) according to the division into cells of your raster will be carried out according to the procedure:
p r   D E N 1 = D E N 1 ( U r ) r n D E N 1 ( U r )
H S D E N 1 = r n z o n e p r D E N 1 log 1 p r D E N 1
H S D E N 1 = r n z o n e p r D E N 1 log 1 p r D E N 1 log n
Results of all analyses are presented below as cell-rasters -diagrams and heatmap diagrams.

5. Results

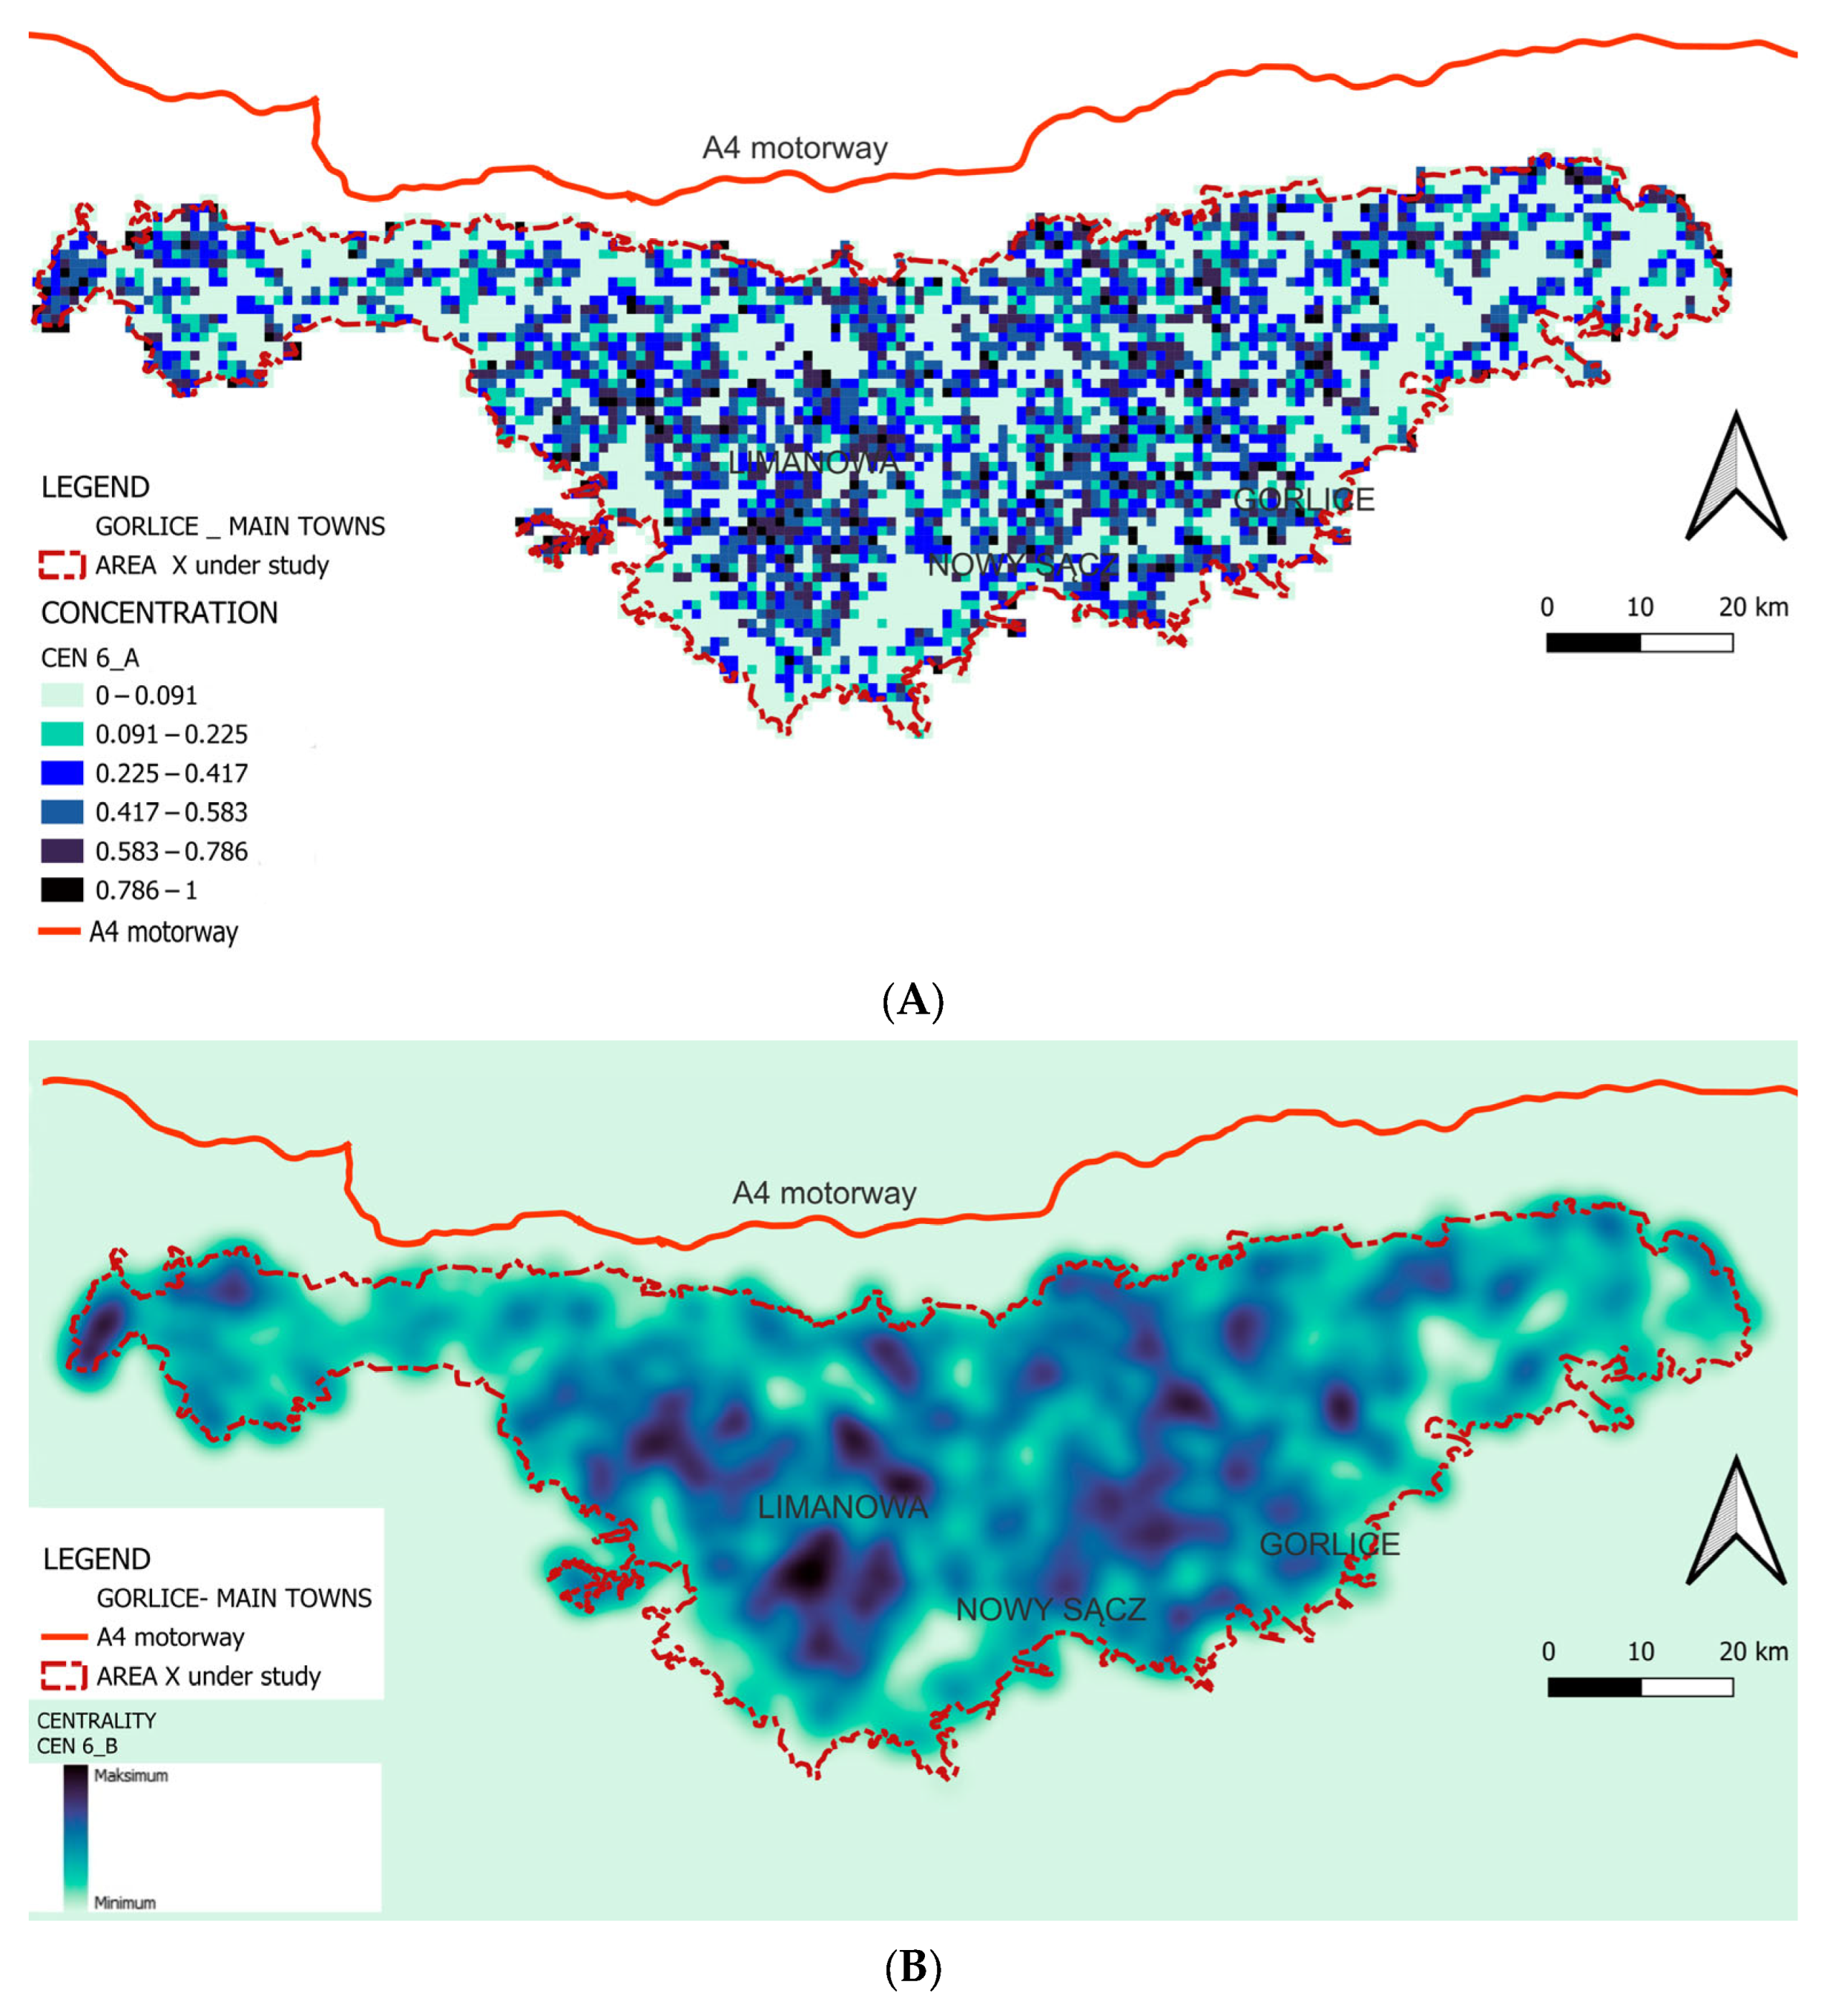
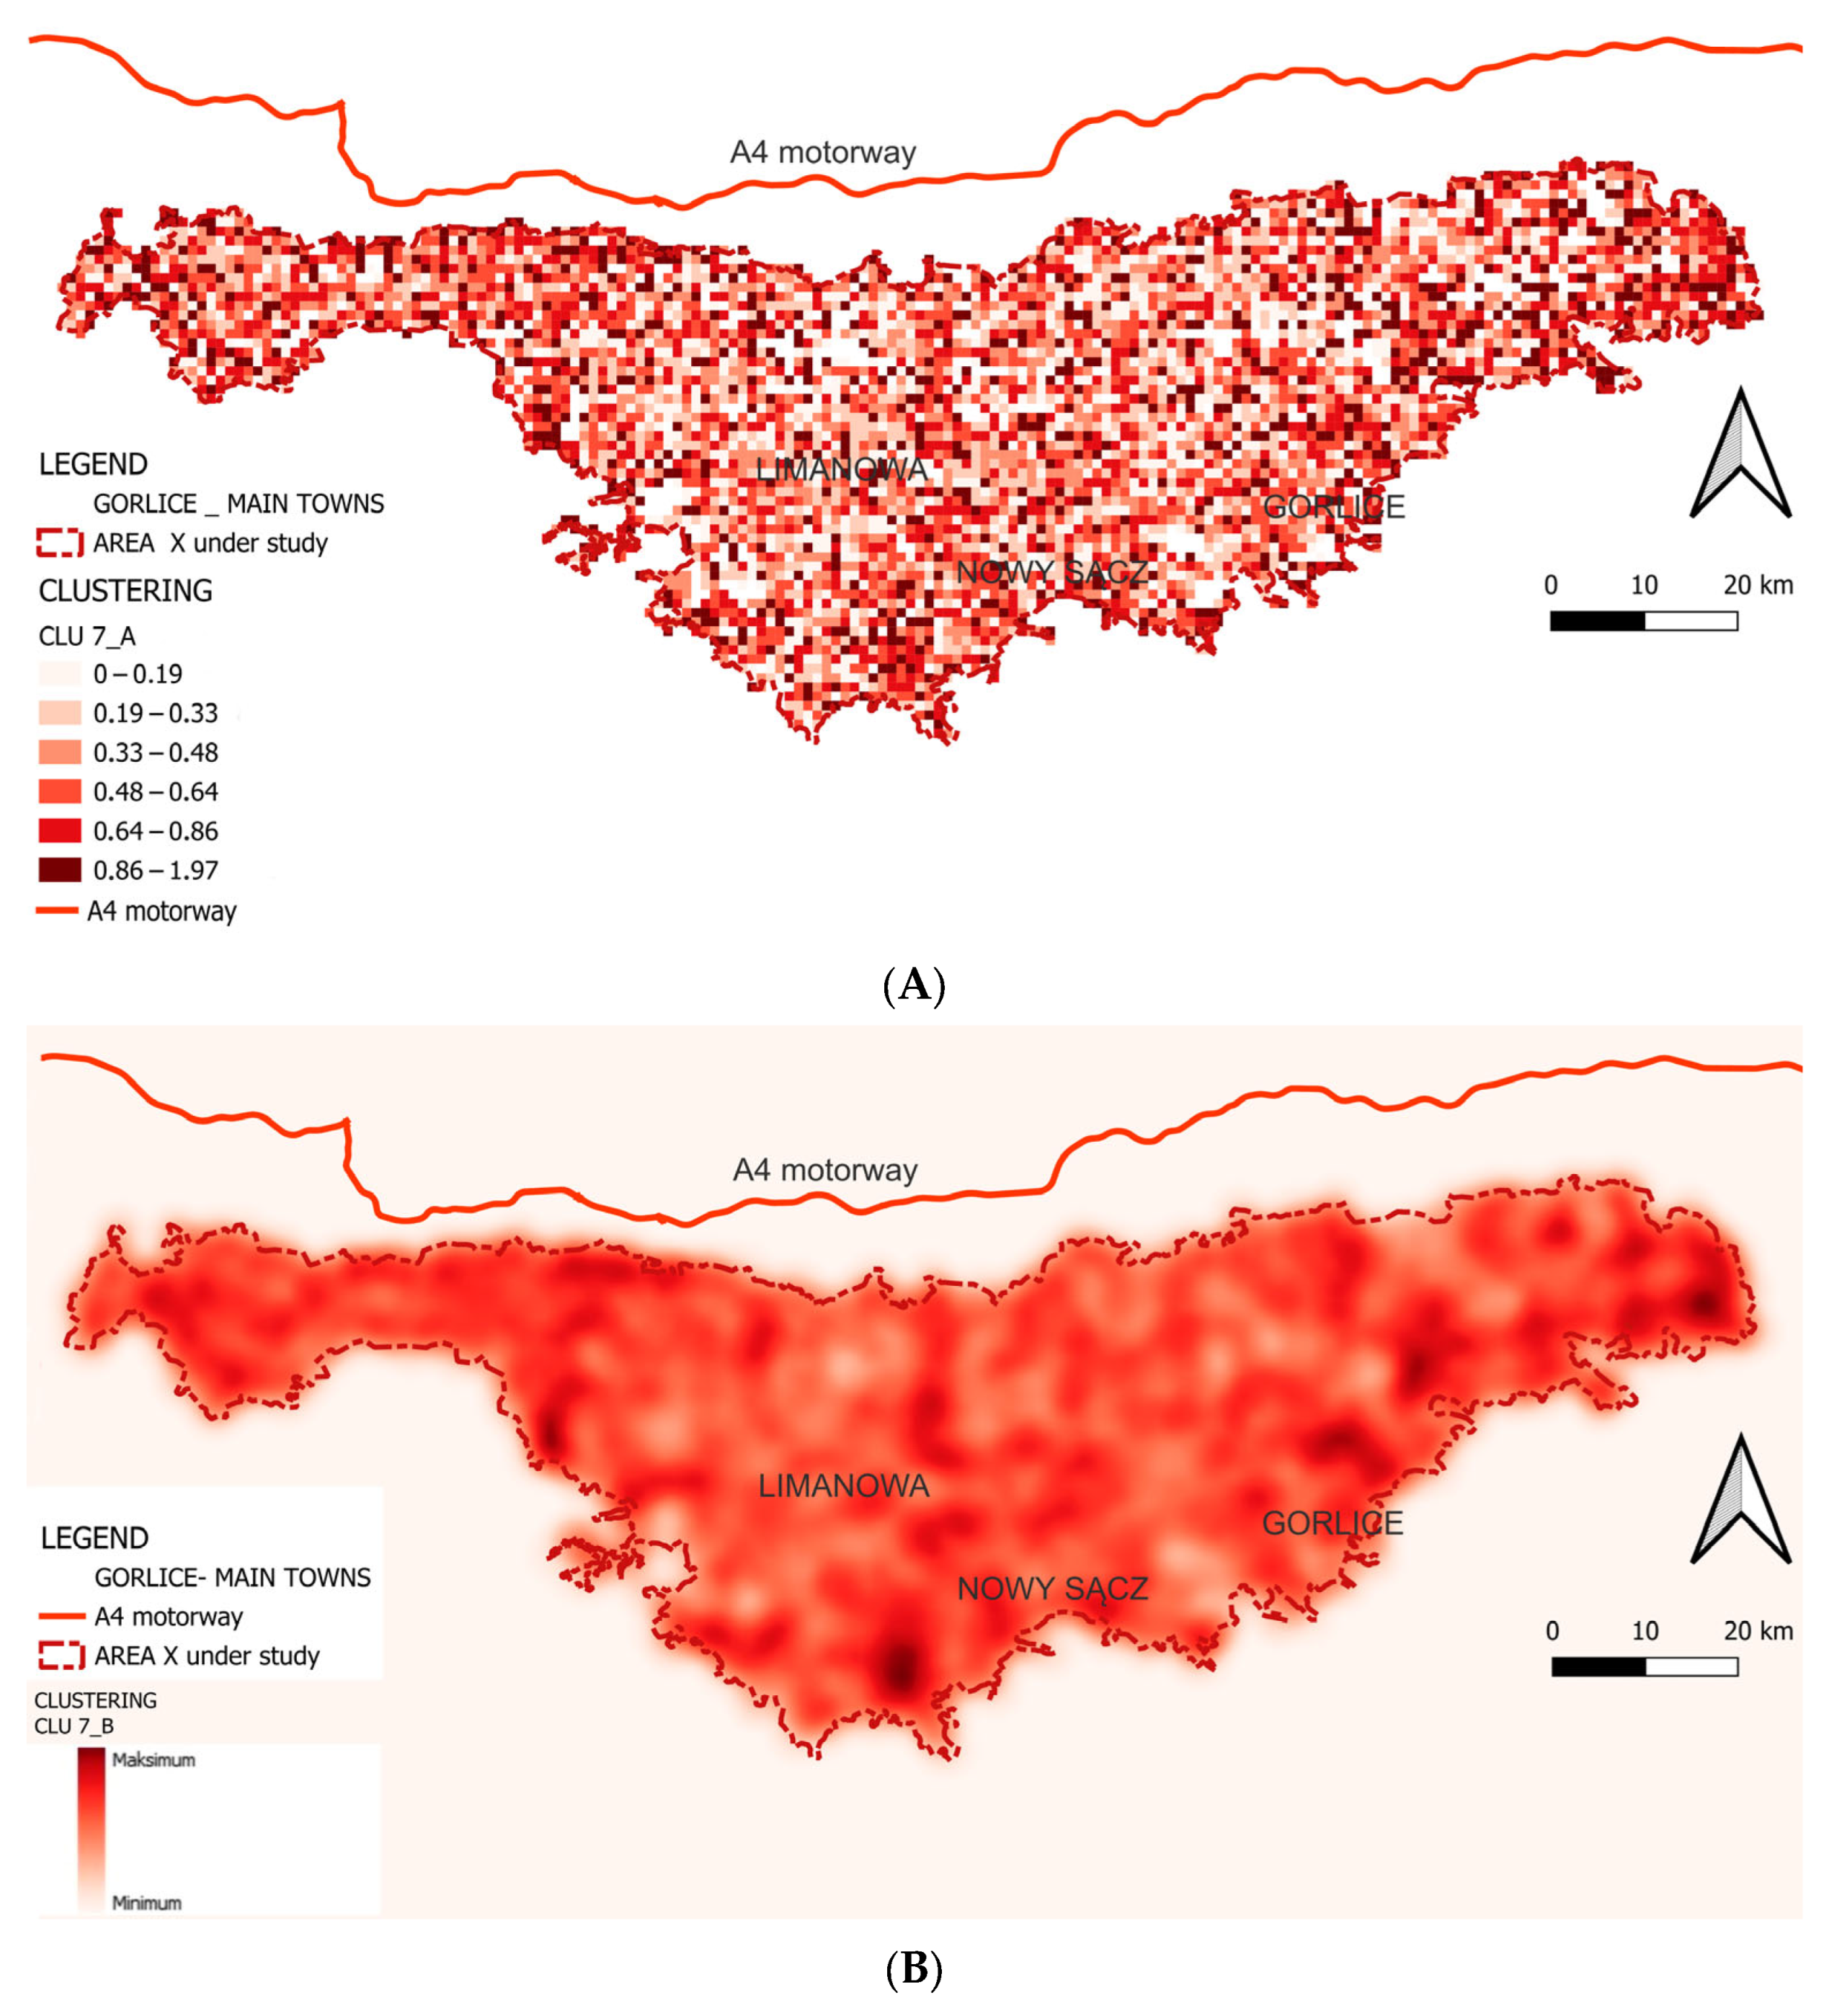
Following the prescribed methodology, analyses were conducted according to the planned sequence. The results are presented below as distribution maps for each examined indicator. For each indicator, both a value distribution diagram relative to the analysis grid cells and a heatmap of the entropy components are provided (Figure 8, Figure 9, Figure 10, Figure 11, Figure 12, Figure 13 and Figure 14).
In Table 1, the basic statistical data for the examined measures and the results of the entropy components are presented.

6. Discussion

The research concerned sprawl as a static state, i.e., treating sprawl as a noun [18]. This approach was dictated by the availability of high-quality contemporary data and the near absence of reliable archival records documenting changes in the area over the past century, roughly since the end of World War I. Actions are planned to obtain data that will enable the scope of research presented here to be framed in terms of historical transformations in-time.

6.1. Built-Up Densities

According to studies in British Columbia (USA), a population density of 0.3–0.5 persons per acre marks a threshold below which efficient service provision becomes impossible and above which agricultural development is hindered. In terms of built-up density, a threshold of 1360 buildings per square mile was adopted [65].
If these threshold values are converted to SI units, they correspond to:
  • Population density: 74–123 persons/km2 (0.7–1.23 persons/ha),
  • Built-up density: 525 buildings/km2 (0.5 buildings/ha).
It is noteworthy that these values are not directly comparable (123 persons/km2 versus 30–35 buildings/km2, i.e., 0.3–0.35 buildings/ha). European research indicates an extreme dispersal threshold at population densities below 25 persons/ha (equivalent to 6–7 residential buildings/ha in predominantly single-family areas) [23]. Given the significant socio-urban differences between Europe and the USA, European thresholds are considered more appropriate.
In Area X, the average built-up density is approximately 5 buildings/ha—well below the European threshold—and thus poses a threat to both the environment and agriculture. Such extremely low-density development over a large area (5567 km2) has multifaceted social and biological impacts, making it difficult to regard the landscape as natural.
Average population density of build-up clusters for Area X is about 14 persons/ha, far below the European threshold—25 persons/ha.
The crucial SFMs for density/intensity are as follows:
DEN1—In more than 67% of the SUA cells, settlement clusters of up to 103 buildings predominate. These clusters are evenly dispersed throughout Area X, and only three concentrations of built-up area (urban centres) occur: Nowy Sącz, Gorlice and Limanowa.
INT3—In over 63% of the SUA cells, the development-intensity ratio does not exceed 0.13, whereas in the urban centres of Area X the index reaches 0.70—0.92.
Elements typical of suburban sprawl are present only around Nowy Sącz, and even there to a limited extent.

6.2. Aggregation and Clustering

The study revealed that Area X exhibits a distinctive form of dispersed development characterised by a large number of small settlement clusters located at relatively short distances from one another. Simultaneously, there are no larger clusters of buildings, the form of which could suggest that they play the role of local service centres.
Area X is situated at a considerable distance from major historical urban centres, which lie on its periphery, virtually defining its boundaries. These centres exist on the peripheries of this area, as if they were setting its boundaries. Building characteristics of area X do not gather around urban centres, but fill an area of 5500 km2, the tops of which are marked by some urban centres. The observed buildings are evenly dispersed in the landscape. Buildings occur both in the area of valleys and slopes, as well as ridges of elevations. The existing development—mainly single-family houses and small residential buildings—is evenly dispersed across the 5500 km2 area, largely independent of topographic relief.
Standard distance-to-centre gradient methods were not applicable due to the lack of clear urban centres around which development could cluster. Consequently, this study focused on analysing the area’s internal spatial variation in density, intensity and concentration using entropy and dispersion measures. Characteristic and specific for the studied area X is that the system of dispersed building clusters, quite typical for relatively small areas, occurs on a large area of over 5000 km2 with relatively little diversity and internal differentiating organization.
The crucial SFMs for aggregation/clustering are as follows:
DIS4—In almost 50% of the SUA cells, settlement clusters have a mean distance of <410 m to their six nearest neighbours, while in 85% of the cells that mean distance is <600 m. The Shannon entropy score for DIS4 (H′ = 0.99) points to a distinctly uniform spatial dispersion of the built-up areas.
CON5—In more than 67% of the SUA cells, over half of all settlement clusters lie within the designated “close-neighbour” distance of 340 m (mean distance to the six nearest clusters).
CLU7—The clustering metric reveals variation in the degree of aggregation of settlement clusters within individual study units (examined with the DEN2 parameter across unit quartiles), yet this variation is evenly distributed throughout Area X, as evidenced by a Shannon entropy value of H′ = 0.96.

6.3. Significance of Entropy Analyses

The results of the analyses of the Shannon entropy level for the main analytical categories studied are particularly significant. They showed that in each of these research SFMs its level is very high, close to the maximum (see Table 1). This proves a very low level of organization of building structures, lack of their differentiation and hierarchy. At the same time, this is related to the high dispersion of buildings and, consequently, the disintegration of biologically active areas: both those related to agricultural activity and those left undeveloped (green areas).
For all of the analysed parameters, the Shannon entropy values are very high, indicating only minimal variation in built form across SUA—in other words, a widespread pattern of small settlement clusters located close to one another throughout the study area.
Heat-maps showing the component values of Shannon entropy for all seven metrics confirm this low spatial variability in Area X.
Apart from the three clear concentration centres—Nowy Sącz, Gorlice, and Limanowa—the 5567 km2 area contains no other built-up concentrations that reach the size or intensity needed to develop service centres with well-established public space. Consequently, there is little basis for the population to coalesce into cohesive, urban- or small-town-style communities that rely on an extensive range of everyday public services.
As mentioned, this phenomenon of Area X is described in the literature as the “leopard skin” effect [52]. Little more can be said about this form of settlement, owing to its amorphous nature, which is fragmented, discontinuous, and dispersed, with its parts being neither identical nor equivalent [52]. What is exceptional Area X is that the “leopard-skin” structure (see Figure 6) spans an area of more than 5500 km2. The absence of concentration, diversity and hierarchy in the built-up system results in an extensive network of low-class roads (primarily local access roads) and a lack of higher-order road networks. It should be noted that the observed forms of buildings are fundamentally different from the forms of rural buildings found in southern Poland, where chain systems dominate [66,67].
The settlement cluster pattern in Area X does not conform to classic suburban sprawl nor to rural development. This form has objectively negative environmental impacts on both exploited agricultural land and remaining natural areas, impeding sustainable agriculture and horticulture, and precluding the development of renewable wind energy installations.
Residents of Area X undoubtedly face limited or challenging access to typical urban services. Investigating the social drivers of such settlement choices, however, lies beyond the scope of this work.
The analysis of the obtained results allows us to conclude that, quantitatively, the most important SFMs are: DENS1, INT3, DIS4 and CON5, CLU7, whereas, qualitatively, they are—DENS1_ENT, INT3_ENT, DIS4_ENT, CEN6_ENT and CLU7_ENT.
The use of quantified and widely adopted metrics of built-up parameters in urban studies aims to enhance the objectivity of both the research process and its outcomes.
Summarising the findings, Area X is dominated by a built pattern of small settlement clusters situated in close proximity to one another. Because of their limited size, these clusters have neither developed more advanced service centres nor provided organised public space. This configuration has a strong—indeed, negative—impact on the open landscape: both the agricultural landscape and the small remnants that still approximate natural conditions (green areas). As a result, open areas are highly fragmented by dispersed, unstructured clusters of buildings.
The built-up characteristics of Area X described above have been objectified and documented on the basis of the research presented and its results.

7. Conclusions

The findings of the study corroborate the thesis that Area X exhibits a distinctive land use and settlement pattern, markedly divergent from the features of classic suburban sprawl. The settlement clusters within Area X are highly dispersed, as reflected in the elevated Shannon entropy values obtained for the principal urban metrics. Their spatial distribution further underscores the absence of a hierarchical network of major urban centres across the 5500 km2 study area. The only sizeable town within its periphery is Nowy Sącz, while other significant centres are situated outside Area X, predominantly along the A4 motorway. These centres function primarily as occasional destinations, accessed mainly by private transport owing to the substantial travel distances involved. Private car use thus constitutes the dominant mode of mobility within Area X. The pronounced dispersion of relatively small settlement clusters necessitates reliance on individual transport, which in turn results in higher average and long-distance travel intensities compared with areas structured according to classic spatial models, such as those articulated in Christaller’s central place theory.
Undoubtedly, this remoteness from major urban centres also affects the intensity of use and engagement with social services. Justified to forecast on studies from other regions, it might predict specific forms of social integration—closer to those observed in rural areas—and corresponding levels of social capital for this area; however, this requires empirical confirmation through interdisciplinary research. It is conceivable that residents of Area X consciously forgo the benefits of urban living. Of particular interest would be studies on residents’ satisfaction with living in Area X—which is at present virtually devoid of service centres or significant urban nuclei—as well as on the underlying reasons for this situation.
It is clear, however, that the observed ‘leopard-skin’ development pattern [52] negatively impacts agriculture and contributes to environmental burdens, due to the impossibility of establishing large natural or agricultural complexes. Consequently, such development does not create structures that reduce environmental impact and burden; indeed, it likely contributes to climate change. The built-up structure of Area X is particularly detrimental in the context of the climate crisis. The land use pattern in Area X is therefore contrary to the essence of sustainability in human settlements, across social, economic, and environmental dimensions. This phenomenon merits detailed socio-economic analysis based on the land use results presented here with the aim of establishing the foundations for principles and methods of transforming Area X towards structures capable of sustainable development and the sustenance of urban life.
Certainly, it is both necessary and important from the cognitive point of view to examine to what extent the style and manner of development observed in area X is unique on a Polish and European scale and whether it is appropriate to call it urban sprawl.
Investigating the social subsystem of the community that inhabits the 5567 km2 area is a separate task, but one that warrants detailed sociological and economic study. The results of the urban-subsystem analysis presented in this paper can serve as one of the foundations for those socio-economic investigations.
It will be particularly interesting to examine the relationship between the level of efficiency and profitability of economic processes carried out by people and organisations living and operating in area X both in the production and service sphere, as well as in the agricultural sphere in the context of a sustainable economy.
The results indicate that the current built-up structure of Area X is incompatible with the principles of sustainable development. It is therefore necessary to redirect both the directions and modes of development in this area so that they comply with the principles of transformation that ensure the durability and sustenance of established urban structures.

Author Contributions

Conceptualization, M.G.; methodology, M.G. and Ł.W.; software, M.G. and Ł.W.; validation, M.G. and Ł.W.; investigation, M.G. and Ł.W.; resources, M.G.; writing—original draft preparation, M.G., Ł.W.; writing—review and editing, M.G., Ł.W., supervision, M.G. All authors have read and agreed to the published version of the manuscript.

Funding

The publication of the results of this research was funded by Academy of Silesia, Katowice, Poland.

Institutional Review Board Statement

Not applicable.

Informed Consent Statement

Not applicable.

Data Availability Statement

Data may be requested from the correspondence author.

Acknowledgments

During the preparation of this manuscript/study, the authors used Quantum GIS 3.44 for the purposes of calculating and present data and results. The authors have reviewed and edited the output and take full responsibility for the content of this publication.

Conflicts of Interest

The authors declare no conflicts of interest.

References

  1. Girardet, H. Creating Regenerative Cities; Routledge: New York, NY, USA, 2015. [Google Scholar]
  2. Schmid, C. Journeys through planetary urbanization: Decentering perspectives on the urban. Environ. Plan. D 2018, 36, 591–610. [Google Scholar] [CrossRef]
  3. Hall, P. Cities of Tomorrow: An Intellectual History of Urban Planning and Design Since 1880; Wiley-Blackwell: Hoboken, NJ, USA, 2014. [Google Scholar]
  4. McHarg, I.L. Design with Nature; Wiley: New York, NY, USA, 1969. [Google Scholar]
  5. Mumford, L. The City in History: Its Origins, Its Transformations, and Its Prospects; Mariner Books: New York, NY, USA, 1968. [Google Scholar]
  6. Mumford, L. Highway and the City; Harcourt, Brace & World, Inc.: New York, NY, USA, 1963. [Google Scholar]
  7. Hall, P. Good Cities, Better Lives; Routledge: New York, NY, USA, 2013. [Google Scholar] [CrossRef]
  8. Putnam, R.D. Bowling Alone: The Collapse and Revival of American Community; Simon & Schuster: New York, NY, USA, 2000. [Google Scholar]
  9. Sommer, R. Social Design: Creating Buildings with People in Mind; Englewood Cliffs: New York, NY, USA, 1983. [Google Scholar]
  10. Gachowski, M. Measuring Symbiosis and Synergy in the Urban Structure of Main Streets in Central Areas of the City as an Element of the Urban Design Method. Archit. Civ. Eng. Environ. 2025, 18, 117–135. [Google Scholar] [CrossRef]
  11. Hillier, B. Space is the Machine: A Configurational Theory of Architecture; University of Cambridge: Cambridge, UK, 1996. [Google Scholar]
  12. Hillier, B.; Leaman, A.; Stansall, P.; Bedford, M. Space Syntax. Environ. Plan. B Plan. Des. 1976, 3, 147–185. [Google Scholar] [CrossRef]
  13. Hillier, B.; Hanson, J. The Social Logic of Space; Cambridge University Press: Cambridge, UK, 1984. [Google Scholar] [CrossRef]
  14. Yamu, C.A.; van Nes, A.; Garau, C. Bill Hillier’s Legacy: Space Syntax—A Synopsis of Basic Concepts, Measures, and Empirical Application. Sustainability 2021, 13, 3394. [Google Scholar] [CrossRef]
  15. Batty, M. The New Science of Cities; MIT Press: Cambridge, UK, 2013. [Google Scholar]
  16. Batty, M. Space, scale, and scaling in entropy maximizing. Geogr. Anal. 2010, 42, 395–421. [Google Scholar] [CrossRef]
  17. Batty, M.R.; Morphet, R.; Masucci, P.; Stanilov, K. Entropy, complexity, and spatial information. J. Geogr. Syst. 2014, 16, 363–385. [Google Scholar] [CrossRef]
  18. Galster, G.; Hanson, R.; Ratcliffe, M.R.; Wolman, H.; Coleman, S.; Freihage, J. Wrestling Sprawl to the Ground: Defining and measuring an elusive concept. Hous. Policy Debate 2001, 12, 681–717. [Google Scholar] [CrossRef]
  19. Wallis, A. Miasto i Przestrzeń; PWN: Warszawa, Poland, 1977. [Google Scholar]
  20. Wheeler, S. Planning for Sustainability; Routledge: New York, NY, USA, 2013. [Google Scholar] [CrossRef]
  21. Skolimowski, H. Eco-Philosophy: Designing New Tactics for Living; Boyars: Boston, MA, USA, 1981. [Google Scholar]
  22. Habsburg_Monarchy, Wikipedia. Available online: https://en.wikipedia.org/wiki/Habsburg_monarchy (accessed on 3 August 2025).
  23. European Environment Agency. Urban Sprawl in Europe the Ignored Challenge, European Enviroment Agency Report no 10. 2006. Available online: www.europeansources.info/record/urban-sprawl-in-europe-the-ignored-challenge (accessed on 24 May 2025).
  24. Hennig, E.I.; Schwick, C.; Soukup, T.; Orlitová, E.; Kienast, F.; Jaeger, J.A. Multi-scale analysis of urban sprawl in Europe: Towards a European de-sprawling strategy. Land Use Policy 2015, 49, 483–498. [Google Scholar] [CrossRef]
  25. ESPON Project 1.1.2. Team. Urban-Rural Relations in Europe ESPON. 2005. Available online: https://archive.espon.eu/programme/projects/espon-2006/thematic-projects/urban-rural-relations-europe (accessed on 25 May 2025).
  26. Wolman, H.; Galster, G.; Hanson, R.; Ratcliffe, M.; Furdell, K.; Sarzynski, A. The Fundamental Challenge in Measuring Sprawl: Which Land Should Be Considered? Prof. Geogr. 2005, 57, 94–105. [Google Scholar] [CrossRef]
  27. Gielen, E.; Riutort-Mayol, G.; Palencia-Jiménez, J.S.; Cantarino, I. An urban sprawl index based on multivariate and Bayesian factor analysis with application at the municipality level in Valencia. Environ. Plan B Urban Anal. City Sci. 2018, 45, 888–914. [Google Scholar] [CrossRef]
  28. Jaeger, J.A.G.; Schwick, C. Improving the measurement of urban sprawl: Weighted Urban Proliferation (WUP) and its application to Switzerland. Ecol. Indic. 2014, 38, 294–308. [Google Scholar] [CrossRef]
  29. Frenkel, A.; Ashkenazi, M. The integrated sprawl index: Measuring the urban landscape in Israel. Ann. Reg. Sci. 2008, 42, 99–121. [Google Scholar] [CrossRef]
  30. Czyż, T.; Hauke, J. Entropy in Regional Analysis. Quaest. Geogr. 2015, 34, 69–78. [Google Scholar] [CrossRef]
  31. Oueslati, W.; Alvanides, S.; Garrod, G. Determinants of urban sprawl in European cities. Urban Stud. 2015, 52, 1594–1614. [Google Scholar] [CrossRef] [PubMed]
  32. Shannon, C.E. A mathematical theory of communication. Bell Syst. Tech. J. 1948, 27, 379–423. [Google Scholar] [CrossRef]
  33. Gachowski, M. Synergia jako wytyczna do budowania struktury centrum miasta. (Synergy as a Principle for Shaping Urban Core Structure). Builder 2021, 291, 34–39. [Google Scholar] [CrossRef]
  34. Christaller, W. Central Places in Southern Germany; Prentice Hall, Inc.: Englewood Cliffs, NJ, USA, 1933. [Google Scholar]
  35. Gar_On Yeh, A.; Li, X. Measurement and Monitoring of Urban Sprawl in a Rapidly Growing Region Using Entropy. Photogramm. Eng. Remote Sens. 2001, 67, 83–90. [Google Scholar]
  36. Sudra, P. Zastosowanie wskaźników koncentracji przestrzennej w badaniu procesów urban sprawl. (Application of spatial concentration indicators in the study of urban sprawl processes). Prz. Geogr. 2016, 88, 247–272. [Google Scholar] [CrossRef]
  37. Rosati, R.M. Urban Sprawl and Routing: A Comparative Study on 156 European Cities. Landsc. Urban Plan 2025, 253, 105–205. [Google Scholar] [CrossRef]
  38. Nazarnia, N.; Harding, C.; Jaeger, J.A.G. How suitable is entropy as a measure of urban sprawl? Landsc. Urban Plan 2019, 184, 32–43. [Google Scholar] [CrossRef]
  39. Deka, J.; Tripathi, O.P.; Khan, M.L. Urban growth trend analysis using Shannon Entropy approach—A case study in North-East India. Int. J. Geomat. Geosci. 2012, 2, 1072–1078. [Google Scholar]
  40. Cho, K.H.; Lee, D.H.; Kim, T.S.; Jang, G.S. Measurement of 30-Year Urban Expansion Using Spatial Entropy in Changwon and Gimhae, Korea. Sustainability 2021, 13, 632. [Google Scholar] [CrossRef]
  41. Dewa, D.D.; Buchori, I.; Sejati, A.W.; Liu, Y. Shannon Entropy-based urban spatial fragmentation to ensure sustainable development of the urban coastal city: A case study of Semarang, Indonesia. Remote Sens. Appl. 2022, 28, 100839. [Google Scholar] [CrossRef]
  42. Barman, S.; Roy, D.; Chandra Sarkar, B.; Almohamad, H.; Abdo, H.G. Assessment of urban growth in relation to urban sprawl using landscape metrics and Shannon’s entropy model in Jalpaiguri urban agglomeration, West Bengal, India. Geocarto Int. 2024, 39. [Google Scholar] [CrossRef]
  43. Bhatta, B. Analysis of urban growth pattern using remote sensing and GIS: A case study of Kolkata, India. Int. J. Remote Sens. 2009, 30, 4733–4746. [Google Scholar] [CrossRef]
  44. Brueckner, J.K.; Largey, A.G. Social interaction and urban sprawl. J. Urban Econ. 2008, 64, 18–34. [Google Scholar] [CrossRef]
  45. Civelli, A.; Gaduh, A.; Rothenberg, A.D.; Wang, Y. Urban Sprawl and Social Capital: Evidence from Indonesian Cities. Econ. J. 2023, 133, 2110–2146. [Google Scholar] [CrossRef]
  46. Nguyen, D. Evidence of the Impacts of Urban Sprawl on Social Capital. Environ. Plan. B Plan. Des. 2010, 37, 610–627. [Google Scholar] [CrossRef]
  47. Dekker, K. Social Capital, Neighbourhood Attachment and Participation in Distressed Urban Areas. A Case Study in The Hague and Utrecht, The Netherlands. Hous. Stud. 2007, 22, 355–379. [Google Scholar] [CrossRef]
  48. Neutens, T.; Vyncke, V.; De Winter, D.; Willems, S. Neighborhood differences in social capital in Ghent (Belgium): A multilevel approach. Int. J. Health Geogr. 2013, 12, 52. [Google Scholar] [CrossRef]
  49. Działek, J.; Listwan-Franczak, K.; Górny, J. Social Capital in Suburban Zones of Krakow and Poznań. SSRN Electron. J. 2017. [Google Scholar] [CrossRef]
  50. Bauer, G.; Roux, J.M. La Rurbanisation ou la Ville Eparpillee; Editions du Seuil: Paris, France, 1976. [Google Scholar]
  51. Indovina, F. La Città Diffusa (The Diffuse City) (1990). In The Horizontal Metropolis; Springer International Publishing: Cham, Switzerland, 2022; pp. 347–367. [Google Scholar] [CrossRef]
  52. Secchi, B. The emergence of the diffuse city. Diagonal 2002, 156, 10–12. [Google Scholar]
  53. Sieverts, T. Zwischenstadt; Vieweg + Teubner Verlag: Wiesbaden, Germany, 1998. [Google Scholar] [CrossRef]
  54. Vigano, P.; Secchi, B.; Fabian, L. Water and Asphalt the Project of Isotropy; Park Books: Zurich, Switzerland, 2016. [Google Scholar]
  55. Urban Sprawl in Europe. Joint EEA_FOEN Report. Copenhagen, November 2016. Available online: www.bafu.admin.ch/bafu/en/home/topics/landscape/publications-studies/publications/urban-sprawl-in-europe.html (accessed on 24 May 2025).
  56. Bart, I.L. Urban sprawl and climate change: A statistical exploration of cause and effect, with policy options for the EU. Land Use Policy 2010, 27, 283–292. [Google Scholar] [CrossRef]
  57. Baur, A.H.; Förster, M.; Kleinschmit, B. The spatial dimension of urban greenhouse gas emissions: Analyzing the influence of spatial structures and LULC patterns in European cities. Landsc. Ecol. 2015, 30, 1195–1205. [Google Scholar] [CrossRef]
  58. Cappelli, F.; Guastella, G.; Paregilo, S. Urban sprawl and air quality in European Cities: An empirical assessment. Milano. July 2021. Available online: www.econstor.eu/bitstream/10419/233092/1/ndl2021-007.pdf (accessed on 24 May 2025).
  59. Kabisch, N.; Remahne, F.; Ilsemann, C.; Fricke, L. The urban heat island under extreme heat conditions: A case study of Hannover, Germany. Sci. Rep. 2023, 13, 23017. [Google Scholar] [CrossRef]
  60. Bielecka, E.; Jenerowicz, A. Intellectual Structure of CORINE Land Cover Research Applications in Web of Science: A Europe-Wide Review. Remote Sens. 2019, 11, 2017. [Google Scholar] [CrossRef]
  61. Zhu, Q.; Zeng, M.; Jia, P.; Guo, M.; Liang, X.; Guan, Q. Measuring the urban sprawl based on economic-dominated perspective: The case of 31 municipalities and provincial capitals. Geo-Spat. Inf. Sci. 2023, 27, 1272–1289. [Google Scholar] [CrossRef]
  62. Padmanaban, R.; Bhowmik, A.K.; Cabral, P.; Zamyatin, A.; Almegdadi, O.; Wang, S. Modelling Urban Sprawl Using Remotely Sensed Data: A Case Study of Chennai City, Tamilnadu. Entropy 2017, 19, 163. [Google Scholar] [CrossRef]
  63. Torrens, P.M.; Alberti, M. Measuring Sprawl; London, 2000; Volume 27. Available online: https://discovery.ucl.ac.uk/id/eprint/1370/ (accessed on 24 May 2025).
  64. Thomas, R.W. Information Statistics in Geography; Geo Abstracts., 31.; University of East Anglia: Norwich, UK, 1981. [Google Scholar]
  65. Gordon, P.; Richardson, H.W. Are Compact Cities a Desirable Planning Goal? J. Am. Plan. Assoc. 1997, 63, 95–106. [Google Scholar] [CrossRef]
  66. Heffner, K. Kierunki Zmian w Przestrzeni Wiejskiej Polski—Wpisywanie Się w Przestrzeń Wsi Europejskiej. (Rural Spatial Development in Poland—Convergence with European Countryside Patterns). Polityka Spójności UE a Rozwój Obszarów Wiejskich. Stare Problemy i Nowe Wyzwania. (The European Union’s Cohesion Policy and Rural Development—Persisting Issues and Emerging Challenges); Kamińska, W., Heffner, K., Eds.; PAN: Warszawa, Poland, 2014; pp. 25–45. [Google Scholar]
  67. Gibas, P.; Heffner, K. Koncentracja zabudowy na obszarach wiejskich. (Concentration of built-up areas in rural regions). Wieś Rol. 2018, 2, 189–207. [Google Scholar] [CrossRef]
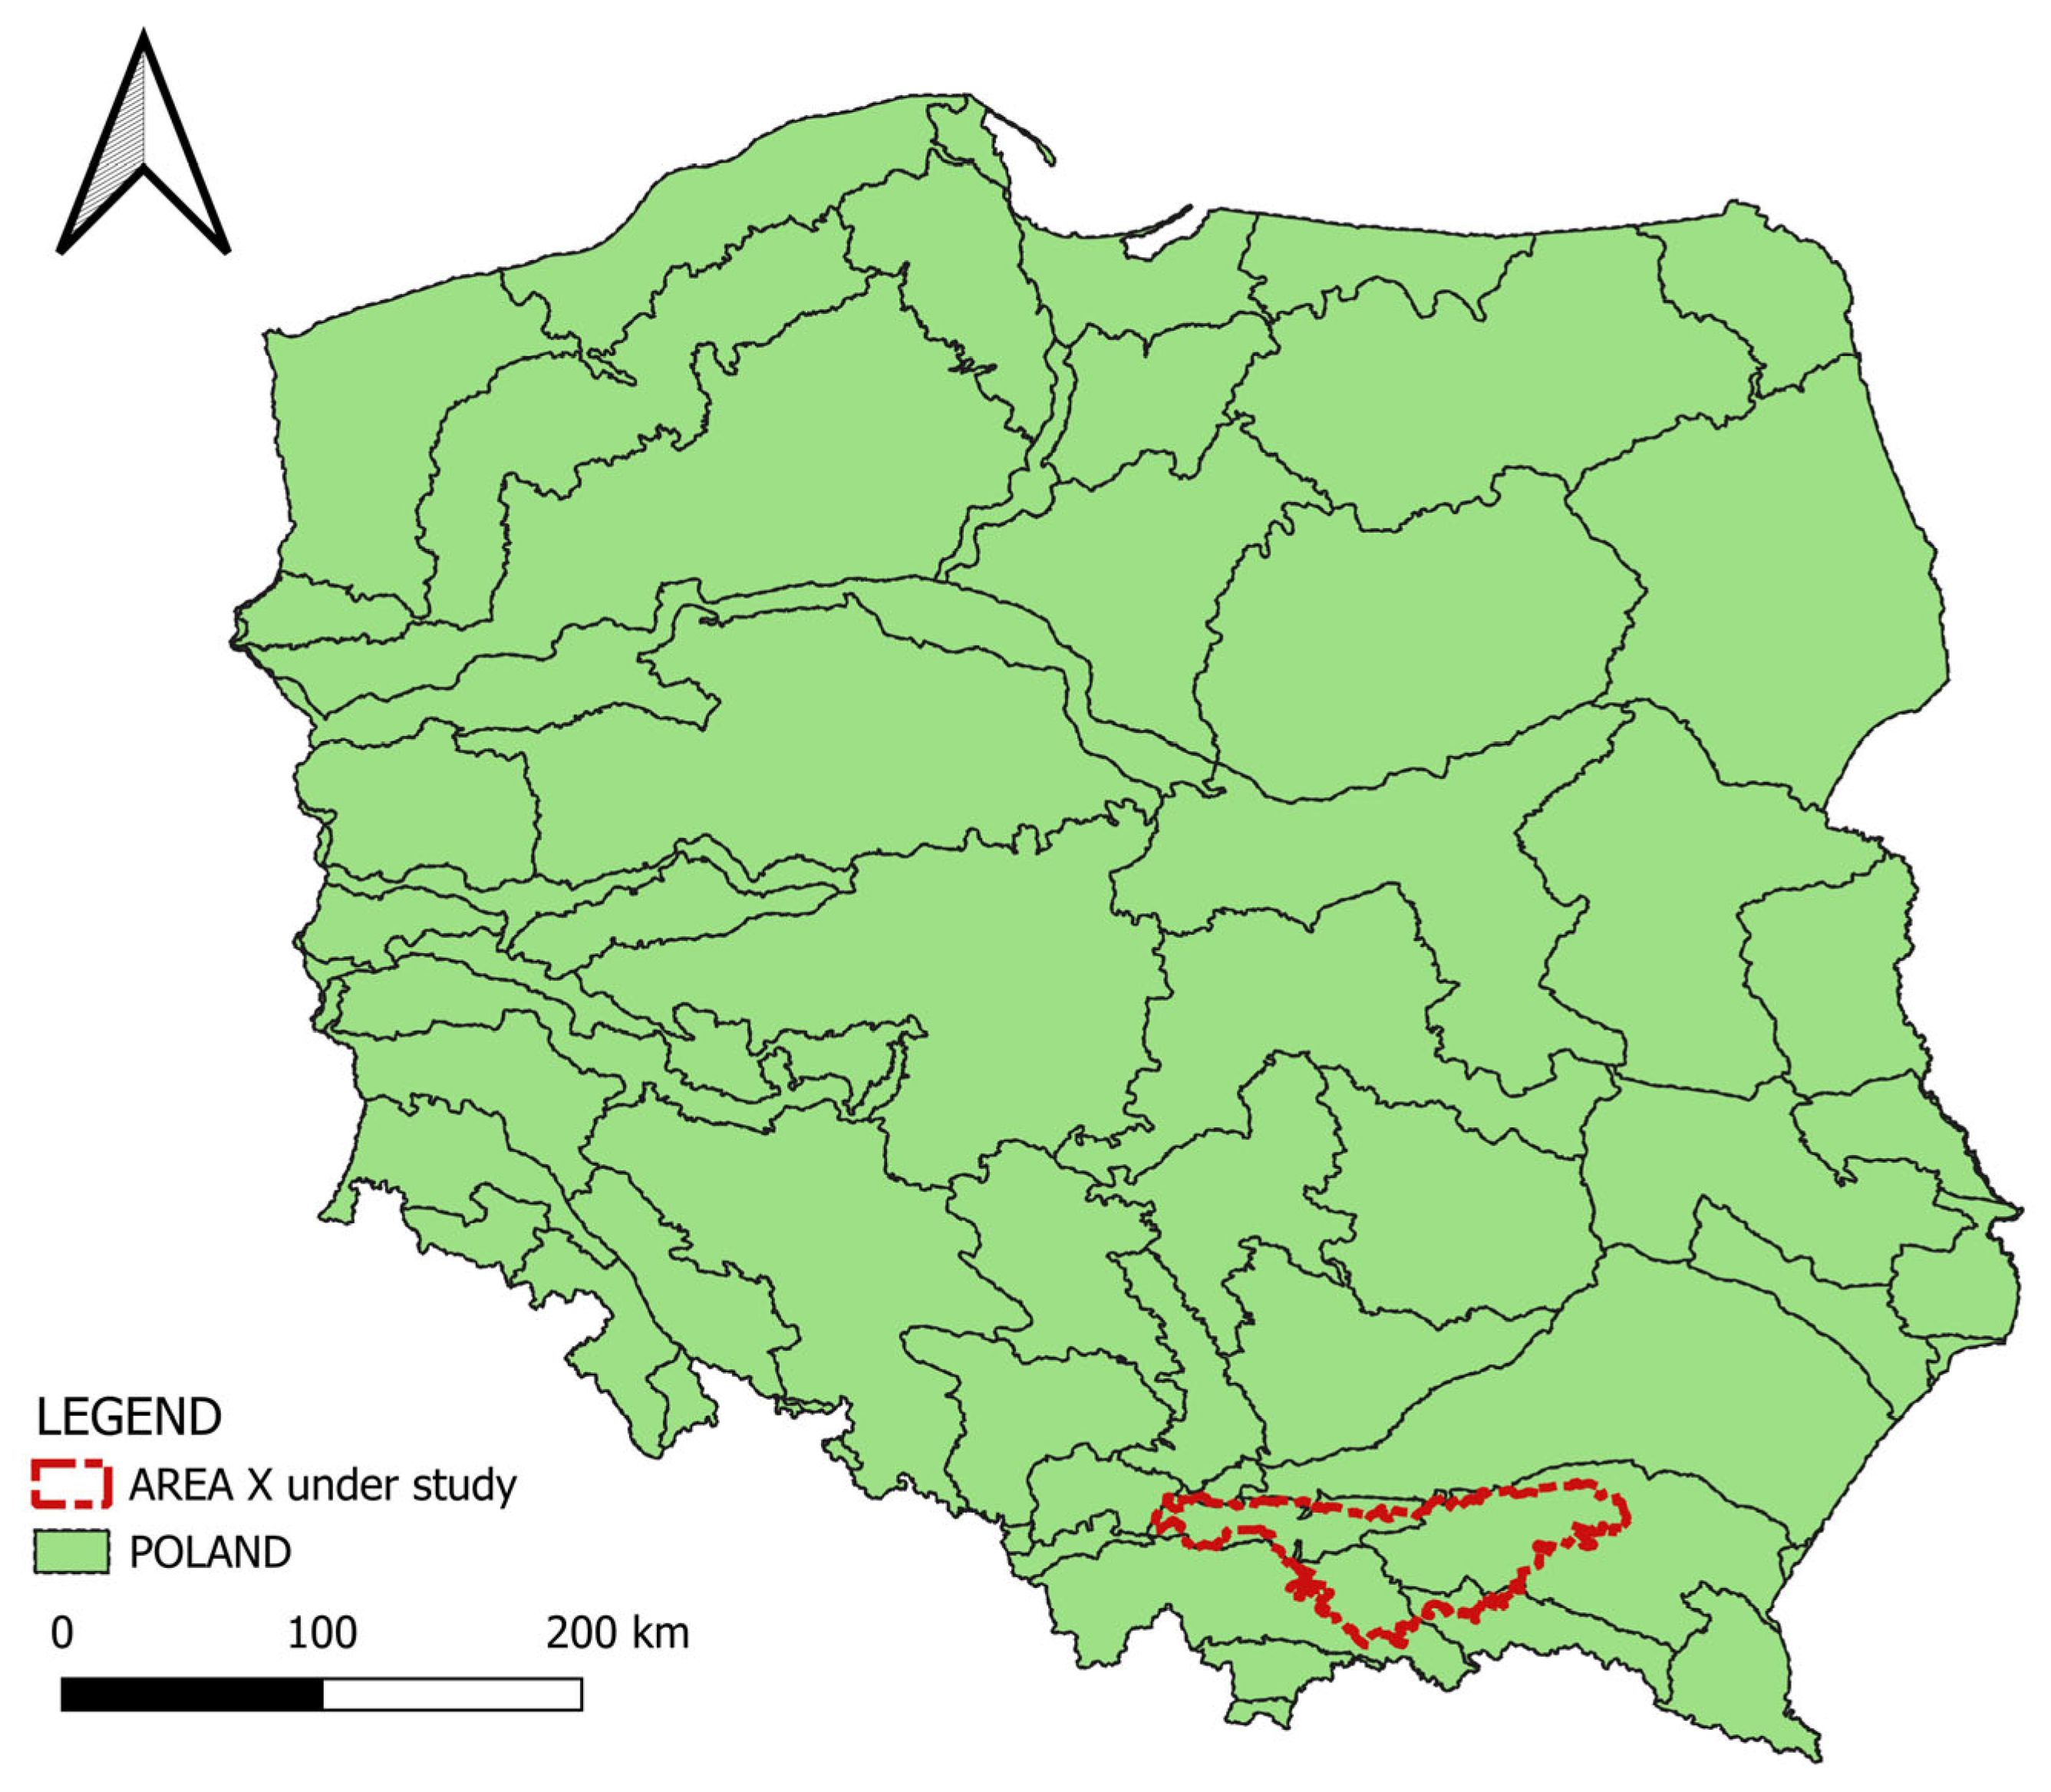
Figure 1. Location of Area X in Southern Poland. Source: author’s own elaboration using open data provided by the Head Office of Geodesy and Cartography (GUGiK): www.geoportal.gov.pl. (accessed on 24 May 2025).
Sustainability 17 09394 g001
Figure 2. Area X overlaid on the map of geographical regions of Southern Poland. Source: author’s own elaboration using open data provided by the Head Office of Geodesy and Cartography (GUGiK): IGZP PAN: www.igipz.pan.pl/baza-danych-geograficznych.html (accessed on 24 April 2025).
Sustainability 17 09394 g002
Figure 3. Built-up pattern in Area X—fragment of the study area: (a) topographic map, (b) orthophotomap. Source: author’s own elaboration using open data provided by the Head Office of Geodesy and Cartography (GUGiK): www.geoportal.gov.pl (accessed on 24 May 2025).
Sustainability 17 09394 g003
Figure 4. Spatial pattern (buildings) characteristic of Area X—representative fragment of the study area. Source: author’s own elaboration using open data provided by the Head Office of Geodesy and Cartography (GUGiK): www.geoportal.gov.pl. (accessed on 24 May 2025).
Sustainability 17 09394 g004
Figure 5. Boundaries of Area X: (a) on hypsometric map, (b) on map with the administrative boundaries. Source: author’s own elaboration using open data provided by the Head Office of Geodesy and Cartography (GUGiK): www.geoportal.gov.pl. (accessed on 24 May 2025).
Sustainability 17 09394 g005
Figure 6. Settlement clusters according “100 m distance rule”—a “leopard skin” pattern. Source: author’s own elaboration using open data provided by the Head Office of Geodesy and Cartography (GUGiK): www.geoportal.gov.pl. (accessed on 24 May 2025).
Sustainability 17 09394 g006
Figure 7. Methodological Framework for Spatial Form Metrics Quantification in Area X.
Sustainability 17 09394 g007
Figure 8. (A). Density DEN1(Ur) (1)—map of built-up density 1 in Area X, showing the number of buildings counted in settlement clusters Nb per raster cell Ur. Source: author’s own elaboration using open data provided by the Head Office of Geodesy and Cartography (GUGiK): www.geoportal.gov.pl. (B). Density DEN1_ENT(Ur)—heatmap of the entropy components for built-up DEN1 in Area X. Source: author’s own elaboration using open data provided by the Head Office of Geodesy and Cartography (GUGiK): www.geoportal.gov.pl. (accessed on 24 May 2025).
Sustainability 17 09394 g008
Figure 9. (A). Density DEN2(Ur)(2)—map of built-up Density 2 in Area X, showing the number of settlement clusters Nc per raster cell Ur. Source: author’s own elaboration using open data provided by the Head Office of Geodesy and Cartography (GUGiK): www.geoportal.gov.pl. (B). Density DEN2_ENT(Ur)—heatmap of the entropy components for built-up DEN2 in Area X. Source: author’s own elaboration using open data provided by the Head Office of Geodesy and Cartography (GUGiK): www.geoportal.gov.pl. (accessed on 24 May 2025).
Sustainability 17 09394 g009
Figure 10. (A). Intensity INT3(Ur)—map of built-up intensity in Area X, showing the sum of cluster areas Ac per raster cell Ur. Source: author’s own elaboration using open data provided by the Head Office of Geodesy and Cartography (GUGiK): www.geoportal.gov.pl. (B). Intensity INT3_ENT(Ur)—heatmap of the entropy components for built-up intensity INT3 in Area X. Source: author’s own elaboration using open data provided by the Head Office of Geodesy and Cartography (GUGiK): www.geoportal.gov.pl. (accessed on 24 May 2025).
Sustainability 17 09394 g010
Figure 11. (A). Dispersion DIS4(Ur)—map of settlement dispersion in Area X, measured as the median of average distances Dm of each cluster centroid to the six nearest cluster centroids within raster cell Ur. Source: author’s own elaboration using open data provided by the Head Office of Geodesy and Cartography (GUGiK): www.geoportal.gov.pl. (B). Dispersion DIS4_ENT(Ur)—heatmap of the entropy components for settlement dispersion DIS4 in Area X. Source: author’s own elaboration using open data provided by the Head Office of Geodesy and Cartography (GUGiK): www.geoportal.gov.pl. (accessed on 24 May 2025).
Sustainability 17 09394 g011
Figure 12. (A). Continuity CON5(Ur)—map of continuity in Area X, measured as the ratio of the number of ‘close neighbour’ distances Dcm to the total number of neighbourhood distances Dc(Ur) in raster cell Ur. Source: author’s own elaboration using open data provided by the Head Office of Geodesy and Cartography (GUGiK): www.geoportal.gov.pl. (B). Continuity CON5_ENT(Ur)—heatmap of the entropy components for continuity CON5 in Area X. Source: author’s own elaboration using open data provided by the Head Office of Geodesy and Cartography (GUGiK): www.geoportal.gov.pl. (accessed on 24 May 2025).
Sustainability 17 09394 g012
Figure 13. (A). Concentration CEN6(Ur)—map of concentration in Area X, measured as the ratio of the number of clusters Ncm(Ur) with neighbours within the threshold distance to the total number of clusters Nc(Ur) in raster cell Ur. Source: author’s own elaboration using open data provided by the Head Office of Geodesy and Cartography (GUGiK): www.geoportal.gov.pl. (B). Concentration CEN6_ENT(Ur)—heatmap of the entropy components for concentration CEN6 in Area X. Source: author’s own elaboration using open data provided by the Head Office of Geodesy and Cartography (GUGiK): www.geoportal.gov.pl. (accessed on 24 May 2025).
Sustainability 17 09394 g013
Figure 14. (A). Clustering CLU7(Ur)—map of aggregation levels in Area X, measured as the standard deviation between sub-cell and full-cell densities DEN2. Source: author’s own elaboration using open data provided by the Head Office of Geodesy and Cartography (GUGiK): www.geoportal.gov.pl. (B). Clustering CLU7_I(Ur)—heatmap of the entropy components for aggregation levels CLU7 in Area X. Source: author’s own elaboration using open data provided by the Head Office of Geodesy and Cartography (GUGiK): www.geoportal.gov.pl. accessed on 24 May 2025.
Sustainability 17 09394 g014
Table 1. Summary table of calculated Spatial Form Metrics (SFM) characterising Area X.
Data RangeMeanMedianStdDevCoVQ1Q3IQRHsH’s
DEN-11060.0090.1272.0084.230.934734.00121.0087.008.26060.9578
DEN-219.005.095.003.400.66862.007.005.008.36860.9703
INT_3924,488.00117,313.1785,349.30116,157.880.990234,152.00163,794.13129,642.008.16720.9470
DIS_41348.55434.64404.58121.400.2973354.87480.33125.468.53680.9898
CON_51.000.38850.40000.24540.63120.23500.53300.29808.23140.9544
CEN_61.000.22430.14300.26001.15900.00000.40850.40857.86860.9123
CLU_71.97060.53920.47820.36890.68420.25690.73030.47348.26120.9579
Disclaimer/Publisher’s Note: The statements, opinions and data contained in all publications are solely those of the individual author(s) and contributor(s) and not of MDPI and/or the editor(s). MDPI and/or the editor(s) disclaim responsibility for any injury to people or property resulting from any ideas, methods, instructions or products referred to in the content.