Article

Integrated Optimization of Train Schedules and Transportation Plans for a Passenger–Freight Metro Line

1
Jiangxi Provincial Key Laboratory of Comprehensive Stereoscopic Traffic Information Perception and Fusion, East China Jiaotong University, Nanchang 330013, China
2
School of Transportation Engineering, East China Jiaotong University, Nanchang 330013, China
3
School of System Science, Beijing Jiaotong University, Beijing 100044, China
4
School of Mathematics and Statistics, Jiangxi Normal University, Nanchang 330022, China
*
Authors to whom correspondence should be addressed.
Sustainability 2025, 17(2), 730; https://doi.org/10.3390/su17020730
Submission received: 22 November 2024 / Revised: 8 January 2025 / Accepted: 10 January 2025 / Published: 17 January 2025

Abstract

:
Against the backdrop of developing metro-based passenger and freight co-transportation plans, this study addresses the integrated optimization problem of train scheduling and flow control for a co-transportation metro line, where passengers and freight can share the same trains. Given a set of time-dependent passenger and freight demands, the problem involves determining the space-time trajectories and passenger (or freight) capacities of trains while simultaneously assigning these demands to the trains. To tackle this, train selection variables, carriage arrangement variables, and flow assignment variables are introduced, and the problem is formulated as an integer linear programming model. The objective is to minimize the weighted sum of the number of freight carriages, the total waiting time of all passengers, and the total delay of all freight. The proposed model is equivalent to a mixed-integer linear programming model, which allows a commercial solver to efficiently find the exact solution. To validate the effectiveness of the proposed method, several numerical examples of varying scales are tested. The results demonstrate that integrating the optimization of train schedules and co-transportation plans significantly enhances the efficiency of the entire co-transportation system.

1. Introduction

With the rapid progress of urbanization, it has become an important topic to explore more efficient and green urban traffic and transportation modes [1,2]. Because of its timeliness and short intervals, the metro system has become the first choice of public transportation for urban residents. Nevertheless, for most cities, the conflict between short intervals and insufficient passenger flow during off-peak hours results in redundant capacity [3,4]. To ease the pressure on ground traffic and reduce carbon emissions, the redundant capacity of metro systems being used for urban freight has been under consideration for the past decade [5,6,7]. In addition to the above social benefits, metro-based freight during off-peak hours can also provide additional income to metro operators.
Some international cities like Tokyo, Paris, Hong Kong, and others have made valuable attempts in implementing metro-based freight projects. These projects demonstrate that metro systems have significant potential to play a crucial role in urban freight transport, particularly in high-density cities and areas with heavy traffic congestion. In China, the Shenzhen Metro Airport Line launched a luggage pickup and delivery service on 21 October 2021, which supports door-to-door luggage pickup and delivery via a metro network; thus, the passengers traveling to the airport do not have to take the metro with their luggage. Guangzhou Metro Line 18 carried out a metro freight pilot project on 20 July 2022, and the pilot train was installed earlier than the first passenger train. It is reported that if the goods are to be transported during passenger transport hours, they can be placed in a special carriage. In addition, Beijing Metro Line 4 and Line 9 conducted a metro-based express delivery pilot project on 23 September 2023.

1.1. Literature Review

(1)
Passenger and freight co-transportation (PFCT).
Since the beginning of the 21st century, the integration of passenger and freight transport has been a topic of ongoing discussion among scholars and authorities [8,9,10,11]. A concept-centric literature review presented by [12] highlights a significant surge in research interest in recent years, with China emerging as the leading country in terms of research output. The commonly studied modes of PFCT include metro-based PFCT [13,14,15], bus-based PFCT [16,17,18], and high-speed railway-based PFCT [19,20].
Regarding metro-based PFCT, leveraging the redundant capacity of metro systems to transport goods is considered a viable alternative until dedicated underground logistics systems are fully developed. This concept has garnered significant attention in both the transportation and logistics fields. For example, ref. [21] examined network layout optimization, ref. [22] focused on the upgrading of infrastructure and equipment, and ref. [23] investigated the optimization of operational planning.
This study focuses on the operational planning of the train-shared mode, where trains simultaneously serve both passengers and freight. Specifically, we review research related to this aspect. With a given timetable, the primary challenges involve determining the composition of passenger and freight carriages and organizing the respective passenger and freight flows. For instance, ref. [13] developed an integer linear programming (ILP) model to address this issue and applied the Benders decomposition method to solve it accurately. However, when the timetable is integrated into the problem as a decision variable, the model and its solution become more complex.
Without considering carriage arrangements, ref. [23] proposed a mixed-integer nonlinear programming (MINLP) model and used a heuristic algorithm to solve it, given the model’s nonlinearity. Additionally, ref. [24] introduced a nonlinear model that considers both carriage arrangements and stopping plans, employing an improved variable neighborhood search (VNS) algorithm for its solution. By replacing carriage arrangements with a coupling (or marshalling) scheme, ref. [14] proposed a multi-objective nonlinear model and solved it using a nondominated sorting genetic algorithm (NSGA). Considering the passenger crowding and continuous arrival rates, ref. [25] formulated a MINLP model and designed a gradient-based heuristic algorithm.
Further, ref. [26] developed a MINLP model that incorporates both train-shared and train-dedicated modes. The model can be linearized and solved using commercial solvers, though the performance of solvers degrades for larger instances due to the high number of variables. To address this, two heuristic algorithms were designed. Notably, refs. [27,28] specifically examined the optimization of metro-based PFCT under the train-dedicated mode.
(2)
Urban rail transit schedule (URTS).
Unlike regional or national rail transit systems, urban rail transit systems typically do not allow overtaking or crossing between lines. As a result, the scheduling optimization for urban rail transit systems is relatively straightforward. However, many studies integrate schedule optimization with other aspects of system management. For instance, ref. [29] developed a nonlinear model to optimize a regular train schedule along with train speed profiles, solving the problem using a genetic algorithm. Additionally, focusing on energy consumption, ref. [30] formulated two mixed-integer linear programming (MILP) models for URTS and designed a Lagrangian relaxation-based heuristic algorithm to solve them.
In metro train scheduling, ref. [31] introduced skip–stop patterns and established a computationally tractable mixed-integer nonlinear programming (MINLP) model. Ref. [32] formulated a MILP model to jointly optimize train scheduling and circulation planning, which was solved using the CPLEX solver. Similarly, ref. [33] proposed a multi-objective MINLP model for integrated train scheduling and rolling stock circulation planning, devising an approximate solution method for the problem. For the collaborative optimization of flow control and train diagrams, ref. [34] constructed a MILP model and developed a hybrid solution approach that combined local search with the CPLEX solver. By integrating scheduling, train connections, and passenger control, ref. [35] formulated a MILP model and employed a Lagrangian relaxation-based solution method. Additionally, ref. [36] tackled vehicle and crew scheduling integration by proposing an integer linear programming (ILP) model and solving it through a column generation-based approach. As mentioned earlier, some studies have explored URTSs integrated with freight demands [14,23,24,26,27,28].
With the increasing complexity of urban rail transit networks and operations, new strategies have been proposed to meet the growing travel demands in large cities. Combining train headways with long/short turning as an integrated strategy, ref. [37] developed a MINLP model and applied a two-stage genetic algorithm for its solution. By integrating train timetabling, rolling stock circulation planning, and flexible train compositions, ref. [38] proposed two ILP models and designed a column generation-based solution approach. For a Y-type urban rail transit system, ref. [39] formulated an integrated optimization model for train timetables and flexible train compositions as an integer programming problem. Addressing more complex urban rail transit systems with multiple depots, line services, and train compositions, ref. [40] proposed a binary linear programming (BLP) model for joint rolling stock rotation planning and depot deadhead scheduling, solving it using a column generation-based algorithm.

1.2. Focus of This Study

Based on the above literature review, integrated urban rail transit systems (URTSs) remain a highly relevant and active area of research. In the context of passenger and freight co-transportation, there is an urgent need for the simultaneous optimization of train schedules and co-transportation plans for passenger–freight metro lines. Although this problem has attracted some attention, as summarized in Table 1, most existing models are nonlinear. While certain models (e.g., quadratic programming models) can be solved using commercial solvers, these solvers become ineffective as the scale of the problem increases. Consequently, various heuristic algorithms have been developed to address large-scale cases. However, these heuristics often produce solutions that deviate significantly from exact solutions, and in some cases, the solution gaps cannot be quantified.
To address these challenges, this study proposes a novel modeling approach by formulating the integrated train scheduling and co-transportation planning problem as an integer linear programming (ILP) model. The properties of this model enable its transformation into a mixed-integer linear programming (MILP) model, which can be solved precisely and efficiently using commercial solvers. The main contributions of this study are as follows:
(1)
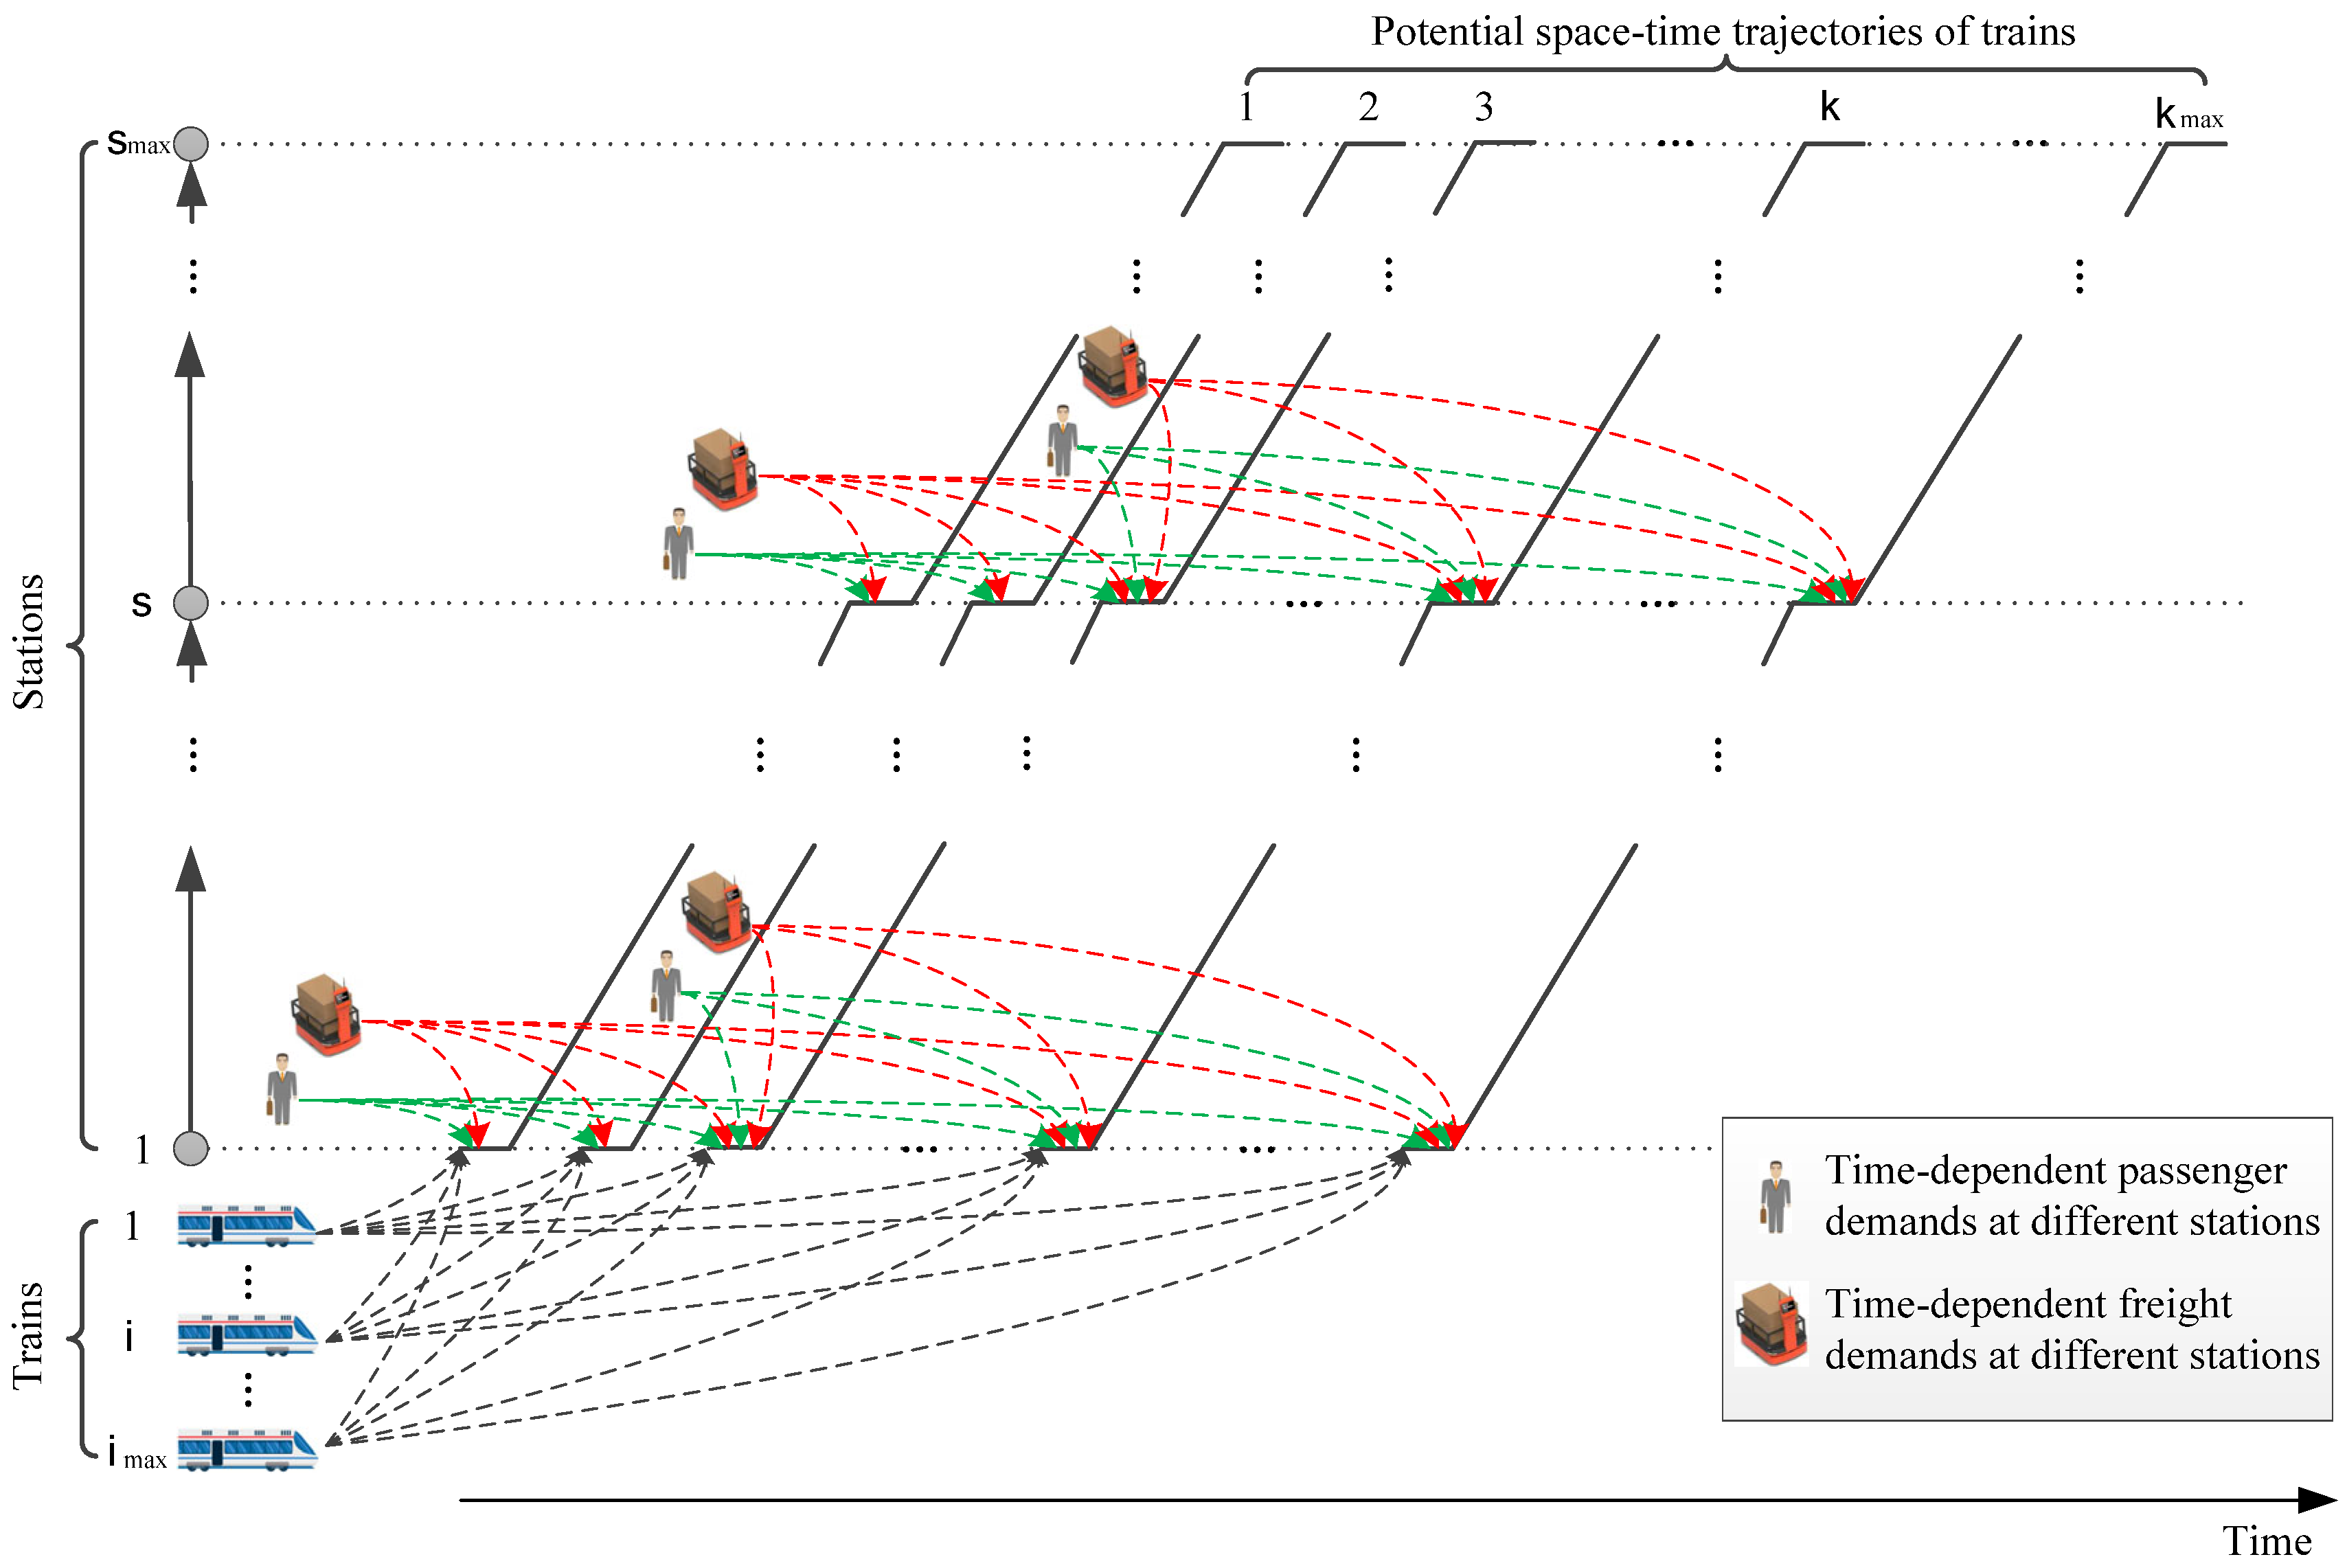
We propose a new framework in which both trains and passenger (or freight) flows select potential space–time trajectories (PSTTs). This contrasts with the traditional approach, where trains select PSTTs and passenger (or freight) flows are assigned to specific trains. By adopting this approach, the resulting model becomes linear.
(2)
The ILP model incorporates headway constraints, flow equilibrium constraints, capacity constraints, time window constraints, and coupling constraints. The objective function is designed to minimize the generalized total cost.
(3)
Through an equivalent transformation, the primal problem can be solved more efficiently by commercial solvers. This efficiency is validated through numerical experiments conducted on examples of varying scales.
(4)
The results demonstrate that integrating train schedule optimization with co-transportation planning significantly enhances transportation efficiency, thereby achieving the greatest potential improvement in system performance.
The remainder of this study is structured as follows: Section 2 provides a detailed problem statement, formulates the ILP model for the integrated optimization problem, and describes its transformation into a MILP model. In Section 3, the Beijing Metro Batong Line is used as a case study to compare the computational efficiency of the primal model and its equivalent, along with an analysis of the optimal results. Finally, Section 4 concludes the study and suggests directions for future research.

2. Mathematical Formulation

This study focuses on the integrated optimization of train schedules and co-transportation plans for passenger–freight metro lines. Unlike previous studies that primarily employ nonlinear models, this research aims to formulate the problem as an integer linear programming (ILP) model to enable precise solutions. To achieve this, several preparations are required. For clarity and ease of modeling, the parameter notations used in this study are defined in Table 2, while the four types of decision variables are outlined in Table 3.

2.1. Problem Statement

Given a metro line with stations 1 , 2 , , s m a x , there are trains 1 , 2 , , i m a x running in the same direction during time domain [ 0 , T ] . Generally, the decision process of our problem involves three stages: (1) determining the timetable for the trains, (2) allocating freight (or passenger) carriages for the trains, and (3) assigning freight and passenger flows to the trains. These three stages correspond to three interrelated subproblems that influence one another and collectively determine the overall system performance. In this study, we propose a model that integrates these subproblems to optimize the system’s performance.
For the first subproblem, we define the PSTTs, denoted as 1 , 2 , , k m a x , which are represented as diagonal broken lines in Figure 1. In other words, the timetable will be determined by selecting i m a x trajectories from these PSTTs. In theory, train i can select any trajectory as its schedule, illustrated by the black dashed curves at the bottom of Figure 1. To model this, we define a binary variable e i k : if train i uses the PSTT k , then e i k = 1 ; otherwise, e i k = 0 .
For the second subproblem, instead of directly assigning freight (or passenger) carriages to each train, we allocate them to each PSTT. Once a PSTT is selected as the train schedule, the freight (or passenger) carriages assigned to that PSTT are automatically assigned to the corresponding train. To capture this, we define an integer variable x k to represent the number of freight carriages allocated to PSTT k .
For the third subproblem, we assign time-dependent freight and passenger demands to each PSTT since the freight (or passenger) carriages are linked to the selected PSTTs. This is depicted by the green and red dashed curves in Figure 1. Accordingly, we define two integer variables: y j k , representing the volume of freight demand j D f assigned to PSTT k , and z j k , representing the volume of passenger demand j D p assigned to PSTT k .
In addition, we make the following assumptions:
Assumption 1.
A reasonable allocation of transportation resources can satisfy all demands.
Assumption 2.
Freight demand is measured in terms of the number of standard freight units (SFUs).
Assumption 3.
All carriages are of the same size, and all trains have the same number of carriages.
Assumption 4.
The dwelling time of trains at each station is sufficient for freight and passenger demands to board or alight.
Assumption 5.
Freight carriages are exclusively for freight, and passenger carriages are exclusively for passengers [13].

2.2. Optimization Model

With the above preparations, we can now formulate the constraints of the problem. Clearly, each train must select one, and only one, of the PSTTs as its schedule. Therefore,
k K e i k = 1   ,   i     I .
Since all PSTTs are predetermined, the departure time of PSTT k from station s , denoted as t k s d , is known. The linear combination k K ( t k s d e i k ) represents the departure time of train i from station s. Consequently, the headway constraints can be expressed as follows:
δ m i n k K t k s d ( e i k e i 1 k )     δ m a x ,   i     I \ { 1 } , s S .
In Constraint (2), parameters δ m i n and δ m a x represent the minimal headway and the maximal headway, respectively.
Significantly, a PSTT can be selected by at most one train. That is, for any k K , the expression i I e i k is equal to either 1 or 0. However, this constraint can be omitted here as it is inherently ensured by Constraints (1) and (2).
Under Assumption 1, the flow equilibrium constraints for freight and passenger demands can be expressed as the following two equalities:
k K y j k = f j ,   j D f ;
k K z j k = p j ,   j D p .
In Constraint (3), the parameter f j represents the volume of freight demand j ( D f ) , which corresponds to the number of SFUs involved in the freight demand j ( D f ) . Similarly, in Constraint (4), the parameter p j denotes the volume of passenger demand j ( D p ) , referring to the number of passengers associated with the passenger demand j ( D p ) .
Since freight and passenger carriages are allocated to each PSTT, the carriage allocation plan for a PSTT is only meaningful when the PSTT is selected by a train. Therefore, for any k K , it is essential to establish the following coupling relationship between x k and i I e i k .
x k n k i I e i k ,   k K .
In Constraint (5), the parameter n k represents the ceiling of the number of freight carriages allocated to PSTT k .
The number of freight and passenger carriages allocated to a PSTT determines its service capacity for freight and passengers. This capacity must not be exceeded in any running section. Therefore,
j D f , o j s < d ( j ) y j k c f x k , k     K ,   s ,   s + 1 E ;
j D p , o j s < d ( j ) z j k c p n i I e i k x k , k     K ,   ( s ,   s + 1 ) E .
In Constraint (6), parameter c f represents the freight service capacity of one carriage. In Constraint (7), parameter c p represents the passenger service capacity of one carriage, and parameter n represents the total number of carriages of a train.
For demands, SFUs or passengers can be served by a PSTT only if their arrival time at the origin station is no later than the departure time of the PSTT from that station. Consequently, the following inequalities hold:
t j a t k o ( j ) d · y j k 0   ,   j D f ,   k K ;
t j a t k o ( j ) d · z j k 0   ,   j D p ,   k K .
In Constraints (8) and (9), the parameters t j a and t k o ( j ) d represent the arrival time of demand j at its origin station o ( j ) and the departure time of PSTT k from this station, respectively. Since the variables y j k and z j k are nonnegative, if t j a > t k o ( j ) d , the values of y j k and z j k must be zero.
In this study, we additionally incorporate waiting time constraints, as represented by Expressions (10) and (11). In these constraints, the parameter w j denotes the maximum allowable waiting time for demand j .
t k o ( j ) d t j a w j · y j k 0   ,   j D f ,   k K ;
t k o ( j ) d t j a w j · z j k 0   ,   j D p ,   k K .
Based on the above description, we define the types and nonnegativity conditions for all decision variables.
e i k   { 0 ,   1 } ,   k K ,   i I ;
x k 0 , i n t e g e r ,   k K ;
y j k 0 ,   i n t e g e r ,   k K , j D f   ;
z j k 0 , i n t e g e r ,   k K ,   j D p .
Finally, we formulate the objective function based on two key principles. On the one hand, minimizing the number of carriages required for freight demand reduces the impact of freight operations on passenger demand. On the other hand, the waiting time for passenger demands should take priority over that of freight demands. Accordingly, a Generalized Operation Cost (GOC), which is defined as the weighted sum of freight carriages, passenger demand waiting time, and freight demand waiting time, is adopted as the objective function. Specifically:
g e , x ,   y , z = k K γ k x k + j D f k K α j · t k o ( j ) d t j a · y j k + j D p k K β j · t k o ( j ) d t j a · z j k
In expression (16), the parameters γ k ( k K ) , α j j D f , and β j ( j D p ) represent the weighted coefficients.
With the objective function (16) and the constraints from (1) to (15), we establish an integrated optimization model for a passenger and freight co-transportation metro line that simultaneously addresses train scheduling and co-transportation planning. This model is referred to as the primal problem, denoted as PP for convenience. It is an ILP model.
PP :   m i n           16                             s . t .             ( 1 ) ( 15 ) .

2.3. Model Relaxation

When the size of model PP increases, solving it precisely becomes challenging due to all decision variables being integers. To tackle this issue, we propose a relaxed version of model PP by converting a portion of the integer variables into continuous variables. Specifically, the nonnegative integer variables y j k and z j k in Constraints (14) and (15) are relaxed to nonnegative continuous variables. Formally, this relaxation is represented as follows:
y j k 0 ,   k K , j D f   ;
z j k 0 ,   k K ,   j D p .
Constraints (14) and (15) in model PP are replaced by Constraints (17) and (18), resulting in a relaxed model, referred to as RP.
RP :   m i n           16                                                         s . t .             1 13 , 17 , ( 18 ) .
In model RP, the decision variables e i k ( k K , i I ) and x k ( k K ) remain integer variables, making it a MILP model. According to the results in [8], model RP possesses a favorable mathematical property—namely, it is equivalent to model PP. In other words, the optimal solution of model RP is inherently an integer solution.

3. Numerical Experiments

In this section, the proposed model and its relaxation model are evaluated by a series of numerical experiments with different scales. These experiments were implemented in Gurobi 10.0.2 and run on an Intel Core i5-6200U personal computer with 8 GB of RAM and a 64-bit OS. The background information about these experiments comes from the Beijing metro Batong line used in other studies [13,34]. As shown in Figure 2, the line includes 13 stations. The station dwell time (unit: s) of trains is indicated in parentheses, and the section running time (unit: s) of trains is indicated beside the section arc. Other parameters are set as follows: n = 6 ,   n k = 3 k K ,   c f = 20 ,   c p = 200 ,   γ k = 500 k K ,   α j = 1 j D f ,   β j = 0.1 j D p ,   w j = 600 s j D p ,   δ m i n = 180   s ,   δ m a x = 480   s . In addition, a freight demand can be served by any train, as long as it arrives at its origin station before the train.

3.1. Computational Efficiency Analysis

As described above, model PP is equivalently transformed into model RP. To evaluate the efficiency of this transformation, we designed five numerical experiments. Table 4 summarizes the results, with the first column listing the indices of the experiments, followed by the corresponding parameters and the solution times obtained using Gurobi. For example, case I involves 10 trains, 60 PSTTs, 339 freight OD pairs with 726 SFUs, and 469 passenger OD pairs with 7927 passengers. Due to the large volume of time-dependent demand data, we present only Figure 3 to illustrate the cumulative amounts of freight and passenger demand in case I, with detailed data provided in a Supplementary Materials.
Under the termination condition where the gap is set to 10−4, we solve models PP and RP using Gurobi. For case I, Gurobi takes 25 s and 18 s to obtain the optimal solutions of models PP and RP, respectively. Notably, the objective values for both models are identical.
From the last two columns of Table 4, it is evident that the time required to solve model RP is consistently less than that needed to solve model PP. Specifically, for small- or medium-scale numerical experiments (e.g., cases I, II, or III), solving model RP reduces the computation time by 20–30% compared to model PP. For large-scale numerical experiments (e.g., cases IV or V), the time savings exceed 60%. Thus, solving the relaxed model proves to be significantly more efficient.

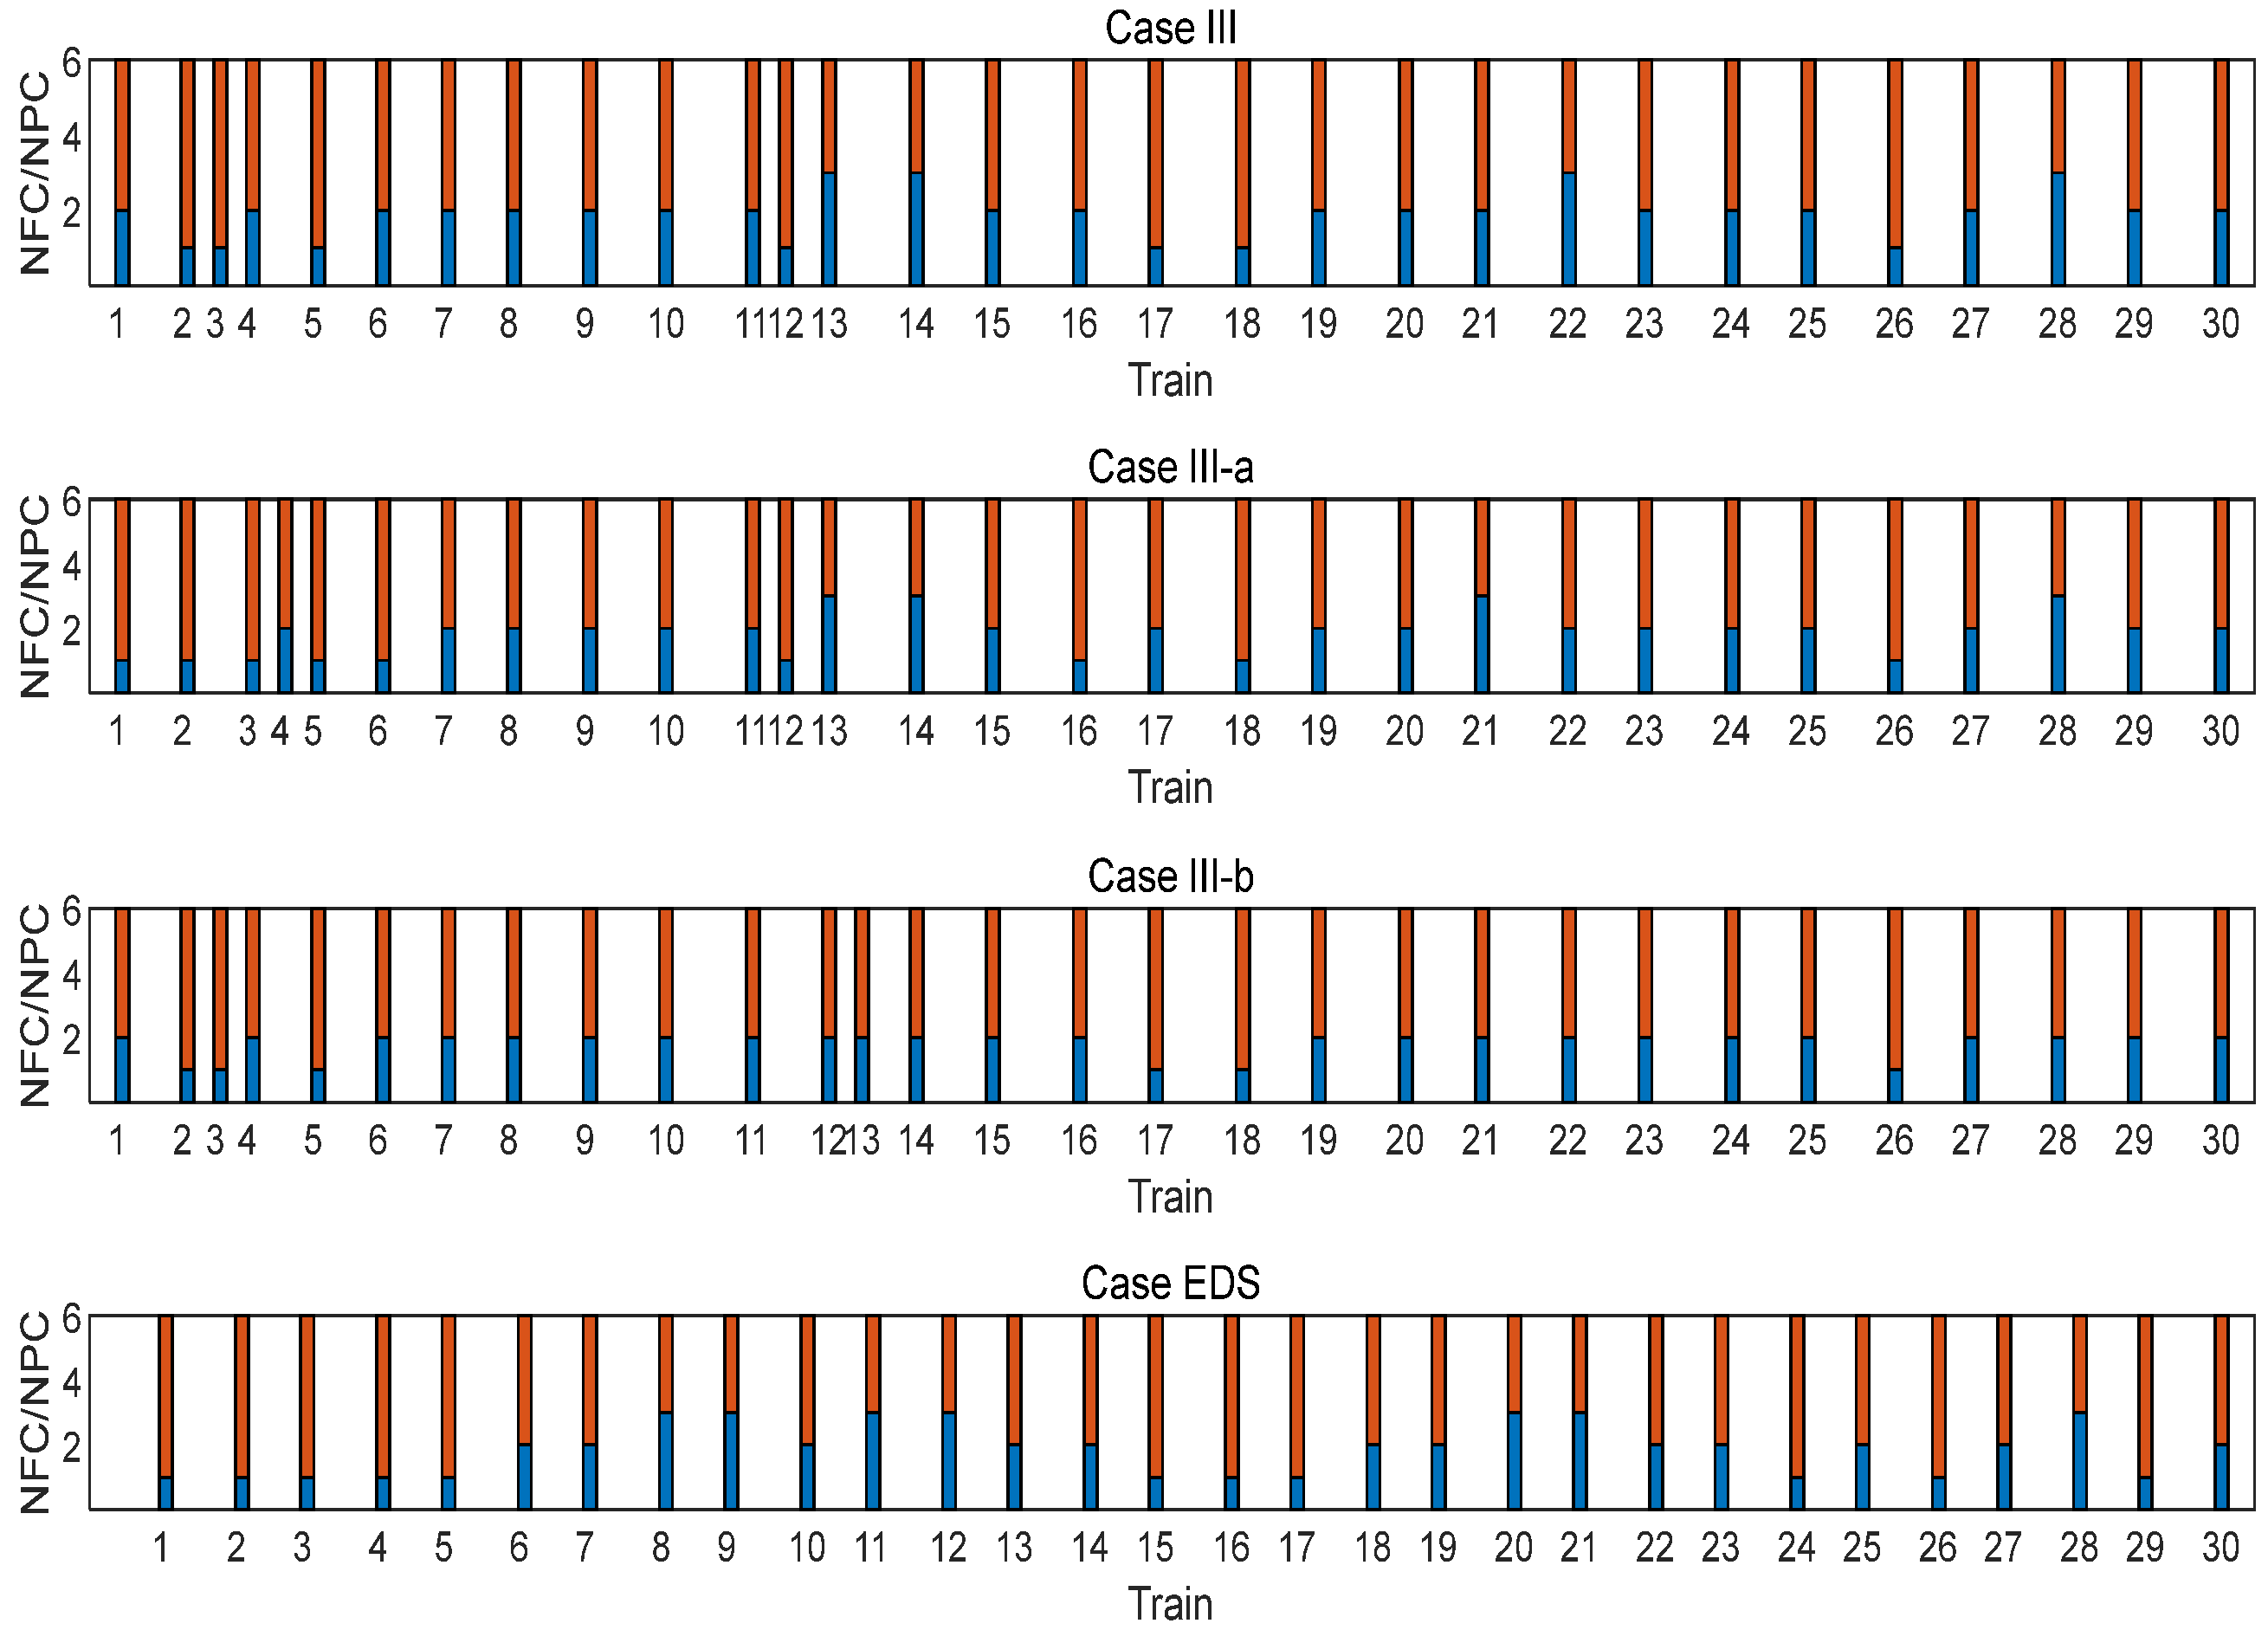
3.2. Solution Analysis of Case III

We select a medium-scale numerical experiment, i.e., case III, to demonstrate the integrated optimization results for train schedules and co-transportation plans. In this case, 30 train trajectories are selected from 199 PSTTs distributed at 60-s intervals. The optimal train schedule is depicted as solid lines in Figure 4, where different colored lines represent individual trains, each arranged with a different number of freight carriages.
According to Figure 4, the train schedule includes seven trains with one freight carriage, four trains with three freight carriages, and the majority of trains with two freight carriages. Some intervals reach the minimum headway, such as between trains 2 and 3, while others reach the maximum headway, such as between trains 10 and 11. Clusters of trains, such as trains 2, 3, and 4, as well as trains 11, 12, and 13, are relatively dense, while at other times, the distribution of trains is more evenly spaced.
To further detail the optimal train schedule and carriage arrangement plan, Figure 5 illustrates the corresponding flow assignments of freight and passenger demand. Each subplot in Figure 5 represents an individual train and contains extensive information. The title of each subplot indicates the train index and its carriage arrangement strategy. The vertical and horizontal axes represent the flow quantities and station indices, respectively.
The upper part of the vertical axis (above 0) indicates the freight capacity of the train, while the lower part (below 0) represents the passenger capacity. At each station, the two bars above the horizontal axis represent the number of standard freight units (SFUs) loaded onto and unloaded from the train, while the two bars below the horizontal axis show the number of passengers boarding and exiting the train. The horizontal lines above and below the horizontal axis between stations represent the numbers of SFUs and passengers on the train, respectively.
As discussed above, trains 2, 3, and 4 are relatively dense in terms of scheduling. However, Figure 5 shows that train 3 has spare capacity. In contrast, trains 2 and 4 (and even train 1) have reached their maximum freight and passenger capacities at certain stations. The minimal headways between trains 2, 3, and 4 indicate that neither the schedule nor the carriage arrangements can be further optimized during this period. Meanwhile, the headway between trains 10 and 11 is the largest, as seen in Figure 4. Due to time window constraints for passengers, both trains 10 and 11 exhibit spare freight and passenger capacities, whereas the freight capacities of trains 12 and 13 are fully utilized. Most trains maximize the use of their freight capacities, reflecting the objective function that minimizes the number of freight carriages.
Furthermore, the number of passengers deboarding at Station 13 is significantly higher than at other stations, as Station 13 serves as a transfer station, and passenger demand is based on historical operational data.
Both researchers and transit authorities are concerned about the impact of co-transportation metro lines handling freight demand on passenger flow. For case III, we provide Figure 6 to illustrate the changes in the number of SFUs and passengers stranded at each station. Each subplot in Figure 6 corresponds to a station (except for the terminal station), with the title indicating the station index. The vertical and horizontal axes represent the amount of stranded demand and the train index, respectively. The bars above and below the horizontal axis represent the number of stranded SFUs and passengers at each station, respectively.
For example, at Station 3, after train 2 departs, three SFUs and one passenger remain stranded but will board the next train. According to Figure 6, there are several SFUs but no passengers stranded at Stations 5, 6, and 9 after trains 13 and 14 depart. This is because trains 13 and 14 have reached the upper limits of their freight carriage capacities. Passengers at Station 10 experience the greatest impact, particularly during the periods involving trains 1 and 2, as passenger demand is highest during this time.

4. Discussion

It is easy to know that the proposed model can provide a solution to prevent many passengers from secondary waiting, as long as the values of parameters β j j D p are set large enough. In the following experiment (i.e., case III-a in Table 5), we specifically set β j = 1 j D p . In addition, it seems that the smaller the ceiling of the number of freight carriages allocated to PSTT k is set, the less impact the co-transportation has on passengers. In order to test whether this judgment is correct, we specially set n k = 2 ( k K ) in another experiment (i.e., case III-b in Table 5). The relevant calculation results are listed in the last six columns of Table 5, where TWT, SWT, and ADSW refer to the total waiting time, the second waiting time of passenger (or freight) demand, and the amount of passenger (or freight) demand with the second waiting, respectively, while TNPC (or TNFC) means the total number of passenger (or freight) carriages.
From Table 5, there are no passengers with the second waiting in case III-a, i.e., all passengers get on the first train they encounter; meanwhile, fewer carriages are occupied by freight demand (TNFC = 55). This is because, compared to case III, we have significantly increased the weight of waiting time of passengers in case III-a. The values of indicators TWT, SWT, and ADSW of freight demand in case III-a increase significantly. One counterintuitive fact is revealed by case III-b. Compared to case III, when the ceiling of the number of freight carriages allocated to PSTT k, i.e., the value of n k ( k K ) , is set to 2, the values of indicators TWT, SWT, and ADSW of passenger demand increase rather than decrease. These three values increase by 4.6%, 46.7%, and 29.2%, respectively. Additionally, the values of indicators TWT, SWT, and ADSW of freight demand in case III-b also increase. In fact, the optimal solution of case III-b is just a feasible solution of case III, and the range for optimizing the number of freight (or passenger) carriages is more limited in case III-b. Therefore, the impact of the co-transportation metro line involving freight demand on passengers can be controlled by setting greater weights of waiting time of passengers and expanding the search range of carriage arrangement.
During the off-peak hours, the train schedule is often distributed evenly. Under the evenly distributed schedule (i.e., case EDS), we also calculate the optimal co-transportation plan (i.e., carriage arrangement and flow assignment). For the convenience of comparison, the related indicators of case EDS are also displayed in Table 5 (see the last row). Compared to the result of case EDS, although the values of indicators SWT and ADSW of passenger demand in case III increase to some extent, the values of indicators TWT of passenger demand and freight demand decrease by 69.9% and 75.4%, respectively. The above fact verifies that it is from the perspective of the system that the method proposed in this study solves the integrated optimization problem of train schedules and co-transportation plans, and the effect is remarkable.
From Table 5, there is little difference in the total number of freight carriages among the four cases. To compare the distribution of TNPC/TNFC under different cases, we draw Figure 7, where the lower bars in each subplot represent the TNFC, and the upper bars represent the TNPC. It is obvious that the distribution of TNPC/TNFC under case III-a is similar to that under case III except for the first six trains. The reason can be found in Figure 6, where the second waiting of passengers mainly occurs during the first six trains. After increasing the weight of waiting time of passengers in case III-a, more carriages are reserved for passengers, and the second waiting of passengers disappears. Compared to case III, in order to hedge against fluctuations in demand, the greater adjustment of the train schedule under case III-b makes up for the limit of the TNFC. Under above three cases, the train density in the early stage is greater than that in the later stage. On the contrary, in order to hedge against fluctuations in demand, the greater adjustment of carriages under case EDS compensate for the uniformity of the schedule distribution. In summary, only by integrating the optimization of train schedules and co-transportation plans can the transportation efficiency be improved to the greatest extent.
For metro companies that are about to develop freight operations, our model can provide an assessment of current redundancy capacity, as long as we have access to the historical ridership data. In the examples above, metro trains during off-peak periods have approximately 30% redundancy transportation capacity, which can be repurposed for freight operations. Leveraging this redundancy capacity, along with rescheduling the train timetable, can simultaneously reduce waiting times for both passenger and freight demands.
In this study, the number of trains was fixed, leaving untapped transportation potential during periods of lower train frequency. If freight or passenger demand increases further and minimizing the impact of freight services on passengers becomes necessary, additional trains can be scheduled. Our model is capable of addressing this issue by accommodating different train fleet sizes.
In practice, the redundant transportation capacity of all trains may not be sufficient to meet all freight demands. However, an extended version of our model can effectively address this issue. Specifically, a dummy variable can be added to the flow equilibrium Constraint (3) to represent the amount of SFUs that cannot be accommodated by metro trains. Additionally, if freight demand cannot be split, it becomes necessary to introduce a new constraint to account for this limitation.

5. Conclusions

The integrated optimization of train schedules and co-transportation plans is a challenging problem, as the resulting model is typically nonlinear. By introducing a set of PSTTs for trains, arranging freight and passenger carriages, and assigning freight and passenger demands to each PSTT rather than each individual train, we reformulate the problem as an ILP. This is further transformed into a MILP, which can be solved efficiently and accurately using commercial solvers.
Through a series of numerical experiments, we draw the following conclusions. (1) Compared to solving the original model, the relaxed model significantly improves computational efficiency. (2) Under the same demand conditions, the weight coefficient of the objective function and the ceiling of the number of freight carriages per train have little impact on TNPC and TNFC, but the latter parameter has a significant impact on the TWT, SWT, and ADSW of both passenger and freight demands. (3) Metro-based co-transportation has limited impact on stations with low passenger flow, while it has a more noticeable effect on stations with high passenger flow. However, this effect can be mitigated by increasing the weights for passenger waiting time and expanding the search range for carriage arrangements. (4) Although the ADSW of passengers increases slightly, their average SWT decreases, and both the ADSW and average SWT of freight demands are significantly reduced. Consequently, the integrated optimization strategy substantially enhances the overall efficiency of the co-transportation metro line. These research findings can provide decision-making support for the development of freight operations within the metro system.
Nevertheless, the method proposed in this study is applied only to a single line and can naturally be extended to a metro network. Solving the model requires a more efficient method than commercial solvers. Additionally, the joint optimization of train schedules and co-transportation plans for a train-dedicated mode remains an intriguing area for future research.

Supplementary Materials

The following supporting information can be downloaded at: https://www.mdpi.com/article/10.3390/su17020730/s1.

Author Contributions

Conceptualization, Z.D.; methodology, Z.D. and J.Q.; software, Z.D.; validation, H.Z. (Housheng Zhou); formal analysis, H.Z. (Housheng Zhou); investigation, Z.D. and H.Z. (Hani Zuo); resources, Z.D.; data curation, H.Z. (Hani Zuo) and S.Z.; writing—original draft preparation, Z.D. and H.Z. (Hani Zuo); writing—review and editing, H.Z. (Housheng Zhou); visualization, Z.D.; supervision, Z.D.; project administration, Z.D.; funding acquisition, Z.D. All authors have read and agreed to the published version of the manuscript.

Funding

This research was funded by National Natural Science Foundation of China, grant number 72161010.

Data Availability Statement

The original contributions presented in this study are included in the article (Supplementary Materials). Further inquiries can be directed to the corresponding authors.

Conflicts of Interest

The authors declare no conflicts of interest.

References

  1. Macioszek, E. Analysis of the volume of passengers and cargo in rail and road transport in Poland in 2009–2019. Sci. J. Silesian Univ. Technol. (Ser. Transp.) 2021, 113, 133–143. [Google Scholar] [CrossRef]
  2. Macioszek, E. Analysis of the rail cargo transport volume in Poland in 2010–2021. Sci. J. Silesian Univ. Technol. (Ser. Transp.) 2023, 119, 125–140. [Google Scholar] [CrossRef]
  3. Anupriya; Graham, D.J.; Carbo, J.M.; Anderson, R.J.; Bansal, P. Understanding the costs of urban rail transport operations. Transp. Res. Part B 2020, 138, 292–316. [Google Scholar] [CrossRef]
  4. Cochrane, K.; Saxe, S.; Roorda, M.J.; Shalaby, A. Moving freight on public transit: Best practices, challenges, and opportunities. Int. J. Sustain. Transp. 2016, 11, 120–132. [Google Scholar] [CrossRef]
  5. Kikuta, J.; Ito, T.; Tomiyama, I.; Yamamoto, S.; Yamada, T. New subway-integrated city logistics szystem. Procedia Soc. Behav. Sci. 2012, 39, 476–489. [Google Scholar] [CrossRef]
  6. Marinov, M.; Giubilei, F.; Gerhardt, M.; Ozkan, T.; Stergiou, E.; Papadopol, M.; Cabecinha, L. Urban freight movement by rail. J. Transp. Lit. 2013, 7, 87–116. [Google Scholar] [CrossRef]
  7. Motraghi, A.; Marinov, M.V. Analysis of urban freight by rail using event based simulation. Simul. Model. Pract. Theory 2012, 25, 73–89. [Google Scholar] [CrossRef]
  8. Dampier, A.; Marinov, M. A study of the feasibility and potential implementation of metro-based freight transportation in Newcastle upon Tyne. Urban Rail Transit 2015, 1, 164–182. [Google Scholar] [CrossRef]
  9. Howe, J. Filling the middle: Uganda’s appropriate transport services. Transp. Rev. 2003, 23, 161–176. [Google Scholar] [CrossRef]
  10. Hu, W.; Dong, J.; Hwang, B.; Ren, R.; Chen, Z. Hybrid optimization procedures applying for two-echelon urban underground logistics network planning: A case study of Beijing. Comput. Ind. Eng. 2020, 144, 106452. [Google Scholar] [CrossRef]
  11. Zhu, S.; Bell, M.G.H.; Schulz, V.; Stokoe, M. Co-modality in city logistics: Sounds good, but how? Transp. Res. Part A 2023, 168, 103578. [Google Scholar] [CrossRef]
  12. Cavallaro, F.; Nocera, S. Integration of passenger and freight transport: A concept-centric literature review. Res. Transp. Bus. Manag. 2022, 43, 100718. [Google Scholar] [CrossRef]
  13. Di, Z.; Yang, L.; Shi, J.; Zhou, H.; Yang, K.; Gao, Z. Joint optimization of carriage arrangement and flow control in a metro-based underground logistics system. Transp. Res. Part B 2022, 159, 1–23. [Google Scholar] [CrossRef]
  14. Hou, Z.; He, R.; Liu, C.; Wan, S.; Yang, K.; Dai, C. Optimization of passenger and freight collaborative transportation for urban rail transit under virtual coupling condition. Eng. Lett. 2024, 32, 179–192. [Google Scholar]
  15. Li, F.; Guo, X.; Zhou, L.; Wu, J.; Li, T. A capacity matching model in a collaborative urban public transport system: Integrating passenger and freight transportation. Int. J. Prod. Res. 2022, 60, 6303–6328. [Google Scholar] [CrossRef]
  16. Bruzzone, F.; Cavallaro, F.; Nocera, S. The integration of passenger and freight transport for first-last mile operations. Transp. Policy 2021, 100, 31–48. [Google Scholar] [CrossRef]
  17. Donne, D.D.; Alfandari, L.; Archetti, C.; Ljubic, I. Freight-on-Transit for urban last-mile deliveries: A strategic planning approach. Transp. Res. Part B 2023, 169, 53–81. [Google Scholar] [CrossRef]
  18. Machado, B.; Pimentel, C.; Sousa, A. Integration planning of freight deliveries into passenger bus networks: Exact and heuristic algorithms. Transp. Res. Part A 2023, 171, 103645. [Google Scholar] [CrossRef]
  19. Li, S.; Zhu, X.; Shang, P.; Li, T.; Liu, W. Optimizing a shared freight and passenger high-speed railway system: A multi-commodity flow formulation with Benders decomposition solution approach. Transp. Res. Part B 2023, 172, 1–31. [Google Scholar] [CrossRef]
  20. Xu, G.; Zhong, L.; Wu, R.; Hu, X.; Guo, J. Optimize train capacity allocation for the high-speed railway mixed transportation of passenger and freight. Comput. Ind. Eng. 2022, 174, 108788. [Google Scholar] [CrossRef]
  21. Dong, J.; Hu, W.; Yan, S.; Ren, R.; Zhao, X. Network planning method for capacitated metro-based underground logistics system. Adv. Civ. Eng. 2018, 2018, 6958086. [Google Scholar] [CrossRef]
  22. Kelly, J.; Marinov, M. Innovative interior designs for urban freight distribution using light rail systems. Urban Rail Transit 2017, 3, 238–245. [Google Scholar] [CrossRef]
  23. Behiri, W.; Belmokhtar-Berraf, S.; Chu, C. Urban freight transport using passenger rail network: Scientific issues and quantitative analysis. Transp. Res. Part E 2018, 115, 227–245. [Google Scholar] [CrossRef]
  24. Ye, Y.; Guo, J.; Yan, L. A metro freight plan for mixed passenger and freight transportation. J. Adv. Transp. 2022, 2022, 6602387. [Google Scholar] [CrossRef]
  25. Di, Z.; Luo, J.; Shi, J.; Qi, J.; Zhang, S. Integrated optimization of capacity allocation and timetable rescheduling for metro-based passenger and freight cotransportation. Tunn. Undergr. Space Technol. 2025, 155, 106186. [Google Scholar] [CrossRef]
  26. Li, Z.; Shalaby, A.; Roorda, M.J.; Mao, B. Urban rail service design for collaborative passenger and freight transport. Transp. Res. Part E 2021, 147, 102205. [Google Scholar] [CrossRef]
  27. Ozturk, O.; Patrick, J. An optimization model for freight transport using urban rail transit. Eur. J. Oper. Res. 2018, 267, 1110–1121. [Google Scholar] [CrossRef]
  28. Sahli, A.; Behiri, W.; Belmokhtar-Berraf, S. An effective and robust genetic algorithm for urban freight transport scheduling using passenger rail network. Comput. Ind. Eng. 2021, 173, 108645. [Google Scholar] [CrossRef]
  29. Li, X.; Lo, H.K. An energy-efficient scheduling and speed control approach for metro rail operations. Transp. Res. Part B 2014, 64, 73–89. [Google Scholar] [CrossRef]
  30. Yin, J.; Yang, L.; Tang, T.; Gao, Z.; Ran, B. Dynamic passenger demand oriented metro train scheduling with energy-efficiency and waiting time minimization: Mixed-integer linear programming approaches. Transp. Res. Part B 2017, 97, 178–210. [Google Scholar] [CrossRef]
  31. Niu, H.; Zhou, X.; Gao, R. Train scheduling for minimizing passenger waiting time with time-dependent demand and skip-stop patterns: Nonlinear integer programming models with linear constraints. Transp. Res. Part B 2015, 76, 117–135. [Google Scholar] [CrossRef]
  32. Wang, Y.; Tang, T.; Ning, B.; Meng, L. Integrated optimization of regular train schedule and train circulation plan for urban rail transit lines. Transp. Res. Part E 2017, 105, 83–104. [Google Scholar] [CrossRef]
  33. Wang, Y.; D’Ariano, A.; Yin, J.; Meng, L.; Tang, T.; Ning, B. Passenger demand oriented train scheduling and rolling stock circulation planning for an urban rail transit line. Transp. Res. Part B 2018, 118, 193–227. [Google Scholar] [CrossRef]
  34. Shi, J.; Yang, L.; Yang, J.; Gao, Z. Service-oriented train timetabling with collaborative passenger flow control on an oversaturated metro line: An integer linear optimization approach. Transp. Res. Part B 2018, 110, 26–59. [Google Scholar] [CrossRef]
  35. Liu, R.; Li, S.; Yang, L. Collaborative optimization for metro train scheduling and train connections combined with passenger flow control strategy. Omega 2020, 90, 101990. [Google Scholar] [CrossRef]
  36. Pan, H.; Liu, Z.; Yang, L.; Liang, Z.; Wu, Q.; Li, S. A column generation-based approach for integrated vehicle and crew scheduling on a single metro line with the fully automatic operation system by partial supervision. Transp. Res. Part E 2021, 152, 102406. [Google Scholar] [CrossRef]
  37. Li, S.; Xu, R.; Han, K. Demand-oriented train services optimization for a congested urban rail line: Integrating short turning and heterogeneous headways. Transp. A 2019, 15, 1459–1486. [Google Scholar] [CrossRef]
  38. Pan, H.; Yang, L.; Liang, Z. Demand-oriented integration optimization of train timetabling and rolling stock circulation planning with flexible train compositions: A column-generation-based approach. Eur. J. Oper. Res. 2023, 305, 184–206. [Google Scholar] [CrossRef]
  39. Yang, L.; Gao, Y.; D’Ariano, A.; Xu, S. Integrated optimization of train timetable and train unit circulation for a Y-type urban rail transit system with flexible train composition mode. Omega 2024, 122, 102968. [Google Scholar] [CrossRef]
  40. Wang, D.; D’Ariano, A.; Zhao, J.; Zhan, S.; Peng, Q. Joint rolling stock rotation planning and depot deadhead scheduling in complicated urban rail transit lines. Eur. J. Oper. Res. 2024, 314, 665–684. [Google Scholar] [CrossRef]
Figure 1. Schematic diagram of problem description and modeling ideas.
Sustainability 17 00730 g001
Figure 2. A sketch of Beijing metro Batong line.
Sustainability 17 00730 g002
Figure 3. The cumulative amounts of freight and passenger demands on case I.
Sustainability 17 00730 g003
Figure 4. The optimal train schedule and carriage arrangement plan of case III.
Sustainability 17 00730 g004
Figure 5. The illustration of SFUs and passengers getting on and off each train.
Sustainability 17 00730 g005
Figure 6. The changes of amounts of SFUs and passengers stranded at each station.
Sustainability 17 00730 g006
Figure 7. The optimal carriage distribution under different cases.
Sustainability 17 00730 g007
Table 1. Comparison with work related to the integrated optimization of train schedules and co-transportation plans under the train-shared mode.
ResearchModel TypeSolution MethodFlow Assignment Strategy
[23]NonlinearHeuristicTo trains
[26]NonlinearSolver and HeuristicTo trains
[24]NonlinearVNS 1To trains
[14]NonlinearNSGA 2To trains
[25]NonlinearHeuristicTo trains
This studyLinearSolverTo trajectories
1 Variable Neighborhood Search; 2 Nondominated Sorting Genetic Algorithm.
Table 2. Notations involved in the formulations.
NotationDefinition
[ 0 , T ] Given time domain
S Set   of   stations   of   a   metro   line ,   S { 1 , 2 , , s m a x }
E Set   of   sec tions   of   a   metro   line ,   E { ( s , s + 1 ) | s S \ { s m a x } }
I Set   of   trains   to   run   during   [ 0 , T ] ,   I { 1 , 2 , , i m a x } }
K Set   of   PSTTs   for   trains ,   K { 1 , 2 , , k m a x }
D f Set of time-dependent freight demands
D p Set of time-dependent passenger demands
s , s Index   of   stations ,   s , s S
i Index   of   trains ,   i I
k Index   of   PSTTs ,   k K
j Index   of   demands ,   j D f or   j D p
t k s d Time   when   the   PSTT   k   departs   from   the   station   s ,   t k s d [ 0 , T ]
t j a Time   when   the   demand   j   arrives   its   origin   station ,   t j a [ 0 , T ]
o ( j ) Origin   station   of   the   demand   j ,   o ( j ) S \ { s m a x }
d ( j ) Destination   station   of   the   demand   j ,   d ( j ) S \ { 1 }
w j Parameter   to   represent   the   maximal   waiting   time   of   the   demand   j
n Parameter to represent the number of carriages of a train
n k Parameter   to   represent   the   ceiling   of   the   number   of   freight   carriages   allocated   to   the   PSTT   k
c f Parameter to represent the capacity of a carriage for freights
c p Parameter to represent the capacity of a carriage for passengers
f j Parameter   to   represent   the   volume   of   the   freight   demand   j ( D f )
p j Parameter   to   represent   the   volume   of   the   passenger   demand   j ( D p )
Table 3. Variables involved in the formulations.
VariableDefinition
e i k 0 1   variable ,   if   train   i   uses   the   PSTT   k ,   then   e i k = 1 ;   otherwise   e i k = 0 .
e Vector   to   group   all   the   variables   e i k ( i I , k K )
x k Integer   variable   to   represent   the   number   of   freight   carriages   arranged   to   the   PSTT   k
x Vector   to   group   all   the   variables   x k ( k K )
y j k Integer   variable   to   represent   the   volume   of   freight   demand   j   assigned   to   the   PSTT   k
y Vector   to   group   all   the   variables   y j k ( j D f , k K )
z j k Integer   variable   to   represent   the   volume   of   passenger   demand   j   assigned   to   the   PSTT   k
z Vector   to   group   all   the   variables   z j k ( j D p , k K )
Table 4. Experiments with different scales and their solution time using Gurobi.
CaseNum. of
Trains
Num. of
PSTTs
Demand ParametersStop Cond.
(Gap)
Comp. Time of Gurobi
FreightPassengerModel PPModel RP
I1060(339, 726)(469, 7927)10−425 s18 s
II20124(192, 936)(889, 10,914)10−430 s21 s
III30199(605, 1278)(1206, 18,378) 10−499 s78 s
IV40266(902, 1977) (1502, 23,439)10−42381 s915 s
V65336(1179, 5208)(1779, 27,681)10−413,744 s4871 s
Table 5. Comparison of optimal solutions with different parameters based on case III.
CaseParametersPassenger DemandTNPC/TNFC *Freight Demand
β k n k TWT * (s) SWT * (s)ADSW *TWT * (s)SWT * (s)ADSW *
III0.131,478,43069,685161123/57122,670636012
III-a131,367,37000125/55169,89014,98026
III-b0.121,546,350102,260208126/54139,95010,46022
EDS *0.134,912,23044,09595124/56498,21072,11559
* Case EDS: Case with Evenly Distributed Schedule; TWT: Total Waiting Time; SWT: Second Waiting Time; ADSW: Amount of Demand with the Second Waiting; TNPC: Total Number of Passenger Carriages; TNFC: Total Number of Freight Carriages.
Disclaimer/Publisher’s Note: The statements, opinions and data contained in all publications are solely those of the individual author(s) and contributor(s) and not of MDPI and/or the editor(s). MDPI and/or the editor(s) disclaim responsibility for any injury to people or property resulting from any ideas, methods, instructions or products referred to in the content.

