Abstract
The “Belt and Road” initiative centrally embodies the Chinese government’s new concept of further strengthening regional cooperation and opening up to the outside world. The “21st Century Maritime Silk Road” (MSR) is a key component of this initiative. This study uses the MSR policy as a quasi-natural experiment to explore its impact on the efficiency of China’s coastal ports and the mechanisms underlying this effect, employing a difference-in-differences (DID) model based on panel data from major coastal ports in China between 2011 and 2022. The study finds that the policy of the MSR can significantly contribute to the efficiency of ports along the route, and this conclusion still holds after a series of robustness tests that take into account endogeneity issues and the exclusion of other policy interferences. From the analysis of heterogeneity, the construction of the MSR can effectively promote port efficiency in the southern region and large cities. From the perspective of the impact mechanism, this policy mainly promotes port efficiency by mentioning the optimization of the human capital structure, the improvement of the level of industrialization, and the construction of infrastructure. The conclusions of the study are of great significance in the advancement of high-quality sustainable development of ports along China’s routes.
1. Introduction
Ports are crucial transportation hubs that connect inland areas with the sea, playing a vital role in international trade, economic development, and regional logistics [1,2,3]. The high-quality sustainable development of ports is also heavily influenced by national policies. Driven by economic globalization and regional integration, China’s foreign trade activities have become more frequent, promoting steady growth in port throughput. As a result, China’s port throughput has surged to the top position globally [4]. However, the sharp increase in port freight and container volumes has led to the extensive development of ports. Many ports have failed to clearly define their positioning, leading to issues such as insufficient infrastructure [5], blind expansion of investment [6], and outdated technology and management experience [7], resulting in an imbalance between port input and output. Under the influence of the “Matthew effect,” the operational efficiency of ports has declined. Moreover, as China’s economic development enters a new normal, it puts forward higher requirements for the high-quality sustainable development of Chinese ports, which covers a rich connotation of intensification, orderly competition, and other factors [8]. As a result, the previous crude development model, which focused solely on expanding port scale and growth rate at the expense of efficiency and quality, is no longer feasible. The Chinese government must now introduce relevant policies to guide the high-quality sustainable development of ports. To accelerate port construction and promote transformation and upgrading, China foresaw the need for the “21st Century Maritime Silk Road” (MSR) strategy, which has injected new vitality into the economies of the regions along the route, while providing new opportunities for port development.
To further deepen cooperation between China and the ASEAN countries, the Chinese government introduced the strategic concept of the MSR in 2013. The proposal outlined the direction for the development of the modern marine economy, provided a platform for international trade and cultural exchanges, and served as the maritime link of the “Belt and Road” initiative. In March 2015, building on this foundation, the National Development and Reform Commission (NDRC) of China, in collaboration with the Ministry of Foreign Affairs (MOFA) and the Ministry of Commerce (MOFCOM), issued the “Vision and Actions on Promoting the Joint Development of the Silk Road Economic Belt and the 21st-Century Maritime Silk Road” (Vision and Actions). This document explicitly called for the rational development of ports in 15 key coastal cities, such as Shanghai and Qingdao, to promote the sustainable development of ports and enhance port efficiency. Since then, MSR construction has transitioned from a top-level design phase to a pragmatic implementation phase. Following the implementation of this policy, trade cooperation among the coastal regions has become increasingly close-knit, significantly enhancing port throughput. Concurrently, in advancing the MSR construction, targeted support measures have been implemented, increasing capital investment in port areas along the route, intensifying infrastructure development, accelerating technological innovation, and thereby, promoting the intensive development of ports. The MSR policy also emphasizes facilitating talent exchange and cooperation, improving port management by attracting and nurturing maritime and port professionals. Today, China’s coastal ports have developed rapidly, with 90% of the country’s foreign trade goods being transported by sea. In 2023, national ports handled a cargo throughput of 169.73 billion tons, marking an 8.2% increase. Container throughput reached 310 million standard containers, a 4.9% increase, indicating improved efficiency in handling bulk and containerized cargo at Chinese ports.
The purpose of this paper is to study and try to answer the following questions: Does MSR construction promote the efficiency of ports along the route? Is there any difference in the impact of MSR policy on ports in different regions and ports in cities of different sizes? In what ways does MSR policy mainly promote port efficiency? Clarifying the above problems helps provide important decision-making enlightenment for the government and port enterprises and has certain practical significance. Specifically, using the DID model to quantify the impact of MSR policy on port efficiency is helpful in promoting the implementation of the policy. Second, the heterogeneity of MSR policy is analyzed from different aspects, and the analysis results are helpful for port enterprises to clarify their own status and formulate their own development strategies according to local conditions. Finally, the analysis of the MSR’s influence on port efficiency through the test of influence mechanism can make clear the direction for the formulation of relevant policies of the port and the government.
In comparison to the existing literature, the innovations of this study are as follows. First, most previous studies on port efficiency have focused on the internal operational aspects of ports, neglecting the influence of external policies on port development. This study takes the MSR policy as a starting point, applies the global DEA–Malmquist index to measure port efficiency, and then utilizes the DID model to quantify the policy impacts of MSR construction on port efficiency, thereby enriching the literature on policy evaluation related to this initiative. Second, building on the use of the DID model, this paper employs instrumental variable methods and conducts additional robustness checks to ensure the rigor of the research findings. Third, the study explores the differentiated impacts of policies on ports in different regions and cities of varying sizes and comprehensively examines the mechanisms through which MSR affects port efficiency. It conducts scientific tests from multiple dimensions, providing a reference for the development of targeted policies for port growth.
2. Literature Review
From the existing studies, the main literature related to the research topic and content of this paper are studies related to port efficiency and studies related to MSR.
2.1. Relevant Studies on Port Efficiency
2.1.1. Connotation of Port Efficiency
Efficiency is interpreted differently in economics, but its essence lies in the relationship between outputs and inputs—achieving desired outputs with minimal inputs or maximizing outputs given fixed inputs. With intensifying competition among ports and increasing concerns for sustainable development, port managers increasingly recognize the importance of reducing cargo-handling time and improving port turnaround capacity for competitiveness [9,10]. Efficiency analysis is now widely applied to assess the sustainable development and operational performance of ports. Port efficiency refers to a port’s ability to use fewer inputs to produce greater outputs compared to other ports. Enhancing port efficiency can lower operational costs, while improving service quality can attract more ships, thereby promoting the high-quality sustainable development of port enterprises and regional logistics along the MSR [11,12]. According to the existing literature on port efficiency, from the input–output perspective, port efficiency can be categorized into static and dynamic efficiency. Static efficiency is most commonly measured by overall technical efficiency (OTE), which reflects a port’s overall operating conditions, encompassing both the pure technical efficiency related to loading and unloading operations and the scale efficiency representing production scale. Studies analyzing port panel data with multiple time-point observations typically use the Malmquist index to measure dynamic efficiency and assess changes in port efficiency over time [13,14,15].
2.1.2. Measurement of Port Efficiency
Currently, frontier methods are the most commonly used approaches for efficiency measurement, including parametric methods (e.g., SFA) and non-parametric methods (e.g., DEA). Parametric methods require the prior specification of a model and assumptions about random error terms, which makes these methods more subjective and prone to uncertainty [16]. In contrast, DEA does not require prior specification of the functional relationship between inputs and outputs, thereby avoiding structural bias caused by incorrect production function specifications. Moreover, the DEA can effectively handle multiple inputs and outputs, enhancing its versatility. Consequently, most researchers in the field employ DEA models and the Malmquist index to measure port efficiency.Roll and Hayuth first applied DEA method to the measurement of port efficiency in 1993. They confirmed the applicability of the DEA in evaluating port efficiency through theoretical analysis, but did not conduct empirical research [17]. On this basis, the scholars later discussed the evaluation and measurement of port efficiency more deeply. Tongzon selected input–output indicators for ports and applied the DEA model to measure the efficiency of four Australian ports and twelve international ports, empirically confirming the applicability of DEA for port efficiency evaluation [18]. However, traditional DEA models are limited to measuring static efficiency at specific points in time and are unsuitable for long time-series data [19,20,21]. Estache employed the DEA–Malmquist index to calculate and decompose productivity changes in Mexican port infrastructure from 1996 to 1999, reporting an average annual efficiency growth [19]. Building on this, Barros extended the sample period and employed the DEA–Malmquist index to assess the dynamic efficiency of ports in Angola, Mozambique, and Nigeria [22]. However, Chinese scholar Pang argued that, when measuring port efficiency, it is important to expand the sample size and spatial scope as much as possible to ensure the stability of the research results. He applied the DEA model to evaluate the management efficiency of 50 major coastal ports in China and used the Malmquist index to analyze changes in port efficiency, concluding that coastal port efficiency generally exhibited an upward trend [20]. Similarly, Yuen applied the DEA–Malmquist index to analyze the dynamic efficiency of 21 major container terminals in China and investigated the factors affecting terminal efficiency [21]. Given that most previous scholars have used the Malmquist index to measure the efficiency of coastal ports, Ye et al. shifted their focus to non-coastal ports. They applied the Malmquist index to assess dynamic changes in port efficiency along the Yangtze River in China, finding that technical efficiency generally increased from upstream to downstream [15]. Thus, the DEA–Malmquist index proves to be a reliable tool for evaluating the efficiency of various port types, ensuring accurate measurement results.
2.2. Relevant Studies on MSR
2.2.1. MSR and Regional Economy
The MSR policy serves as a key driver of regional economic development, enhancing and diversifying international trade while promoting the growth of ports, shipping, and logistics [23,24]. For instance, Xu et al. argue that the MSR reduces transportation costs by establishing advanced transportation networks and enhancing maritime connectivity, thereby advancing the logistics industry in coastal provinces [25]. Furthermore, the MSR has also spurred rapid development in the maritime economy and tourism industry, creating numerous job opportunities, enhancing local income levels, and adding new impetus to the economic development of the regions along the route [26,27]. Zhao et al. suggest that the MSR policy establishes a new platform for advancing maritime technology and optimizing industrial structures in coastal countries, contributing to an overall upward trend in maritime economic efficiency along the route [28]. Alaaddin investigates the impact of the “Belt and Road” initiative on the tourism economic development of regions along the route using the DID, confirming that the initiative has promoted the development of the tourism industry in these regions [29].
2.2.2. The Impact of MSR on Port Efficiency
The existing studies primarily explore the economic, environmental, and port–city synergy benefits of the MSR policy. In terms of economic benefits, scholars widely agree that the MSR positively influences port performance [30,31,32]. Huang et al. conducted a macro-level evaluation of the relative operational efficiency of the top 50 ports along the MSR in terms of throughput, revealing that Chinese ports had higher overall efficiency, with Qingdao Port having the highest efficiency, followed by the rapid development of Ningbo–Zhoushan Port and Shanghai Yangshan Port [30]. Additionally, Zheng and Yang employed the DEA–game cross-efficiency model from a micro-level perspective to evaluate the efficiency of MSR ports in China. They further analyzed the internal and external factors influencing port efficiency using the Tobit model, finding that the MSR enhanced port efficiency. Port performance exhibited an inverted U-shaped relationship with the economic level of the hinterland [31]. On environmental benefits, two contrasting perspectives exist. One perspective argues that the MSR has significantly increased cargo throughput in coastal regions, prompting ports to adopt extensive operational practices focused solely on enhancing performance while neglecting environmental protection [33,34]. Conversely, a more widely accepted view holds that since the implementation of the MSR policy, numerous environmental protection initiatives, such as the “Ecological and Environmental Protection Cooperation Plan for the Belt and Road Initiative,” have been introduced, fostering green port development [35,36]. Zhao contends that high operational efficiency in ports not only brings greater economic benefits but also improves resource utilization, thereby enhancing environmental benefits [35]. As for the port–city synergy effect, the existing literature suggests that the MSR primarily fosters the coordinated development of port and urban economies through infrastructure connectivity and industrial collaboration [37,38].
Overall, there is a certain consensus in academia regarding the measurement methods for port efficiency, which provides ideas and inspiration for this paper to conduct port efficiency calculations. Regarding the policy effects of the MSR, from an economic interest perspective, although academia recognizes the significant role of MSR construction in port development, there is a lack of empirical studies that measure the extent of its impact on port efficiency. There is a scarcity of quantitative analyses on the impact of MSR construction on port efficiency, and research on its heterogeneity and mechanisms of influence is even more lacking. Therefore, we hope that the research in this paper can further refine and supplement the policy effects of the MSR.
3. Research Mechanism Hypothesis
The focus of the MSR strategy is to improve the shipping service network between regions along the route, enhance the level of port services, and achieve interconnectivity [39]. In conjunction with the construction content and vision of the MSR, this study argues that the MSR primarily influences port efficiency through infrastructure, human capital, and industrialization.
3.1. Infrastructure Effect
The construction of the MSR can improve infrastructure, thereby improving port efficiency. Infrastructure interconnectivity is essential to the MSR, and since its inception, China has experienced rapid infrastructure investment growth in the regions along the route, with substantial funding directed towards the transportation, energy supply, and communication sectors [40,41]. Numerous studies have confirmed the role of infrastructure development in promoting port efficiency. Optimizing transportation infrastructure, such as roads and railways, and developing multimodal transport can accelerate the transportation speed of goods from ports to inland destinations, attracting shippers, reducing excessive competition, and enhancing overall throughput efficiency [35,42,43]. From a social development perspective, the quality of port infrastructure is crucial to operational efficiency [35]. high-quality port facilities can attract ships and cargo, facilitate aggregation, and enable scaled operations with strong wharf berthing capacity, thus enhancing port operational efficiency [44]. In addition to the traditional infrastructure’s empowerment of port efficiency, Chinese ports are also gradually building a “smart port system,” advancing the construction of infrastructure for Internet of Things (IoT) ports and internet-enabled port customs. These efforts utilize intelligent technologies and digitalization to expand port supply and industry chains, improving port logistics services [45,46].
3.2. Human Capital Effect
The MSR can optimize human capital structures, thereby improving port efficiency. Talent is a key force and an important support for the construction of the MSR. The “Belt and Road” initiative facilitates optimal resource allocation across regions and promotes talent mobility along the route [47]. Since its proposal, the initiative has prompted the issuance of policy documents by the Party and state to attract talent to port areas along the route, making the “cultivation of port and shipping logistics professionals” a significant task of the MSR. Human capital significantly promotes the total factor productivity of ports. At the micro-level, talent is the foundation of enterprise development. Human capital is an important factor influencing labor productivity and can directly or indirectly affect the total factor productivity of enterprises [48,49,50,51]. For example, effective management and a skilled workforce can markedly improve enterprise operational efficiency. At the macro level, the high-quality growth of regional economies necessitates support from higher-education human capital [52].
3.3. Industrialization Effect
The MSR can elevate the development of port-adjacent industries, thereby improving port efficiency. China’s manufacturing industry is predominantly concentrated in coastal regions, and the MSR’s construction has enhanced interconnectivity between ports, streamlining the transportation of industrial finished products and raw materials and reducing transportation costs. Additionally, the “Belt and Road” initiative encourages the establishment of export-processing zones and other special customs-supervised areas near ports, aiming to elevate the level of the international processing trade. Export-processing zones leverage their role in leading industrial upgrading, using tax incentives and location advantages to attract enterprises to settle in the zones, forming a cluster of advanced manufacturing industries with international competitiveness [53] and accelerating industrialization. The existing research demonstrates that the level of industrialization significantly promotes port efficiency. For example, the rapid growth of industries adjacent to ports, through a siphoning effect, attracts greater industrial concentration, thereby increasing the demand for transporting raw materials and finished products. These industrial products and raw materials are the primary cargo sources for China’s coastal ports, directly stimulating the growth of port throughput [54,55]. Furthermore, with the diversification of industrial products, ports require extensive facilities and the construction of specialized terminals to meet the transportation needs of various industrial products [56], providing efficient and diverse logistics services, which further enhances port efficiency.
Based on the analysis above, we argue that the MSR enhances the efficiency of coastal ports in China through three main factors: infrastructure improvement, optimization of human capital, and enhancement of industrialization. Figure 1 illustrates the theoretical framework. Specifically, the MSR can foster infrastructure connectivity, accelerate cargo transshipment and handling speeds, and attract and cultivate higher education talent in the regions along the route. Additionally, it can promote the development of port-adjacent industries, thereby bringing more cargo sources to the port and increasing port throughput.
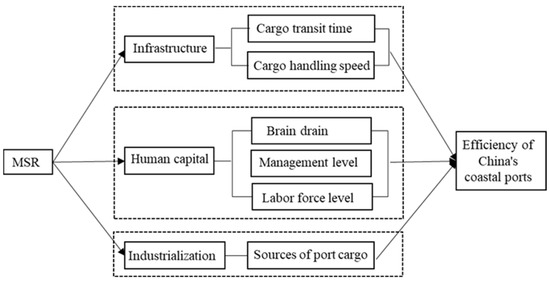
Figure 1.
Theoretical framework diagram.
Therefore, this paper proposes the following hypotheses:
Hypothesis H1:
the construction of the MSR can significantly enhance the efficiency of ports along the route.
Hypothesis H2:
the construction of the MSR primarily influences port efficiency through the levels of infrastructure, human capital, and industrialization.
4. Model Introduction and Variable Selection
4.1. Empirical Model Construction
4.1.1. Global Malmquist Index Model
The port efficiency studied in this paper takes into account the dynamic changes over time. The literature indicates that the DEA–Malmquist index model is widely employed to measure dynamic port efficiency. This model was initially proposed by Caves, which uses the Malmquist index from an input–output perspective to capture changes in productivity [57]. The change in productivity between period and + 1 is expressed as:
where is the distance index for period , representing the ratio of actual output to the maximum possible output under given conditions, and and represent the input and output for different time periods, respectively. To avoid subjectivity in selecting time periods when calculating the productivity index, Caves [57] employed the geometric mean method in the calculation of the Malmquist index:
where this index model reflects the change in the Malmquist index between two adjacent periods for a decision-making unit under constant returns to scale. Based on this, Fare et al. [58] decomposed the Malmquist index into the technological progress index and the technical efficiency change index:
As the DEA–Malmquist index continues to evolve, scholars have made further refinements to the original calculation methods. For example, Pastor and Lovell proposed the Global Malmquist index (GM), which uses the sum of all periods across all DMUs as the reference set for comparison and calculation. Compared to the traditional DEA model, which only performs horizontal comparisons among ports, this method’s advantage lies in its ability to conduct cross-period comparisons and circumvent issues of circularity and the indeterminacy of solutions in linear programming [59,60]. Since all decision-making units use the same global production frontier, the GM index can also be transferred and compounded. In this paper, we adopt Pastor and Lovell’s definition of the GM index [61]; the specific formula is as follows:
where denotes the change in total factor productivity for the kth DMU from period to period . and are the output distance functions based on the individual and global production frontiers, respectively, and EC and BPC represent efficiency change and technological change, respectively.
4.1.2. DID Model
A simple regression analysis cannot fully account for omitted variables and reverse causality, which makes it difficult to address endogeneity issues effectively and potentially affects the accuracy of empirical results [62]. The core idea of the DID model is to treat policy implementation as a quasi-natural experiment that can maximize the avoidance of potential endogeneity problems. The DID model is now widely used in economics for causal inference. It assesses the causal effects of policies by comparing the changes between the treatment and control groups before and after policy implementation [63,64,65]. Therefore, this study adopts the DID model to examine the impact of MSR construction on the efficiency of China’s coastal ports, and the constructed DID model is as follows:
where and represent the port and year, respectively, denotes port efficiency, is a policy dummy variable, which is assigned a value of 1 if the port is along the route, and 0 otherwise; and is a time dummy variable, set to 1 for the year of MSR policy implementation and subsequent years, and 0 otherwise. represents the difference in the impact of MSR construction between the treatment and control groups; represents a series of control variables. and represent individual and time-fixed effects, respectively, and is the random disturbance term. In this model, the main focus is on the core explanatory variable .
4.1.3. Mediation Effect Model
To gain a deeper and more comprehensive understanding of the pathways through which the MSR policy enhances port efficiency, it is essential to verify the transmission mechanism using a mediation effect model. Many previous scholars have constructed mediation effect models using Baron and Kenny’s three-step method [66]. However, this approach has been criticized by Jiang, who pointed out that this model suffers from significant endogeneity issues and may reduce statistical significance [67]. Therefore, we draw upon the research of Jiang and Du et al. [67,68] and construct Model (6) to directly identify the impact of the core explanatory variable on the mediating variable and test for the presence of a mediation effect. represents the mediating variable, with the remaining parameters having the same definitions as those set in Equation (5). The formula is as follows:
where the primary focus is on the sign and significance level of the coefficient . If coefficient is significantly positive, it indicates that the interaction term influences TFP through the mediating variable. As for the causal relationship between the mediating variable and the dependent variable, it can be explained by existing theories and the literature, without the need for further empirical validation.
4.2. Data Sources
To ensure the accuracy of the DEA measurement results, DMUs must satisfy the homogeneity requirement [69]. Therefore, this study primarily adopts the following two methods to select the research subjects. (1) Ports are classified into coastal ports and inland river ports, which differ in geographical location, functional positioning, and operational characteristics. Coastal ports handle the import and export of international trade cargo and have an advantage in cargo throughput. Therefore, the research sample in this paper excludes inland river ports. (2) As ports in different regions vary in scale and quantity, potentially exerting heterogeneous impacts on port efficiency measurement, we selected major coastal ports as the subjects of our study. In summary, this study selects 27 major coastal ports from 2011 to 2022 as the research sample. The treatment group consists of 14 out of the 15 coastal ports mentioned in the “Vision and Actions” document (Sanya Port, in line with the “three-port separation” strategic plan, no longer undertakes cargo functions). The control group includes other ports with similar scales and greater throughput, as shown in Table 1. Moreover, the ports selected for both groups are major ports in China, with similar operational scales and cargo throughput, ensuring that the relevant indicators exhibit comparable trends prior to the policy intervention.

Table 1.
Sample Ports.
The data sources for this study are the China City Yearbook, the China Port Yearbook, the Cathay Pacific Database, and the Prospect Database. To ensure data consistency, the input–output indicators for the ports mainly come from the China Port Yearbook. However, there are instances where certain ports did not disclose relevant data for specific years, in which case we employed interpolation methods to fill the gaps. Similarly, for other data, we made every effort to ensure that they originated from the same data sources.
4.3. Variable Definitions
4.3.1. Dependent Variable
The dependent variable in this study is port efficiency. Following the research approach in the existing literature, input indicators are selected as the length of production piers, the number of production berths, and the number of 10,000-ton class berths [8,70], while the output indicators are chosen as cargo throughput and container throughput [44,71,72]. These indicators are used to calculate the transitive GM index using the software Dearun 3.2. Since the method calculates the result as the rate of change of TFP, the cumulative multiplication of the GM index needs to be processed when performing the model regression. Following the approach of Wang et al., we set the year 2010 as the base period with a value of one. Therefore, the TFP for 2011 is calculated as the value for 2010 multiplied by the global GM index for 2011, and so on, to obtain the TFP for the years 2011–2022, adjusted to the base year of 2010 [73].
We utilized MATLAB 2020b software to generate a 3D kernel density plot (Figure 2), thereby illustrating the distribution pattern of efficiency across China’s coastal ports. Due to a sudden and significant increase in cargo throughput at Dandong Port in 2013, which caused the efficiency distribution to deviate from other data points, we applied a scaling adjustment to minimize distortion in the kernel density estimation. The kernel density of port efficiency is shown in Figure 2. (1) Observing the distribution of the kernel density curve over time, it is evident that the curve for coastal port efficiency shifts significantly to the right. Initially, the curve shifts leftward and then rightward, indicating a decline in TFP followed by a steady increase. This suggests that the efficiency of China’s coastal ports has generally exhibited an upward trend. (2) Regarding the shape of the main peak in the distribution, the height of the peak gradually decreases, reflecting a trend from “steep to flat”. Before 2015, the peak was relatively steep, indicating that the differences in efficiency among the coastal ports during this period were comparatively small. After 2015, the peak became flatter, and the width of the peak noticeably increased, suggesting that the differences in efficiency among the coastal ports have gradually widened after 2015. This may be due to the national strategy of the MSR, which provided policy support to ports along the route. These ports have led the development in a high-quality and intensive direction, thereby causing regional differences to gradually emerge. (3) In terms of the number of peaks, the curves maintain a unimodal shape, indicating that the distribution of efficiency among China’s coastal ports has not yet exhibited signs of polarization.
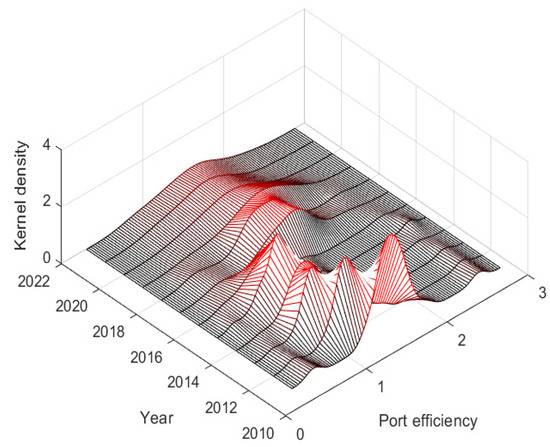
Figure 2.
Kernel density plot of port efficiency.
4.3.2. Core Explanatory Variables
In this study, the interaction term between the policy dummy variable for being an MSR port (Treat) and the time dummy variable (Post) serves as the core explanatory variable. The policy dummy variable and the time dummy variable are defined as follows. On one hand, the “Vision and Actions” document explicitly calls for the strengthening of construction at coastal ports, such as Shanghai, Tianjin, and Ningbo–Zhoushan. Therefore, we select the ports mentioned in the document as the treatment group, with the corresponding Treat value set to one, while the remaining ports are the control group, with the corresponding Treat value set to zero. On the other hand, the policy document was released in March 2015. Hence, the years 2015 and beyond are considered the policy implementation period, with Post assigned a value of one, while the years prior to 2015 are regarded as the pre-policy period, with Post assigned a value of zero.
4.3.3. Control Variables
Considering that the government’s selection of MSR ports involves a comprehensive assessment of local economic conditions, geographical location, and population size, it is necessary to introduce appropriate control variables during the model-building process to ensure model accuracy and avoid multicollinearity issues caused by an excessive number of variables. Based on previous research, five control variables that may have an impact are selected, including foreign direct investment level (fdi), degree of openness to foreign trade (open), per capita GDP (lnagdp), population density (pdensity), and industrial structure (ind). The specific variable settings and descriptive statistics are presented in Table 2.
Table 2.
Variable settings and descriptive statistics.
5. Empirical Results and Analysis
5.1. Benchmark Regression
We used Stata 17 software to perform a benchmark regression. The regression results in Table 3 quantify the effect of MSR construction on port efficiency. To mitigate the influence of unique individual and time-specific characteristics on the regression results, this study includes both individual and time-fixed effects in the baseline model. In the regression results shown in Table 3, only the core explanatory variables are included in column (1). It is evident that the coefficient for Treat × Post is significantly positive at the 1% level. In column (2), a series of relevant control variables are added, and the coefficient for Treat × Post remains significantly positive at the 1% level, suggesting that MSR construction is an effective strategy for enhancing port efficiency, thus validating Hypothesis H1.
Table 3.
Benchmark regression results.
The regression results of the control variables in column (2) of Table 3 show that the estimated coefficients for fdi and open are significantly positive at the 10% level. Although the significance level is relatively weak, this suggests that increased foreign direct investment and greater openness contribute to improving port efficiency. Furthermore, the estimated coefficients for lnpgdp and pdensity are significantly positive at the 5% and 1% levels, respectively, indicating a stronger effect. This suggests that increases in per capita GDP and regional population density effectively promote port efficiency. The study also indicates that the control variable ind has no significant impact on port efficiency, implying that the rise of the service sector may crowd out the development of primary and secondary industries, thereby reducing the local demand for port services and weakening the radiating influence of the port’s hinterland cities.
5.2. Parallel Trend Test
A key assumption for applying the DID method is that the treatment and control groups must satisfy the parallel trend assumption, meaning that ports along the MSR and those not on the route should exhibit similar trends prior to policy implementation. Therefore, this study conducted a parallel trend test using the event study methodology [74]. Figure 3 presents the parallel trend test results. The policy implementation window spans four years before and six years after MSR construction. The horizontal axis represents the years before and after MSR implementation. For example, “pre − 2” refers to the second year before MSR implementation, “post − 2” refers to the second year after MSR implementation, and “current” refers to the year of MSR implementation (2015). To avoid multicollinearity, the baseline period (2014) is set to the year before the policy implementation.
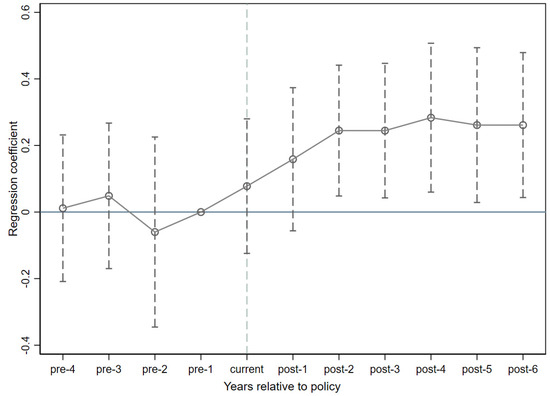
Figure 3.
Parallel trend test. Note: “pre − 1” represents the baseline period, specifically the year 2014.
As shown in Figure 3, the confidence intervals for the effect values before policy implementation all include zero, indicating that there are no significant differences between the treatment and control groups prior to the MSR policy implementation, thus satisfying the parallel trend assumption. After policy implementation, considering the time lag, the confidence interval of its effect becomes greater than zero starting from the second year, showing a significant difference between the experimental and control groups. This suggests that the empirical study satisfies the parallel trend assumption, indicating that the trends of change in both groups before policy implementation were consistent.
5.3. Placebo Test
To eliminate the influence of random factors on the MSR policy effect, we conducted a placebo test [75]. The method involved randomly selecting ports as the “pseudo-treatment group” and designating the remaining ports as the “pseudo-control group”. We then applied the benchmark regression model (5) 500 times, generating 500 estimated coefficients and p-values for the impact of non-actual policy dummies. The results in Figure 4 show that the estimated coefficients for the dummy policies are close to zero, significantly different from the actual regression coefficient (0.192), with most p-values above 0.1, indicating that most simulated coefficients are not statistically significant. These results confirm that the positive impact of the MSR on port efficiency is not driven by random factors, further supporting the robustness of the benchmark regression.
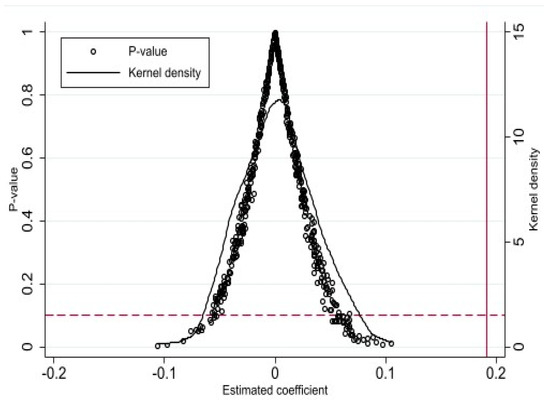
Figure 4.
Placebo test.
5.4. Endogeneity Test: Instrumental Variables Approach
Given that the selection of ports along the MSR may not be random, a potential endogeneity issue arises. Following the methodology of Liu and Meng, we use ports along the “Ancient Maritime Silk Road” as an instrumental variable for testing [76]. This instrumental variable theoretically satisfies the two basic conditions for a valid instrument variable selection. On one hand, one of the main objectives of constructing the MSR is to revive the “Ancient Maritime Silk Road”. Therefore, there is a significant overlap between ports on the modern Maritime Silk Road and those on the ancient route, indicating a strong correlation. On the other hand, the “Ancient Maritime Silk Road” dates back to the Qin and Han dynasties, and from a temporal perspective, it cannot directly influence modern port efficiency except through its impact on the MSR, thus satisfying the “exclusivity restriction”. This paper employs the two-stage least squares (2SLS) method for estimation purposes. Initially, an instrumental variable (IV) is set, where the ports along the “Ancient Maritime Silk Road” are assigned an IV value of one, and non-alongside ports are assigned an IV value of zero. In the benchmark model (5), since Treat is present in the form of an interaction term, the endogenous variable is Treat × Post, and the corresponding instrumental variable is IV × Post. The first-stage model is specified as follows:
Table 4 reports the results of the 2SLS estimation. The coefficient in column (1) is 0.695, which is significant at the 1% level, indicating a strong positive correlation between the instrumental variable IV and the policy dummy variable Treat × Post. The Kleibergen–Paap rk LM statistic is significant at the 1% level, and the Kleibergen–Paap rk Wald F statistic exceeds the critical value of 16.38, passing both the over-identifying restriction test and the weak instrument test and suggesting that the choice of instrumental variable is appropriate. The coefficient for Treat × Post in column (2) is 0.348, which is significant at the 1% level, indicating that, after accounting for endogeneity, the construction of the MSR still has a promoting effect on port efficiency, further supporting the research conclusions presented earlier.
Table 4.
Instrumental variable regression results.
5.5. Robustness Test
5.5.1. Tail Trimming of Extreme Values
In view of the fact that some ports may be influenced by major events in individual years, resulting in large changes in port throughput, port efficiency measured using the GM index contains extreme outliers, affecting the results of the study. Based on this, this study adopts the 1% quantile shrinkage method to deal with port efficiency data. The results are presented in column (1) of Table 5, where the coefficient of Treat × Post is significantly positive, confirming the previous findings of this paper.
Table 5.
Robustness Checks.
5.5.2. Shortening the Sample Period
The global outbreak of the COVID-19 pandemic from 2020 to 2022 severely impacted global trade and the economy. Given that ports are major channels for international trade, it is inevitable that their business volumes were also affected by the pandemic. As shown in the 3D kernel density plot (Figure 2) in Section 4.3.1, starting from 2020, the kernel density curve shifted leftward, indicating a general decline in port efficiency. However, the magnitude of the shift is relatively small, suggesting that, although port efficiency decreased during the COVID-19 pandemic, the decline was not significant. Considering that abnormal fluctuations in port efficiency during the pandemic may affect the stability of the research results, the sample period was shortened by excluding the data from 2020 to 2022 and conducting the benchmark regression. The regression results in column (2) of Table 5 indicate that the coefficient for Treat × Post remains significantly positive, further demonstrating the stability of the research conclusions presented in this paper.
5.5.3. Excluding Municipalities
Municipalities directly under the central government often possess greater industrial resources and have policy advantages due to their unique status, giving them a comparative advantage in policy implementation. This may introduce bias in measuring the effects of the MSR policy. Thus, these municipalities are excluded from the sample before conducting the benchmark regression. Column (3) of Table 5 reports the regression results, and it can be found that the coefficient of Treat × Post is still significantly positive, which again supports the research conclusion.
5.5.4. Excluding Interference from Other Policies
To further ensure the robustness of the empirical results, we reviewed other relevant policies and found that the establishment of a “Free Trade Zone” (FTZ) and the opening of the “China-Europe Railway Express” (CR Express) might affect port efficiency. Building on this, we followed the methodologies of previous studies [77,78] and sequentially introduced dummy variables for the CR Express and FTZ (as interaction terms of policy dummy variables and time dummy variables) into the benchmark model (5). As shown in columns (2)–(4) of Table 6, the estimated coefficient of the core explanatory variable Treat × Post remains significantly positive at the 5% level, but the magnitude of the estimated coefficient is somewhat reduced compared to the benchmark results. This indicates that although other policies may influence port development, the promoting effect of the MSR policy on port efficiency is still very robust.
Table 6.
Accounting for interference from other policies.
6. Further Analysis
6.1. Heterogeneity Analysis
6.1.1. Regional Heterogeneity
Previous research has indicated that the construction of the MSR has a significant positive effect on port efficiency. However, due to variations in economic scale, foreign trade, and industrial agglomeration among different coastal ports, the impact of the MSR policy may exhibit spatial heterogeneity across regions. This study categorizes ports into southern and northern regions and conducts a heterogeneity analysis across these areas. The results in columns (1)–(2) of Table 7 show that the coefficient for Treat × Post in southern ports is significantly positive at the 1% level, while the coefficient for northern ports is positive but not statistically significant. This suggests that the MSR policy has a more pronounced effect on southern ports. The reasons for this may include, first, the superior geographic location and a higher degree of openness in southern regions, which contribute to faster port development. Second, China’s main partners in the MSR are ASEAN countries in Southeast Asia, with whom bilateral trade has been growing steadily in recent years. Ports, as vital logistics hubs for international trade, have seen increasing business volumes due to trade growth, particularly in southern ports.
Table 7.
Heterogeneity Analysis.
6.1.2. Urban Size Heterogeneity
Larger cities tend to attract more talent and foster industrial aggregation, which may contribute to differences in port efficiency across cities of varying sizes. This study adopts the “Notice on Adjusting the Standards for Urban Scale Classification” issued by the State Council as a reference, following the approach of Qifei et al., and uses a threshold of 3 million permanent urban residents to distinguish between large cities and medium and small cities [79]. The results shown in columns (3)–(4) of Table 7 indicate that the coefficient for Treat × Post in large cities is 0.377, which is significant at the 1% level, while the coefficient for medium and small cities is positive but not statistically significant. This suggests that the MSR is more effective in enhancing the efficiency of ports in larger cities. The reason may be that larger ports, with their extensive economic hinterlands, possess more comprehensive infrastructure and social welfare, attracting substantial talent, resources, and capital, which promote the aggregation and development of industries such as logistics and trade, thus leading to a better response to the MSR policy.
6.2. Examination of Influencing Mechanisms
To gain a comprehensive understanding of how MSR policy improves port efficiency, this paper examines three key mechanisms of influence, namely human capital, industrialization, and infrastructure, using a mediation effect model. The impact of these mediating variables on port efficiency is supported by the extensive literature reviewed in the theoretical section of this paper. The mediating variables are measured as follows: human capital is represented by the ratio of undergraduate and junior college students to the total population; industrialization is measured by the share of industrial added value in GDP; and infrastructure is quantified by the ratio of fixed-asset investment to GDP. The results of this analysis are presented in Table 8.
Table 8.
Test of influencing mechanisms.
In Column (1) of Table 8, the coefficient for Treat × Post is significantly positive at the 1% level, indicating that the MSR has attracted a considerable pool of talent to port cities along its route through welfare measures, thereby optimizing the human capital structure and promoting port development. Column (2) shows a similarly significant positive coefficient for Treat × Post at the 1% level, suggesting that the MSR has effectively stimulated industrial development in port areas, thereby increasing port business volume and efficiency. Column (3) also exhibits a significantly positive Treat × Post coefficient at the 1% level, demonstrating that the MSR has facilitated the attraction of fixed-asset investment and an improvement of the infrastructure along its path, thereby enhancing the port’s transportation and loading/unloading efficiency.
7. Conclusions and Policy Implications
7.1. Conclusions
Based on panel data from 27 major coastal ports in China spanning from 2011 to 2022, this study uses a DID model to examine the impact of MSR construction on port efficiency, along with a heterogeneity analysis and tests of the influencing mechanisms. The main conclusions are as follows. First, the results from the three-dimensional kernel density map show that the efficiency of China’s coastal ports has been generally rising. However, over time, the disparity in port efficiency has gradually increased. Second, the DID model estimation results indicate that MSR construction has significantly enhanced the efficiency of ports along its route. This conclusion holds even after robustness tests using various methods, including placebo tests, instrumental variable estimation, and the exclusion of interference from other policies. Third, the heterogeneity analysis reveals that the impact of MSR construction on port efficiency varies significantly across regions and cities of different sizes, with southern ports and those in large cities experiencing a more pronounced efficiency boost. Fourth, the mechanism test shows that the MSR policy primarily influences port efficiency by promoting infrastructure development, enhancing human capital through talent exchange, and increasing industrialization levels. The greater the progress in these three areas, the more effective the policy implementation.
7.2. Policy Implications
On the one hand, from the perspective of port production and operation, ports should strive to balance improving efficiency with expanding operational scale while accelerating sustainable development. (1) Building on economic efficiency theory and the DEA–Malmquist measurement results, ports must first enhance resource utilization to reduce operating costs and improve logistics efficiency, thereby promoting sustainable development. They must strengthen the integration and management of resources and realize the effective allocation of port resources by optimizing port layout and reasonably allocating shoreline resources. (2) Economies of scale in port operations are an important driving factor of port efficiency [80]. However, based on the heterogeneity analysis, ports should focus on their strategic positioning and local economic development, expanding port scale in a way that suits local conditions to avoid the congestion issues faced by European and U.S. ports.
On the other hand, from the perspective of the MRS policy, the impact mechanism analysis shows that the MSR primarily affects port efficiency through three pathways: infrastructure, human capital, and industrialization levels. Therefore, the government should enhance policy support and guidance in these areas, ensuring that policies are continuous and stable [81], thereby providing a lasting source of momentum for the sustainable development of ports along the route. (1) To enhance port efficiency, the government should increase infrastructure investment in the transportation and port sectors, optimize the multimodal transport system, improve connectivity between ports and inland areas, and promote a port-centered multimodal transport system to improve logistics efficiency. (2) It is necessary to strengthen talent training and recruitment. The government should enhance cooperation with higher education institutions, offer professional courses related to ports, and provide internships and practical training opportunities to foster the deep integration of “Industry-University-Research”. (3) Cargo throughput is still the key factor in determining port efficiency, so ports must never ignore the scale of cargo throughput. The government needs to optimize the business environment, as a favorable policy environment can attract more high-quality manufacturing enterprises to establish operations in the port-adjacent areas, thereby boosting port throughput.
It is widely recognized that the MSR is a central global strategy designed to enhance connectivity between Asia, Europe, and Africa [82]. While China is advancing the sustainable development of its domestic ports, it is also strategically planning and executing investments in the infrastructure of international ports along the MSR. For instance, with Chinese investments, Gwadar Port in Pakistan and Hambantota Port in Sri Lanka have rapidly transformed into key port hubs. There is no doubt that the MSR not only enhances the efficiency of China’s coastal ports but also fosters greater connectivity between China’s ports and international ports, thereby promoting regional trade in the future.
8. Limitations
This study has several limitations, which can be addressed in future research. First, in the assessment of port efficiency, due to data incompleteness and the challenges in data collection, this study only considered the relevant data of traditional equipment as input indicators. Future research should expand the input–output indicator system to include more factors that are comprehensive, such as the number of cranes, yard area, and employee count. Similarly, since the complete pollutant emissions from the port are not officially disclosed, this study mainly explored the economic effects of MSR on the port and did not consider the impact of the MSR on the port environment, a limitation that would be improved if we were able to collect data on relevant indicators in the future. Lastly, when examining the policy effects of the MRS on the efficiency of major coastal ports, the DID model used in this study accounts for temporal differences between the treatment and control groups but does not consider spillover effects to neighboring regions. To provide a more accurate and comprehensive policy evaluation, future research will extend the DID model by incorporating spatial dimensions, thus accounting for spatial dependence among the samples to overcome the limitations of the traditional DID approach.
Author Contributions
Conceptualization, S.H.; Methodology, Y.H. and G.X.; Software, S.H.; Formal analysis, S.H. and Y.H.; Investigation, G.X.; Resources, Y.H.; Writing – review & editing, S.H.; Visualization, G.X.; Supervision, S.H., Y.H. and G.X. All authors have read and agreed to the published version of the manuscript.
Funding
This research received no external funding.
Institutional Review Board Statement
Not applicable.
Informed Consent Statement
Not applicable.
Data Availability Statement
Data are contained within the article.
Conflicts of Interest
The authors declare no conflict of interest.
References
- Ju, S.; Xie, J.; Tang, H. The impact of competition on operational efficiency of ports: Empirical evidence from Chinese coastal port-listed companies. Res. Transp. Bus. Manag. 2023, 46, 100939. [Google Scholar] [CrossRef]
- Pettit, S.J.; Beresford, A.K.C. Port development: From gateways to logistics hubs. Marit. Policy Manag. 2009, 36, 253–267. [Google Scholar] [CrossRef]
- Santos, A.M.P.; Salvador, R.; Dias, J.C.Q.; Soares, C.G. Assessment of port economic impacts on regional economy with a case study on the Port of Lisbon. Marit. Policy Manag. 2018, 45, 684–698. [Google Scholar] [CrossRef]
- Xie, F.; Wang, C.; Xu, L. Whether to invest in terminal efficiency: A perspective considering customer preference and capital constraint in competitive environment? Ocean Coast. Manag. 2021, 205, 105563. [Google Scholar] [CrossRef]
- Wang, J.J.; Ng, A.K.-Y.; Olivier, D. Port governance in China: A review of policies in an era of internationalizing port management practices. Transp. Policy 2003, 11, 237–250. [Google Scholar] [CrossRef]
- Guo, L.; Jiang, C. Optimal scale and capacity integration in a port cluster under demand uncertainty. Comput. Ind. Eng. 2022, 173, 108733. [Google Scholar] [CrossRef]
- Iris, Ç.; Lam, J.S.L. A review of energy efficiency in ports: Operational strategies, technologies and energy management systems. Renew. Sustain. Energy Rev. 2019, 112, 170–182. [Google Scholar] [CrossRef]
- Li, D.; Luan, W.; Pian, F. The Efficiency Measurement of Coastal Container Terminals in China. J. Transp. Syst. Eng. Inf. Technol. 2013, 13, 10–15. [Google Scholar] [CrossRef]
- Kaliszewski, A.; Kozłowski, A.; Dąbrowski, J.; Klimek, H. Key factors of container port competitiveness: A global shipping lines perspective. Mar. Policy 2020, 117, 103896. [Google Scholar] [CrossRef]
- Suárez-Alemán, A.; Trujillo, L.; Cullinane, K.P.B. Time at ports in short sea shipping: When timing is crucial. Marit. Econ. Logist. 2014, 16, 399–417. [Google Scholar] [CrossRef]
- Fan, X.; Yu, S. Empirical analysis on impact of logistics performance of Maritime Silk Road Economic Belt on China’s import and export trade. J. Xi’an Jiaotong Univ. 2015, 35, 13–20. Available online: https://link.cnki.net/doi/10.15896/j.xjtuskxb.201503003 (accessed on 6 July 2015).
- Chang, Y.-T.; Jo, A.; Choi, K.-S.; Lee, S. Port efficiency and international trade in China. Transp. A Transp. Sci. 2021, 17, 801–823. [Google Scholar] [CrossRef]
- Zhang, J.; Deng, S.; Kim, Y.; Zheng, X. A Comparative Analysis of Performance Efficiency for the Container Terminals in China and Korea. J. Mar. Sci. Eng. 2024, 12, 1568. [Google Scholar] [CrossRef]
- Suárez-Alemán, A.; Morales Sarriera, J.; Serebrisky, T.; Trujillo, L. When it comes to container port efficiency, are all developing regions equal? Transp. Res. Part A Policy Pract. 2016, 86, 56–77. [Google Scholar] [CrossRef]
- Ye, S.; Qi, X.; Xu, Y. Analyzing the relative efficiency of China’s Yangtze River port system. Marit. Econ. Logist. 2020, 22, 640–660. [Google Scholar] [CrossRef]
- Cullinane, K.; Wang, T.-F.; Song, D.-W.; Ji, P. The technical efficiency of container ports: Comparing data envelopment analysis and stochastic frontier analysis. Transp. Res. Part A Policy Pract. 2006, 40, 354–374. [Google Scholar] [CrossRef]
- Roll, Y.; Hayuth, Y. Port performance comparison applying data envelopment analysis (DEA). Marit. Policy Manag. 1993, 20, 153–161. [Google Scholar] [CrossRef]
- Tongzon, J. Efficiency measurement of selected Australian and other international ports using data envelopment analysis. Transp. Res. Part A Policy Pract. 2001, 35, 107–122. [Google Scholar] [CrossRef]
- Estache, A.; de la Fé, B.T.; Trujillo, L. Sources of efficiency gains in port reform: A DEA decomposition of a Malmquist TFP index for Mexico. Util. Policy 2004, 12, 221–230. [Google Scholar] [CrossRef]
- Pang, R. Dynamic evaluation of main sea ports in mainland China based on DEA model. Econ. Res. J. 2006, 41, 92–100. [Google Scholar]
- Yuen, A.; Zhang, A.; Cheung, W. Foreign participation and competition: A way to improve the container port efficiency in China? Transp. Res. Part A Policy Pract. 2013, 49, 220–231. [Google Scholar] [CrossRef]
- Pestana Barros, C. Productivity assessment of African seaports. Afr. Dev. Rev. 2012, 24, 67–78. [Google Scholar] [CrossRef]
- Guo, J.; Liang, M. The coupling characteristics of the shipping network and trade between China and the countries along the 21st Century Maritime Silk Road. Acta Geogr. Sin. 2022, 77, 1531–1545. [Google Scholar] [CrossRef]
- Jiang, B.; Li, J.; Gong, C. Maritime Shipping and Export Trade on “Maritime Silk Road”. Asian J. Shipp. Logist. 2018, 34, 83–90. [Google Scholar] [CrossRef]
- Xu, L.; Huang, J.; Chen, J. How does the initiative of 21st century maritime silk road incentive logistics development in China’s coastal region? Ocean Coast. Manag. 2023, 239, 106606. [Google Scholar] [CrossRef]
- Liu, J.; Wang, J.; Xu, C.; Jiang, J. Spatial and temporal change assessment of marine ecological security in regions along the Maritime Silk Road. Ecol. Indic. 2024, 166, 112576. [Google Scholar] [CrossRef]
- Qiu, H.; Chen, D.; Li, Q.; Peng, K.; Jenkins, C.L. Assessing the belt and road initiatives impact on tourism development in China: Insights from MOOCs learning platform. J. Hosp. Tour. Technol. 2021, 12, 641–657. [Google Scholar] [CrossRef]
- Zhao, L.; Hu, R.; Sun, C. Analyzing the spatial-temporal characteristics of the marine economic efficiency of countries along the Maritime Silk Road and the influencing factors. Ocean Coast. Manag. 2021, 204, 105517. [Google Scholar] [CrossRef]
- Alaaddin, C.; Lu, Y. The Impact of the “Belt and Road” Initiative on Tourism Economic Development in Chinese Regions along the Route—An Empirical Analysis Based on DID Model. Discret. Dyn. Nat. Soc. 2022, 2022, 2452529. [Google Scholar] [CrossRef]
- Huang, T.; Chen, Z.; Wang, S.; Jiang, D. Efficiency Evaluation of Key Ports along the 21st-Century Maritime Silk Road Based on the DEA–SCOR Model. Marit. Policy Manag. 2020, 48, 378–390. [Google Scholar] [CrossRef]
- Zheng, B.; Yang, H. Port efficiency evaluation of China’s coastal cities along the “One Belt and One Road”: Based on DEA Game Cross Efficiency-Tobit model. J. Appl. Stat. Manag. 2021, 40, 502–514. Available online: https://link.cnki.net/doi/10.13860/j.cnki.sltj.20210305-003 (accessed on 13 July 2021).
- Peng, P.; Yang, Y.; Lu, F.; Cheng, S.; Mou, N.; Yang, R. Modelling the competitiveness of the ports along the Maritime Silk Road with big data. Transp. Res. Part A Policy Pract. 2018, 118, 852–867. [Google Scholar] [CrossRef]
- Wang, C.; Haralambides, H.; Zhang, L. Sustainable port development: The role of Chinese seaports in the 21st century Maritime Silk Road. Int. J. Shipp. Transp. Logist. 2021, 13, 205–232. [Google Scholar] [CrossRef]
- Dong, G.; Zhu, J.; Li, J.; Wang, H.; Gajpal, Y. Evaluating the Environmental Performance and Operational Efficiency of Container Ports: An Application to the Maritime Silk Road. Int. J. Environ. Res. Public Health 2019, 16, 2226. [Google Scholar] [CrossRef] [PubMed]
- Zhao, C.; Wang, Y.; Gong, Y.; Brown, S.; Li, R. The evolution of the port network along the Maritime Silk Road: From a sustainable development perspective. Mar. Policy 2021, 126, 104426. [Google Scholar] [CrossRef]
- Shao, Y.; Shao, Y. Evaluation of Carbon Emission Efficiency of Major Ports along “the Belt and Road” in China. Econ. Probl. 2023, 5, 22–30. [Google Scholar]
- Gong, C.; Yang, X.; Liu, Y.; Xiong, H. China’s Port-Hinterland Coordinated Economic Development under ‘Maritime Silk Road’ Initiative. J. Coast. Res. 2020, 112, 465–471. [Google Scholar] [CrossRef]
- Xiong, Y.; Xu, Z. Research of interactive relationship between port development and urban economic development based on the key port city of Maritime Silk Road. Theory Pract. Financ. Econ. 2017, 38, 128–133. Available online: https://link.cnki.net/doi/10.16339/j.cnki.hdxbcjb.2017.01.020 (accessed on 13 February 2017).
- Celik, M.S. Determining maritime silk road strategies for ports along the route of belt and road initiative: A case of eastern Aegean ports. Res. Transp. Bus. Manag. 2023, 51, 101056. [Google Scholar] [CrossRef]
- Lam, J.S.L.; Cullinane, K.P.B.; Lee, P.T.W. The 21st-century Maritime Silk Road: Challenges and opportunities for transport management and practice. Transp. Rev. 2018, 38, 413–415. [Google Scholar] [CrossRef]
- Alves, A.C.; Gong, X.; Li, M. The BRI: A new development cooperation paradigm in the making? Unpacking China’s infrastructure cooperation along the Maritime Silk Road. World Dev. 2023, 169, 106280. [Google Scholar] [CrossRef]
- Song, Z.; Tang, W.; Zhao, R. A simple game theoretical analysis for incentivizing multi-modal transportation in freight supply chains. Eur. J. Oper. Res. 2020, 283, 152–165. [Google Scholar] [CrossRef]
- Xiao, G.; Tong, H.; Shu, Y.; Ni, A. Spatial-temporal load prediction of electric bus charging station based on S2TAT. Int. J. Electr. Power Energy Syst. 2025, 164, 110446. [Google Scholar] [CrossRef]
- Liu, J.; Wang, X.; Guo, J. Port efficiency and its influencing factors in the context of Pilot Free Trade Zones. Transp. Policy 2021, 105, 67–79. [Google Scholar] [CrossRef]
- Belcore, O.M.; Gangi, M.D.; Polimeni, A. Connected Vehicles and Digital Infrastructures: A Framework for Assessing the Port Efficiency. Sustainability 2023, 15, 8168. [Google Scholar] [CrossRef]
- Yau, K.L.A.; Peng, S.; Qadir, J.; Low, Y.C.; Ling, M.H. Towards Smart Port Infrastructures: Enhancing Port Activities Using Information and Communications Technology. IEEE Access 2020, 8, 83387–83404. [Google Scholar] [CrossRef]
- Rezaei, S.; Mouritzen, M.R. Talent flowscapes and circular mobility in a Belt and Road (BRI) perspective—Global talent flows revisited. Asian J. Soc. Sci. 2021, 49, 188–197. [Google Scholar] [CrossRef]
- Benhabib, J.; Spiegel, M.M. The role of human capital in economic development evidence from aggregate cross-country data. J. Monet. Econ. 1994, 34, 143–173. [Google Scholar] [CrossRef]
- Chowdhury, S.; Schulz, E.; Milner, M.; Van De Voort, D. Core employee based human capital and revenue productivity in small firms: An empirical investigation. J. Bus. Res. 2014, 67, 2473–2479. [Google Scholar] [CrossRef]
- Gao, L.; Sun, Q. Operation efficiency evaluation of listed port companies in China. J. Coast. Res. 2020, 111, 317–321. [Google Scholar] [CrossRef]
- Fleisher, B.; Li, H.; Zhao, M.Q. Human capital, economic growth, and regional inequality in China. J. Dev. Econ. 2010, 92, 215–231. [Google Scholar] [CrossRef]
- Zhang, Y.; Kumar, S.; Huang, X.; Yuan, Y. Human capital quality and the regional economic growth: Evidence from China. J. Asian Econ. 2023, 86, 101593. [Google Scholar] [CrossRef]
- Wu, W.; Hong, C. How processing trade assists local industrial upgrading: Input–output analysis of export processing zones in China. J. Ind. Bus. Econ. 2023, 50, 369–397. [Google Scholar] [CrossRef]
- Yap, W.Y.; Lam, J.S.L. 80 million-twenty-foot-equivalent-unit container port? Sustainability issues in port and coastal development. Ocean Coast. Manag. 2013, 71, 13–25. [Google Scholar] [CrossRef]
- Cong, L.; Zhang, D.; Wang, M.; Xu, H.; Li, L. The role of ports in the economic development of port cities: Panel evidence from China. Transp. Policy 2020, 90, 13–21. [Google Scholar] [CrossRef]
- Hidalgo-Gallego, S.; De La Fuente, M.; Mateo-Mantecón, I.; Coto-Millán, P. Does cargo specialization improve port technical efficiency? The paradigm of specialized infrastructure. Marit. Policy Manag. 2020, 47, 258–272. [Google Scholar] [CrossRef]
- Caves, D.W.; Christensen, L.R.; Diewert, W.E. The Economic Theory of Index Numbers and the Measurement of Input, Output, and Productivity. Econometrica 1982, 50, 1393–1414. [Google Scholar] [CrossRef]
- Färe, R.; Grosskopf, S.; Lindgren, B.; Roos, P. Productivity Developments in Swedish Hospitals: A Malmquist Output Index Approach. In Data Envelopment Analysis: Theory, Methodology, and Applications; Springer: Dordrecht, The Netherlands, 1994; pp. 253–272. [Google Scholar] [CrossRef]
- Ming, M.; Qu, D. Understanding the green energy efficiencies of provinces in China: A Super-SBM and GML analysis. Energy 2022, 239, 121912. [Google Scholar] [CrossRef]
- Cruz-Cázares, C.; Bayona-Sáez, C.; García-Marco, T. You can’t manage right what you can’t measure well: Technological innovation efficiency. Res. Policy 2013, 42, 1239–1250. [Google Scholar] [CrossRef]
- Pastor, J.T.; Lovell, C.A.K. A global Malmquist productivity index. Econ. Lett. 2005, 88, 266–271. [Google Scholar] [CrossRef]
- Bertrand, M.; Duflo, E.; Mullainathan, S. How Much Should We Trust Differences-In-Differences Estimates? Q. J. Econ. 2004, 119, 249–275. [Google Scholar] [CrossRef]
- Lin, B.; Du, Z. Can urban rail transit curb automobile energy consumption? Energy Policy 2017, 105, 120–127. [Google Scholar] [CrossRef]
- Pan, X.; Li, M.; Wang, M.; Zong, T.; Song, M. The effects of a Smart Logistics policy on carbon emissions in China: A difference-in-differences analysis. Transp. Res. Part E Logist. Transp. Rev. 2020, 137, 101939. [Google Scholar] [CrossRef]
- Li, Z.; Luo, T.; Li, J.; Tian, Y. Does social responsibility reform curb corporate greenwashing: Evidence from a quasi-natural experiment in China. Int. Rev. Financ. Anal. 2024, 96, 103623. [Google Scholar] [CrossRef]
- Baron, R.M.; Kenny, D.A. The moderator–mediator variable distinction in social psychological research: Conceptual, strategic, and statistical considerations. J. Personal. 1986, 51, 1173. [Google Scholar] [CrossRef]
- Jiang, T. Mediating effects and moderating effects in causal inference. China Ind. Econ. 2022, 5, 100–120. Available online: https://link.cnki.net/doi/10.19581/j.cnki.ciejournal.2022.05.005 (accessed on 14 June 2022).
- Du, Y.; Zhou, J.; Bai, J.; Cao, Y. Breaking the resource curse: The perspective of improving carbon emission efficiency based on digital infrastructure construction. Resour. Policy 2023, 85, 103842. [Google Scholar] [CrossRef]
- Dyson, R.G.; Allen, R.; Camanho, A.S.; Podinovski, V.V.; Sarrico, C.S.; Shale, E.A. Pitfalls and protocols in DEA. Eur. J. Oper. Res. 2001, 132, 245–259. [Google Scholar] [CrossRef]
- Krmac, E.; Mansouri Kaleibar, M. A comprehensive review of data envelopment analysis (DEA) methodology in port efficiency evaluation. Marit. Econ. Logist. 2023, 25, 817–881. [Google Scholar] [CrossRef]
- Song, Y.; Liu, H. Internet development, economic level, and port total factor productivity: An empirical study of Yangtze River ports. Int. J. Logist. Res. Appl. 2020, 23, 375–389. [Google Scholar] [CrossRef]
- Nguyen, H.O.; Nghiem, H.S.; Chang, Y.T. A regional perspective of port performance using metafrontier analysis: The case study of Vietnamese ports. Marit. Econ. Logist. 2018, 20, 112–130. [Google Scholar] [CrossRef]
- Wang, K.; Zhao, X.; Peng, B.; Zeng, Y. Can energy efficiency progress reduce PM2.5 concentration in China’s cities? Evidence from 105 key environmental protection cities in China, 2004–2015. J. Clean. Prod. 2021, 288, 125684. [Google Scholar] [CrossRef]
- Jacobson, L.S.; LaLonde, R.J.; Sullivan, D.G. Earnings losses of displaced workers. Am. Econ. Rev. 1993, 83, 685–709. Available online: https://www.jstor.org/stable/2117574 (accessed on 14 June 2022).
- Li, P.; Lu, Y.; Wang, J. Does flattening government improve economic performance? Evidence from China. J. Dev. Econ. 2016, 123, 18–37. [Google Scholar] [CrossRef]
- Liu, J.; Meng, H. Can China railway express enhance the economic-trade vitality of cities? A spatial empirical evidence from China. Transp. Policy 2024, 150, 121–138. [Google Scholar] [CrossRef]
- Jia, R.; Shao, S.; Yang, L. High-speed rail and CO2 emissions in urban China: A spatial difference-in-differences approach. Energy Econ. 2021, 99, 105271. [Google Scholar] [CrossRef]
- Liu, J.; Zhang, Z.; Chen, T. The impact of China railway express on foreign direct investment inflows in Chinese central and western cities. Heliyon 2024, 10, e30120. [Google Scholar] [CrossRef]
- Ma, Q.; Jia, P.; She, X.; Hercules, H.; Kuang, H. Port integration and regional economic development: Lessons from China. Transp. Policy 2021, 110, 430–439. [Google Scholar] [CrossRef]
- Pérez, I.; González, M.M.; Trujillo, L. Do specialisation and port size affect port efficiency? Evidence from cargo handling service in Spanish ports. Transp. Res. Part A Policy Pract. 2020, 138, 234–249. [Google Scholar] [CrossRef]
- Phan, D.H.B.; Iyke, B.N.; Sharma, S.S.; Affandi, Y. Economic policy uncertainty and financial stability–Is there a relation? Econ. Model. 2021, 94, 1018–1029. [Google Scholar] [CrossRef]
- Feng, L.; Li, X.; Ng, A.K.Y.; Jia, P.; Kuang, H.; Zhang, X. Can port systems be enhanced by government promotion? The case of port cooperation along the maritime silk road. Ocean Coast. Manag. 2023, 242, 106669. [Google Scholar] [CrossRef]
Disclaimer/Publisher’s Note: The statements, opinions and data contained in all publications are solely those of the individual author(s) and contributor(s) and not of MDPI and/or the editor(s). MDPI and/or the editor(s) disclaim responsibility for any injury to people or property resulting from any ideas, methods, instructions or products referred to in the content. |
© 2025 by the authors. Licensee MDPI, Basel, Switzerland. This article is an open access article distributed under the terms and conditions of the Creative Commons Attribution (CC BY) license (https://creativecommons.org/licenses/by/4.0/).