Sustainable Removal of Phenol from Aqueous Media by Activated Carbon Valorized from Polyethyleneterephthalate (PET) Plastic Waste

 , ,
, ,  ,
,  and
and 
Abstract
1. Introduction
2. Experimental Section
2.1. Materials
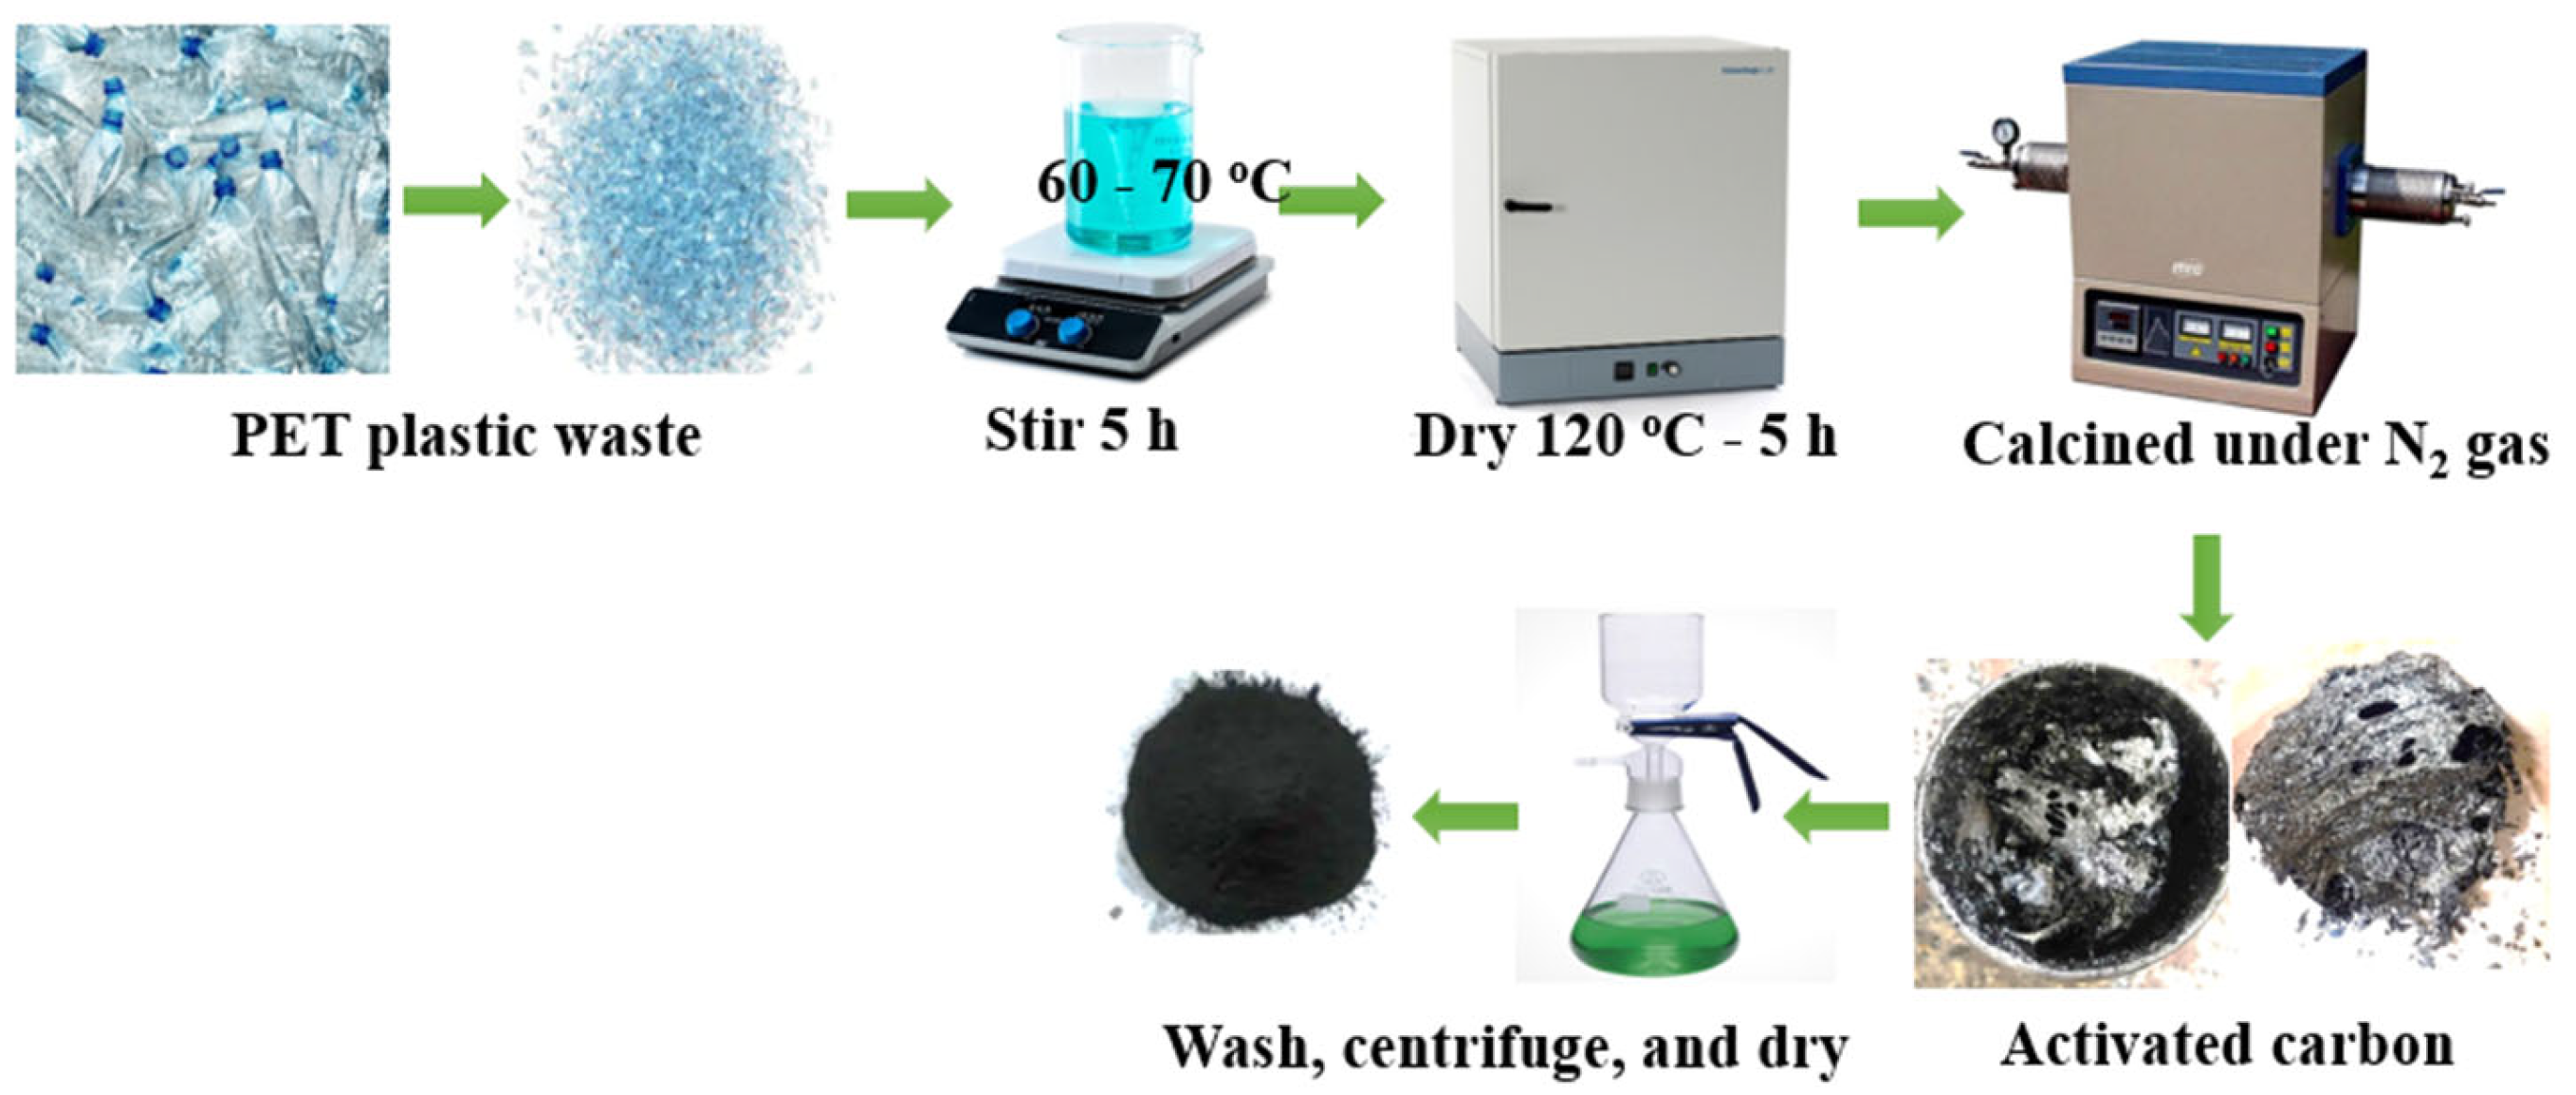
2.2. Preparation of Activated Carbon (AC)
2.3. The Point of Zero Charge (pHpzc)
2.4. Phenol Adsorption
2.5. Characterizations
3. Results and Discussion
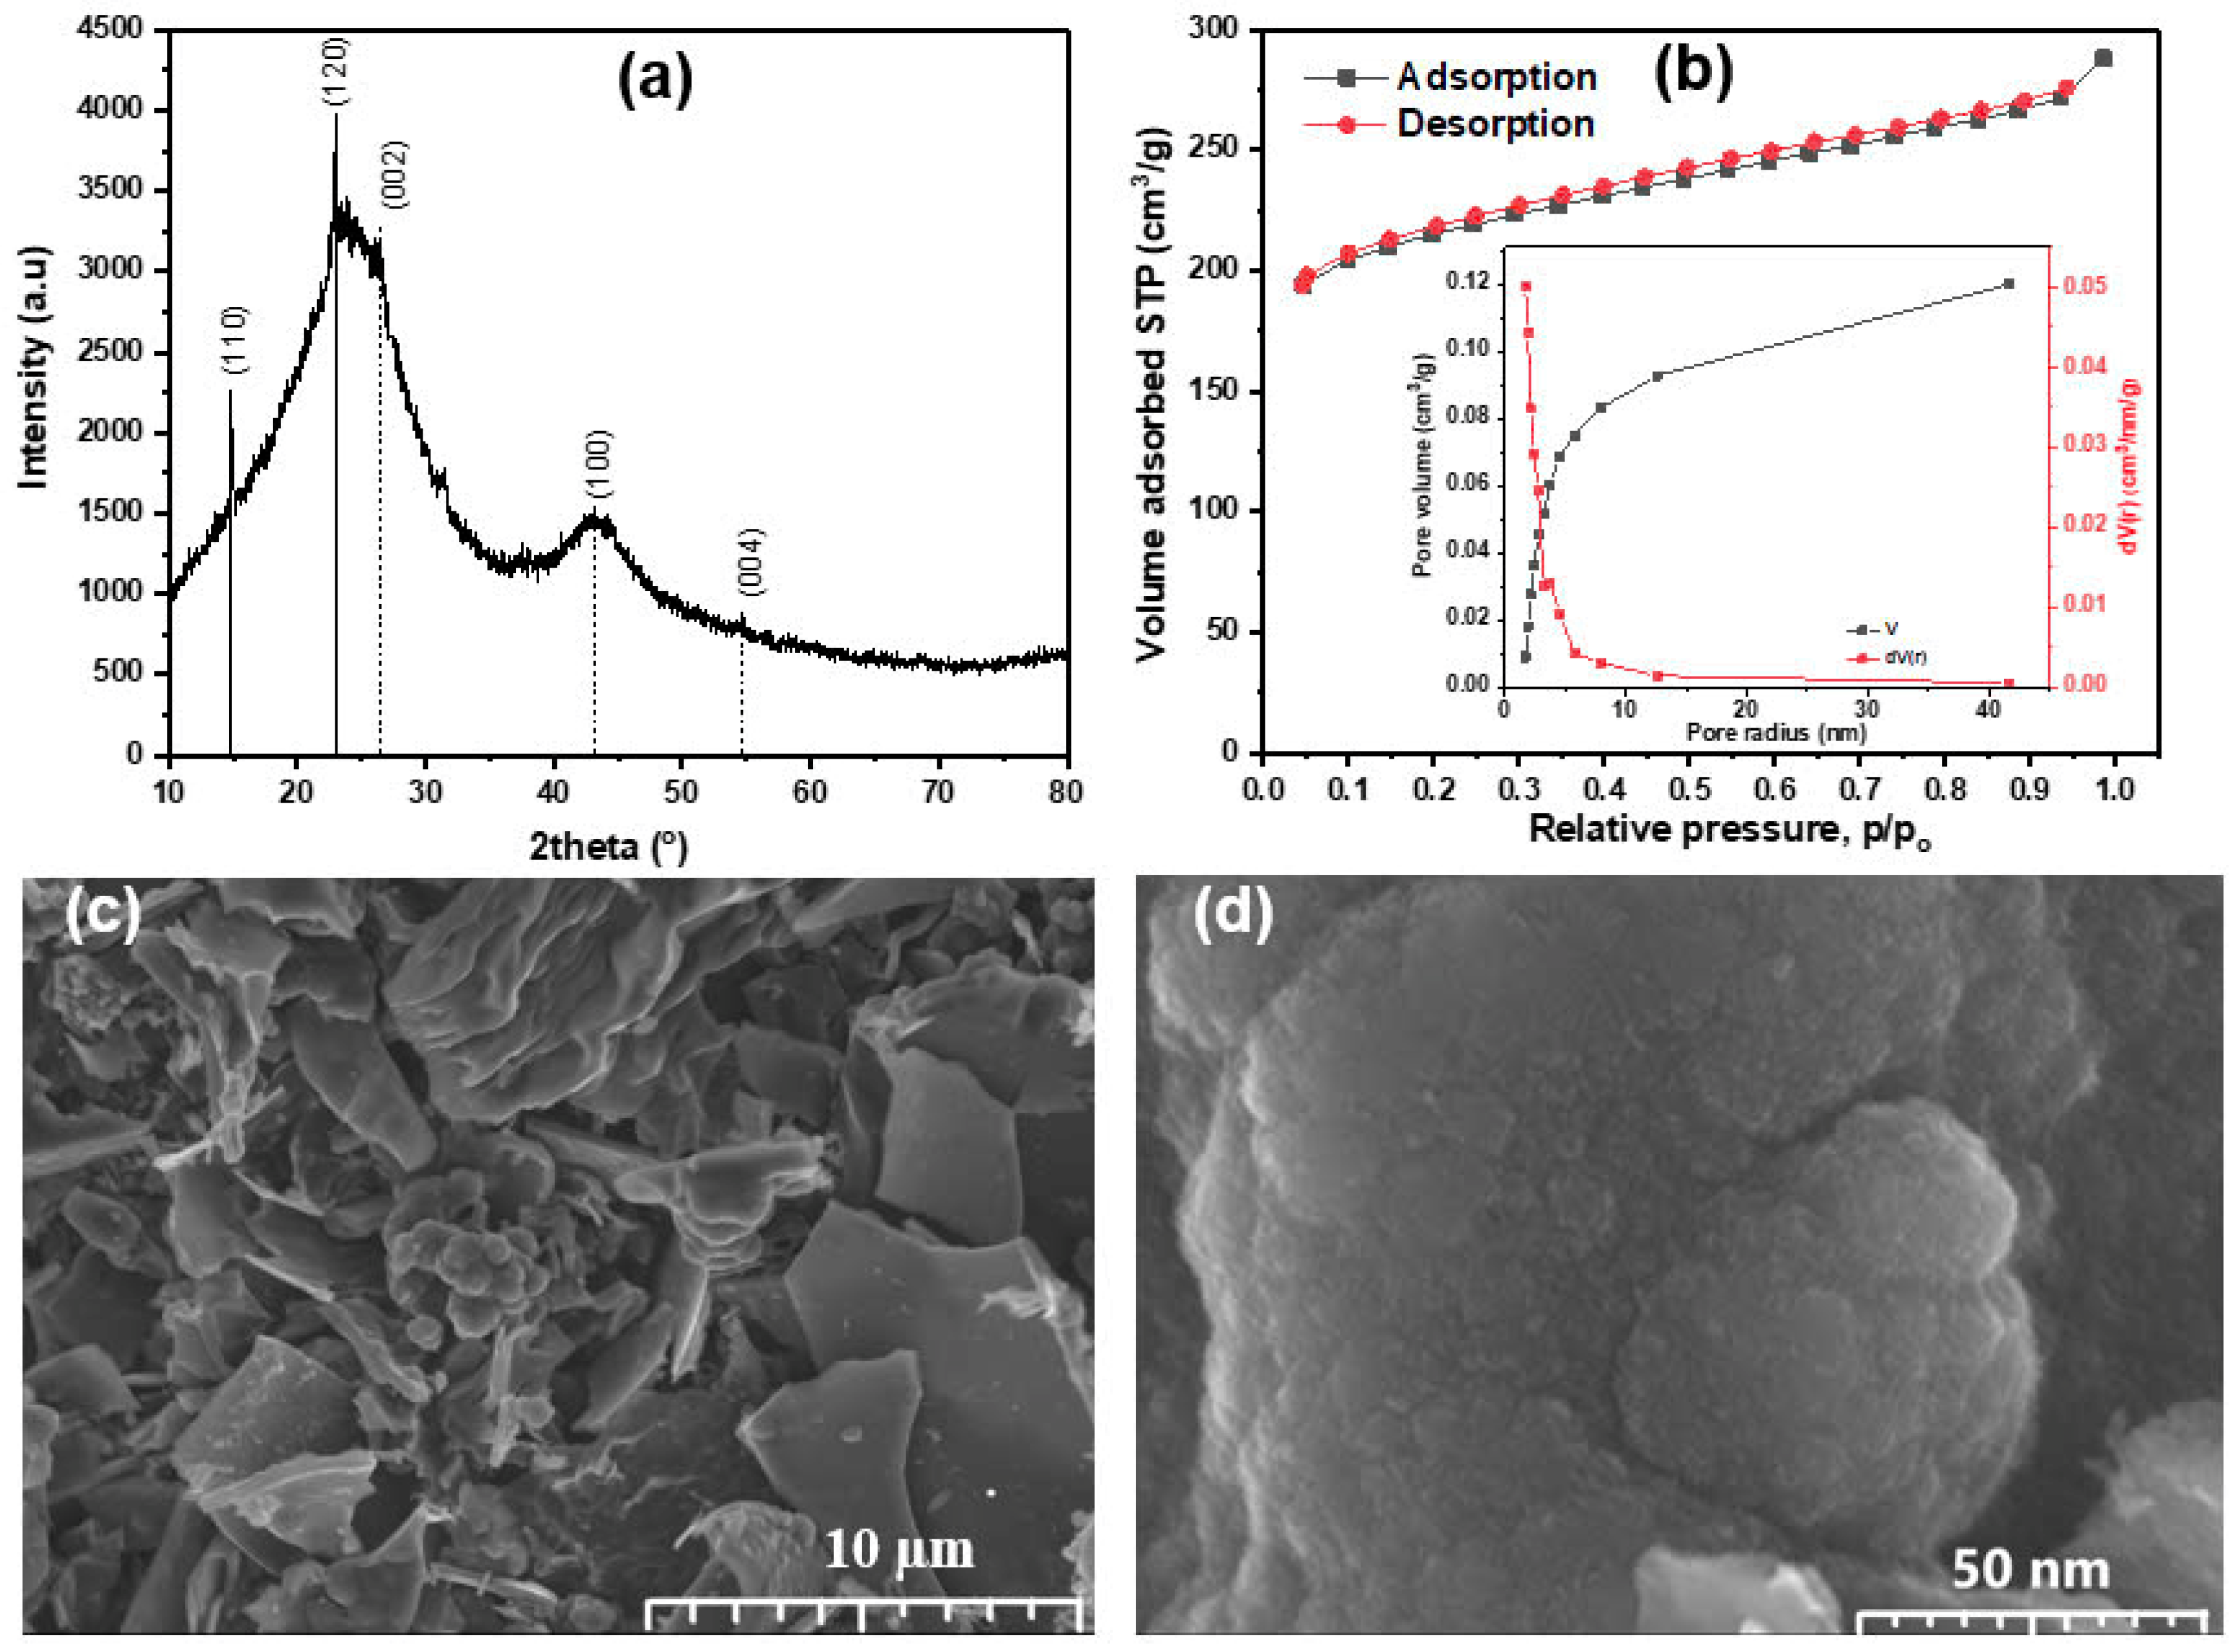
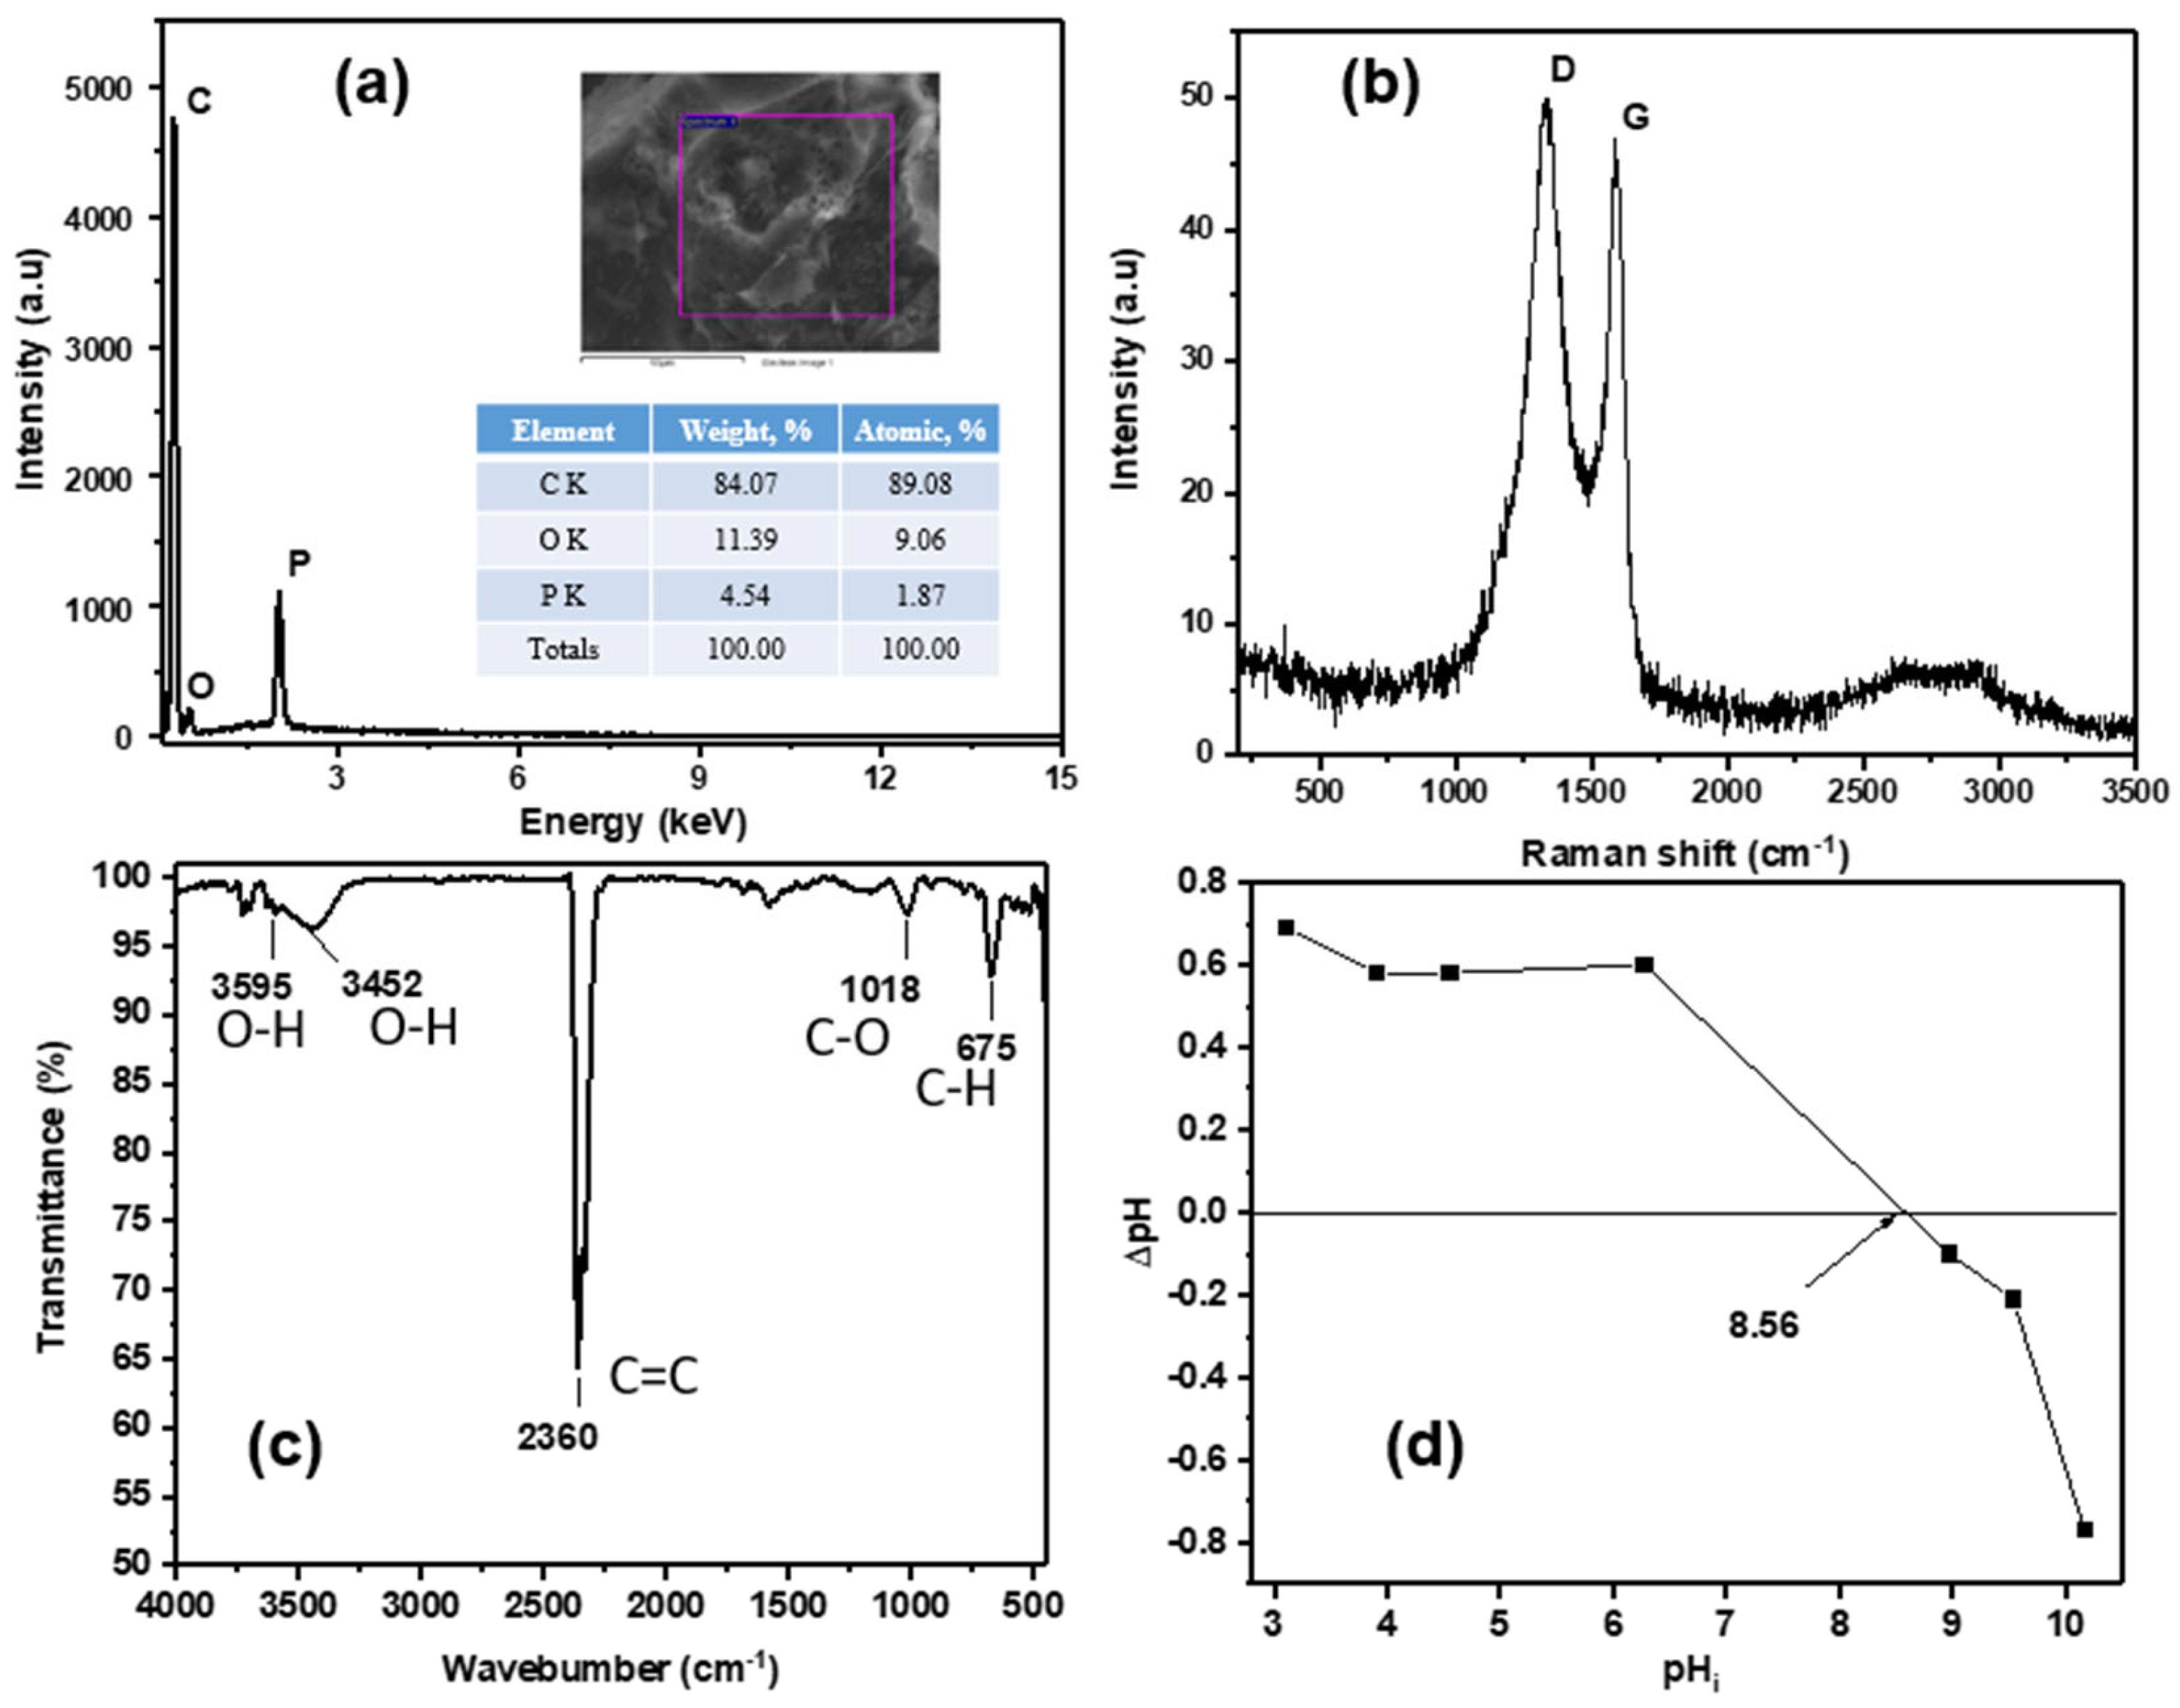
3.1. Characterizations of Activated Carbon
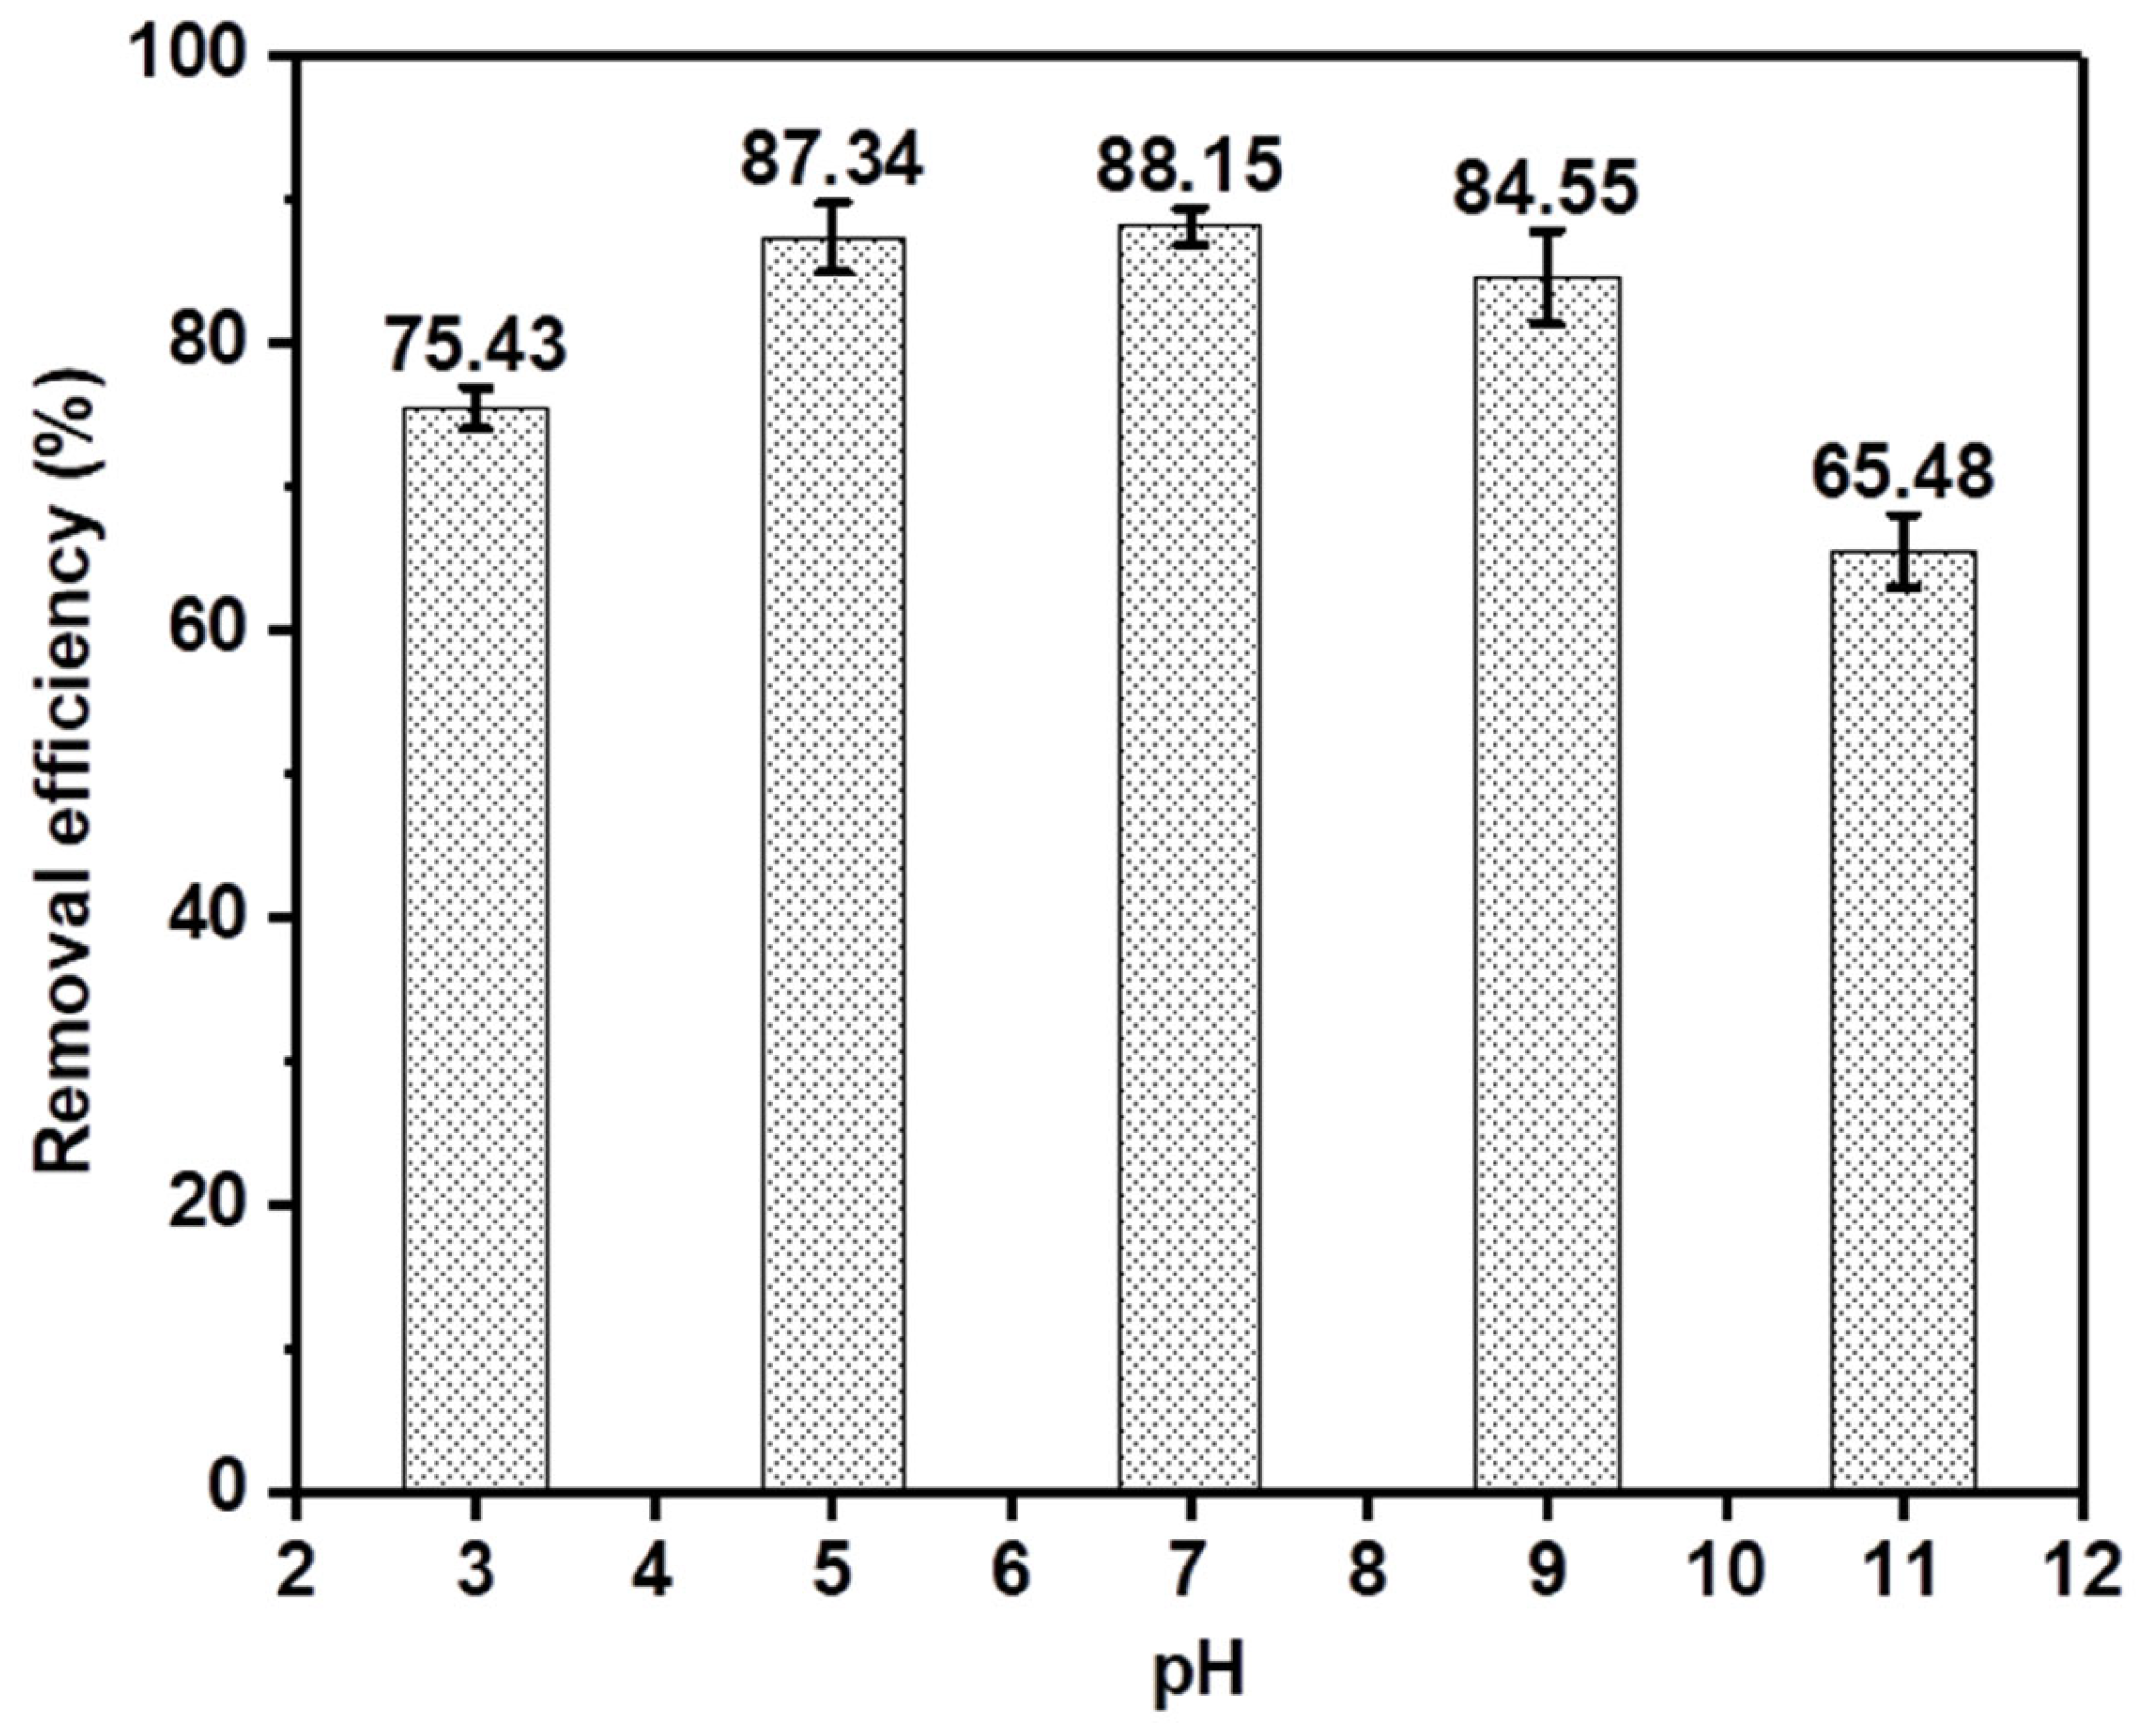
3.2. Phenol Adsorption
4. Conclusions
Author Contributions
Funding
Institutional Review Board Statement
Informed Consent Statement
Data Availability Statement
Conflicts of Interest
References
- Bastos, P.D.; Galinha, C.F.; Santos, M.A.; Carvalho, P.J.; Crespo, J.G. Predicting the concentration of hazardous phenolic compounds in refinery wastewater—A multivariate data analysis approach. Environ. Sci. Pollut. Res. 2022, 29, 1482–1490. [Google Scholar] [CrossRef] [PubMed]
- Perego, C.; de Angelis, A.; Pollesel, P.; Millini, R. Zeolite-based catalysis for phenol production. Ind. Eng. Chem. Res. 2021, 60, 6379–6402. [Google Scholar] [CrossRef]
- Biglari, H.; Afsharnia, M.; Alipour, V.; Khosravi, R.; Sharafi, K.; Mahvi, A.H. A review and investigation of the effect of nanophotocatalytic ozonation process for phenolic compound removal from real effluent of pulp and paper industry. Environ. Sci. Pollut. Res. 2017, 24, 4105–4116. [Google Scholar] [CrossRef] [PubMed]
- Li, Y.; Luo, H.; Ai, Q.; You, K.; Zhao, F.; Xiao, W. Efficient separation of phenols from coal tar with aqueous solution of amines by liquid-liquid extraction. Chin. J. Chem. Eng. 2021, 35, 180–188. [Google Scholar] [CrossRef]
- Kamin, Z.; Peter, E.; Bahrun, M.H.V.; Ken, C.C.; Battak, N.; Bono, A. Removal of Pesticides-Containing Phenolic Compounds Using Packed Bed Adsorption: A Short Review. AIP Conf. Proc. 2022, 2610, 050005. [Google Scholar]
- Xu, H.; Wang, T.; Zhou, Y.; Zhao, M.; Shi, W.; Huang, Z.; Ruan, W. Insights into the phenol disinfectant on the methane performance from wastewater by mesophilic anaerobic digestion: Single and two stages analysis. Process Saf. Environ. Prot. 2023, 170, 19–27. [Google Scholar] [CrossRef]
- Scott, K.A.; Cox, P.B.; Njardarson, J.T. Phenols in pharmaceuticals: Analysis of a recurring motif. J. Med. Chem. 2022, 65, 7044–7072. [Google Scholar] [CrossRef]
- Okoro, H.K.; Orosun, M.M.; Victor, A.; Zvinowanda, C. Health risk assessment, chemical monitoring and spatio-temporal variations in concentration levels of phenolic compounds in surface water collected from River Oyun, Republic of Nigeria. Sustain. Water Resour. Manag. 2022, 8, 189. [Google Scholar] [CrossRef]
- Downs, J.W.; Wills, B.K. Phenol Toxicity; StatPearls Publishing: Treasure Island, FL, USA, 2019. [Google Scholar]
- Saha, N.; Bhunia, F.; Kaviraj, A. Toxicity of phenol to fish and aquatic ecosystems. Bull. Environ. Contam. Toxicol. 1999, 63, 195–202. [Google Scholar] [CrossRef]
- Duan, W.; Meng, F.; Lin, Y.; Wang, G. Toxicological effects of phenol on four marine microalgae. Environ. Toxicol. Pharmacol. 2017, 52, 170–176. [Google Scholar] [CrossRef]
- Salomone, F.; Ivancovsky-Wajcman, D.; Fliss-Isakov, N.; Webb, M.; Grosso, G.; Godos, J.; Galvano, F.; Shibolet, O.; Kariv, R.; Zelber-Sagi, S. Higher phenolic acid intake independently associates with lower prevalence of insulin resistance and non-alcoholic fatty liver disease. JHEP Rep. 2020, 2, 100069. [Google Scholar] [CrossRef] [PubMed]
- Guerreiro, Í.; Ferreira-Pêgo, C.; Carregosa, D.; Santos, C.N.; Menezes, R.; Fernandes, A.S.; Costa, J.G. Polyphenols and their metabolites in renal diseases: An overview. Foods 2022, 11, 1060. [Google Scholar] [CrossRef] [PubMed]
- Parada Jr, H.; Gammon, M.D.; Ettore, H.L.; Chen, J.; Calafat, A.M.; Neugut, A.I.; Santella, R.M.; Wolff, M.S.; Teitelbaum, S.L. Urinary concentrations of environmental phenols and their associations with breast cancer incidence and mortality following breast cancer. Environ. Int. 2019, 130, 104890. [Google Scholar] [CrossRef]
- Hammam, A.; Zaki, M.S.; Yousef, R.A.; Fawzi, O. Toxicity, Mutagenicity and carcinogenicity of phenols and phenolic compounds on human and living organisms [A Review]. Adv. Environ. Biol. 2015, 9, 38–49. [Google Scholar]
- De la Luz-Asunción, M.; Sánchez-Mendieta, V.; Martínez-Hernández, A.; Castaño, V.; Velasco-Santos, C. Adsorption of phenol from aqueous solutions by carbon nanomaterials of one and two dimensions: Kinetic and equilibrium studies. J. Nanomater. 2015, 2015, 405036. [Google Scholar] [CrossRef]
- Dehmani, Y.; Lainé, J.; Daouli, A.; Sellaoui, L.; Bonilla-Petriciolet, A.; Lamhasni, T.; Abouarnadasse, S.; Badawi, M. Unravelling the adsorption mechanism of phenol on zinc oxide at various coverages via statistical physics, artificial neural network modeling and ab initio molecular dynamics. Chem. Eng. J. 2023, 452, 139171. [Google Scholar] [CrossRef]
- Jaber, S.; Lallement, A.; Sancelme, M.; Leremboure, M.; Mailhot, G.; Ervens, B.; Delort, A.-M. Biodegradation of phenol and catechol in cloud water: Comparison to chemical oxidation in the atmospheric multiphase system. Atmos. Chem. Phys. 2020, 20, 4987–4997. [Google Scholar] [CrossRef]
- Mojoudi, N.; Mirghaffari, N.; Soleimani, M.; Shariatmadari, H.; Belver, C.; Bedia, J. Phenol adsorption on high microporous activated carbons prepared from oily sludge: Equilibrium, kinetic and thermodynamic studies. Sci. Rep. 2019, 9, 19352. [Google Scholar] [CrossRef]
- Erattemparambil, K.; Mohan, L.; Gnanasundaram, N.; Krishnamoorthy, R. Insights into adsorption theory of phenol removal using a circulating fluidized bed system. Arab. J. Chem. 2023, 16, 104750. [Google Scholar] [CrossRef]
- Kuśmierek, K.; Świątkowski, A. Adsorption of Phenols on Carbonaceous Materials of Various Origins but of Similar Specific Surface Areas. Separations 2023, 10, 422. [Google Scholar] [CrossRef]
- Wilberg, K.d.Q.; Nunes, D.G.; Rubio, J. Removal of phenol by enzymatic oxidation and flotation. Braz. J. Chem. Eng. 2000, 17, 907–914. [Google Scholar] [CrossRef]
- Olmez-Hanci, T.; Arslan-Alaton, I. Comparison of sulfate and hydroxyl radical based advanced oxidation of phenol. Chem. Eng. J. 2013, 224, 10–16. [Google Scholar] [CrossRef]
- Zhang, Y.; Li, Y.; Tabassum, S. Based on nanocomposites for degradation of phenolic compounds from aqueous environments by advanced oxidation processes: A review. J. Water Process Eng. 2024, 61, 105286. [Google Scholar] [CrossRef]
- Ramos, R.L.; Martins, M.F.; Lebron, Y.A.; Moreira, V.R.; Reis, B.G.; Grossi, L.B.; Amaral, M.C. Membrane distillation process for phenolic compounds removal from surface water. J. Environ. Chem. Eng. 2021, 9, 105588. [Google Scholar] [CrossRef]
- Zhao, W.; Liang, Y.; Wu, Y.; Wang, D.; Zhang, B. Removal of phenol and phosphoric acid from wastewater by microfiltration carbon membranes. Chem. Eng. Commun. 2018, 205, 1432–1441. [Google Scholar] [CrossRef]
- Liu, C.; Min, Y.; Zhang, A.-Y.; Si, Y.; Chen, J.-J.; Yu, H.-Q. Electrochemical treatment of phenol-containing wastewater by facet-tailored TiO2: Efficiency, characteristics and mechanisms. Water Res. 2019, 165, 114980. [Google Scholar] [CrossRef]
- Chen, J.; Yang, Y.; Zeng, X. Study on treatment of phenol wastewater by electrochemical process. In Advances in Petrochemical Engineering and Green Development; CRC Press: Boca Raton, FL, USA, 2022; pp. 16–21. [Google Scholar]
- Darla, U.R.; Lataye, D.H.; Kumar, A.; Pandit, B.; Ubaidullah, M. Adsorption of phenol using adsorbent derived from Saccharum officinarum biomass: Optimization, isotherms, kinetics, and thermodynamic study. Sci. Rep. 2023, 13, 18356. [Google Scholar] [CrossRef]
- Xie, B.; Qin, J.; Wang, S.; Li, X.; Sun, H.; Chen, W. Adsorption of phenol on commercial activated carbons: Modelling and interpretation. Int. J. Environ. Res. Public Health 2020, 17, 789. [Google Scholar] [CrossRef]
- Mopoung, S.; Dejang, N. Activated carbon preparation from eucalyptus wood chips using continuous carbonization–steam activation process in a batch intermittent rotary kiln. Sci. Rep. 2021, 11, 13948. [Google Scholar] [CrossRef]
- Sujiono, E.H.; Zabrian, D.; Zharvan, V.; Humairah, N. Fabrication and characterization of coconut shell activated carbon using variation chemical activation for wastewater treatment application. Results Chem. 2022, 4, 100291. [Google Scholar] [CrossRef]
- Tsubouchi, N.; Nishio, M.; Shinohara, Y.; Bud, J.; Mochizuki, Y. Production of activated carbon from peat by with natural soda ash and effect of nitrogen addition on the development of surface area. Fuel Process. Technol. 2018, 176, 76–84. [Google Scholar] [CrossRef]
- Foorginezhad, S.; Zerafat, M.; Asadnia, M.; Rezvannasab, G. Activated porous carbon derived from sawdust for CO2 capture. Mater. Chem. Phys. 2024, 317, 129177. [Google Scholar] [CrossRef]
- Goswami, R.; Dey, A.K. Activated carbon from agricultural residues: A review. Desalin. Water Treat. 2022, 278, 283–292. [Google Scholar] [CrossRef]
- Blachnio, M.; Derylo-Marczewska, A.; Charmas, B.; Zienkiewicz-Strzalka, M.; Bogatyrov, V.; Galaburda, M. Activated carbon from agricultural wastes for adsorption of organic pollutants. Molecules 2020, 25, 5105. [Google Scholar] [CrossRef]
- Sağlam, S.; Türk, F.N.; Arslanoğlu, H. Synthesis of magnetic activated carbon from industrial waste: Characterization, tetracycline removal and interpretation of its mechanism. Biomass Convers. Biorefinery 2024, 14, 10791–10805. [Google Scholar] [CrossRef]
- Ma, Y.; Li, L.; Tang, J.; Hu, Z.; Zhang, Y.; Ge, H.; Jian, N.; Zhao, J.; Cabot, A.; Li, J. Electrochemical PET recycling to formate through ethylene glycol oxidation on Ni–Co–S nanosheet arrays. J. Mater. Chem. A 2024, 12, 33917–33925. [Google Scholar] [CrossRef]
- Zhou, H.; Ren, Y.; Li, Z.; Xu, M.; Wang, Y.; Ge, R.; Kong, X.; Zheng, L.; Duan, H. Electrocatalytic upcycling of polyethylene terephthalate to commodity chemicals and H2 fuel. Nat. Commun. 2021, 12, 4679. [Google Scholar] [CrossRef]
- Yang, I.; Mok, J.H.; Jung, M.; Yoo, J.; Kim, M.S.; Choi, D.; Jung, J.C. Polyethylene-Derived Activated Carbon Materials for Commercially Available Supercapacitor in an Organic Electrolyte System. Macromol. Rapid Commun. 2022, 43, 2200006. [Google Scholar] [CrossRef]
- Raman, R.S.V. Preparation and Characterization of Activated Carbon from Waste Food Packaging Polymers. Master’s Thesis, National Institute of Technology, Rourkela, India, 2015. [Google Scholar]
- Ligero, A.; Calero, M.; Pérez, A.; Solís, R.R.; Munoz-Batista, M.J.; Martín-Lara, M.Á. Low-cost activated carbon from the pyrolysis of post-consumer plastic waste and the application in CO2 capture. Process Saf. Environ. Prot. 2023, 173, 558–566. [Google Scholar] [CrossRef]
- Wang, S.; Sun, Y.; Shan, R.; Gu, J.; Huhe, T.; Ling, X.; Yuan, H.; Chen, Y. Polypropylene pyrolysis and steam reforming over Fe-based catalyst supported on activated carbon for the production of hydrogen-rich syngas. Carbon Resour. Convers. 2023, 6, 173–182. [Google Scholar] [CrossRef]
- de Paula, F.G.; de Castro, M.C.; Ortega, P.F.; Blanco, C.; Lavall, R.L.; Santamaría, R. High value activated carbons from waste polystyrene foams. Microporous Mesoporous Mater. 2018, 267, 181–184. [Google Scholar] [CrossRef]
- Blanchard, R.; Mekonnen, T.H. Valorization of plastic waste via chemical activation and carbonization into activated carbon for functional material applications. RSC Appl. Polym. 2024, 2, 557–582. [Google Scholar] [CrossRef]
- Ali, E.; Tahereh, K.; Mansooreh, S. Preparation of high surface area activated carbon from polyethylene terephthalate (PET) waste by physical activation. Res. J. Chem. Environ. 2011, 15, 433–437. [Google Scholar]
- Nakagawa, K.; Namba, A.; Mukai, S.R.; Tamon, H.; Ariyadejwanich, P.; Tanthapanichakoon, W. Adsorption of phenol and reactive dye from aqueous solution on activated carbons derived from solid wastes. Water Res. 2004, 38, 1791–1798. [Google Scholar] [CrossRef]
- Cansado, I.; Mourão, P.; Falcão, A.; Carrott, M.R.; Carrott, P. The influence of the activated carbon post-treatment on the phenolic compounds removal. Fuel Process. Technol. 2012, 103, 64–70. [Google Scholar] [CrossRef]
- Laszlo, K. Adsorption from aqueous phenol and aniline solutions on activated carbons with different surface chemistry. Colloids Surf. A Physicochem. Eng. Asp. 2005, 265, 32–39. [Google Scholar] [CrossRef]
- Lorenc-Grabowska, E.; Diez, M.A.; Gryglewicz, G. Influence of pore size distribution on the adsorption of phenol on PET-based activated carbons. J. Colloid Interface Sci. 2016, 469, 205–212. [Google Scholar] [CrossRef]
- Tran, C.V.; Nguyen, P.T.H.; Nguyen, D.D.; Pham, H.T.; Do, D.T.; La, D.D. Facile fabrication of Fe2O3/TiO2 composite from Titanium Slag as Adsorbent for as (V) removal from aqueous media. Sustainability 2023, 15, 7253. [Google Scholar] [CrossRef]
- Xu, J.; Chen, L.; Qu, H.; Jiao, Y.; Xie, J.; Xing, G. Preparation and characterization of activated carbon from reedy grass leaves by chemical activation with H3PO4. Appl. Surf. Sci. 2014, 320, 674–680. [Google Scholar] [CrossRef]
- Thommes, M.; Kaneko, K.; Neimark, A.V.; Olivier, J.P.; Rodriguez-Reinoso, F.; Rouquerol, J.; Sing, K.S. Physisorption of gases, with special reference to the evaluation of surface area and pore size distribution (IUPAC Technical Report). Pure Appl. Chem. 2015, 87, 1051–1069. [Google Scholar] [CrossRef]
- Gupta, G.K.; Sagar, P.; Pandey, S.K.; Srivastava, M.; Singh, A.; Singh, J.; Srivastava, A.; Srivastava, S.; Srivastava, A. In situ fabrication of activated carbon from a bio-waste desmostachya bipinnata for the improved supercapacitor performance. Nanoscale Res. Lett. 2021, 16, 85. [Google Scholar] [CrossRef] [PubMed]
- Liu, Y.; Liu, X.; Dong, W.; Zhang, L.; Kong, Q.; Wang, W. Efficient adsorption of sulfamethazine onto modified activated carbon: A plausible adsorption mechanism. Sci. Rep. 2017, 7, 12437. [Google Scholar] [CrossRef] [PubMed]
- Pham, T.T.H. Investigation of activated carbon derived from rice straw biomass for removal of phenol from aqueous solution. Vietnam J. Sci. Technol. Eng. 2023, 65, 43–46. [Google Scholar] [CrossRef] [PubMed]
- Gundogdu, A.; Duran, C.; Senturk, H.B.; Soylak, M.; Ozdes, D.; Serencam, H.; Imamoglu, M. Adsorption of phenol from aqueous solution on a low-cost activated carbon produced from tea industry waste: Equilibrium, kinetic, and thermodynamic study. J. Chem. Eng. Data 2012, 57, 2733–2743. [Google Scholar] [CrossRef]
- Abdel, G.N.; El Chaghaby, G.A.; Helal, F.S. Preparation, characterization and phenol adsorption capacity of activated carbons from African beech wood sawdust. Glob. J. Environ. Sci. Manag. 2016, 2, 209–222. [Google Scholar]
- Kosmulski, M. The pH dependent surface charging and points of zero charge. X. Update. Adv. Colloid Interface Sci. 2023, 319, 102973. [Google Scholar] [CrossRef]
- Snoeyink, V.L.; Weber, W.J., Jr.; Mark, H.B., Jr. Sorption of phenol and nitrophenol by active carbon. Environ. Sci. Technol. 1969, 3, 918–926. [Google Scholar] [CrossRef]
- Tran, C.V.; Quang, D.V.; Nguyen Thi, H.P.; Truong, T.N.; La, D.D. Effective removal of Pb (II) from aqueous media by a new design of Cu–Mg binary ferrite. ACS Omega 2020, 5, 7298–7306. [Google Scholar] [CrossRef]
- Rehman, S.; Tariq, M.; Shah, J.A.; Ahmad, R.; Shahzad, M.; Abbasi, A.M.; Ullah, A.; Ismail, B.; Bilal, M. Simultaneous physisorption and chemisorption of reactive Orange 16 onto hemp stalks activated carbon: Proof from isotherm modeling. Biointerface Res. Appl. Chem. 2017, 7, 2021–2029. [Google Scholar]
- Liu, Q.-S.; Zheng, T.; Wang, P.; Jiang, J.-P.; Li, N. Adsorption isotherm, kinetic and mechanism studies of some substituted phenols on activated carbon fibers. Chem. Eng. J. 2010, 157, 348–356. [Google Scholar] [CrossRef]
- Singh, K.P.; Malik, A.; Sinha, S.; Ojha, P. Liquid-phase adsorption of phenols using activated carbons derived from agricultural waste material. J. Hazard. Mater. 2008, 150, 626–641. [Google Scholar] [CrossRef] [PubMed]
- Laszlo, K.; Szűcs, A. Surface characterization of polyethyleneterephthalate (PET) based activated carbon and the effect of pH on its adsorption capacity from aqueous phenol and 2, 3, 4-trichlorophenol solutions. Carbon 2001, 39, 1945–1953. [Google Scholar] [CrossRef]
- Melo, J.; Lütke, S.; Igansi, A.; Franco, D.; Vicenti, J.; Dotto, G.; Pinto, L.; Cadaval, T., Jr.; Felipe, C.J.C.; Physicochemical, S.A.; et al. Mass transfer and equilibrium modelings of phenol adsorption on activated carbon from olive stone. Colloids Surf. A Physicochem. Eng. Asp. 2024, 680, 132628. [Google Scholar] [CrossRef]
- Mu’azu, N.D.; Jarrah, N.; Zubair, M.; Alagha, O. Removal of phenolic compounds from water using sewage sludge-based activated carbon adsorption: A review. Int. J. Environ. Res. Public Health 2017, 14, 1094. [Google Scholar] [CrossRef] [PubMed]
- Liu, J.; Yu, Y.; Zhu, J.; Huang, R.; Zheng, Y.; Zhong, A.; Wei, X. Mechanistic study on the influence of hydrogen bonds on the removal paths of lignite ether bonds and phenolic hydroxyl groups in hydrothermal dewatering. Int. J. Coal Prep. Util. 2024, 44, 1590–1605. [Google Scholar] [CrossRef]

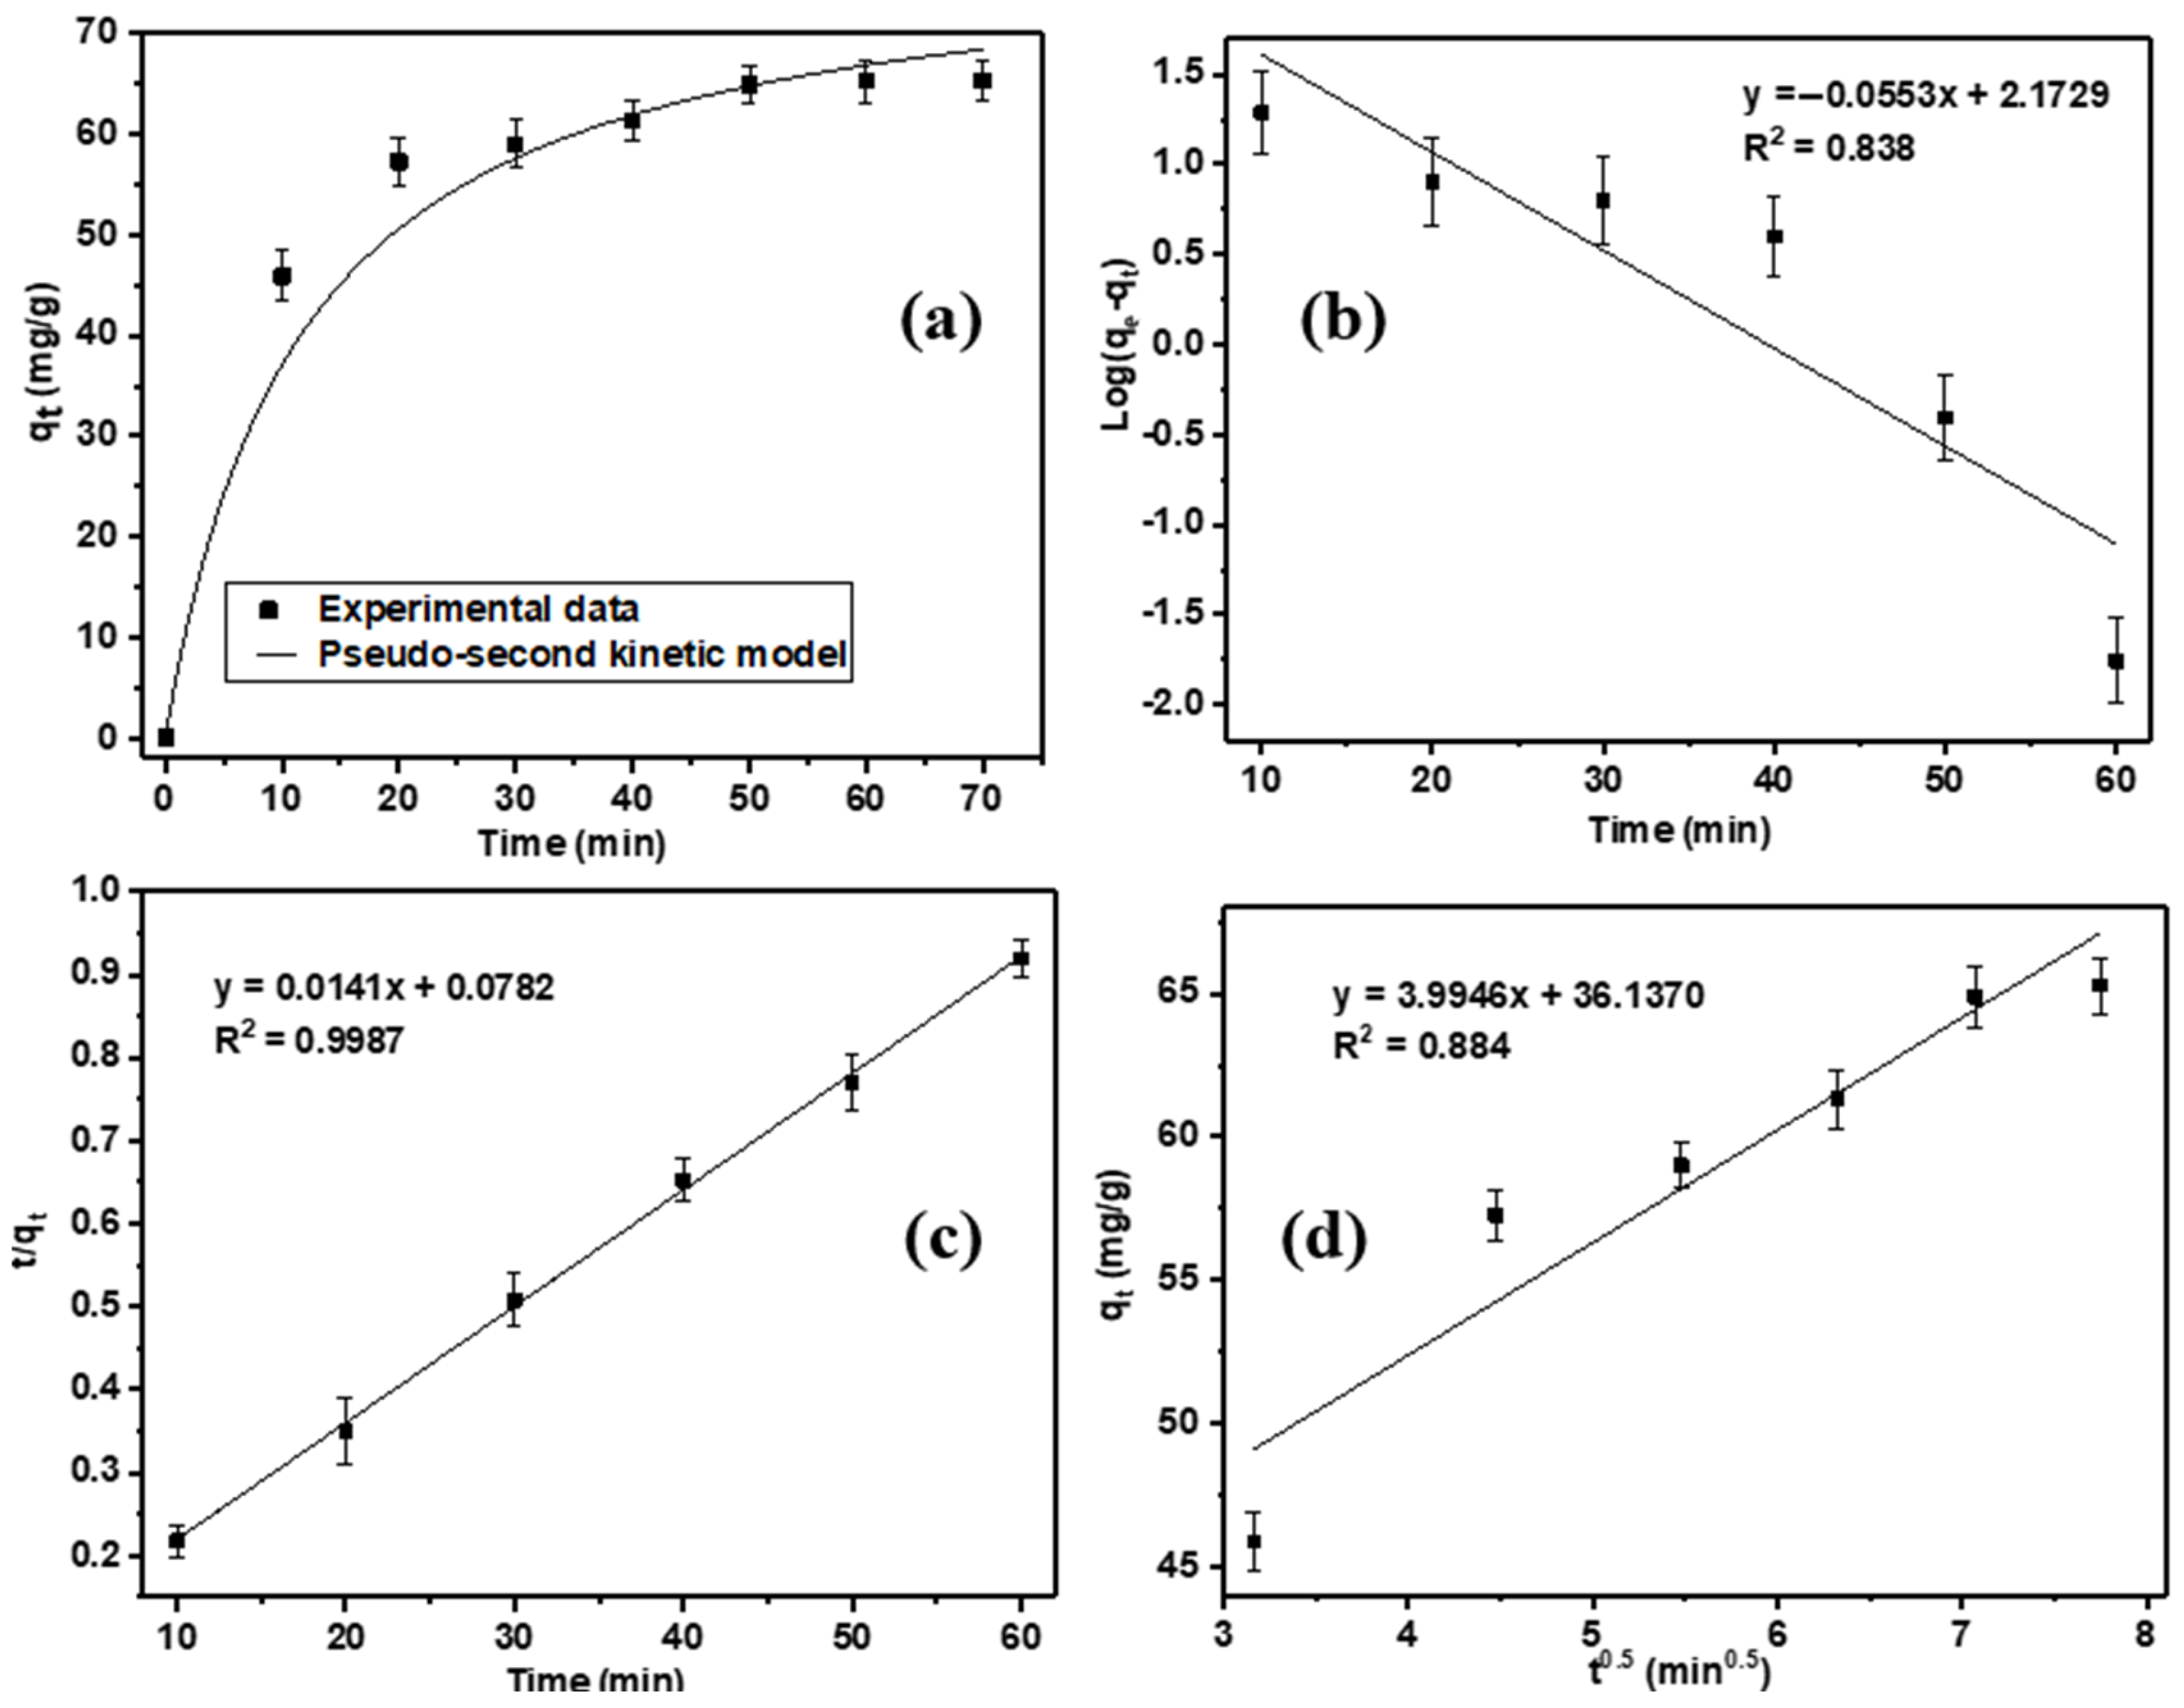
| Pseudo-First-Order | Pseudo-Second-Order | Intra-Particle Diffusion | |||||||
|---|---|---|---|---|---|---|---|---|---|
| qe (mg/g) | k1 (L/min) | R2 | qexp. (mg/g) | qcal. (mg/g) | k2 (mg/g.min) | R2 | Kid | C | R2 |
| 148.90 | 0.127 | 0.838 | 65.296 | 70.923 | 0.003 | 0.998 | 3.995 | 36.137 | 0.884 |
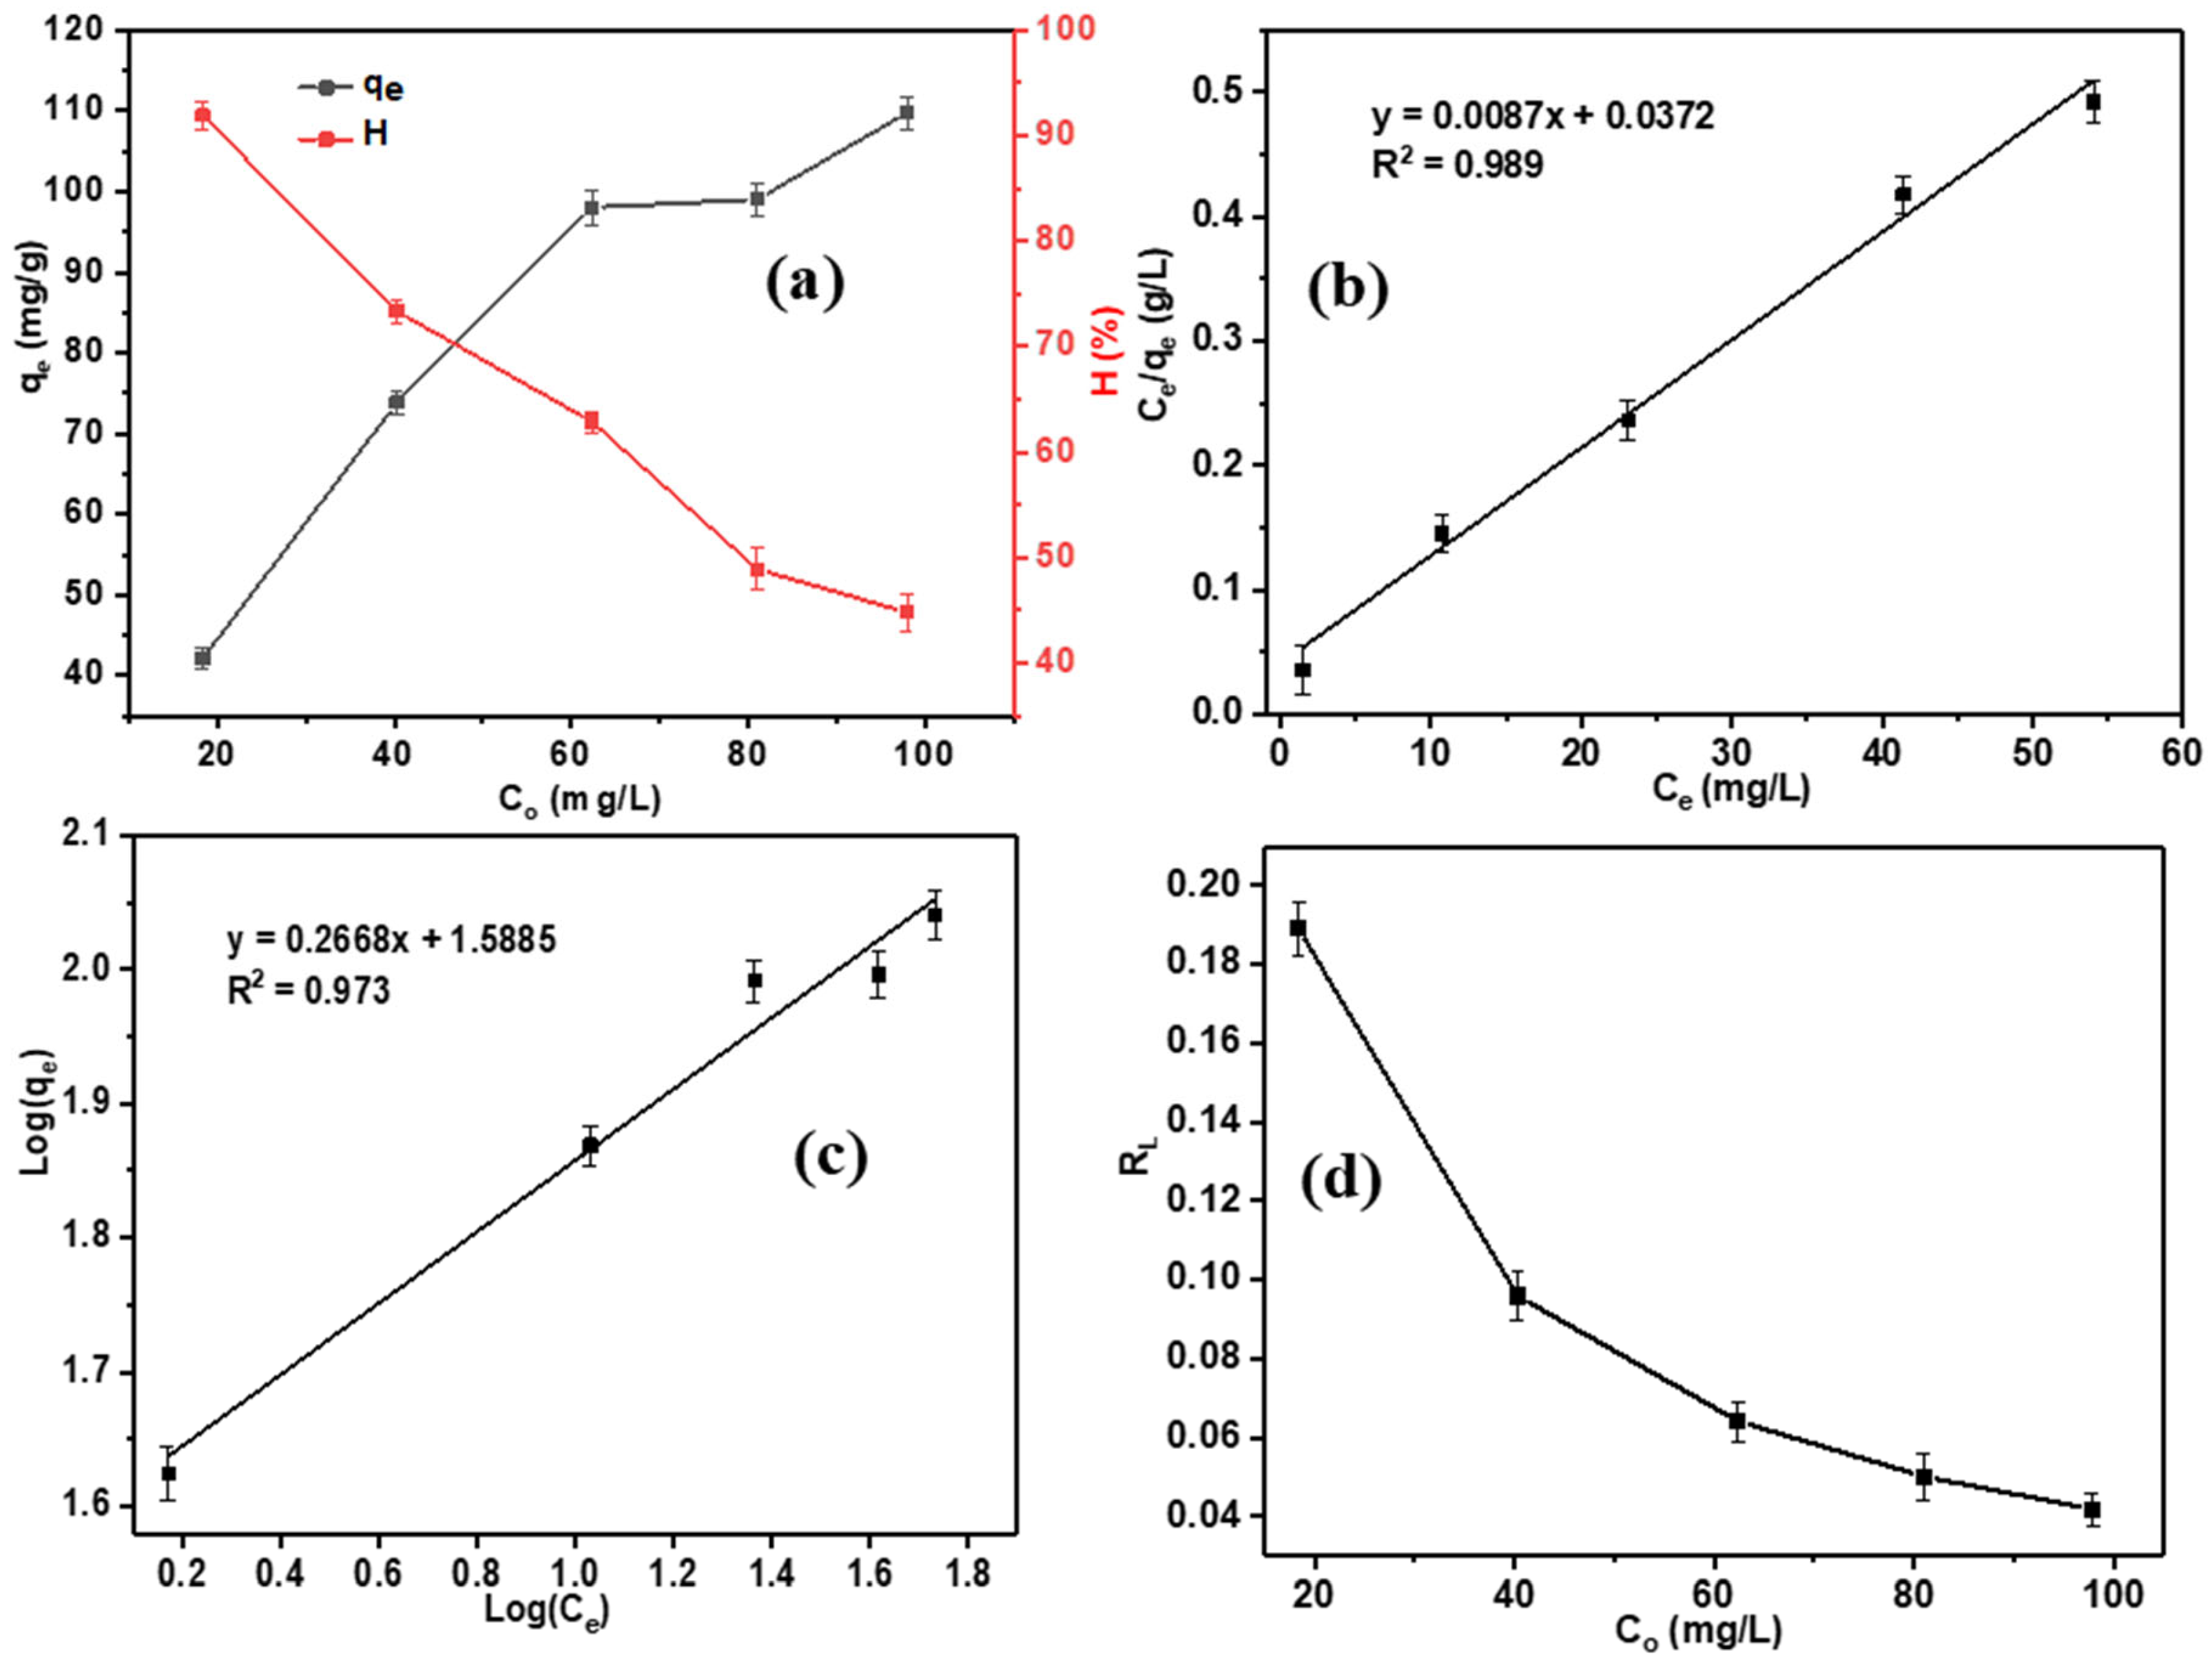
| Langmuir Model | Freundlich Model | ||||||
|---|---|---|---|---|---|---|---|
| qm (mg/g) | KL (L/mg) | RL | R2 | KF ((mg/g) × (L/mg)1/n) | n | R2 | |
| Phenol | 114.94 | 0.234 | 0.042–0.189 | 0.989 | 38.770 | 3.748 | 0.973 |
| Adsorbents | Adsorption Capacity (mg/g) | Reference |
|---|---|---|
| Multiwalled carbon nanotubes | 25.38 | [16] |
| Activated carbon fibers | 102.47 | [63] |
| Activated carbon prepared from coconut shells | 49.87 | [64] |
| Activated carbon prepared from PET | 117.63 | [65] |
| Activated carbon prepared from Saccharum officinarum biomass | 64.59 | [29] |
| Coal-derived powdered activated carbon | 176.58 | [30] |
| Activated carbon from olive stone | 120 | [66] |
| Activated carbon from PET | 114.94 | This study |
Disclaimer/Publisher’s Note: The statements, opinions and data contained in all publications are solely those of the individual author(s) and contributor(s) and not of MDPI and/or the editor(s). MDPI and/or the editor(s) disclaim responsibility for any injury to people or property resulting from any ideas, methods, instructions or products referred to in the content. |
© 2025 by the authors. Licensee MDPI, Basel, Switzerland. This article is an open access article distributed under the terms and conditions of the Creative Commons Attribution (CC BY) license (https://creativecommons.org/licenses/by/4.0/).
Share and Cite
Lai, H.T.; Tran, C.V.; Tran, N.T.; Ho, P.H.; Luu, V.H.; Nguyen, H.M.; Nguyen, H.P.T.; Nguyen, D.D.; La, D.D. Sustainable Removal of Phenol from Aqueous Media by Activated Carbon Valorized from Polyethyleneterephthalate (PET) Plastic Waste. Sustainability 2025, 17, 548. https://doi.org/10.3390/su17020548
Lai HT, Tran CV, Tran NT, Ho PH, Luu VH, Nguyen HM, Nguyen HPT, Nguyen DD, La DD. Sustainable Removal of Phenol from Aqueous Media by Activated Carbon Valorized from Polyethyleneterephthalate (PET) Plastic Waste. Sustainability. 2025; 17(2):548. https://doi.org/10.3390/su17020548
Chicago/Turabian StyleLai, Hoan Thi, Chinh Van Tran, Nga Thuy Tran, Phuong Hien Ho, Van Huyen Luu, Ha Manh Nguyen, Hoai Phuong Thi Nguyen, Dinh Duc Nguyen, and Duong Duc La. 2025. "Sustainable Removal of Phenol from Aqueous Media by Activated Carbon Valorized from Polyethyleneterephthalate (PET) Plastic Waste" Sustainability 17, no. 2: 548. https://doi.org/10.3390/su17020548
APA StyleLai, H. T., Tran, C. V., Tran, N. T., Ho, P. H., Luu, V. H., Nguyen, H. M., Nguyen, H. P. T., Nguyen, D. D., & La, D. D. (2025). Sustainable Removal of Phenol from Aqueous Media by Activated Carbon Valorized from Polyethyleneterephthalate (PET) Plastic Waste. Sustainability, 17(2), 548. https://doi.org/10.3390/su17020548