Abstract
The Sustainable Development Goals 9 (known as the SDG9): Industry, Innovation, and Infrastructure are crucial objectives for Kuwait since they are essential to the nation’s attempts to achieve sustainable development and economic diversification. Using the recently available literature, this research attempts to understand and investigate the current level of SDG9 implementation in the context of Kuwait. Data from the SDGs database based on published studies and reports were used in this study. The actual level of SDG9 implementation in Kuwait still faces significant challenges. The roadmap to achieving the SDG9 goals was improved based on the analysis of SDG9 targets and identifying the reasons and factors for developing each target. The results indicate that Kuwait should encourage non-oil businesses, including manufacturing and renewable energy, to diversify its economy and reduce its dependency on oil. Efforts need to be taken to improve industrial infrastructure, encourage innovation, and advance research and development (R&D) activities. To attract capital and skills for infrastructure development, Kuwait should also promote public–private partnerships. In order to achieve the SDG9 goals, it is suggested that policymakers foster innovation and technology adoption, support small and medium-sized businesses (SMEs), promote sustainable industrial practices, build industrial infrastructure, improve vocational and technical education, encourage international cooperation and technology transfer, monitor progress, and set targets.
1. Introduction
Concentrations of greenhouse gases (GHG) have dramatically increased throughout human activities in the pre-industrial age, especially carbon dioxide (CO2) emissions from the burning of fossil fuels [1]. Therefore, with average temperatures rising by about 1.2 degrees Celsius over the past few centuries, the planet has warmed alarmingly [2]. This poses several risks related to climate change for both natural and human systems, including sea level increases, species extinction, extreme weather, and food and water scarcity, to name a few. In order to address climate change and to reduce our dependence on fossil fuels, renewable energy (such as wind, solar, hydropower, and bioenergy) has been widely researched in recent years and has become well-known as a significant objective for worldwide policy [3]. Regarding the Gulf Cooperation Council (GCC) region, in 2015, Saudi Arabia had a significant increase in CO2 emissions, indicating a worrying trend [1]. However, by 2020, there was a significant decline, indicating environmental initiatives. Despite the decline, Saudi Arabia remains the largest contributor to CO2 emissions in the GCC [1], as shown in Figure 1. Additionally, Kuwait maintains its third-place position in the GCC, with emission levels unchanged since 2010. The data emphasize the need for continued efforts to solve environmental concerns and the differing carbon emission trajectories between GCC states [1].
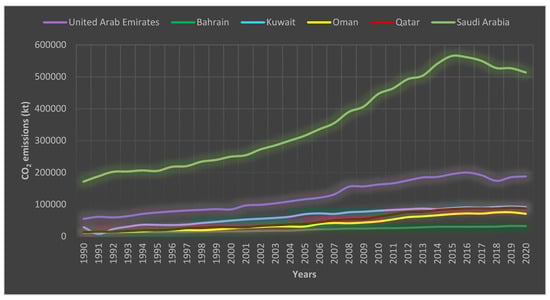
Figure 1.
CO2 emissions (kt) in the GCC region.
The Sustainable Development Goals (SDGs) were adopted by the UN General Assembly in September 2015 as an action plan to improve the world (including its ecosystems, economies, and populations) by 2030. Leaders from 193 different nations were present at the assembly, which formulated seventeen sustainable development goals, as shown in Figure 2. The UN 2030 Agenda addresses several issues related to economic, social, and environmental development, such as social justice and peace, water and sanitation, climate action, gender equality, hunger and poverty, and the environment and energy [4,5,6].
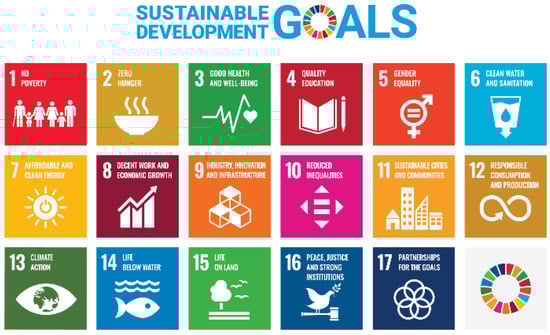
Figure 2.
SDGs [7].
The 17 new SDGs and the 169 objectives that go along with them are associated with the previous three pillars of sustainable development—economic, environmental, and social—in an attempt to motivate action in the years ahead to make Earth a planet of sustainability [8,9]. The Brundtland Report, the UN Conference on Development and the Environment, the Millennium Declaration, and the UN Conference on Sustainable Development all served as inspirations for the 2030 Agenda [10]. While inequities widen, economic welfare is declining and individuals are having difficulties meeting their fundamental demands. “One out of every three people in many countries do not have access to safe drinking water—UNICEF, WHO” refers to the lack of access to clean water for one-third of the world’s population, and 940 million people (13% of the world’s population) lack access to the miracle of electricity. By 2030, five billion people will lack access to healthcare, according to predictions made by the WHO. Particularly in developing and underdeveloped nations, this condition started gradually getting worse. However, as part of the SDGs for the 2030 Agenda, SDG9 specifically calls for investments in infrastructure and industry, which was accepted by world leaders in 2015 [11]. Many steps were taken to address these imbalances and stop climate change.
Despite substantial and structural challenges, the State of Kuwait has been making consistent and continuous efforts over the previous four years to achieve the 2030 Agenda. As a consequence, it was placed 105th out of 156 nations in 2018, having achieved 61.6% of the SDG targets on an international level and 62.1% on a regional level. Figure 3 shows the many difficulties that are handled by institutional instruments [12]. One of Kuwait’s Vision 2035’s primary pillars, “Advanced Infrastructure”, is directly related to SDG9. Currently, over 30 projects are being carried out under this pillar, including the planning and building of new highways, rail systems, airports, and ports. The initiative “Establishing a Centre for the Development of Sustainability Technologies in Facilities and Infrastructure” was funded by the Supreme Council for Planning and Development with the goal of enhancing the center of global competitiveness and raising its special indicators while also supporting sustainability and providing the technical and engineering foundations for the successful implementation of urban expansion projects. The Research Institute oversees the Project’s level of execution and functioning. Over 10 million Kuwaiti dinars are involved. For instance, mechanized control systems have been implemented to constantly monitor petrol emissions and to conduct systematic environmental impact evaluations. A National Industrial Strategy is being executed with the objective of expanding the industrial sector part of Kuwait’s GDP while also creating work opportunities for youth in the private sector [13]. These strategies are connected to the SDG9 targets, such as increasing manufacturing added value and decreasing CO2 emissions in Kuwait.
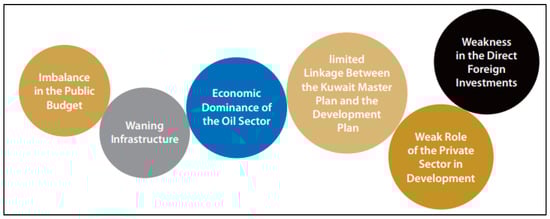
Figure 3.
Key gaps and challenges encountered during the achievement of the 2030 Agenda [12].
2. Literature Review
The SDG9 call is related to “Industry, innovation, and infrastructure that build resilient infrastructure, promote sustainable industrialization, and foster innovation”. The use of advanced, green, alternative, durable, and low-embodied energy and energy-efficient, ecologically safe, and ethically sourced building materials for the construction of these facilities is directly related to the development of sustainable, resilient, and dependable infrastructure. Their usage in the construction of various infrastructures will guarantee quality and longevity while also promoting the development of clean, resilient, and environmentally friendly infrastructures. The development of adaptable, affordable, and environmentally friendly infrastructures that can address both immediate and long-term threats, as well as concerns about global climate change, will be advanced through innovation in the field of construction materials. However, modern building materials such as cement and steel have replaced locally available resources such as stone, wood, mud, and lime due to concerns about longevity. Modern building materials are costly, energy-intensive, dangerous to the environment, and hazardous to health despite their longevity. As a result, the construction of long-lasting and environmentally responsible infrastructure can be enhanced by buildings that use a combination of locally sourced materials and carefully selected modern building materials [10]. Figure 4 illustrates the key targets of SDG9.
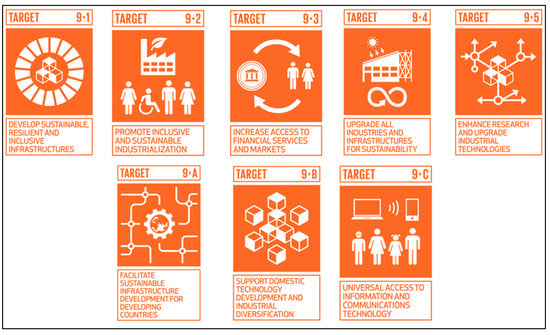
Figure 4.
Key targets of SDG 9 [14].
The study conducted by Al-Muhanadi et al. (2020) [15] examined the score level for indicator 9.4.1 of the Sustainable Development Index in GCC nations between 2000 and 2017. The average GCC nation still has a way to go before achieving the reduction goal for carbon emissions. “Professional accountants” are one of the essential components that GCC nations should consider enhancing to speed up their efforts to achieve the SDGs. Kuwait achieved the highest score of 532 in 2008; however, in 2017, it dropped to 147. While most other GCC nations received scores below one, industrialized nations typically received scores between 0.22 and 0.34 during the same period. Regarding 9.5.1, research conducted by Salman et al. (2020) [16] revealed a relationship between reduced economic flourishment and the State of Kuwait’s poor R&D spending. Furthermore, it was demonstrated that the most important factor in forecasting GDP per capita was the number of researchers, and R&D spending is a reliable indication of researcher count. Therefore, significant R&D investments are required to encourage national innovation and sustained economic growth away from a resource-dependent economy.
A much-needed priority of the SDG objectives for the GCC area was confirmed by Al-Saidi (2022) [17]. An SME program for technological and scientific industries has been established by the “Mohammed bin Rashid Space Centre” (MBRSC) in the United Arab Emirates, according to the National Committee on Sustainable Development Goals (2018) [18]. It has introduced a number of cutting-edge initiatives, including REU, NSOP, and Nayif-1. The center has produced categorization maps of vegetation, roads, urban areas, water, and undeveloped regions, which are useful for mapping infrastructure and tracking the expansion of these areas. The center additionally monitors coastal changes and offers satellite data to government bodies to help industrial initiatives, innovation, and infrastructure. In addition, according to Singh et al. (2022) [19], the Kingdom of Saudi Arabia (KSA) has initiated several initiatives with the objective of collaborating with the private sector to manage and run significant infrastructure undertakings. A national environment strategy has been prepared by the KSA in order to accomplish SDG9 (fight climate change). The KSA also encourages enterprises to increase green cover and decrease emissions under this policy. Figure 5 illustrates a comparison of levels and trends of SDGs in 2023 in North Africa and the Middle East. Bysrov and Panigrahi (2021) [20] expressed gratitude for the curriculum modifications in the GCC that enabled institutions to comprehend sustainability. It means that higher education institutions in the GCC region are gradually adding sustainable development principles to their mission statements. However, it might take decades for universities to realize the implications of sustainable development. Government policy, leaders, and academics would be able to plan for the future by using the illustration of sustainability scenarios through different policy implementations and incentive programs.
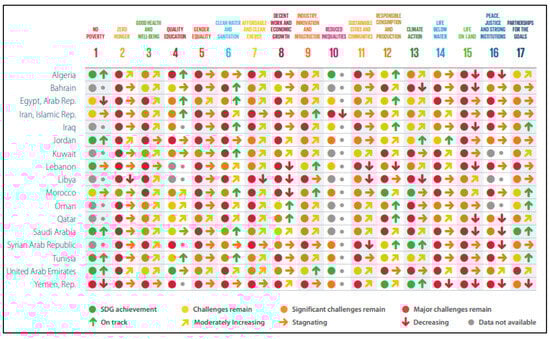
Figure 5.
SDG dashboards for 2023 in North Africa and the Middle East (levels and trends) (Source: sustainable development report 2023) [21].
Berrone et al. (2023) [22] reviewed nine top-tier management journals from 2010 to 2020 and identified 106 articles about SDGs using a filtering method. They then connected these articles across the four stages of the model (prioritizing, contextualizing, collaborating, and innovating). Most of the relevant studies fell under SDG9 (13.21%), SDG16 (22.64%), SDG5 (4.72%), and SDG1 (9.43%). This indicates the importance of SDG9. For instance, Ufua et al. (2021) [23] adopted a conceptual methodology, assessing the corpus of earlier research to analyze the topic from many writers’ points of view in the context of Nigeria. Their findings suggest that digital transformation may aid in the achievement of SDG9 and SDG4. However, this impact is tempered by e-governance performance and stakeholder commitment.
Elder et al. (2016) [24] argued for a more optimistic perspective on “The Means of Implementation” (MOI) and the possibility of achieving the SDGs. First, most SDGs and objectives act as stepping stones or mechanisms for achieving other objectives. Second, a greater capacity will be required, particularly for governance, coordination, integrated implementation, and planning, which is required to maximize synergies across goals. Third, financial feasibility can be achieved even though the upfront costs may seem high in absolute terms. According to Filho et al. (2022) [25], in order to achieve sustainable development while protecting the vulnerable, upholding equity, and balancing multiple demands on natural resources, investment in coordinated policy interventions is required. It is obvious how important it is to have access to affordable, clean energy, given how heavily the economy, environment, and health are dependent on each other. In addition, the development of new technology that the health sector requires to ensure that everyone on Earth receives the best care possible depends on having equal access to energy. They also rely on clean, safe energy to minimize the susceptibility of those who are exposed to contaminated indoor air as a result of using flammable fuels for heating and cooking in their homes. Hence, this presents a variety of challenges, including those related to mobilizing, allocating, and using resources.
Artyukhov et al. (2022) [26] depicted a multidirectional pipeline with an emphasis on achieving SDGs 8, 9, and 4 through the involvement of research institutes such as universities. Each of the six phases will be completed in the sequence shown here when the “initial data” for the subsequent phases are the results of the stages that occurred before. Each stage is related to the achievement of a number of SDG goals. In particular, SDG8 and 9 are shown in Figure 6, along with SDG7 and SDG4, which were discussed in relation to university activities, as well as other SDGs. It is obvious that amongst the important elements (nodes), there is a structured cycle of academic work. Each stakeholder could influence the application of the system’s functioning model at some point.
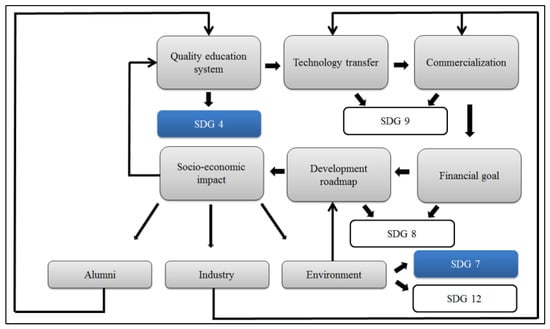
Figure 6.
From quality education to innovations and economic growth [26].
3. Methodology
Kuwait is a sovereign Arab state with a population of 4,216,900 million as of 2022, 66% of whom are non-Kuwaiti nationals. Kuwait’s oil reserves of 101.5 billion barrels and huge reserves of natural gas serve as the foundation for a significant economic presence in the region and around the world. Oil processing and extraction contribute over 40% of GDP, 84% of the government budget, and 95% of export revenues. As a result, Kuwait has some of the world’s greatest living standards. The entire workforce was 2,036,990 in 2022, with 78.3% non-nationals and 21.7% Kuwaiti natives. The majority of the national labor force is involved in the public sector, with only 4.6% working in the private sector [13].
In re-evaluating the status of SDG9 in the context of Kuwait, the literature on the related topic is critically assessed. According to Baldwin et al. (2022) [27], the goal of a review paper is to summarize and synthesize the current body of information regarding a certain topic and to offer recommendations for further study. To accomplish this goal, the current research has three stages. As indicated in Figure 7, the first and second stages are the literature review and data collecting phases, whilst the third phase is the data analysis. The problem statement, which states that Kuwait’s construction industry needs to be addressed to meet SDG9, is identified in the first step. Based on the problem statement, the primary objectives of this study were selected. The implementation of SDG9 in Kuwait and the successes of other nations in achieving this objective were assessed in the second step, which involved looking into prior studies while data were gathered from studies and SDG reports. Data from the SDG database are analyzed, utilizing a comparison method with gulf areas and industrial countries. From this, the results of these data are analyzed in terms of the reasons for increases and reductions in each target, utilizing previously published research and reports. Both quantitative and qualitative data are present in this study. In order to make recommendations for achieving SDG9, the data collected are utilized to assess the current situation. This mixed-method strategy was chosen to provide a thorough understanding and answer research issues. The aim of integrating qualitative and quantitative studies was to provide a more in-depth knowledge of the documents’ content and context. A mixed-method approach enables these concerns to be efficiently addressed. Moreover, the policy documents published were investigated, including reports from relevant ministries, national development plans, and strategic frameworks. These documents were selected due to their direct relevance to infrastructure development and alignment with SDG9. After this, the roadmap for the future was created with that goal in perspective based on the analysis of SDG 9 targets and identifying the reasons and factors for developing each target.
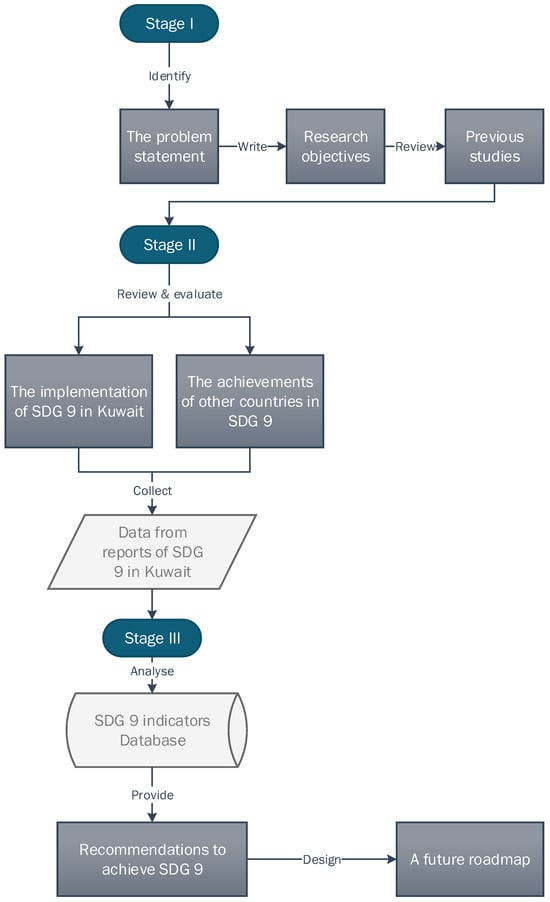
Figure 7.
The stages of the research strategy (own elaboration).
The data-collecting techniques for the review study on the SDG 9 indicators in Kuwait included conducting a systematic search of the SDG database for relevant publications and metrics on sustainable industrialization, innovation, and infrastructure development of the country. The criterion for choosing sources involved relevance to the SDG 9 indicators, data accuracy, and timeliness, with a preference for official SDG reports and credible sources. Studies were excluded if they had no direct relevance to SDG9, were out of date, or had methodological issues. Data analysis methodologies used included a narrative synthesis to summarize major results and trends, as well as quantitative analysis of indicator measures when appropriate. The report also included a comparative assessment that assessed Kuwait’s growth against international benchmarks and regional peers.
The merit of SDG9 is the primary reason this study chooses to highlight it. This goal is to increase innovation while developing infrastructure in a sustainable manner. By taking action in this direction, other SDGs will become more important. SDG 9, in particular, aims to create a more sustainable infrastructure, contributing significantly to Kuwait’s development. Data from earlier studies are obtained through secondary research. The data in this study was initially collected from Kuwait and then some published reports and research from other countries were analyzed to find out ways to achieve SDG9. Data that have already been compiled by other researchers (for instance, through a government census or past scientific investigations) are referred to as secondary research. Data obtained from organizations, studies, and agencies, from both Kuwait and other countries, served as the foundation for this research. All organizations, agencies, and research dealt with for this study are displayed in Table 1. When analyzing data collected from published reports, studies were examined without being limited to the specific country that proposed or accomplished one of the targets from SDG9. Within limited studies about SDG9, the aim of searching for published studies was to help build a vision for plans that have been implemented in some countries or for suggestions and recommendations to achieve this goal.

Table 1.
Data Distribution (own elaboration).
The data obtained from the SDG database are subjected to a thorough examination in order to discover and examine the root causes of Kuwait’s failure to meet its targets. This requires conducting a comparative analysis using data from another country to identify anomalies and unique issues. Additionally, published reports and studies are used to gain a greater understanding of the country’s underlying difficulties that impede advancement. These resources aid in comprehending both external and internal barriers, offering an in-depth overview of the challenges impeding the achievement of these objectives. Table 2 illustrates the complex targets of SDG9.
Table 2.
Description of SDG 9.1, 9.2, and 9.3 (own elaboration).
4. Results and Discussion
The suitability of implementing SDG 9, which aims to provide resilient infrastructure, encourage sustainable industry, and stimulate innovation, is discussed in this study. Kuwait has consistently set high goals for reducing emissions, conserving the environment, and switching to renewable energy sources in accordance with the well-known environmental agreements.
The target of SDG 9.1 is to: “Develop quality, reliable, sustainable, and resilient infrastructure, including regional and trans-border infrastructure, to support economic development and human well-being, with a focus on affordable and equitable access for all”.
The total volume of goods transported by different modes of transport in Kuwait from 2017 to 2021, estimated in TKM, is illustrated in Figure 8. These figures illustrate progress towards Sustainable Development Goal 9.1, which relates to building resilient infrastructure that supports economic growth and human well-being. A large increase in transport activity can be seen from the freight volume, which rose from 309 MTKM in 2017 to 392 MTKM in 2018 in Kuwait. Despite a small decrease in 2019 to 364 MTKM, the numbers decreased to 119 MTKM in 2020, probably as a result of the global pandemic. The freight volume increased to 200 MTKM in 2021 as the world started to recover, demonstrating a strong trend towards improving transportation infrastructure and logistics systems. On the other hand, the United States of America has the largest freight volume when compared to other Gulf countries and industrialized countries. The volume of goods transported by different modes of transport is based on different factors, such as the economic size, infrastructure, and geographical location of countries. For instance, in the United Arab Emirates (UAE), Dubai’s Jebel Ali serves as one of the world’s largest artificial harbors. In addition, in 2021, water transportation (ships) accounted for 41.1% of the total value of products transported in the United States. El Amine (2023) [33] confirmed that Kuwait’s smaller population and economy result in a lower overall freight volume. It functions as a regional hub but lacks the worldwide connectedness of larger economies.
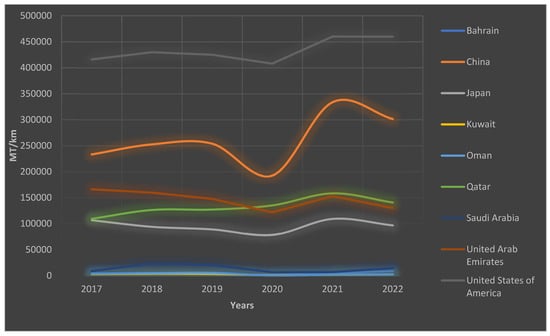
Figure 8.
Freight volume by mode of transport in Kuwait; (Source: SDG Database 2023) [29].
The UAE has the highest volume of passengers using air transport compared with other Gulf regions. In contrast, Kuwait has the lowest volume of passengers using air transport, as illustrated in Figure 9. Tourism and business are major factors influencing the use of air transport in any region, according to Zachariah et al. (2023) [34]. When comparing the UAE and Kuwait, Abu Dhabi International Airport and Dubai International Airport are among the busiest airports in the world, receiving a large number of international passengers. In addition, infrastructure and connectivity should be well-equipped and offer seamless connections. Moreover, events and attractions attract business travelers and tourists alike. The fact that Kuwait has a smaller market and population than the UAE limits demand for air travel, both nationally and abroad. It is crucial to emphasize that while increased passenger traffic can help reach SDG 9.1, it must be handled responsibly to ensure that it matches larger sustainability goals. This involves limiting environmental impacts, such as carbon emissions, and ensuring that infrastructure development benefits all parts of the population in an equitable manner.
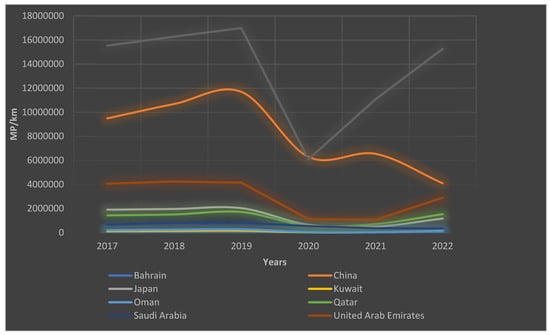
Figure 9.
Passenger volume (passengers per kilometer) by air transport; (Source: SDG Database 2023) [29].
Regardless of the nationality of the ship, goods are transported via waterways on national territory. The data on Kuwait are available in the UNECE Transport Division Database [35]. The number of TEUs transported through container ports in 2015 in Kuwait, which was 984,815 TEUs, shows that maritime commercial activity has increased since 2010 by a further 20.76%, as shown in Figure 10. However, there was a slight decrease in 2016 to 944,432 TEUs, representing a 4.10% decrease from 2015, which may have been caused by a number of variables, such as trade fluctuations or shifts in the state of the global economy. When comparing these results with other Gulf regions, China, and the United States, China has the largest container port traffic using maritime transport. China’s geographical location along major maritime trade routes makes the country a key node in global shipping networks. Therefore, when comparing container port traffic using maritime transport in Kuwait with Qatar, the KSA, and the UAE, Kuwait has a smaller economy and population compared to its GCC neighbors such as Saudi Arabia, the UAE, and Qatar. This results in lower domestic demand for imported goods and, thus, less overall container traffic. The results of this study demonstrate a clear relationship between economy and population size and container port traffic, providing new insights into achieving SDG9.
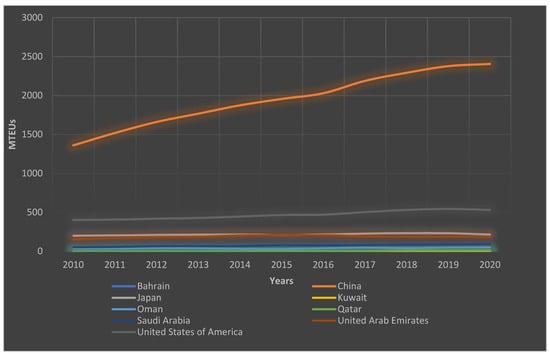
Figure 10.
Container port traffic, maritime transport TEUs; (Source: SDG Database 2023) [29].
The findings align with previous research by AlKheder et al. (2022) [36], although AlKheder et al. (2022) also extended understanding by highlighting the issues of maritime transport in Kuwait. AlKheder et al. (2022) [36] clearly emphasized that maritime transport is considered the second source of income in Kuwait. The unorganized system of truck traffic flow had resulted in significant congestion and increased waiting periods for containers transporting trucks both inside and outside the port. Furthermore, the insufficient container storage area has led to a decrease in ship traffic and the absence of space for the basic infrastructure needed to receive and store the overstocked cargo inside the port. This point highlights that Kuwait’s port infrastructure needs extensive upgrades.
It can be seen, based on the data of SDG 9.1 indicators, that target 9.1 has made uneven progress. While some nations have made considerable progress in developing their infrastructure, others still face difficulties with accessibility, affordability, and sustainability. China has reportedly received recognition for its excellent accomplishments in infrastructure development, according to Lu et al. (2019) [37]. Along with extensive road networks, the nation has built high-speed rail systems. In addition, China’s Belt and Road Initiative promotes infrastructure development and connectivity across Asia, Europe, and Africa. The UAE Government [38] claims that they have made large investments in the development of its infrastructure, particularly in places such as Abu Dhabi and Dubai. Examples of these endeavors include the Palm Jumeirah, the Burj Khalifa, and urban transit systems. These actions have helped the nation’s economy advance and raised its standing abroad.
9.2. “Promote inclusive and sustainable industrialization and, by 2030, significantly raise industry’s share of employment and gross domestic product, in line with national circumstances, and double its share in the least developed countries”.
While MVA is a well-known and frequently used measure by academics and policymakers to assess the degree of industrialization in a nation, the proportion of MVA in GDP illustrates the significance of manufacturing to the economy and to a nation’s overall development. MVA per capita evaluates a nation’s level of industrialization in relation to the size of its GDP. The primary indicator supporting the country groupings in UNIDO data is adjusted MVA per capita, which is given in relation to projected MVA per capita at Purchasing Power Parity (PPP) [31].
9.2.1. “Manufacturing value added as a proportion of GDP per capita”.
The percentages in Figure 11 shed light on how much the manufacturing sector has contributed over time to overall economic production. The global share of MVA in total GDP increased from 16.2% in 2015 to 16.9% in 2021 [30]. During the time under consideration, the percentage of MVA to GDP fluctuated in Kuwait, where the country had the lowest share of manufacturing GDP at 6.6% in 2020 among the GCC countries, compared to 7.9% for Qatar and 18.9% for Bahrain. In addition, Bahrain, Saudi Arabia, and the UAE have the highest MVA percentages in the Gulf region. Scalet (2024) [39] emphasized that the GCC economies are structurally similar in that they depend heavily on revenues from oil and gas as a fraction of overall revenues, and the hydrocarbon industry accounts for the vast majority of GDP. This commonality is fading because of decades of economic diversification efforts, with the UAE and Bahrain undertaking diversification at a rapid pace. In addition, this trend is evident in comparisons of the performance and size of manufacturing sectors, with certain GCC countries having larger and faster-expanding manufacturing sectors. Luciani and Moerenhout (2021) [40] illustrated that mining and utilities account for a significantly larger share of gross value added in Kuwait than in Bahrain. Manufacturing accounts for only a small portion of gross value added in Kuwait, but it accounts for more than three times that amount in Bahrain. While Kuwait’s manufacturing industry has grown over time, it needs more depth and diversity to ensure smooth expansion and serve as a substantial source of investment and job creation. Firstly, the manufacturing sector is controlled by huge public businesses that specialize in one industry. Secondly, most industries have a considerable number of small establishments, which account for the majority of manufacturing jobs. Third, each industrial category is dominated by one or more industries. Services account for around 74% of the economy’s employment, followed by industry (24.4%) and a small agricultural sector (2%) [41].
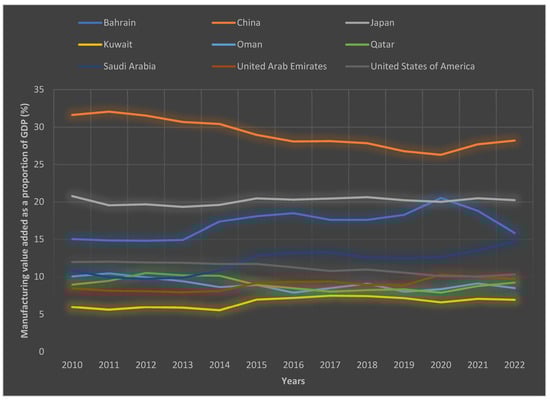
Figure 11.
MVA per capita (current United States dollars) as a proportion of GDP (%)); (Source: SDG Database 2023) [29].
9.2.2. “Manufacturing employment as a proportion of total employment”.
SDG 9.2.2 states that these figures shed light on the dynamics of manufacturing employment and its relative importance across the board. In 2017, the employment rate in the manufacturing sector declined to 5.65%, indicating potential fluctuations or changes in the job landscape for manufacturers in Kuwait. The percentage of manufacturing employment in China is the highest compared with the United States of America and the Gulf regions, as shown in Figure 12. There is a lack of data availability from SDG databases in some countries, such as Kuwait and the UAE.
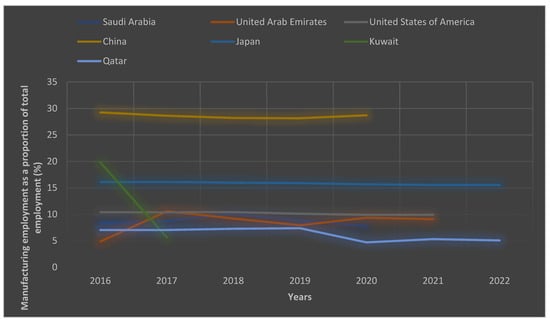
Figure 12.
Manufacturing employment as a proportion of total employment—13th ICLS (%); (Source: SDG Database 2023) [29].
The results can be attributed to the support of larger firms and foreign investments, which significantly influenced manufacturing employment, as emphasized by the International Labor Organization 2024 report [42] on the status of employment in GCC countries. The results of this report showed that several reasons contribute to the relatively low rate of self-employment. Furthermore, labor market dynamics in the GCC frequently favor foreign workers brought in to perform specific tasks, resulting in fewer prospects for entrepreneurship. The availability of comprehensive welfare systems and rich benefits for citizens may also limit the motivation for self-employment, as illustrated in Figure 13. In addition, the legal framework and business support infrastructure in Gulf countries have historically proven more supportive of larger firms and foreign investments rather than encouraging small-scale entrepreneurship. These factors all lead to a low rate of self-employment. Additionally, unlike in non-GCC countries, where there is a distinct tendency for the self-employed to work as own-account workers rather than as employers, this may not be the case in the GCC, where there is a noticeable trend of nationals teaming with expatriates in business initiatives. Many GCC nations have unique ownership restrictions that restrict full foreign ownership of enterprises in particular industries. To participate in these areas, expatriates must have a GCC national sponsor or partner who holds a majority ownership stake and ensures compliance with local legislation.
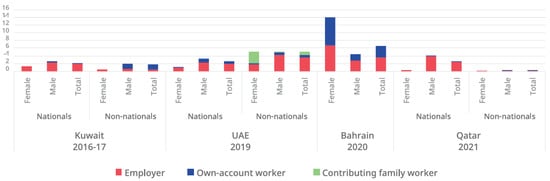
Figure 13.
Self-employment by gender and country in GCC states, % total employment, the most recent year available [42].
In order to evaluate a country’s performance in meeting Target 9.2 of the SDGs, it is necessary to look at its industrialization initiatives, employment patterns, and the industrial sector’s contribution to its economy. Germany is commonly seen as a pioneer in the field of inclusive and sustainable industrialization, according to Curry (2019) [43]. The nation boasts a thriving manufacturing sector and has made significant investments in innovation, renewable energy, and cutting-edge industrial technologies. Indeed, Germany’s industrial sector makes a significant contribution to employment and GDP. Additionally, Japan has a robust industrial sector, particularly in the equipment, electronics, and automotive industries [44]. The nation has successfully balanced industrial expansion and sustainability, placing a strong emphasis on technological advancements and energy efficiency. Japan intends to attain net-zero greenhouse gas emissions by 2050 as well as a carbon-neutral, decarbonized society, according to the International Energy Agency (IEA). Energy efficiency and conservation initiatives have also been supported by the Japanese Ministry of Economy, Trade, and Industry (METI) [45].
9.3. “Increase the access of small-scale industrial and other enterprises, in particular in developing countries, to financial services, including affordable credit, and their integration into value chains and markets”.
In accordance with SDG 9.3.1, the data provided for the proportion of SCM industries in total MVA (%) in Kuwait show how much the SCM industries contribute to the overall manufacturing value added. As illustrated in Figure 14, these data give important insights into the importance of SCM within the larger manufacturing industry in Kuwait. SCM industries had a significant influence on the output of the sector in 2016, as evidenced by their contribution of 6.87% to the overall MVA. However, the proportion dropped to 5.13% in 2018, followed by an increase to 6.34% in 2019. The data help us comprehend how industries work their influences on SDG 9.3.1 and how important it is for them to promote economic growth in a given area or nation.
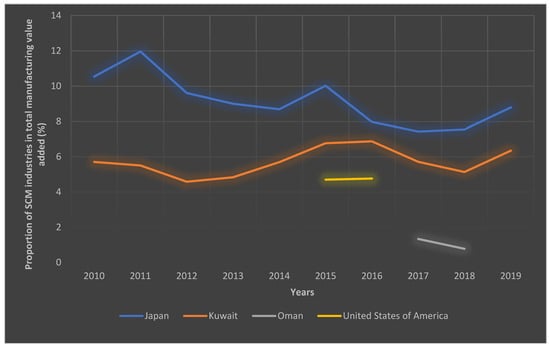
Figure 14.
Proportion of SME industries in total MVA (%) (Data available in the Gulf regions and Japan and USA); (Source: SDG Database 2023) [29].
Kuwait is a small country with a high per capita income and a population of about 4 million according to statistics from the World Population Review (2024) [46]. It is the world’s third richest oil exporter, behind Qatar and the United Arab Emirates. Its economy relies nearly exclusively on oil and gas. Oil exports constitute 90% of all goods exports, or around 37% of GDP. Kuwait has a very small private sector, which accounts for just more than one-third (36%) of economic activity because the country has a large government sector, which accounts for almost two-thirds of the GDP. The country has one of the lowest small and medium-sized enterprise (MSME) densities in the area (12.22 enterprises per thousand people). They account for only 3% of GDP, whereas high-income countries average 50%. Furthermore, they make up around 23% of Kuwait’s workforce, which is about half the average in high-income and rising countries. Its total entrepreneurial activity (TEA) index per 100 inhabitants is less than 2%, which is just 20% of the global average of 11% and significantly lower than expected for a nation of its economic level. A relationship has been found between average yearly income and GDP per capita, with a positive trend at higher income levels. Kuwait is an outlier to this broad pattern because of the exceptional availability of lifelong job security through government employment for all Kuwaiti nationals, dependent on import spending habits made feasible by oil revenue, and a monopoly-based market structure in many industries [47].
Al-Ghareeb (2022) [48] showed that the government monopolizes numerous oil-related sectors. Until recently, theme parks, petrol stations, public transit, and even theatres were mostly controlled by the government, restricting private-sector competition. Bureaucratic processes remain one of the most significant problems for the SME sector, despite the government’s efforts to address these impediments by implementing a “one-net” system to expedite company formation. Despite the low degree of economic risk projected in Kuwait, the categorization of Kuwait’s business environment stays poor, with the World Bank index on ease of business practice for 2020 ranking Kuwait at 83 worldwide [49,50]. Other countries have also provided electronic services to improve the accessibility of financial services for small-scale industrial and other enterprises. Kenya has reportedly been leading efforts to improve financial inclusion, particularly through mobile banking services such as M-Pesa, according to Mbiti and Weil (2011) and (Mulili, 2022) [51,52]. These services have reduced the cost and increased the accessibility of financial services for small firms, enabling them to apply for loans, engage in value chains, and make digital payments. The National Bureau of Economic Research (NBER) has found that M-Pesa has significantly impacted the Kenyan economy. Moreover, India has also taken a number of steps to improve small companies’ financial inclusion, including the Pradhan Mantri Mudra Yojana. This program provides low-cost financing to micro, small, and medium-sized businesses (MSMEs) and aids in their integration into value chains and markets [53].
9.4. “By 2030, upgrade infrastructure and retrofit industries to make them sustainable, with increased resource-use efficiency and greater adoption of clean and environmentally sound technologies and industrial processes, with all countries taking action in accordance with their respective capabilities”.
Sustainability cannot be attained without achieving the SDG9 goal of updating infrastructure and modernizing industry by 2030. Enhancing resource efficiency and encouraging the adoption of clean, environmentally friendly technology and industrial processes more widely are examples of this. CO2 emissions from fuel combustion in Kuwait are represented in the data of Figure 15, which is a crucial indication for SDG 9.4.1. These numbers represent the quantity of CO2 that fuel combustion releases into the atmosphere. Emissions increased, hitting 79.97 million tons in 2011. Fuel combustion resulted in 90.87 million tons of CO2 emissions by 2019, demonstrating a significant environmental impact. These numbers demonstrate the important need for sustainable practices and mitigation strategies to address the environmental concerns associated with carbon emissions from fuel combustion, in spite of the slight drop to 89.53 million tons in 2020. To mitigate climate change and advance sustainable development, SDG 9.4.1 aims to track and decrease these emissions, as well as to encourage cleaner and more effective energy use habits. According to previous statistics for SDG 9 targets, the UAE, Saudi Arabia, and Kuwait have the highest CO2 emissions because their main energy source is dependent on fuel. In addition, Alharbi and Csala (2021) [54] illustrate that the GCC region makes a large contribution to global CO2 emissions from gas and oil combustion, as well as energy extraction, such as oil drilling and electricity generation. These countries are completely reliant on burning fossil fuels, which increases CO2 emissions in the region. The GCC region is estimated to have two-thirds of the world’s crude oil reserves and one-quarter of the world’s natural gas.
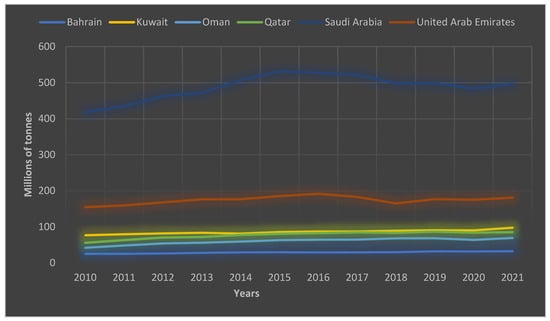
Figure 15.
CO2 emissions from fuel combustion (millions of tons) in GCC); (Source: SDG Database 2023) [29].
Figure 16 shows the amount of CO2 emissions in kilograms per constant manufacturing value added in 2015 U.S. dollars. The emissions decreased to 1.06 in 2018, demonstrating improved environmental performance. Emissions were 1.102 and 1.684, respectively, in 2019 and 2020, indicating probable difficulties in maintaining consistently low emissions levels. These figures highlight how crucial it is to recognize clearer and more sustainable manufacturing methods in order to meet SDG 9.4.1 and reduce the negative environmental effects of industrial activities. The CO2 emissions from manufacturing industries per unit of manufacturing value added are highest in Kuwait, the UAE, and the KSA compared with Japan and China. Chen et al. (2023) [55] illustrated that although China still uses a lot of coal, Japan and China have been investing in cleaner energy sources, including hydro, renewable, and nuclear energy, which can result in fewer CO2 emissions per unit of MVA. On the other hand, Kuwait, the UAE, and the KSA depend significantly on fossil fuels, mainly natural gas and oil, to supply their energy demands, including manufacturing.

Figure 16.
CO2 emissions per unit of MVA (kilograms of CO2 per constant 2015 United States dollars (KG-PER-CON-US); (Source: SDG Database 2023) [29].
As a measure of environmental sustainability, SDG 9.4.1 focuses on calculating CO2 emissions per unit of GDP PPP (purchasing power parity). The numbers given in Figure 17 represent the amount of CO2 emissions per unit of economic output using constant 2017 US dollars as the reference point. The emissions were 0.425 Kg of CO2/USD in Kuwait as of 2018, and they further climbed to 0.432 Kg of CO2/USD and 0.467 Kg of CO2/USD, respectively, in 2019 and 2020. The results highlight the necessity for ongoing initiatives to break the link between economic growth and environmental deterioration and emphasize the significance of adopting sustainable practices in order to accomplish SDG 9.4.1. These data emphasize that the Gulf regions rely on resources that contain CO2 emissions.
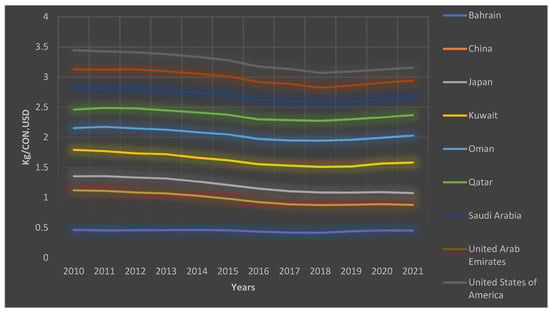
Figure 17.
CO2 emissions per unit of GDP PPP (kilograms of CO2 per constant 2017 United States dollars (KG-PER-CON-USD); (Source: SDG Database 2023) [29].
In order to evaluate a country’s progress towards SDG Target 9.4, it is essential to look at its initiatives to update its infrastructure, adapt its industries for sustainability, boost resource efficiency, and encourage the use of environmentally friendly technology and industrial processes. There are several countries that have demonstrated successful applications of renewable energy to reduce carbon emissions. For example, Sweden is often considered as a pioneer in clean technologies and green infrastructure. In order to promote energy efficiency, renewable energy, and environmentally friendly transportation systems, the nation implemented regulations and committed financial investments. Sweden has reduced emissions and improved resource utilization as a result of its commitment to sustainability [56]. In addition, Finland has made great strides in modernizing its infrastructure and converting its businesses to be more sustainable. The nation has made investments in green technologies, sustainable transportation networks, and energy-efficient construction. Due to Finland’s efforts, resource usage efficiency has increased, and environmentally sound practices have been adopted [57,58]. At the same time, Costa Rica has achieved outstanding progress in clean technologies and sustainable infrastructure. The nation has made significant progress towards meeting its high renewable energy generation goals. Costa Rica is now recognized as a global pioneer in sustainability practices due to its commitment to sustainability, which has led to a high share of renewable energy in its energy mix [8].
9.5. “Enhance scientific research, upgrade the technological capabilities of industrial sectors in all countries, in particular developing countries, including, by 2030, encouraging innovation and substantially increasing the number of research and development workers per 1 million people and public and private research and development spending”.
SDG Target 9.5 intends to advance technical advancement and scientific research, particularly in underdeveloped nations. The goal is to boost both public and private investment in Research and Development (R&D) by 2030, promote innovation, and greatly increase the number of specialists per million individuals. Ultimately, the objective is to ensure that all nations may benefit from scientific and technical advances while also fostering the growth and competitiveness of industrial sectors around the world.
9.5.1. “Research and development expenditure as a proportion of GDP”.
Figure 18 illustrates Kuwait’s Research and Development (R&D) expenditure as a proportion of GDP (%) with an emphasis on SDG 9.5.1. The ratio considerably increased in 2013 in Kuwait, reaching 0.30%, and it continued to rise in 2014, reaching 0.43%. There was a significant decline in 2018 to 0.063%, which was followed by a slight recovery in 2019 to 0.19%. The most recent data from 2020 indicate a percentage of 0.19%. These figures indicate Kuwait’s proportional investment in R&D to its GDP throughout the cited years, demonstrating the nation’s dedication to scientific research and technical advancement. According to the World Bank Group (2024) [59], the UAE and Qatar have the highest research and development expenditure percentage of GDP, as shown in Table 3. The UAE and Qatar have presented ambitious national development programs focused on diversifying their economies away from oil dependency. As part of these strategies, large investments are made in R&D to promote innovation, create new sectors, and strengthen the knowledge economy. For example, the UAE Vision 2021 and Qatar National Vision 2030 emphasize the importance of R&D [59,60].
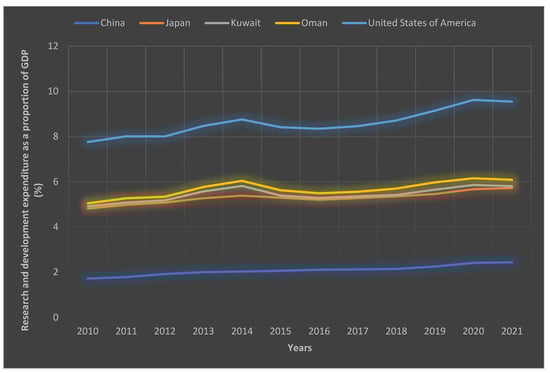
Figure 18.
Research and development expenditure as a proportion of GDP (%) (Data available in the Gulf regions, Japan, and the USA); (Source: SDG Database 2023) [29].
Table 3.
Research and development expenditure (% of GDP) in Gulf regions; (Source: SDG Database 2024) [61].
A fundamental issue facing GCC countries is that the existing skill levels of workers are poor by global standards. A weak education system, as well as a large proportion of semi-skilled and unskilled immigrant workers (and a corresponding lack of foreign high-skilled workers), are significant impediments to the implementation of initiatives to minimize reliance on oil exports and foreign technologies. Kuwait’s aim for an effective National System of Innovation (NSI) requires the agency, acknowledgement, and action of its civil society, international residents, and citizens. However, such advancements are hampered by the fact that these characteristics are mostly lacking in the country’s education system [41].
The current educational systems do not effectively educate students for further employment or study, especially in R&D-intensive sectors. While there are several research organizations, the private sector receives minimal incentives to invest in commercialize and R&D discoveries. Initiatives to promote R&D by developing special research centers, such as KISR, have been successful in specific scientific areas. However, these centers are primarily populated by foreign researchers and are inadequate in connection to the huge task of offering a sufficient base for the supply aspect of R&D; the availability of PhD students and local researchers is very constrained and collaboration between industry, research institutes, and the government to facilitate commercialization and knowledge sharing is weak [41]. The data in Table 4 confirm that education levels in Kuwait are the lowest compared to the Gulf regions.
Table 4.
Educational attainment, Doctoral, Master, or Bachelor equivalent, population 25+, total (%) (cumulative); (Source: World Bank Group 2024) [62].
The lack of commercialization is partially attributable to the state of intellectual property (IP) regulations in the GCC region, which have been described as permissive and lacking regulation. Kuwaiti citizens who hold comfortable positions in the public sector have little motivation. Kuwaiti nationals are provided with public-sector employment with higher salaries and better working conditions than those offered by the private sector. The stark contrast between the private and public sectors undermines reasons to pursue higher education. These labor market elements give no incentives for organizations to participate in knowledge transfer to nationals, and they stifle risk-taking private activities such as entrepreneurship that contribute value. In general, it has been proposed that the failure of GCC nations to build technological and institutional skills to support innovation is mainly because of their ‘rent-dominated’ political cultures [41].
9.5.2. “Researchers (in full-time equivalent) per million inhabitants”.
According to Figure 19, there were around 131.08966 researchers per million individuals in 2012, showing a decline in the number of researchers. In 2015, there were 395.76691 researchers per million individuals, which is a 36.18% reduction from the previous year. In 2018, the number climbed back up to 513.86021 researchers, demonstrating a renewed focus on research and development. The subsequent years witnessed a decline, with 2019 and 2020 showing 184.21315 and 173.5131 researchers per million inhabitants, respectively. These figures demonstrate Kuwait’s capacity and investment in scientific research and development by illustrating the presence of research experts in Kuwait relative to its population. Compared to the Gulf regions, Kuwait ranks last in terms of the number of researchers per million people, as shown in Table 5. The problem of a lack of researchers makes it difficult to increase R&D in Kuwait. A study published in Nature found that South Korea consistently ranked among the top nations in terms of R&D spending and technical proficiency. The government has prioritized R&D spending, leading to advancements in fields including information electronics, technology, and vehicles. Strong public–private partnerships and creative policies may be responsible for South Korea’s success [63]. According to another Nature study, South Korea invested 4.29% (USD 60.5 billion) in R&D in 2014, outpacing regional rivals, such as Japan, and the United States [64].
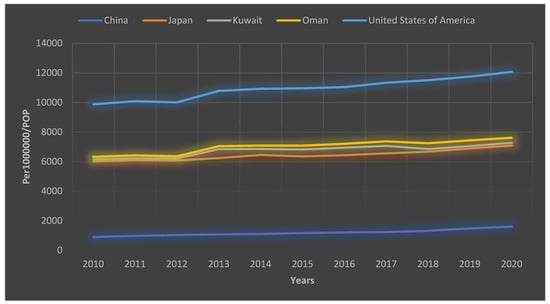
Figure 19.
Researchers (in full-time equivalent) per million inhabitants (per 1,000,000 population) (Data available in the Gulf regions, Japan, and the USA); (Source: SDG Database 2023) [29].
Table 5.
Researchers per million inhabitants in Gulf regions; (Source: UNSECO 2024) [65].
9. b “Proportion of medium- and high-tech industry value added in total value added”.
In 2017, there was a significant increase, and the proportion increased to 35.96%, indicating robust growth and the contribution of these industries to total value added. The statistics stayed fairly high in 2018 (36.25%) and 2019, although they slightly decreased to 31.92% in 2020. These figures demonstrate Kuwait’s development and investment in high-tech manufacturing industries and demonstrate how much the country’s medium- and high-tech manufacturing sectors contribute to the nation’s overall value added. Compared to the other Gulf regions, Kuwait and Bahrain rank last in terms of the proportion of medium- and high-tech industry value added in total value added (%), as shown in Figure 20 and Table 6. The results are consistent with Kabbani and Mimoune (2021) [66], who show that the level of research facilities and skills is the primary driver of a high-tech knowledge economy, providing a robust explanation for the patterns observed, namely that most GCC countries have a level of research facilities and skills. The GCC may be able to create a competitive technology environment by importing people from other Asian and Arab countries.
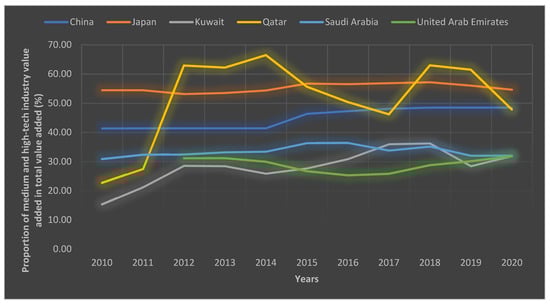
Figure 20.
Proportion of medium- and high-tech industry value added in total value added (%) (Data available in the Gulf regions, Japan, and the USA); (Source: SDG Database 2023) [29].
Table 6.
Medium- and high-tech manufacturing value added (% manufacturing value added); (Source: World Bank Group 2024) [62].
There are different factors that increase the number of medium- and high-tech industries, such as economic diversification, government initiatives, foreign investment, infrastructure development, and education and workforce. The UAE and Oman have attracted considerable foreign direct investment (FDI) in high-tech sectors due to favorable business conditions, such as tax breaks and free zones, as illustrated in Figure 21. In addition, the UAE has 45 free zones that allow 100% foreign ownership [66]. Qatar, the UAE, and Oman have all been actively seeking to diversify their economies away from oil dependency. Investments in technology and advanced manufacturing are part of that approach. In addition, Qatar has three special economic zones that can embrace high-tech emerging industries that contribute to economic diversification [67]. Regarding government initiatives, the governments of Qatar, the UAE, and Oman have announced a number of programs and regulations designed to promote high-tech industries. For example, the UAE has Vision 2021 and Qatar has National Vision 2030 [59,60], both of which emphasize innovation and technology.
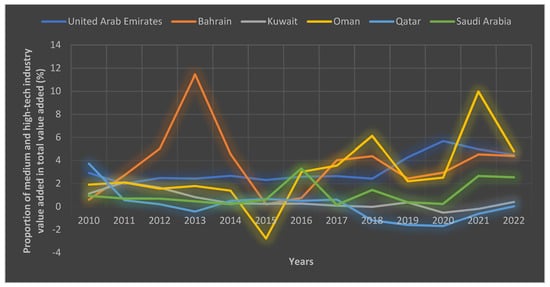
Figure 21.
Foreign direct investment, net inflows (% of GDP); (Source: SDG Database 2023) [62].
9. c “Proportion of population covered by a mobile network, by technology”.
Regarding SDG 9.c, the proportions provided show the percentage of Kuwait’s population who are serviced by at least a 4G mobile network. The proportion increased to 99% in 2016, and in 2017, 2018, 2019, 2020, and 2021, the entire population of Kuwait had access to at least a 4G mobile network. With the majority of Kuwait’s population now having access to modern mobile networks that provide communication and connectivity across the whole nation, these figures demonstrate the significant progress made in providing mobile network coverage to the population. The majority of the Gulf region’s population has access to networks with at least 4G, as shown in Figure 22. In comparison to GCC regions, companies in European countries, such as the Finnish telecommunications industry, generated about EUR 3.43 billion in sales in 2022, as per Statista [68]. Mobile network activities generated almost two billion Euros, while fixed network operations generated about EUR 1.3 billion [68]. Finland is highly known for its cutting-edge telecommunications infrastructure, digital services, and high-speed internet access [68].
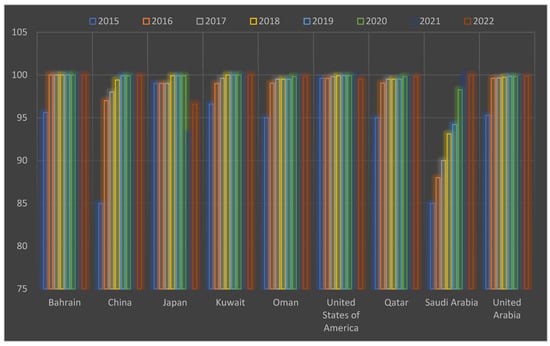
Figure 22.
Proportion of population covered by at least a 4G mobile network (%); (Source: SDG Database 2023) [29].
The Kuwait National Development Plan 2020–2025 showed the prepared proposals for Kuwait to achieve SDG9. Kuwait intends to expand production capacity, encourage indigenous industries, and strengthen industrial collaboration with Gulf countries. This program will promote the growth of innovative companies and attract FDI. Innovative companies will be promoted by developing a human-centric environment, establishing anchor infrastructure projects, and creating a business-friendly regulatory framework. This will allow Kuwait to reduce its reliance on oil while also fostering a more sustainable economy. The development of the Northern Economic Zone will benefit the country as a whole and help to achieve the SDGs. By encouraging economic diversity, the initiative fosters R&D and improves the quality of services and products. By fostering the formation of knowledge-based clusters, the government hopes to improve scientific research, update technological skills to support equitable industrialization, and establish the foundations for a national knowledge economy. This initiative promotes economic diversification by encouraging growth in the industrial sector, as well as R&D. By enhancing infrastructure connectivity and quality, this program works to improve countrywide coverage of fiber networks to increase access to information and communication technologies. It also intends to expand freight infrastructure and the volume of passengers to assist economic development through improvements to land, air, and maritime ports. This program will help to construct excellent, reliable, and sustainable infrastructure by increasing the use of renewable energy and encouraging fuel efficiency requirements. This program will promote economic growth in poor nations by offering strategic development loans and grants for infrastructure and innovation [69].
The roadmap to achieving SDG 9 was improved based on the analysis of SDG 9 targets and identifying the reasons and factors for developing each target. Promoting sustainable development requires incorporating sustainability into infrastructure design and construction. This means giving environmental considerations priority, such as implementing energy-saving technologies and employing sustainable materials. It is also crucial to design infrastructure with waste management, renewable energy integration, and water conservation in mind to reduce negative environmental effects. As a result of climate change and natural calamities, it is also crucial to embrace resilience. An infrastructure’s ability to endure possible risks is improved by putting resilience measures in place, including adopting resilient materials, suitable drainage systems, and safe location selections. In addition, promoting inclusion is crucial to guaranteeing that infrastructure projects satisfy the requirements of all community members, especially marginalized groups and those with a variety of skills. It is possible to build inclusive places that are open to everyone through applying universal design principles into practice and integrating regional communities in decision-making procedures.
Another key element of creating infrastructure that fosters economic growth and supports the free flow of goods, services, and information is enhancing connectivity. Investments in communication systems, digital infrastructure, and transportation networks help close gaps and reduce inequality. Encouraging public–private partnerships can leverage expertise, resources, and funding, leading to improved efficiency, innovative solutions, and addressing infrastructure gaps while maintaining transparency and accountability. Moreover, investing in skills development and capacity-building programs is essential to support sustainable infrastructure development.
Training local professionals and workers in engineering, maintenance, and building methods promotes the long-term viability of infrastructure projects while promoting economic growth and opening up job possibilities. Additionally, promoting technology transfer to emerging nations is essential for their attempts to enhance their infrastructure. Globally, promoting partnerships, research collaborations, and technology-sharing activities between developed and poor countries helps close the technical gap. As a matter of fact, developing monitoring and evaluation systems is essential for evaluating the success and impact of infrastructure projects. Regular review, measurement of key performance indicators, and data collection enable the identification of areas for improvement and inform future infrastructure development strategies. Figure 23 illustrates the roadmap to achieving SDG 9.
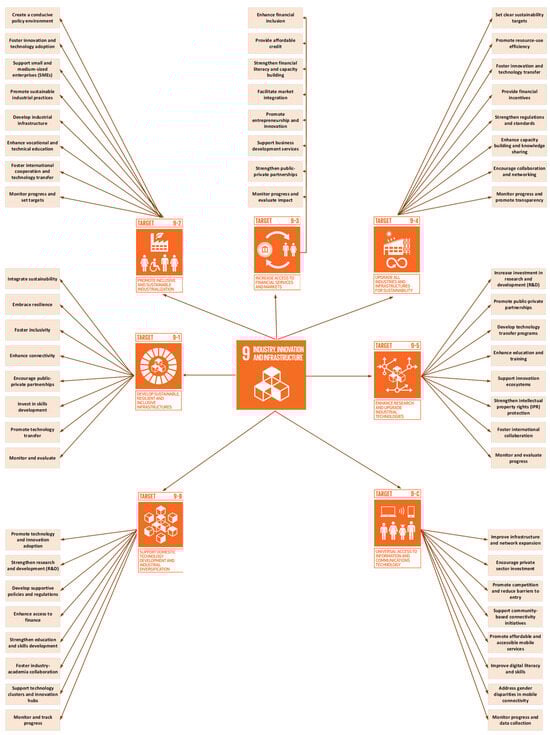
Figure 23.
Roadmap to achieving SDG 9 (own elaboration).
5. Conclusions
SDG9 deals with “Industry, innovation, and infrastructure that build resilient infrastructure, promote sustainable industrialization, and foster innovation”. There are still challenges to be resolved, given the current state of SDG9 in Kuwait. Using recently available reports, the aim of this research is to understand and investigate how SDG 9 is now being implemented in the state of Kuwait in comparison to other countries in the region. The results showed that:
- The UAE has the highest volume of passengers using air transport compared with other Gulf regions. On the contrary, Kuwait has the lowest volume of passengers using air transport.
- Container port traffic using maritime transport in Kuwait was the lowest compared with Qatar, the KSA, and the UAE.
- Kuwait has the lowest share of manufacturing GDP at 6.6% in 2020 among GCC countries, compared to 7.9% for Qatar and 18.9% for Bahrain.
- Kuwait has a very small private sector, which accounts for just more than one-third (36%) of economic activity because the country has a large government sector, which accounts for almost two-thirds of the GDP.
- The UAE, Saudi Arabia, and Kuwait have the highest CO2 emissions because their main energy source is dependent on fuel.
- The UAE and Qatar have the highest research and development expenditure percentage of GDP.
- Education levels in Kuwait are the lowest compared to the Gulf regions.
- Kuwait ranks last in terms of the number of researchers per million people. The problem of a lack of researchers makes it difficult to increase R&D.
- Kuwait and Bahrain rank last in terms of the proportion of medium- and high-tech industry value added in total value added (%).
Creating a long-term strategy that addresses both significant objectives and challenges is necessary for Kuwait’s implementation of SDG9. Building resilience to climate change and natural disasters, fostering inclusivity and accessibility, enhancing connectivity, promoting public–private partnerships, investing in skill development, facilitating technology transfer, and establishing strong monitoring and evaluation systems should all be prioritized in the roadmap. By adhering to this plan, Kuwait will be able to achieve considerable progress towards SDG9, which calls for the development of a sustainable, innovative, and resilient industry and infrastructure that promotes economic growth, social well-being, and environmental protection. Furthermore, to ensure the effective implementation of SDG9 and to contribute to the country’s sustainable development goals, Kuwait must align its efforts with worldwide best practices and cooperate with stakeholders from all sectors. In addition, further work on the roadmap for the implementation of SDG9 in Kuwait should concentrate on offering useful guidance, fact-based insights, and innovative strategies to support sustainable business, innovation, and infrastructure. Kuwait can increase its commitment to sustainable development and help realize the SDG9 targets by addressing these research areas.
This research has some limitations that should be acknowledged. First, all of the data sources are secondary, derived mostly from SDG reports and past studies. Using secondary data may limit the accuracy and depth of the findings because it does not fully reflect the present or unique conditions important to this research. Furthermore, the reasons for executing the SDG9 targets are recorded based on previous studies, which may result in obsolete or context-specific conclusions that are not fully applicable to the current situation. Furthermore, the method by which the SDG database is measured is unclear, which may have an impact on the findings’ reliability and consistency. The ambiguity of measurement methods might make it difficult to analyze data and form appropriate conclusions. Involving the Kuwaiti government in measuring and monitoring SDG targets is critical to gaining a comprehensive picture of the current status. By working directly with the government, the data collection process may become more accurate, dependable, and context-specific, representing the actual situations on the ground. Government engagement ensures that SDG targets are in line with national priorities and offers access to up-to-date and comprehensive data that may not be available from secondary sources. Furthermore, it can provide regular monitoring, allowing for timely adjustments in policies and plans to help accomplish the SDGs more successfully. For future research, it is recommended to include primary data gathering to supplement secondary sources, such as conducting interviews and distributing questionnaires within the Kuwait region, to gain a more localized perspective on the implementation of SDG9. However, doing so may produce different outcomes, necessitating more tests, but with comparable intentions.
Author Contributions
Conceptualization, A.E.; Methodology, A.E.; Formal analysis, A.E.; Investigation, A.E.; Writing—original draft, M.H.; Writing—review & editing, M.H.; Supervision, M.H. All authors have read and agreed to the published version of the manuscript.
Funding
This research received no external funding.
Institutional Review Board Statement
Not applicable.
Data Availability Statement
Data is contained within the article.
Conflicts of Interest
The authors declare no conflict of interest.
References
- The World Bank Group. CO2 Emissions (kt)—Kuwait, Saudi Arabia, Bahrain, Qatar, United Arab Emirates, Oman. 2024. Available online: https://data.worldbank.org/indicator/EN.ATM.CO2E.KT?end=2020&locations=KW-SA-BH-QA-AE-OM&start=1990&view=chart (accessed on 8 July 2024).
- Lindsey, R.; Dahlman, L. Climate Change: Global Temperature. 2024. Available online: https://www.climate.gov/news-features/understanding-climate/climate-change-global-temperature (accessed on 8 July 2024).
- He, J.; Yang, Y.; Liao, Z.; Xu, A.; Fang, K. Linking SDG 7 to assess the renewable energy footprint of nations by 2030. Appl. Energy 2022, 317, 119167. [Google Scholar] [CrossRef]
- Opoku. SDG2030: A sustainable built environment’s role in achieving the post-2015 United Nations Sustainable Development Goals. In Proceedings of the 32nd Annual ARCOM Conference, Manchester, UK, 5–7 September 2016; Volume 2, pp. 1149–1158. [Google Scholar]
- Howard-Grenville, J.; Davis, G.F.; Dyllick, T.; Miller, C.C.; Thau, S.; Tsui, A.S. Sustainable development for a better world: Contributions of leadership, management, and organizations. Acad. Manag. Discov. 2019, 5, 355–366. [Google Scholar] [CrossRef]
- Bebbington, J.; Unerman, J. Achieving the United Nations Sustainable Development Goals: An enabling role for accounting research. Account. Audit. Account. J. 2018, 31, 2–4. [Google Scholar] [CrossRef]
- United Nations. Sustainable Development Goals Kick Off with Start of New Year. The Content of This Publication Has Not Been Approved by the United Nations and Does Not Reflect the Views of the United Nations or Its Officials or Member States h. 2015. Available online: https://www.un.org/sustainabledevelopment (accessed on 19 June 2024).
- Timperley, J. The Long Road to a Zero-Carbon Country. 2020. Available online: https://www.bbc.com/future/article/20200601-costa-rica-the-worlds-most-sustainable-country (accessed on 8 July 2024).
- Breuer, A.; Janetschek, H.; Malerba, D. ranslating sustainable development goal (SDG) interdependencies into policy advice. Sustainability 2019, 11, 2092. [Google Scholar] [CrossRef]
- Omer, M.A.; Noguchi, T. A conceptual framework for understanding the contribution of building materials in the achievement of Sustainable Development Goals (SDGs). Sustain. Cities Soc. 2020, 52, 101869. [Google Scholar] [CrossRef]
- Kynčlová, P.; Upadhyaya, S.; Nice, T. Composite index as a measure on achieving Sustainable Development Goal 9 (SDG-9) industry-related targets: The SDG-9 index. Appl. Energy 2020, 265, 114755. [Google Scholar] [CrossRef]
- Ministry of Health of Kuwait. Kuwait Voluntary National Review 2019; Ministry of Health of Kuwait: Kuwait City, Kuwait, 2019. [Google Scholar]
- SDG. The Second Voluntary National Review Report on SDGs (Kuwait). 2023. Available online: https://kuwait.un.org/sites/default/files/2023-09/VNR2_English_Final.pdf (accessed on 8 July 2024).
- Majeed, S.A. Sustainable Development Goals (SDGS)—SDG9—Industry, Innovation and Infrastructure’ Is All about Engineering. 2019. Available online: https://iesl.lk/SLEN/52/SDG9.php (accessed on 8 July 2024).
- Al-Muhanadi, M.; Al-Fadhel, H.; Al-Jalahma, A. How can the Accounting Profession Contribute to the Reduction of CO2 Emissions in the GCC Region? In Proceedings of the 2020 Second International Sustainability and Resilience Conference: Technology and Innovation in Building Designs, Sakheer, Bahrain, 11–12 November 2020; p. 51154. [Google Scholar]
- Salman, A.; Al-Hemoud, S.; Fakhraldeen, A.; Al-Nashmi, M.; AlFadhli, S.M.; Chun, S. Research and development as a moderating variable for sustainable economic performance: The Asian, European, and Kuwaiti models. Sustainability 2020, 12, 7525. [Google Scholar] [CrossRef]
- Al-Saidi, M. Disentangling the SDGs agenda in the GCC region: Priority targets and core areas for environmental action. Front. Environ. Sci. 2022, 10, 1025337. [Google Scholar] [CrossRef]
- National Committee on Sustainable Development Goals. UAE and the 2030 Agenda for Sustainable Development Excellence in Implementation 2017; SDG: Abu Dhabi, United Arab Emirates, 2018. [Google Scholar]
- Singh, H.P.; Singh, A.; Alam, F.; Agrawal, V. Impact of Sustainable Development Goals on Economic Growth in Saudi Arabia: Role of Education and Training. Sustainability 2022, 14, 14119. [Google Scholar] [CrossRef]
- Bystrov, I.; Panigrahi, S.K. Commitment of Higher Education Institutions to Sustainability Agenda: Evidences from GCC Countries. J. Contemp. Issues Bus. Gov. 2021, 27, 4182–4189. [Google Scholar]
- Sachs, D.; Lafortune, G.; Fuller, G.; Drumm, E. Implementing the SDG Stimulus Includes the SDG Index and Dashboards. 2023. Available online: https://s3.amazonaws.com/sustainabledevelopment.report/2023/sustainable-development-report-2023.pdf (accessed on 8 July 2024).
- Berrone, P.; Rousseau, H.E.; Ricart, J.; Brito, E.; Giuliodori, A. How can research contribute to the implementation of sustainable development goals? An interpretive review of SDG literature in management. Int. J. Manag. Rev. 2023, 25, 318–339. [Google Scholar] [CrossRef]
- Ufua, D.E.; Emielu, E.T.; Olujobi, O.J.; Lakhani, F.; Borishade, T.T.; Ibidunni, A.S.; Osabuohien, E.S. Digital transformation: A conceptual framing for attaining Sustainable Development Goals 4 and 9 in Nigeria. J. Manag. Organ. 2021, 27, 836–849. [Google Scholar] [CrossRef]
- Elder, M.; Bengtsson, M.; Akenji, L. An Optimistic Analysis of the Means of Implementation for Sustainable Development Goals: Thinking about Goals as Means. Sustainability 2016, 8, 962. [Google Scholar] [CrossRef]
- Filho, W.L.; Vidal, D.G.; Chen, C.; Petrova, M.; Dinis, M.A.P.; Yang, P.; Rogers, S.; Castañón, L.Á.; Djekic, I.; Sharif, A.; et al. An assessment of requirements in investments, new technologies, and infrastructures to achieve the SDGs. Environ. Sci. Eur. 2022, 34, 1–17. [Google Scholar]
- Artyukhov, E.; Volk, I.I.; Vasylieva, T.A. Agile methodology in higher education quality assurance system for SDGs 4, 8 and 9 achievement: National experience. CTE Workshop Proc. 2022, 9, 81–94. [Google Scholar] [CrossRef]
- Baldwin, J.R.; Pingault, J.-B.; Schoeler, T.; Sallis, H.M.; Munafò, M.R. Protecting against researcher bias in secondary data analysis: Challenges and potential solutions. Eur. J. Epidemiol. 2022, 37, 1–10. [Google Scholar] [CrossRef] [PubMed]
- UNSD. Sustainable Development Goals Progress Chart 2022 (Technical Note); United Nations Statistics Division (UNSD): New York, NY, USA, 2022. [Google Scholar]
- UN. SDG Indicators Database. 2022. Available online: https://unstats.un.org/sdgs/dataportal/countryprofiles/kwt (accessed on 8 July 2024).
- UNSD. The Sustainable Development Goals Extended Report 2022; UNSD: New York, NY, USA, 2022. [Google Scholar]
- Min, Z.Y. Indicator 9.1.2. 2018. Available online: https://unstats.un.org/wiki/display/SDGeHandbook/Indicator+9.1.2 (accessed on 8 July 2024).
- ILOSTAT. Methods ICLS Documents. 2023. Available online: https://ilostat.ilo.org/about/standards/icls/icls-documents/ (accessed on 8 July 2024).
- El Amine, R. The GCC Countries Diplomatic Approaches and Its Impact on Economic Development: A Comparative Study of the UAE, Saudi Arabia, Qatar, and Kuwait. Doctoral Dissertation, Notre Dame University-Louaize, Zouk Mosbeh, Lebanon, 2023. [Google Scholar]
- Zachariah, R.A.; Sharma, S.; Kumar, V. Systematic review of passenger demand forecasting in aviation industry. Multimed. Tools Appl. 2023, 82, 46483–46519. [Google Scholar] [CrossRef]
- UNECE. Indicator 9.1.2 (c). 2022. Available online: https://w3.unece.org/SDG/en/Indicator?id=149 (accessed on 8 July 2024).
- AlKheder, S.; Naif, D.; Musaed, D.; Al Shrekah, S.; Al Rshaid, M.; Anzi, N.A.; Baqer, I. Maritime transport management in Kuwait toward an automated port logistical city. Clean. Logist. Supply Chain 2022, 3, 100031. [Google Scholar] [CrossRef]
- Lu, Y.; Zhang, Y.; Cao, X.; Wang, C.; Wang, Y.; Zhang, M.; Ferrier, R.C.; Jenkins, A.; Yuan, J.; Bailey, M.J.; et al. Forty years of reform and opening up: China’s progress toward a sustainable path. Sci. Adv. 2019, 5, eaau9413. [Google Scholar] [CrossRef]
- TDRA. Infrastructure and Vision 2021. 2021. Available online: https://u.ae/en/information-and-services/infrastructure/infrastructure-and-vision-2021 (accessed on 8 July 2024).
- Scalet, S. Challenges of Developing the Manufacturing Sector in the GCC. Trends Research and Advisory. 2024. Available online: https://trendsresearch.org/insight/challenges-of-developing-the-manufacturing-sector-in-the-gcc/ (accessed on 8 July 2024).
- Luciani, G.; Moerenhout, T. When Can Oil Economies Be Deemed Sustainable? Palgrave Macmillan: Singapore, 2021. [Google Scholar]
- Arman, H.; Iammarino, S.; Ibarra-Olivo, J.E.; Lee, N. Breaking Out of the Innovation Trap? LSE Middle East Centre: Kuwait City, Kuwait, 2021. [Google Scholar]
- International Labour Organization. Arab States Employment and Social Outlook—Trends 2024 (Promoting Social Justice Through a Just Transition); International Labour Organization: Beirut, Lebanon, 2024. [Google Scholar]
- Curry, A. Time to Renew the Energy Experiment. Nature 2019, 567, S51–S53. [Google Scholar] [CrossRef] [PubMed]
- Goel, U.; Rittstieg, M.; Sanders, J. Implications of the ‘Energy Transition’ across the Machinery Value Chain. 2021. Available online: https://www.mckinsey.com/industries/automotive-and-assembly/our-insights/implications-of-the-energy-transition-across-the-machinery-value-chain (accessed on 8 July 2024).
- IEA. Japan 2021 Energy Policy Review; International Energy Agency: Paris, France, 2021. [Google Scholar]
- World Population Review, “Kuwait Population 2024 (Live). 2024. Available online: https://worldpopulationreview.com/countries/kuwait-population (accessed on 8 July 2024).
- El-Haddad, A.; Adel, M.; Abdel-Latif, H.; Terefe, F. Micro, Small and Mediumsized Enterprises in the Arab Region: Structural Vulnerabilities at a Time Of Multiple Shocks; United Nations Development Programme (UNDP): New York, NY, USA, 2021. [Google Scholar]
- Al-Ghareeb, Y.S.E. Analytical Study for Small and Medium Enterprises in Kuwait. Int. J. Soc. Sci. Technol. 2022, 7, 20–33. [Google Scholar]
- World Bank Group. Doing Business 2020: Kuwait Ranking Improves from 97 to 83, Joins the Top-10 Improvers in the World. 2019. Available online: https://www.worldbank.org/en/news/press-release/2019/10/24/doing-business-2020-kuwait-ranking-improves-from-97-to-83-joins-the-top-10-improvers-in-the-world#:~:text=These%20improvements%20are%20aligned%20with,in%202020%2C%20the%20study%20concludes (accessed on 8 July 2024).
- World Bank Group. Economy Profile of Kuwait. 2020. Available online: https://www.doingbusiness.org/content/dam/doingBusiness/country/k/kuwait/KWT.pdf (accessed on 8 July 2024).
- Mbiti, I.; Weil, D.N. Mobile Banking: The Impact of M-Pesa in Kenya; National Bureau of Economic Research: Cambridge, UK, 2011. [Google Scholar]
- Mulili, M. Digital Financial Inclusion: M-PESA in Kenya. In Digital Business in Africa: Social Media and Related Technologies; Mulili, B.M., Ed.; Springer International Publishing: Cham, Switzerland, 2022; pp. 171–191. [Google Scholar]
- Malladi, C.M.; Soni, R.K.; Srinivasan, S. Digital financial inclusion: Next frontiers—Challenges and opportunities. CSI Trans. ICT 2021, 9, 127–134. [Google Scholar] [CrossRef]
- Alharbi, F.R.; Csala, D. Gulf Cooperation Council Countries’ Climate Change Mitigation Challenges and Exploration of Solar and Wind Energy Resource Potential. Appl. Sci. 2021, 11, 2648. [Google Scholar] [CrossRef]
- Chen, X.H.; Tee, K.; Elnahass, M.; Ahmed, R. Assessing the environmental impacts of renewable energy sources: A case study on air pollution and carbon emissions in China. J. Environ. Manag. 2023, 345, 118525. [Google Scholar] [CrossRef] [PubMed]
- Pareliussen, J.; Purwin, A. Climate Policies and Sweden’s Green Industrial Revolution; Organisation for Economic Co-operation and Development (OECD): Paris, France, 2023. [Google Scholar]
- Felius, L.C.; Hamdy, M.; Dessen, F.; Hrynyszyn, B.D. Upgrading the Smartness of Retrofitting Packages towards Energy-Efficient Residential Buildings in Cold Climate Countries: Two Case Studies. Buildings 2020, 10, 200. [Google Scholar] [CrossRef]
- Felius, C.; Dessen, F.; Hrynyszyn, B.D. Retrofitting towards energy-efficient homes in European cold climates: A review. Energy Effic. 2020, 13, 101–125. [Google Scholar] [CrossRef]
- Planning and Statistics Authority. Results of Research & Development Survey State of Qatar 2021. Available online: https://www.psa.gov.qa/en/statistics/Statistical%20Releases/General/StatisticalAbstract/2021/RD_Qatar_2021_En.pdf (accessed on 8 July 2024).
- Khan, B.; Iqbal, S.; Hameed, I. Economic development vision of the Gulf Cooperation Council. In Research, Innovation and Entrepreneurship in Saudi Arabia; Routledge: London, UK, 2020; pp. 17–53. [Google Scholar]
- World Bank Group. Research and Development Expenditure (% of GDP)—Middle East & North Africa. 2024. Available online: https://data.worldbank.org/indicator/GB.XPD.RSDV.GD.ZS?locations=ZQ (accessed on 8 July 2024).
- World Bank Group. Medium and High-Tech Manufacturing Value Added (% Manufacturing Value Added). 2024. Available online: https://data.worldbank.org/indicator/NV.MNF.TECH.ZS.UN (accessed on 8 July 2024).
- Dayton, L. How South Korea made itself a global innovation leader. Nature 2020, 581, S54. [Google Scholar] [CrossRef]
- Zastrow, M. Why South Korea is the world’s biggest investor in research. Nature 2016, 534, 20–23. [Google Scholar] [CrossRef] [PubMed]
- UNSECO. Science, Technology and Innovation: 9.5.2 Researchers (in Full-Time Equivalent) per Million Inhabitants. 2024. Available online: https://data.uis.unesco.org/index.aspx?queryid=3685# (accessed on 8 July 2024).
- Kabbani, N.; Mimoune, N.B. Economic Diversification in the Gulf: Time to Redouble Efforts; Brookings Doha Center: Washington, DC, USA, 2021. [Google Scholar]
- National Devlopment Strategy. Qatar Second National Development Strategy 2018~2022; National Devlopment Strategy: Doha, Qatar, 2019. [Google Scholar]
- Clausnitzer, J. Telecommunications Industry in Finland—Statistics & Facts. 2024. Available online: https://www.statista.com/topics/4184/telecommunications-industry-in-finland/#topicOverview (accessed on 8 July 2024).
- General Secretariat of the Supreme Council for Planning and Devlopment. Kuwait National Development Plan 2020–2025. 2022. Available online: https://media.gov.kw/assets/img/Ommah22_Awareness/PDF/NewKuwait/Revised%20KNDP%20-%20EN.pdf (accessed on 8 July 2024).
Disclaimer/Publisher’s Note: The statements, opinions and data contained in all publications are solely those of the individual author(s) and contributor(s) and not of MDPI and/or the editor(s). MDPI and/or the editor(s) disclaim responsibility for any injury to people or property resulting from any ideas, methods, instructions or products referred to in the content. |
© 2025 by the authors. Licensee MDPI, Basel, Switzerland. This article is an open access article distributed under the terms and conditions of the Creative Commons Attribution (CC BY) license (https://creativecommons.org/licenses/by/4.0/).