Article

Research on the Spatial Pattern of High-Quality Tourism Rural Development and Its Influencing Factors: A Case Study of the Great Mount Huang District in Anhui Province

1
School of Architecture and Urban Planning, Anhui Jianzhu University, Hefei 230601, China
2
China-Portugal Joint Laboratory of Cultural Heritage Conservation Science, Hefei 230601, China
*
Author to whom correspondence should be addressed.
Sustainability 2025, 17(19), 8943; https://doi.org/10.3390/su17198943 (registering DOI)
Submission received: 3 September 2025 / Revised: 19 September 2025 / Accepted: 25 September 2025 / Published: 9 October 2025

Abstract

Tourism villages represent a key breakthrough for achieving rural revitalization and integrated urban–rural development. By analyzing the spatial patterns of tourism villages in the Great Mount Huang district and their influencing factors, this study provides a scientific foundation for the high-quality development of rural tourism and for the enhancement and sustainable management of regional leisure tourism systems. Using methods such as the nearest neighbor index, kernel density, geographic detector, and geographically weighted regression analysis, the results reveal: (1) the spatial distribution of tourism villages in the Great Mount Huang district exhibits significant clustering and unevenness, forming a spatial pattern characterized by “one cluster, two cores, and three points”; Anqing City shows the most concentrated and uneven distribution of tourism villages; (2) the number of Grade A tourist attractions and cultural resources are dominant factors; tourism culture and natural environment are the most influential dimensions affecting the spatial distribution of tourism villages in the Great Mount Huang district; the development of rural tourism requires consideration of multiple aspects and factors, emphasizing multidimensional coordination; (3) the average slope and the number of Grade A tourist attractions exhibit the greatest spatial variability, while the average elevation shows the lowest spatial variability; average elevation, average slope, per capita disposable income, the number of Grade A tourist attractions, and cultural resources all show a positive correlation with the distribution of tourism villages.

1. Introduction

Rural tourism, which highlights rural natural landscapes, traditional culture, agricultural production, and rural life, has gained increasing popularity among tourists in recent years [1]. It not only offers urban residents opportunities to reconnect with nature and experience rural traditions but also provides new momentum for rural revitalization, urban–rural integration, and farmers’ income growth. In response, the Chinese government has introduced a series of policies and measures to support rural tourism development. These emphasize the priority of agricultural and rural advancement, the integration of urban and rural areas, the promotion of rural leisure tourism, the deep integration of rural culture and tourism, and the improvement of rural tourism quality and efficiency, thereby effectively advancing comprehensive rural revitalization [2]. With support from both government and society, rural tourism has gradually shifted from a focus on scale expansion to an emphasis on quality enhancement. In February 2022, Anhui Province formally proposed the concept of the “Great Mount Huang.” Future plans include exploring its cultural connotations, integrating high-quality regional tourism resources, promoting deep cultural–tourism integration, and transforming the Great Mount Huang into a world-class leisure and resort tourism destination, thereby driving the high-quality development of the Anhui South International Cultural Tourism Demonstration Zone. The region is distinguished by picturesque mountains, clear waters, layered peaks, ridges, and a rich cultural heritage. Rural tourism thus holds considerable potential and constitutes a key component of the Great Mount Huang initiative. Accordingly, research on the spatial distribution features of tourism villages in the Great Mount Huang district and the analysis of underlying influencing factors carry practical significance for enhancing and sustainable development of regional leisure tourism systems and implementing the rural revitalization strategy. Research on spatial patterns and their influencing factors can be effectively interpreted using established geographic theories. The core–periphery theory suggests that regional spatial structures consist of core and peripheral zones, with resources, labor, and capital tending to flow toward the core, often resulting in spatial development imbalances. In the context of tourism, visitors are inclined to select destinations with well-developed facilities and diverse offerings, minimizing search costs and travel uncertainties. As a world-class tourist destination, the Huangshan Mountain Scenic Area represents the absolute “core” within the Great Mount Huang district, whereas the surrounding rural areas function as the “periphery.” Consequently, the core–periphery theory provides a critical analytical framework for understanding the spatial distribution patterns of high-quality tourism villages and the macro-structural factors underlying their formation.
Research on rural tourism can be traced back to the 1940s in Italy. With the diversification of rural tourism formats, such activities gained global popularity in the 1980s. Early studies primarily focused on conceptual definitions, characterizing rural tourism as tourists staying with local farmers and participating in rural activities, with active tourist involvement and farmers serving as hosts [3]. Some scholars also argued that rural tourism should encompass agricultural attributes [4]. In recent years, international research has concentrated on themes such as accessibility [5,6], influencing factors [7,8], planning [9], development pathways [10,11], and the importance to rural development [12,13], reflecting diverse perspectives and rich content. In China, academic interest in rural tourism emerged in the 1990s [14]. Since then, the field has expanded rapidly, with increasingly diversified research themes. Chinese scholarship has addressed the concept of rural tourism [15,16], the synergistic mechanisms between rural tourism and rural revitalization [17], its role in driving endogenous rural development [18], the relationship between culture and rural sustainable development [19], the high-quality development [20], and interactions between community residents and visitors [21]. These studies closely align with the rural revitalization strategy, highlighting rural tourism’s contribution to urban–rural integration and common prosperity, while emphasizing the importance of leveraging cultural assets and ecological resource advantages.
In recent years, research on rural tourism, both in China and abroad, has developed into a multidisciplinary and multi-dimensional field. Studies on spatial patterns have proliferated, with many adopting mixed qualitative–quantitative approaches such as GIS kernel density analysis [22], Spatial autocorrelation [23], geodetector [24], and geographically weighted regression analysis [25]. International scholarship has examined the spatial distribution of tourism resources [26], spatial location relationships [27,28,29], and influencing factors [30]. The core objective is to elucidate the spatial organization logic of tourism resources by examining the impacts of tourism development and the integration of these resources, thereby providing both theoretical support and practical guidance for the scientific and efficient planning of regional tourism. In China, research has centered on tourism-driven poverty alleviation [31], impact assessments [32], spatial pattern optimization [33], and accessibility [34]. Investigations span multiple regional scales, including national, provincial, municipal, and river basin levels [25,31,32,33,34,35,36]. At the provincial and municipal levels, research is concentrated in Hunan [37,38], Henan [39,40], and Chongqing [41,42]. Common research subjects include national and provincial lists of key rural tourism villages, historical and cultural villages, and China’s Beautiful and Leisurely Villages. Overall, existing research in China aligns closely with national strategies for rural revitalization and coordinated regional development. It emphasizes the identification of overarching patterns at the macro level, while also examining practical case studies at meso- and micro-regional scales. By focusing on officially recognized characteristic villages as primary research subjects, these studies exhibit a clear policy orientation and strong practical relevance. They provide targeted insights for the development of tourism resources across multiple regional scales, thereby enhancing rural tourism quality and leveraging tourism as a driver for local socio-economic development.
Current research on the spatial patterns of tourism villages in Anhui Province primarily focuses on key tourism villages, followed by premium villages, distinctive tourism towns and villages, tourism demonstration villages, and model tourism villages [43,44,45,46]. In terms of influencing factors, most studies rely on geographic detector analysis [44], with very few integrating geographically weighted regression (GWR) analysis [45]. Moreover, existing research predominantly emphasizes technological applications, with limited incorporation of geographical theory to interpret spatial patterns and influencing factors. Overall, the rural samples selected in Anhui remain relatively homogeneous, often focusing on factor analysis at the regional scale while neglecting spatial heterogeneity, resulting in relatively weak theoretical grounding. This study addresses these limitations in several ways. First, it selects villages from Anhui’s comprehensive catalog of tourism demonstration villages and other officially designated tourism villages established before 2025, thereby promoting high-quality rural tourism development. Compared to previous studies, these selected villages provide larger datasets and more targeted tourism functions. Second, this study innovatively combines the Geodetector method with the GWR model to analyze variations in influencing factors across counties and districts, subsequently proposing a mechanism for the spatial distribution of tourism villages in the Great Mount Huang district. Finally, by integrating core-periphery theory, it examines the spatial patterns and developmental mechanisms of tourism villages in the Great Mount Huang district from a “core-periphery” perspective.
This study focuses on the Great Mount Huang district of Anhui Province, employing core-periphery theory and GIS spatial analysis techniques to reveal the spatial patterns of tourism villages across administrative boundaries and to analyze the factors influencing their localization. The study aims to support the high-quality development of rural tourism in the Great Mount Huang district, enhance the regional leisure tourism system, and promote sustainable development. Furthermore, it provides methodological and empirical insights for the development of “resource-rich tourism villages” in developing countries, enriches the regional case repository for international rural tourism research, broadens the spatial perspective of global “tourism-space” studies, and offers complementary evidence on influence mechanisms in a “non-Western context.”

2. Materials and Methods

2.1. Research Area and Subjects

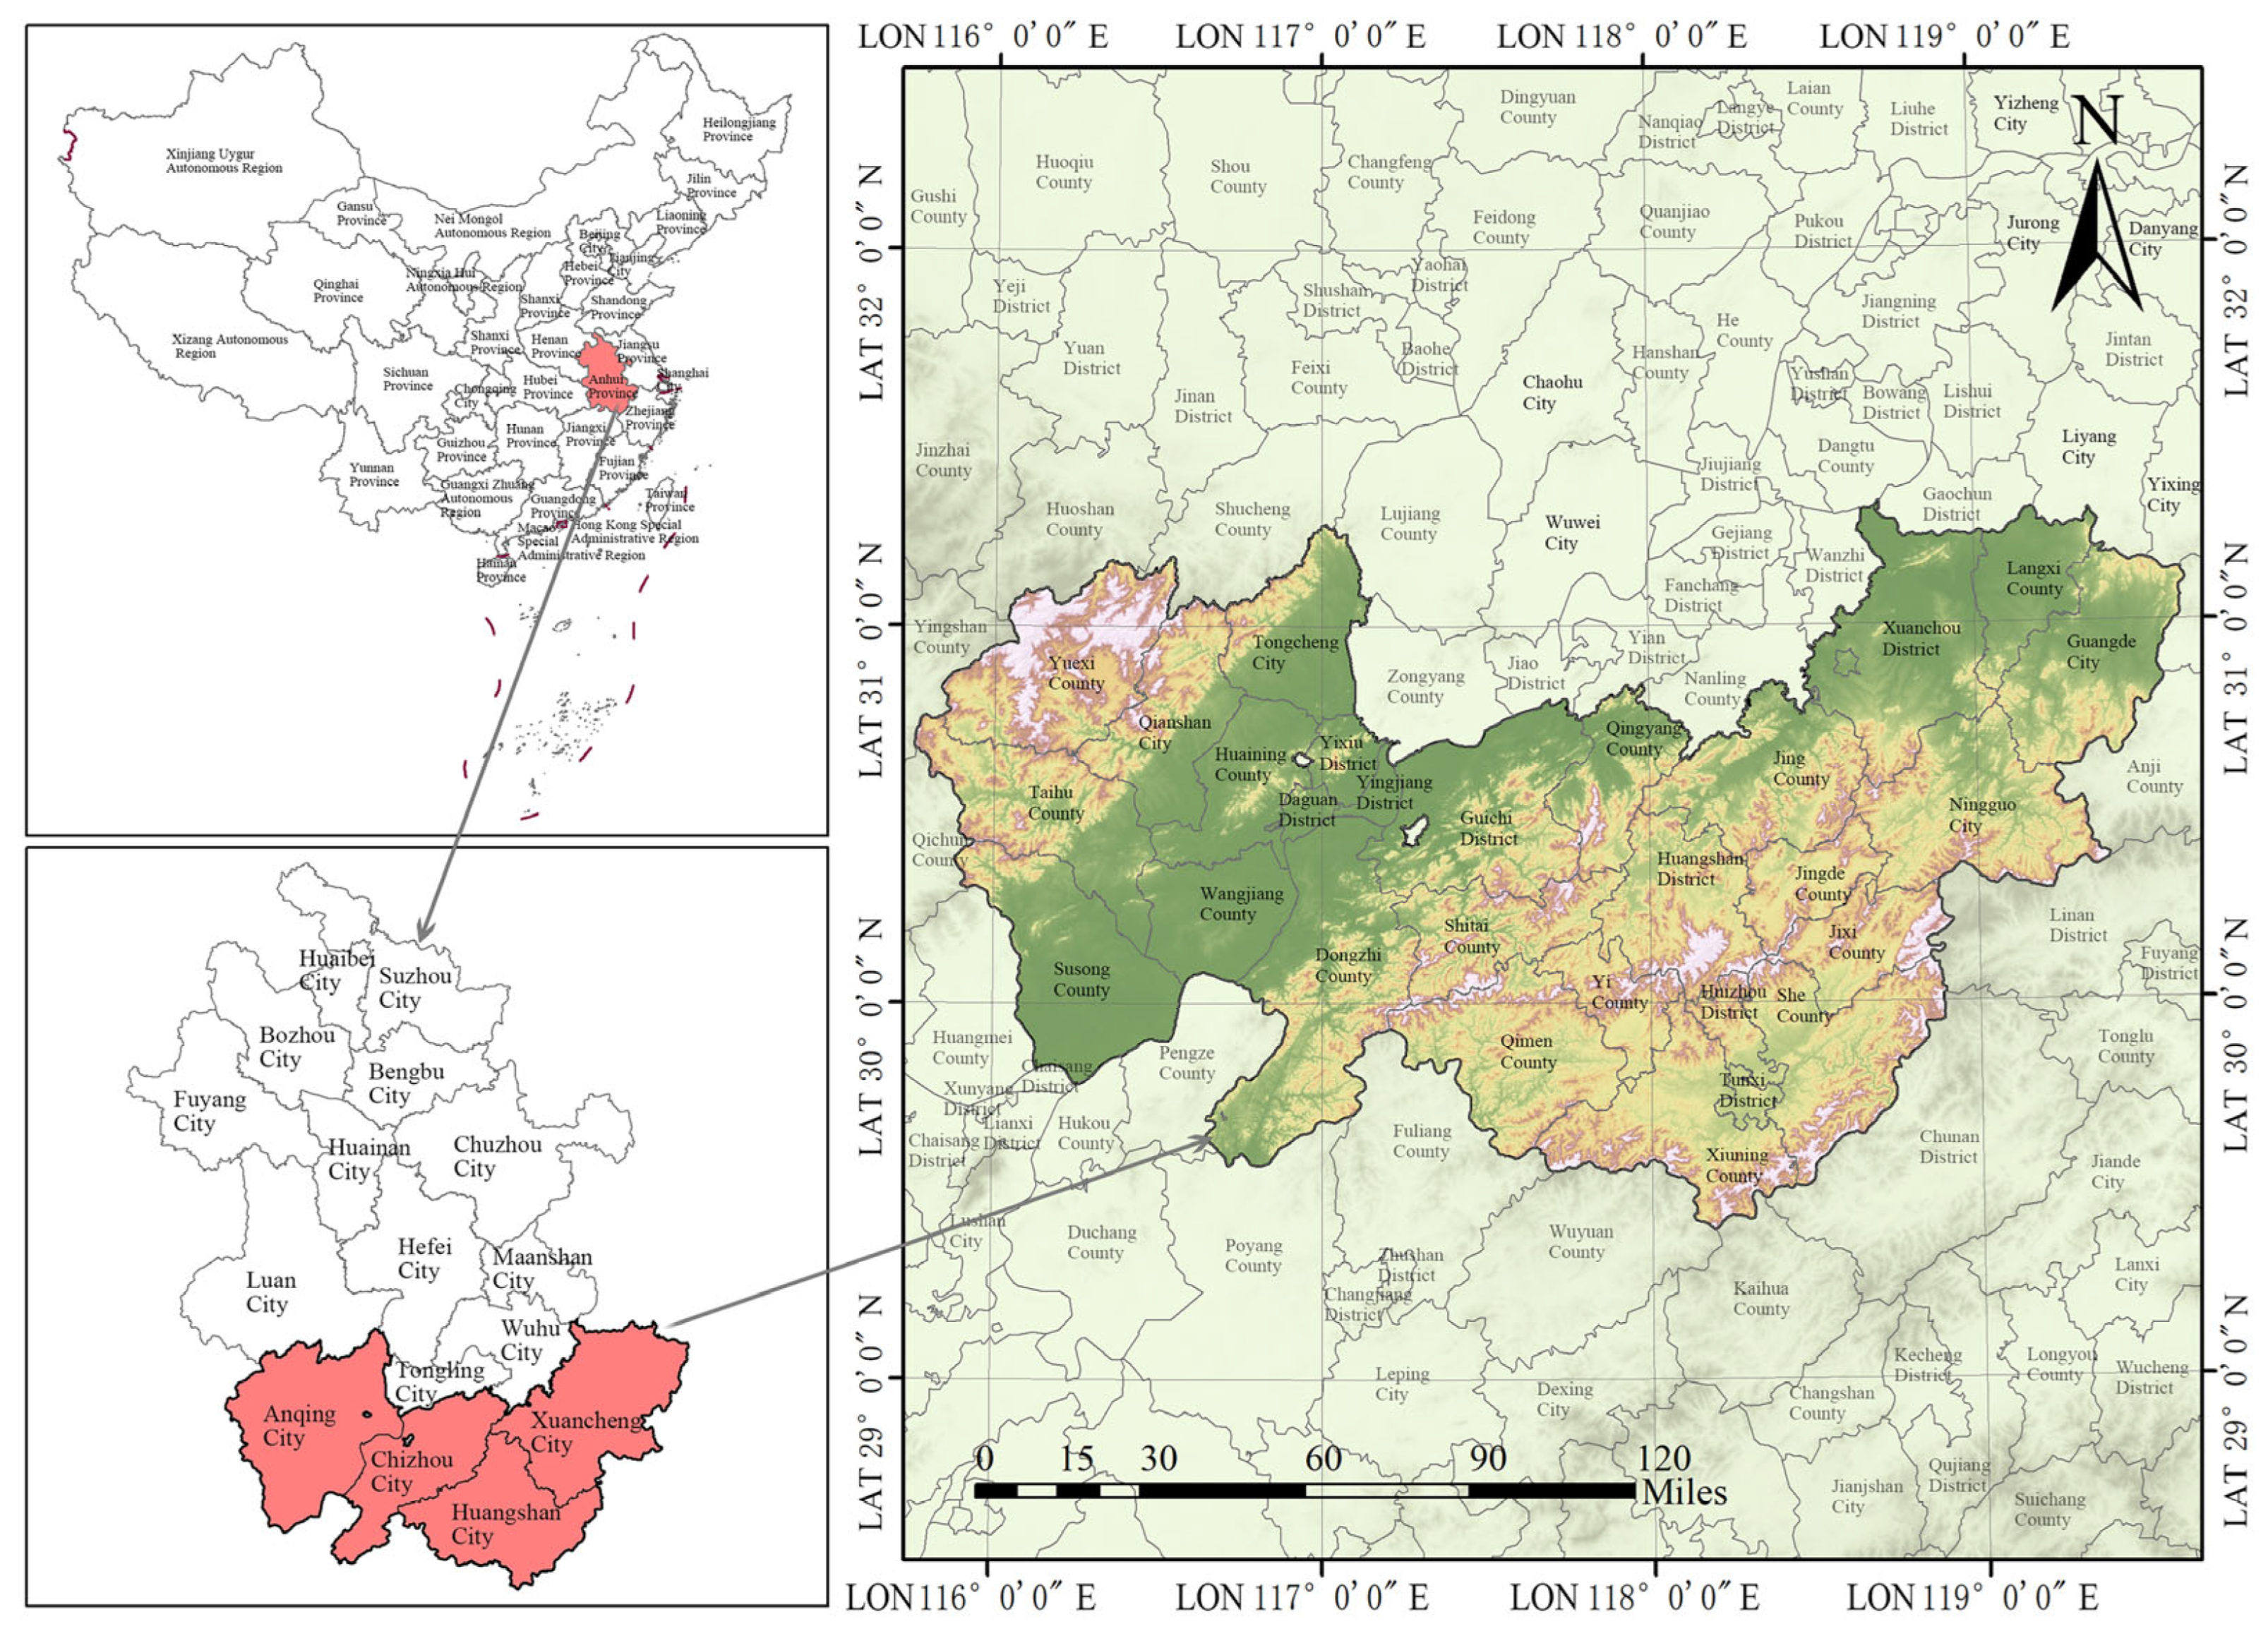
The Great Mount Huang district covers the entire territories of Huangshan, Anqing, Chizhou, and Xuancheng in Anhui Province, comprising 28 counties, cities, and districts (Figure 1). It is home to prominent mountain ranges such as Mount Huangshan, Jiuhua Mountain, and Mount Tianzhu. Located within the Yangtze River Basin and characterized by a dense river network, the region serves as both the core area and radiation zone of Huizhou culture. It encompasses 227 A-rated scenic areas and 447 nationally recognized historical and traditional villages. As one of China’s eight national A-rated scenic area clusters and one of 11 national homestay clusters, the region possesses exceptionally rich and diverse tourism resources. Drawing on its advantages in natural landscapes, cultural heritage, and ecological resources, the Great Mount Huang district has developed 15 premium tourism routes in three categories: cultural tourism, health and wellness, and educational travel.
For this study, research subjects were drawn from official lists of tourism villages released by government agencies, including the Ministry of Culture and Tourism, the Ministry of Agriculture and Rural Affairs, the Anhui Provincial Department of Culture and Tourism, and the Anhui Provincial Department of Housing and Urban–Rural Development (Table 1). After removing duplicate entries, 235 tourism villages were identified as research subjects as of February 2025.

2.2. Data Sources and Processing

The administrative boundary maps used in this study were obtained from the National Geographic Information Public Service Platform (https://www.tianditu.gov.cn/, accessed on 2 July 2025), map review number: GS(2024)0650 standard map. The 30 m resolution digital elevation data (GDEMV3) for the Great Mount Huang district were sourced from the Geospatial Data Cloud Platform (https://www.gscloud.cn/search, accessed on 2 July 2025). Terrain attributes, including slope, aspect, elevation, and water systems, were derived from the DEM data. The coordinates of 235 tourism villages were extracted using the Baidu Maps coordinate extraction system (https://lbsyun.baidu.com/maptool/getpoint, accessed on 2 July 2025), and subsequently converted to the China Geodetic Coordinate System 2000 (CGCS2000) using the GeoHey tool in QGIS. All spatial data were processed in ArcGIS 10.8 under the CGCS2000 projection coordinate system (Figure 2). Population and economic data were obtained from the 2024 statistical yearbooks of the respective cities and regions.

2.3. Research Methods

2.3.1. Spatial Distribution Features Analysis Method

(1)
Nearest Neighbor Index (NNI)
An important indicator used to analyze spatial point patterns, The distance between each point and its nearest neighbor was measured (Equation (1)) and compared with the expected distance under a random distribution (Equations (2) and (3)), it is a statistical measure used to determine whether spatial points are clustered, random, or uniform. The formula is as follows:
d ¯ = 1 n i = 1 n d i
d E = 1 n / A 2
N N I = d ¯ d E
In the formula, di is the distance from each point to its nearest neighbor, i = 1, 2, 3,..., n, where n is the total number of points, A is the area of the spatial region, d ¯ is the average of these distances, and dE is the expected nearest neighbor distance under random distribution, and NNI represents the nearest neighbor index. If NNI approaches 1, it indicates that the spatial points are randomly distributed, with no obvious clustering or uniform distribution features. If NNI < 1, it indicates that the spatial points are clustered. If NNI > 1, it indicates that the spatial points are dispersed or competitive.
(2)
Coefficient of Variation
A statistical measure that standardizes the standard deviation as a percentage of the mean, used to measure the relative dispersion of data, which can be used to analyze the distribution type of tourism villages. The formula is as follows:
C V = S V × 100 %
In the formula, CV is the coefficient of variation, S is the standard deviation of the Thiessen polygon area, and V is the average area of Thiessen polygons. If CV > 64%, it is a clustered distribution; if CV < 33%, it is a uniform distribution; if 64% ≥ CV ≥ 33%, it is a random distribution.
(3)
Imbalance Index
This index reflects the degree of uniformity or disparity in the distribution of tourism villages across different regions within a given area. The formula is as follows:
S = i n Y i 50 n + 1 100 n 50 n + 1
In the formula, n represents the number of research areas, and Yi denotes the percentage of the i-th position in the descending order of the proportion of tourism villages in each prefecture-level city in research Areas. For this study, the research areas are divided into the municipal level and the county and district level within each city. S represents the imbalance index, with values ranging from 0 to 1. A higher S value indicates a more concentrated distribution of tourism villages and significant regional disparities.
(4)
Geographic Concentration Index
This index intuitively reflects the concentration or dispersion of geographic phenomena in space, providing a quick understanding of the spatial distribution pattern of the research object. The formula is:
G = 100 × i = 1 n x i T 2
In the formula, G represents the geographic concentration index, n represents the number of regions, xi represents the number of tourism villages in the i-th region, and T represents the total number of tourism villages. The larger the G value, the more concentrated the distribution. G0 represents the uniform geographic concentration index. If G > G0, it indicates that the distribution of tourism villages is concentrated.
(5)
Kernel Density Analysis
Based on kernel functions, data points are smoothed to estimate the density distribution of data in space or other dimensions. This can be used to reflect the differentiated distribution of tourism villages. The higher the kernel density value, the more concentrated the spatial distribution. The formula is as follows:
f ( x ) = 1 n h i = 1 n K x x i h
In the formula, f(x) is the density function, n is the number of data points, h is the bandwidth, K is the kernel function, and xi is the position of the i-th data point. A larger bandwidth parameter produces a smoother and more generalized density raster, whereas a smaller bandwidth parameter yields a raster with more detailed information.
(6)
Spatial Autocorrelation
Spatial autocorrelation refers to the statistical relationship between attribute values at a given location and those at neighboring locations within a geographic space. Its core principle is that “attributes in adjacent areas tend to be more similar or more dissimilar,” reflecting a key characteristic that differentiates geographic data from conventional data. Depending on the direction of association between neighboring attribute values, spatial autocorrelation can be classified as either positive or negative. In this study, Moran’s I index is employed to quantify the overall spatial autocorrelation of tourism villages across the research area. The calculation formula is as follows:
I = n n = 1 n j = 1 n W i j x i x ¯ x j x ¯ n = 1 n j = 1 n W i j i = 1 n x i x ¯ 2
n denotes the total number of spatial units; xi and xj represent the attribute values of the i-th and j-th spatial units, respectively; x ¯ is the average value of all unit attribute values; Wij is an element of the spatial weight matrix, defining the adjacency relationship between units i and j. Moran’s I ranges from −1 to 1. Values closer to 1 indicate stronger positive correlations, values closer to −1 indicate stronger negative correlations, and values close to 0 indicate no correlation.
Hotspot analysis is a spatial statistical method used to identify areas where attribute values are significantly higher (“hotspots”) or lower (“coldspots”) than their surroundings. At its core, it visualizes and tests the significance of local spatial autocorrelation patterns. The Getis-Ord G i * index is the most commonly used measure for hotspot and coldspot analysis. Unlike measures of general spatial autocorrelation, it emphasizes the degree of clustering of high or low values rather than the similarity or dissimilarity between neighboring units, producing results that more directly correspond to the concepts of “hotspots” and “coldspots.” The calculation formula is as follows:
G i * d = j = 1 n W i j d x j j = 1 n x j
This formula employs the same parameters as Formula (8). The standardized Z-value from the Getis-Ord G i * index is used as the value field. Employing the natural breakpoint method, it is divided into five levels: hotspot areas, sub-hotspot areas, non-significant areas, sub-coldspot areas, and coldspot areas. These correspond to high-value clusters and low-value clusters of tourism villages within the spatial region.

2.3.2. Methods for Analyzing Influencing Factors

(1)
Geographic Detector (GD)
A statistical method proposed by Chinese scholar Wang Jinfeng and his team for analyzing the spatial differentiation of geographical phenomena and their driving factors [47]. Factor detection is represented by the q-value, which ranges from 0 ≤ q ≤ 1. The closer q is to 1, the stronger the ability to explain the spatial differentiation of the phenomenon. The results of dual-factor interaction detection can be classified into five types (Table 2). Among them, dual-factor enhancement indicates that the explanatory power of the interaction exceeds that of either factor individually, while nonlinear enhancement indicates that the explanatory power of the interaction surpasses the combined explanatory powers of the two factors acting independently.
(2)
Geographically Weighted Regression (GWR)
This is a local regression model used to analyze spatial data [48]. By considering the non-stationarity of spatial locations, it addresses the issue that traditional global regression methods (such as ordinary least squares OLS) cannot capture spatial heterogeneity. It can be used to analyze the differentiated effects of influencing factors on tourism villages in different regions.

3. Results

3.1. Spatial Distribution Features

3.1.1. Spatial Distribution Types

Using the Average Nearest Neighbor tool in ArcGIS 10.8, the spatial distribution of tourism villages in the Great Mount Huang district was analyzed. The observed mean distance was 6.231 km, while the expected mean distance was 6.837 km. The nearest neighbor index (NNI) was calculated as 0.911, with a Z-value of −2.601 and a p-value of 0.009, indicating that the spatial distribution of tourism villages is significantly clustered. To further validate this result, Thiessen polygons were generated for the villages, and the coefficient of variation (CV) was calculated (Table 3). The CV value of 88.98% (>64%) provided additional evidence of significant clustering. Moreover, tessellated polygons were created for the villages in the four cities of the Great Mount Huang district, and the CV values were calculated for each (Table 3). The results reveal that all four cities exhibit a clustered distribution, with Anqing City showing the highest degree of clustering, followed by Chizhou City, while Huangshan City and Xuancheng City demonstrate relatively lower clustering levels.

3.1.2. Degree of Spatial Distribution Balance

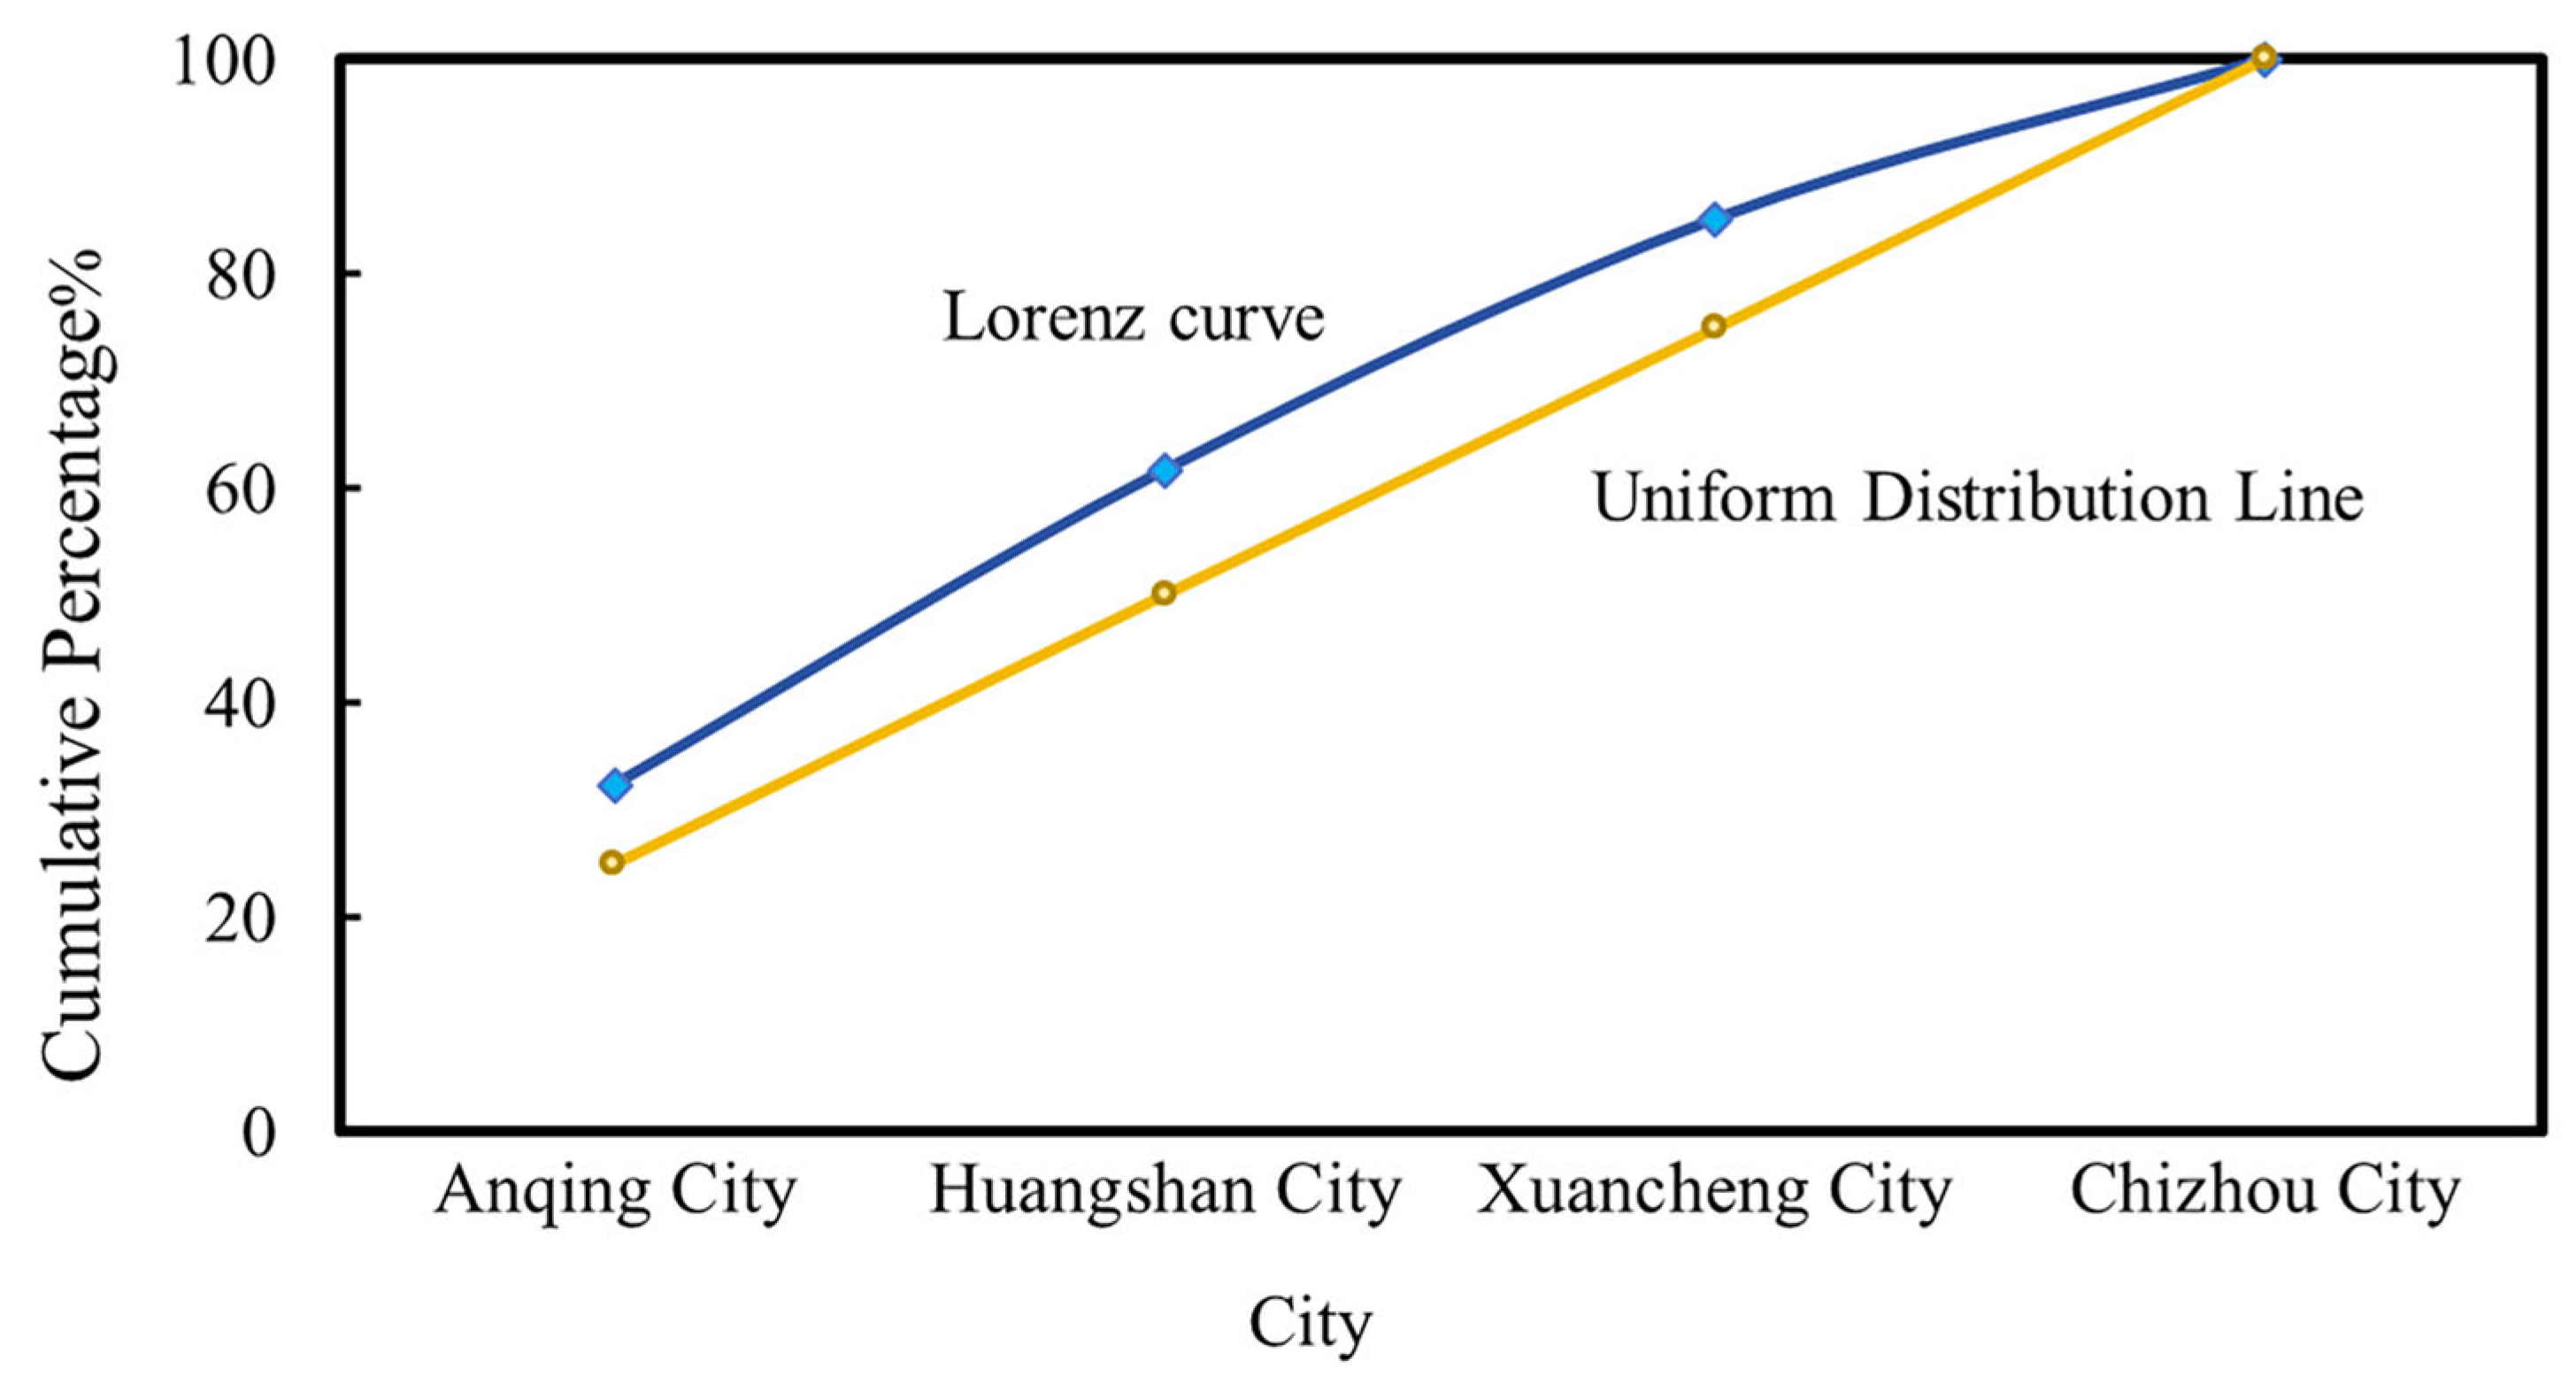
Based on the imbalance index formula, the S value for the Great Mount Huang district is 0.194 (Table 3), indicating a relatively low degree of imbalance in the spatial distribution of tourism villages. Using the statistical data of tourism villages in each city, a Lorenz curve was constructed (Figure 3). Compared with the line of uniform distribution, the Lorenz curve displays a clear upward deviation and pronounced curvature, further demonstrating that the spatial distribution of tourism villages in Anhui Province is uneven. The imbalance indices for each city in the Great Mount Huang district were also calculated (Table 3), revealing that all cities exhibit some degree of imbalance. Among them, Anqing City shows the highest imbalance, followed by Chizhou City, while Huangshan City and Xuancheng City display relatively lower levels of imbalance.

3.1.3. Spatial Distribution Aggregation Features

According to the geographical concentration index formula, the G value for the Great Mount Huang district is 51.75 (Table 3). If the 235 tourism villages in the region were uniformly distributed across the four cities, the uniform geographical concentration index (G0) would be 50.00. Since G > G0, this indicates that the distribution of tourism villages in the Great Mount Huang district is relatively concentrated. The geographical concentration indices and the corresponding uniform indices for each city in the region were calculated separately (Table 3). The results show that Anqing City has the highest concentration, followed by Chizhou City, while Huangshan City and Xuancheng City display relatively lower levels of concentration.
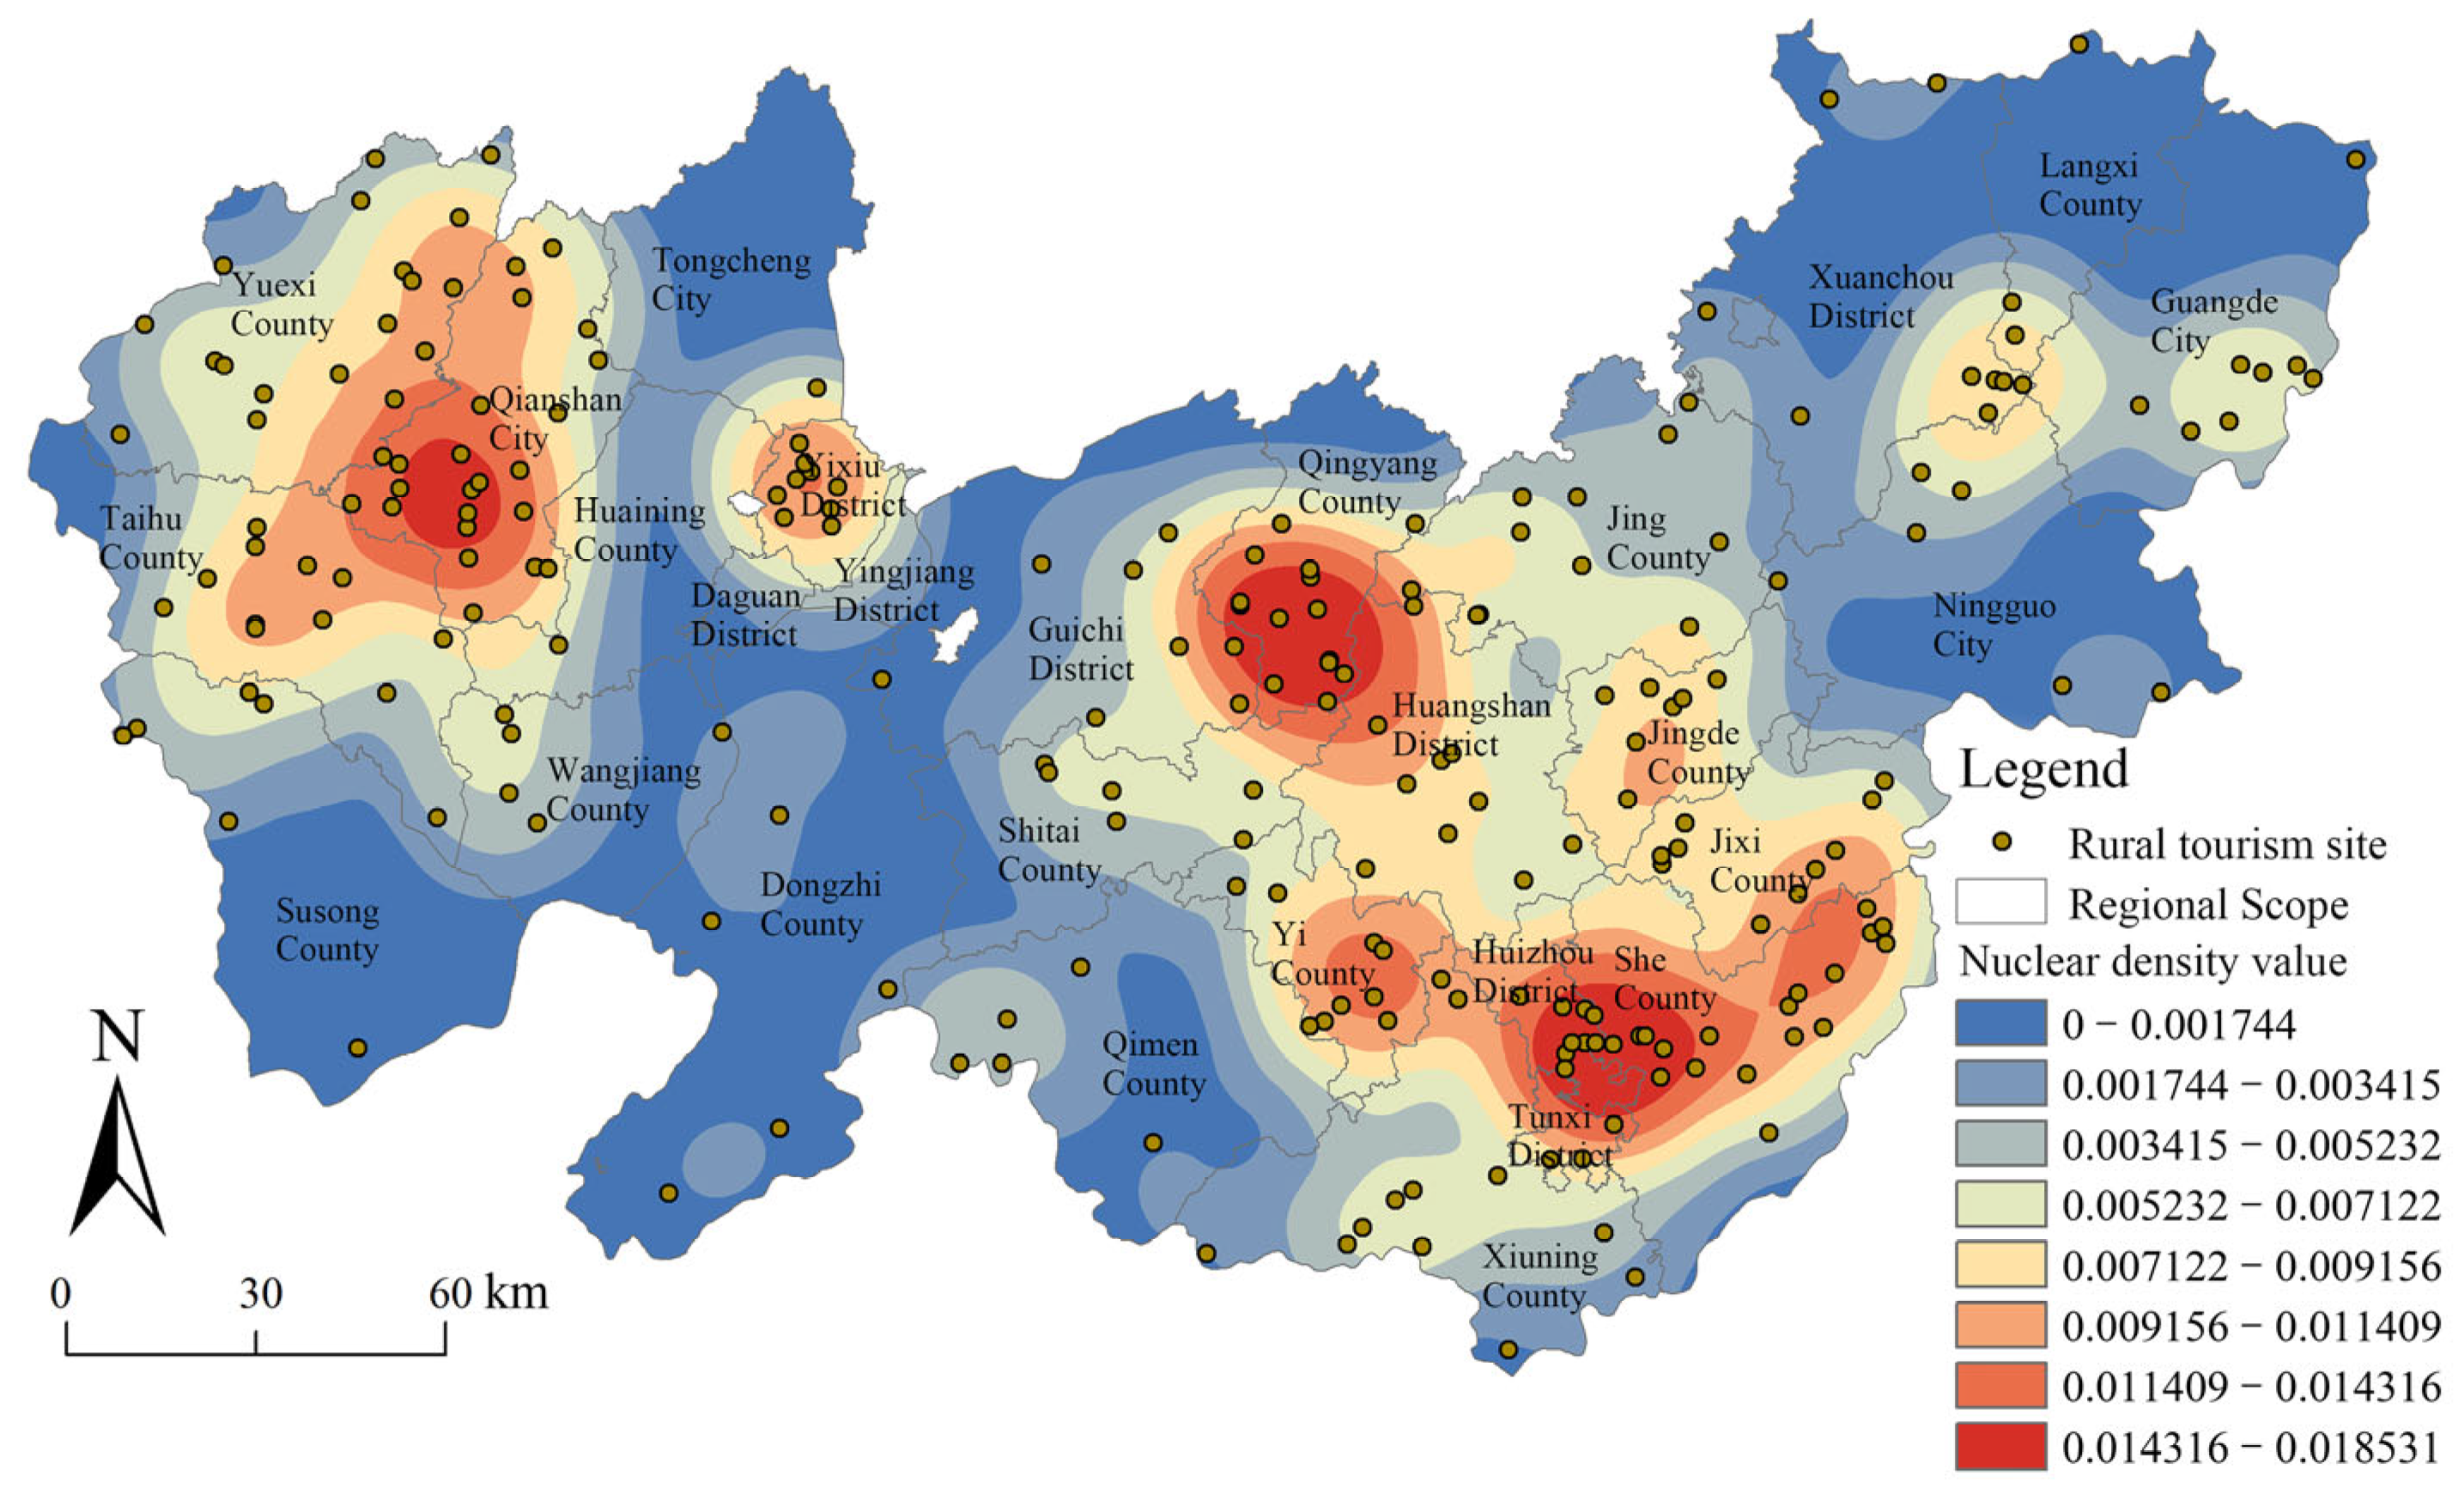
In kernel density analysis, bandwidth is a key parameter. Using the ArcGIS 10.8 kernel density analysis tool, multiple trials were conducted with varying bandwidth values. A bandwidth of 27 km was ultimately selected, with the analysis area restricted to the administrative boundaries of the Great Mount Huang district. The Gaussian kernel function was applied by default to generate the kernel density distribution map (Figure 4), the kernel density values are classified using natural breakpoints. The results show that the spatial distribution of tourism villages in the Great Mount Huang district is characterized by three prominent high-density zones, forming a “one cluster, two cores, and three points” spatial pattern. The essence is reflected in the application of the core-periphery theory to the spatial distribution of tourism villages. This is manifested as a clear spatial differentiation between highly concentrated core zones, centered on key resources, and peripheral zones with weaker resource endowments that depend on the radiation effects of the core. Moreover, the core and periphery maintain synergistic connections through the flow of elements such as tourist traffic, capital, and information.
The “one cluster” refers to the high-density cluster centered on Huangshan City’s Huizhou District, She County, and Tunxi District, extending to Yi County, Xiuning County, and Jixi County in Xuancheng City. Integrating top-tier resources, a core transportation hub, and a cultural heartland, this area serves as the “growth pole nucleus” for tourism village development in the Great Mount Huang district. With rich Huizhou cultural heritage and world-class natural sites such as Huangshan Scenic Area, as well as UNESCO World Cultural Heritage villages like Hongcun and Xidi, it forms a core attraction that drives the development of surrounding tourism villages. Additionally, Tunxi District functions as a transportation hub, acting as the regional center for passenger flow and channeling visitors to peripheral villages via major transportation arteries. This establishes a closed-loop “passenger flow–revenue” system between the core and surrounding villages. The two secondary cores, centered on Qianshan City in Anqing and Qingyang County in Chizhou, leverage major resources such as Tianzhu Mountain and Jiuhua Mountain. Coupled with distinctive local cultures, they form secondary growth poles that correspond to the “secondary core zones” in core-periphery theory. These areas benefit from the indirect influence of the primary core while establishing localized “small core–small periphery” systems based on their own resources, filling development gaps in the southern and western parts of the Great Mount Huang district. The presence of these secondary cores mitigates the risk of a single-core monopoly in regional rural tourism, promoting a “primary core-led, secondary core-supplemented” development framework that narrows intra-regional disparities. The three points—Yixiu District with its suburban location advantage, Jingde County with distinctive resources, and Xuanzhou District as a regional center—represent “growth nodes in peripheral zones” within the core-periphery framework. Although lacking sufficient resources to form core zones, they act as connecting links between core areas and peripheral villages, alleviating development gaps and serving as effective supplementary nodes within the Great Mount Huang tourism network.

3.1.4. Distribution Characteristics of Thermal Hotspots and Coldspots in Space

Using Moran’s I spatial autocorrelation tool in ArcGIS 10.8, tourism village kernel density values at the county district level were employed to assess the global spatial autocorrelation of the Great Mount Huang district. Euclidean distance was used for the spatial autocorrelation analysis. The results indicate a global Moran’s I index of 0.3745, with a z-score of 2.949 and a p-value of 0.003, suggesting that the probability of spatial clustering exceeds 99% and demonstrating a significant positive spatial correlation.
Subsequently, hotspot analysis was conducted using the ArcGIS 10.8 Getis-Ord Gi* tool. Natural breakpoint classification divided the region into cold spots, sub-cold spots, insignificant zones, sub-hot spots, and hot spots (Figure 5). Hotspot areas were primarily concentrated in Huizhou District, Tunxi District, She County, and Xiuning County of Huangshan City, while sub-hotspot areas clustered around these hotspots, notably in Huangshan District, Jingde County, and Jixi County. Sub-coldspot areas were observed in Wangjiang County of Anqing City and Xuanzhou District of Xuancheng City. Coldspot areas were distributed in Dongzhi County of Chizhou City, Langxi County, and Guangde City of Xuancheng City. The remaining counties and districts exhibited a relatively balanced distribution of hot and cold spots, representing transitional zones. The hot and sub-hot zones coincide with the most abundant tourism and cultural resources in the Great Mount Huang district, whereas cold and sub-cold zones lie at the periphery of the three core tourism resource areas. These results indicate that future efforts should focus on enhancing the flow of resources between peripheral zones and the core areas to promote balanced tourism development.

3.2. Factors Affecting the Spatial Distribution of Tourism Villages

Rural tourism capitalizes on ecological and cultural resources, while benefiting from supportive central and local government policies, to promote the flow of resources between urban and rural areas through the tourism industry, thereby advancing rural revitalization. As a key pathway for tourism development in the Great Mount Huang district, examining the factors influencing the distribution of tourism villages is crucial for fostering high-quality tourism development in the region and for promoting urban–rural integration and rural revitalization in Anhui Province. Drawing on a synthesis of existing research, ten influencing factors were identified across four dimensions: natural environment, socio-economic conditions, regional transportation, and tourism culture. These factors were used to analyze the spatial distribution of tourism villages in the Great Mount Huang district (Table 4).

3.2.1. Geographic Detection Analysis

(1)
Single-factor Detection Analysis
Within the Great Mount Huang district, a 5 × 5 km grid system was established, accompanied by corresponding point features for spatial analysis. Population size, per capita disposable income, urbanization rate, DEM data, and other relevant metrics from counties and districts within the Great Mount Huang district were rasterized alongside tourism village point data using ArcGIS 10.8. Natural breakpoint classification was then applied to divide the raster data into five categories. The reclassified values were subsequently extracted to the grid point features and exported into a point feature attribute table. This attribute table was imported into the Excel 2007—based geographic detector software to perform the influencing factor detection analysis (Table 5). The analysis shows that all factors exert a certain explanatory power on the spatial distribution of tourism villages, with all p-values passing the 0.01 significance level. Among them, X41 (A-level tourist attractions) and X42 (cultural resources) have q-values greater than 0.5, indicating substantially stronger explanatory power than other factors; these are therefore classified as dominant factors. X11 (average elevation), X12 (average gradient), X13 (river system), X22 (road traffic), and X33 (urbanization rate) have q-values above 0.2 and are classified as primary factors, while the remaining variables are considered general factors. Overall, tourism culture emerges as the most significant factor influencing the distribution of tourism villages, followed by the natural environment, whereas socio-economic conditions have the weakest effect.
(2)
Multi-factor Interaction Analysis
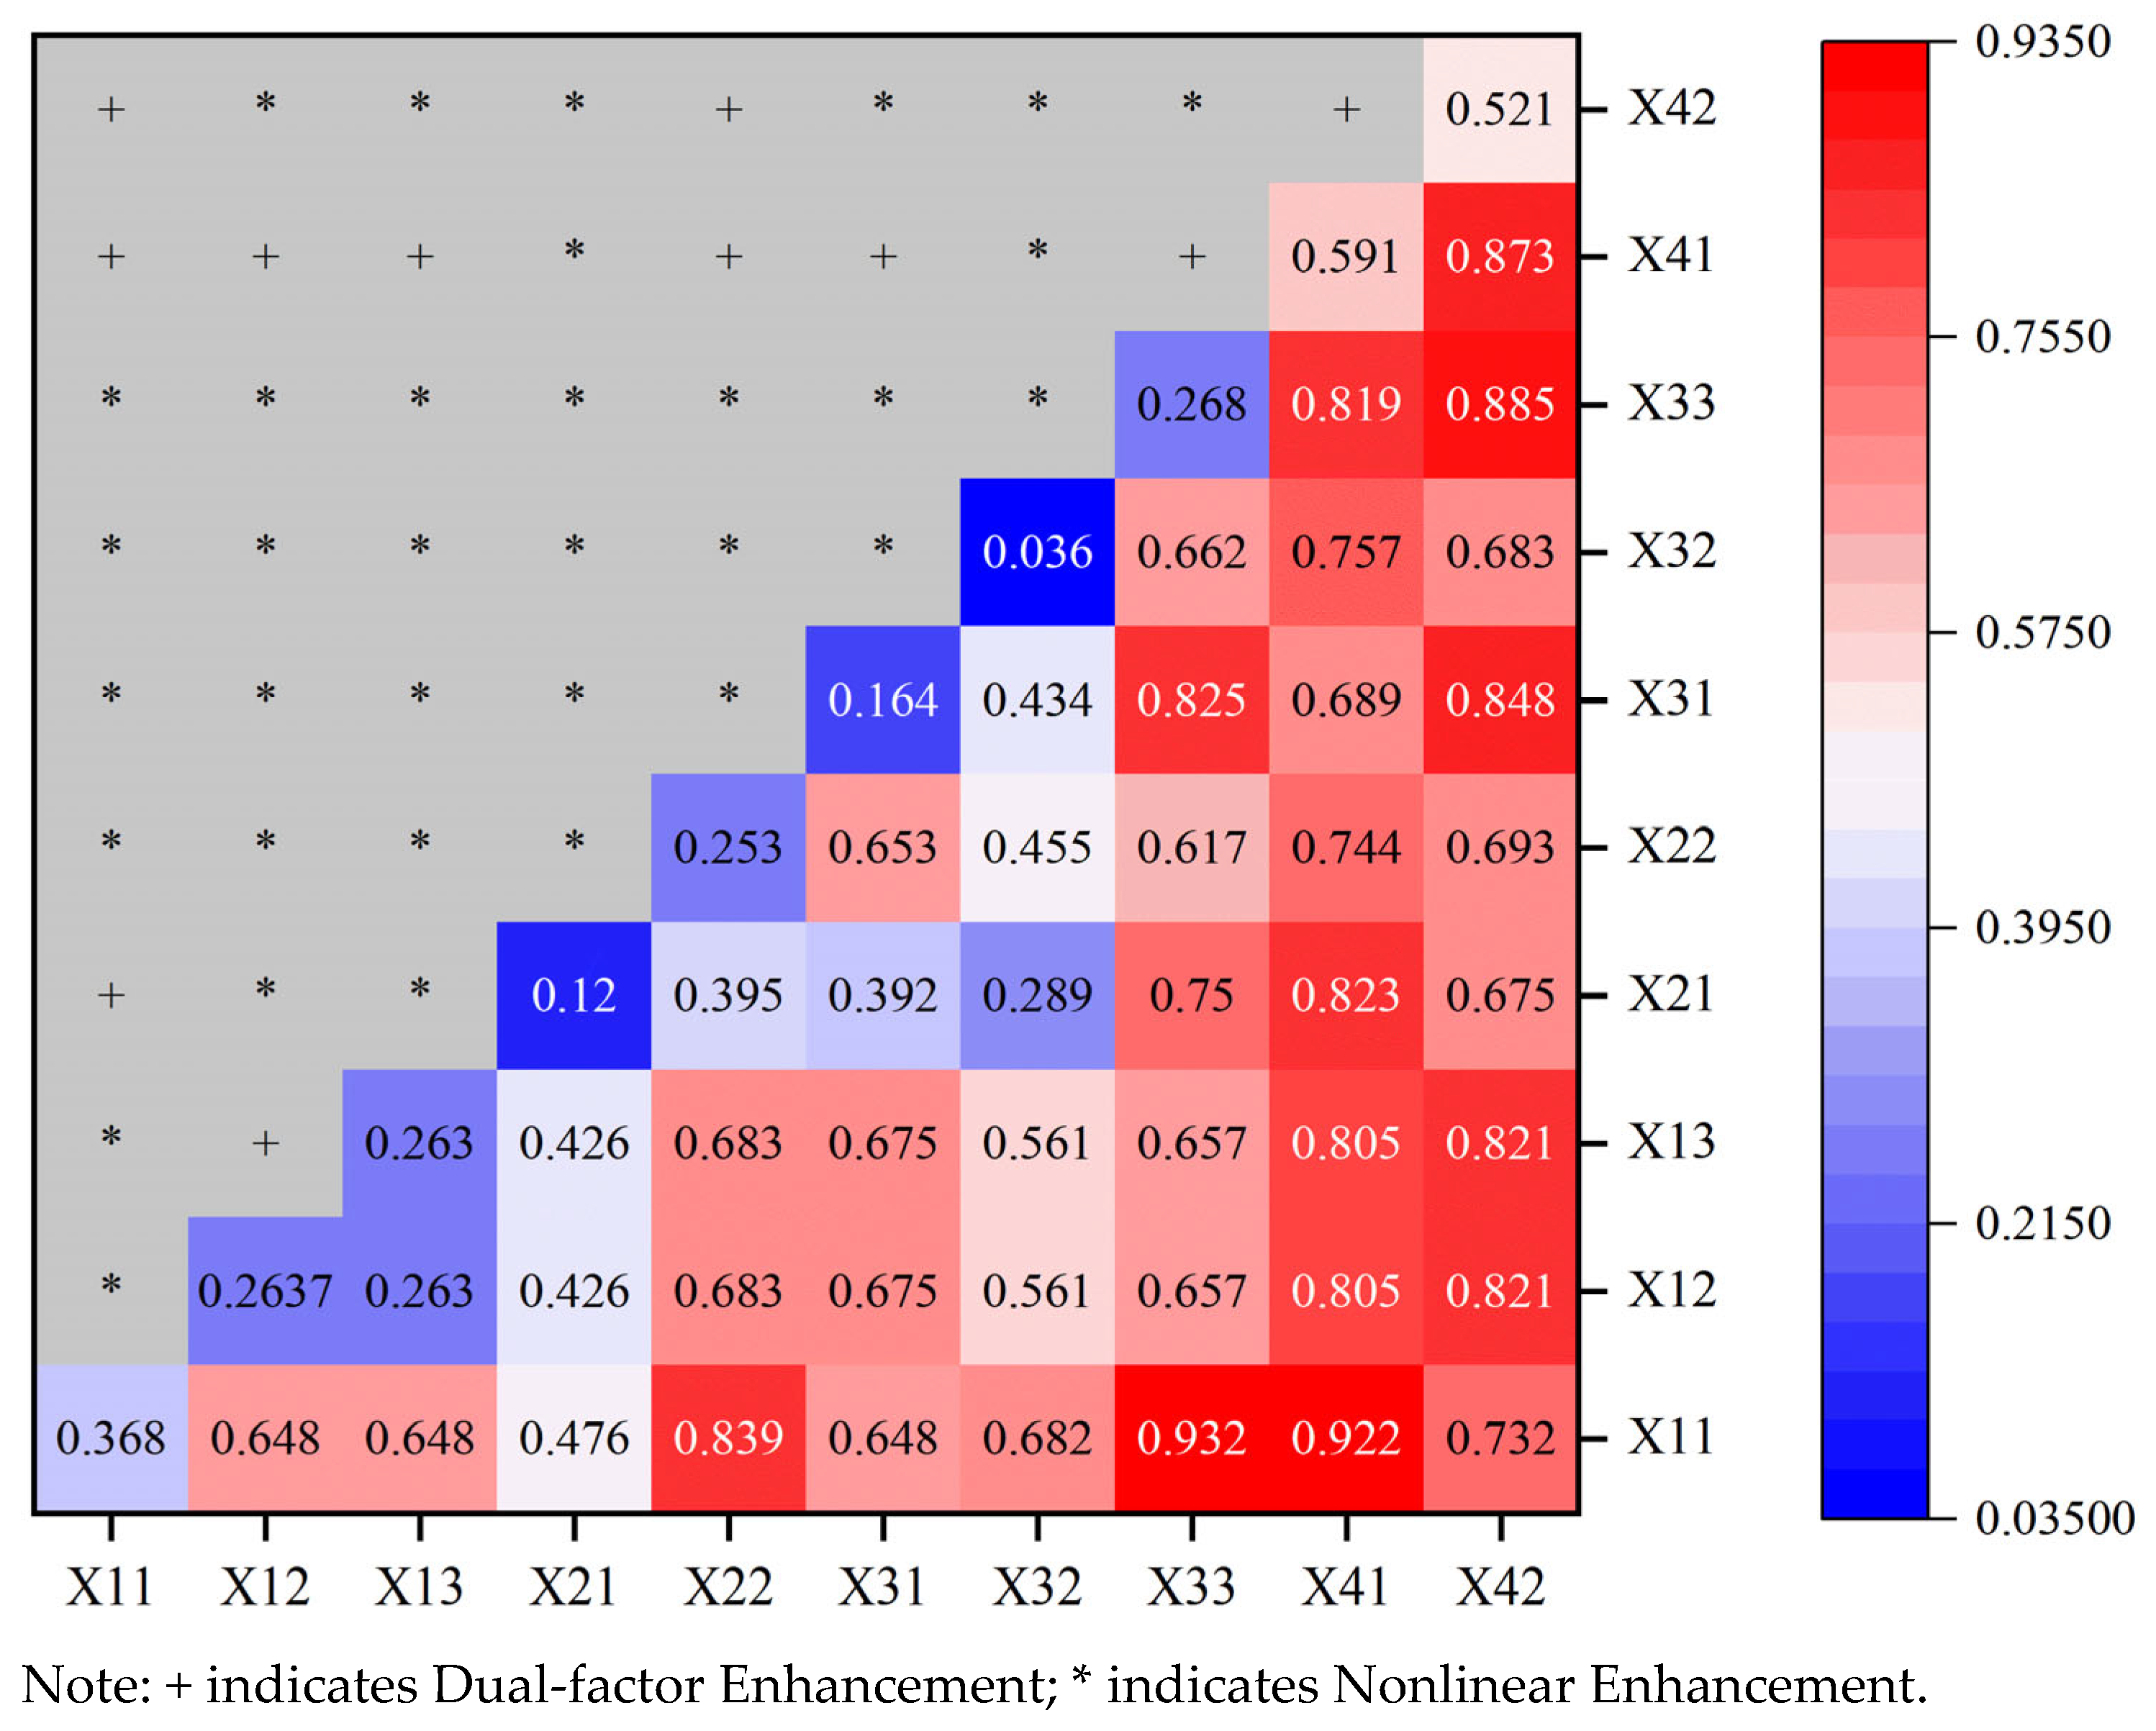
A multi-factor interaction analysis was conducted using the Excel 2007—based geographic detector software (Figure 6). The results revealed that the top five factor interactions with the highest q-values were: X11 average elevation ∩ X33 urbanization rate, X11 average elevation ∩ X41 A-level tourist attractions, X31 population size ∩ X42 cultural resources, X33 urbanization rate ∩ X42 cultural resources, and X41 A-level tourist attractions ∩ X42 cultural resources. After pairwise interactions among all factors, q-values consistently increased, with interaction types primarily characterized as nonlinear enhancement and two-factor enhancement. This finding indicates that the combined influence of two factors is stronger than the effect of a single factor on the distribution of tourism villages in the Great Mount Huang district [49]. Therefore, a comprehensive analysis of the spatial distribution of tourism villages in this region must account for multiple interacting factors.

3.2.2. Analysis of Differences in Factors Affecting GWR

The Geographically Weighted Regression (GWR) model was constructed to further examine regional differences in the effects of influencing factors in the Great Mount Huang area. First, an OLS linear regression analysis was conducted on the data. Diagnostic results indicated that the variance inflation factors (VIF) for all influencing variables ranged from 1.40 to 3.01, with all values below 7.5, suggesting no significant multicollinearity and confirming the feasibility of constructing a GWR model. Using MGWR 2.2 software, a GWR model was developed with standardized data, employing a fixed Gaussian kernel function, golden search bandwidth, and a projected coordinate system. The GWR model yielded an AICc value of 72.666, representing a reduction of 83.996 compared to the OLS model (Table 6), indicating superior balance between model fit and parameter complexity, effectively avoiding overfitting while enhancing prediction accuracy and stability. Although the adjusted R2 of the GWR model is 0.037 lower than that of the OLS model, this difference is within an acceptable range and does not substantially compromise the model’s explanatory power. Therefore, the GWR model is deemed more suitable than the OLS model. Spatial autocorrelation analysis of the standardized residuals using Moran’s I index produced a value of −0.0947, indicating a random spatial distribution and further validating the model’s effectiveness [50].
Through the construction of the GWR model, regression coefficients were obtained for each influencing factor, including the mean, standard deviation, minimum, maximum, median, estimated coefficients, and bandwidth (Table 7). Spatial variability across factors was assessed based on the maximum, minimum, and median values. Average slope, distance to townships, road density, and urbanization rate exhibited negative correlations. Relatively low spatial variability was observed for average elevation, average slope, distance to townships, and urbanization rate, whereas road density, the number of Grade A tourist attractions, per capita disposable income, and cultural resources showed significant spatial variation. To visually represent these spatial variations across counties, regression coefficients were classified using the natural breakpoint method in ArcGIS 10.8 and subsequently visualized.
(1)
Natural Environment
Average elevation is identified as a primary influencing factor. As shown in Figure 7a, The influence on the distribution of tourism villages follows a ‘higher in the west, lower in the east’ pattern, with a regression coefficient difference of 0.003, indicating minimal spatial variation and a positive correlation. In the context of tourism development in the Great Mount Huang district, government planning emphasizes the utilization of world-class tourism resources such as Xidi, Hongcun, Huangshan Mountain, Jiuhua Mountain, and Tianzhu Mountain. These mountain ranges are distributed across all four cities of the region, and although elevation exerts the strongest influence in northern Anqing City, the overall variation in impact across the region remains relatively small. Statistical analysis of village elevation (Table 8) shows a declining number of tourism villages with increasing altitude. Mid-to-low elevation zones constitute the core areas for tourism village development, characterized by gentle terrain, convenient accessibility, lower disaster risks, and reduced infrastructure costs. Such conditions not only facilitate large-scale tourism development but also enhance their suitability for mass tourism activities and long-term habitation.
Average slope is another key factor. As shown in Figure 7b, the influence of slope on the distribution of tourism villages displays a “higher in the south, lower in the north” pattern, with regression coefficients indicating a negative correlation. The southern part of the region is generally characterized by steeper terrain, where topography imposes stronger constraints on village development and thus exerts a greater impact. In contrast, the northern part features gentler slopes, weaker constraints, and consequently a lower influence of slope. The regression coefficient difference is only 0.002, reflecting limited spatial variability. This pattern arises from the relatively stable topographic structure across the Great Mount Huang district, which results in a consistent mechanism of slope influence on village distribution. Although the degree of impact varies between the south and north due to inherent slope differences, the overall variability remains low, indicating that slope exerts a relatively balanced effect across the region. The slope grades of the Great Mount Huang district were classified according to the international slope classification system for topographic maps. A statistical analysis of the slopes where rural areas are located (Table 8) shows that the majority of tourism villages are distributed on the slope, followed by mild slopes. This suggests that slopes below 15° are the core areas for tourism village development. Such slopes provide relatively gentle terrain, lower infrastructure construction and maintenance costs, and a balance of terrain variability and ecological stability, making them suitable for large-scale tourism activities and long-term residence.
River network density is a primary factor. As shown in Figure 7c, its influence on the distribution of tourism villages follows a ‘higher in the west, lower in the east’ pattern, with a regression coefficient difference of 0.010. The spatial variation is relatively small, indicating a positive correlation. River systems provide multiple tourism values and functions. They not only shape distinctive landscapes and enhance the scenic appeal of tourism villages but also constitute essential resources for rural tourism by ensuring water security and supporting formats such as agritourism and waterside recreation. In addition, they improve the rural ecological environment and increase visitor attractiveness. Accordingly, higher water system density is more conducive to the clustering of tourism villages. Compared with the eastern part of the Greater Huangshan region, the western area possesses more developed tributaries and water networks, thereby offering stronger landscape value and resource support capacity, which significantly promotes the development of tourism villages. Multi-ring buffer analysis of water systems (Table 9) reveals that the density of tourism villages decreases as buffer distance increases. Villages located closer to rivers can better integrate productive and scenic functions, while a greater distance raises the costs of water access and diminishes landscape appeal, resulting in lower village density.
(2)
Regional Transportation
The distance between a tourism village and a township is a general factor influencing the spatial distribution of tourism villages. As shown in Figure 8a, it demonstrates a negative correlation, with its influence exhibiting a “higher in the west, lower in the east” pattern. The regression coefficient difference is 0.008, indicating relatively low spatial variability. The impact is strongest in Yuexi County, Taihu County, and Qianshan City, but less pronounced in Langxi County, Guangde City, and Ningguo City. Buffer analysis of township points confirms this negative correlation (Table 10): the number of tourism villages declines as buffer distance increases. This pattern reflects the role of townships as nodes of transportation and service provision. Well-developed transportation networks around townships facilitate the movement of goods and tourist flows, thereby supporting higher densities of tourism villages. In contrast, remote areas with weaker infrastructure and limited accessibility exhibit lower village densities.
Road traffic serves as a primary factor influencing the spatial distribution of tourism villages. As shown in Figure 8b, its influence follows a “higher in the west, lower in the east” pattern, with a regression coefficient difference of 0.016, indicating relatively high spatial variability. The correlation is negative: areas with higher road density generally contain fewer tourism villages. This occurs because regions with dense road networks are often urban cores or transportation hubs, where economies are dominated by industry and services, and intensive land development reduces available rural space. By contrast, areas with lower road density, though less accessible, tend to preserve village integrity and align with tourists’ pursuit of an “escape from the city” experience. The effect is most pronounced in Susong County and Taihu County, whereas it is weaker in Ningguo City, Xuanzhou District, and Langxi County. This disparity arises in part from Ningguo City and Xuanzhou District capitalizing on scenic routes such as the South Anhui Sichuan-Tibet Highway and the Bamboo Village Gallery to link tourism resources, thereby fostering favorable conditions for tourism village development. In contrast, Taihu County and Susong County primarily depend on national and provincial highways, whose networks serve agricultural and industrial transport rather than tourism functions, limiting their capacity to drive tourism village growth. A buffer analysis of roads and subsequent counting of rural tourism villages (Table 10) reveals that the highest concentration of villages occurs within 0.5 km of roads, while only three villages are located beyond 5 km, further demonstrating a negative correlation. This indicates that rural tourism villages are primarily concentrated in areas with convenient transportation, with numbers decreasing as the distance from roads increases in the Great Mount Huang district.
(3)
Socio Economics
Population size functions as a general factor influencing the distribution of tourism villages. As shown in Figure 9a, its impact follows an “east-high, west-low” pattern, with a regression coefficient difference of 0.010, indicating minimal spatial variation and a positive correlation, regions with higher population size typically have higher tourism villages. Population size and tourism village development reinforce one another. On the one hand, a sufficient population provides essential labor for constructing tourism facilities and delivering services. On the other, population concentration generates a stable consumer market that supports local demand for rural tourism and attracts external visitors through social network effects. The denser population distribution in the eastern Great Mount Huang district supplies richer labor resources and a larger consumer base, thereby exerting a stronger influence on tourism village development compared with the west. Nevertheless, across the entire region, population size supports tourism villages primarily through two consistent mechanisms: labor supply and consumer market formation. This dual pathway ensures relatively uniform effects on rural tourism development, resulting in minimal regional differentiation.
Per capita disposable income functions as a general factor influencing the distribution of tourism villages. As shown in Figure 9b, its impact exhibits a “higher in the west, lower in the east” pattern, with a regression coefficient difference of 0.015, indicating significant spatial variation and a positive correlation. The influence is most pronounced in counties such as Wangjiang, Susong, and Taihu, where a per capita disposable income difference of ¥5659 corresponds to a difference of 18 tourism villages. By contrast, in Langxi County, Guangde City, and Xuanzhou District, the effect is weaker, with a per capita disposable income difference of ¥12,837 but only a six-village difference. Rural tourism contributes to local employment through homestays, catering, guiding, and handicraft production, enabling residents to increase income within their own communities. In 2023, rural residents in Huangshan, Chizhou, and Xuancheng—excluding Anqing—recorded both higher per capita disposable incomes and faster income growth rates than the provincial average. This reflects a mutually reinforcing relationship: rural tourism stimulates household income growth, while rising incomes expand tourism consumption demand and accelerate tourism industry upgrading.
The urbanization rate is identified as a primary factor influencing the distribution of tourism villages. As shown in Figure 9c, it demonstrates a negative correlation, indicating that higher urbanization levels are associated with fewer tourism villages. Based on the absolute values of regression coefficients, its impact follows a “higher in the south, lower in the north” pattern, with a difference of 0.002, suggesting relatively limited spatial variation. The influence is particularly significant in Xiu’ning County, Tunxi District, and Qimen County, where the average urbanization rate is 44.95% and the number of tourism villages is nine. By contrast, Xuanzhou District, Guangde City, and Langxi County exhibit weaker impacts, with an average urbanization rate of 42.98% and six tourism villages. The analysis indicates that areas with medium to low urbanization rates constitute the core zones of rural tourism development. These regions avoid excessive urbanization, thereby preserving rural landscapes and cultural-ecological resources, while benefiting from government investment that fosters the concentration of tourism villages. In highly urbanized central districts, however, intensive land development and the relative scarcity of rural tourism resources limit village distribution.
(4)
Tourism Culture
A-level tourist attractions as a dominant factor. As shown in Figure 10a, their influence on the distribution of tourism villages follows a “higher in the west, lower in the east” pattern, with a regression coefficient difference of 0.011. This indicates significant spatial variability and a positive correlation. A-level tourist attractions generally possess strong tourism appeal and well-developed infrastructure, enabling them to form regional tourism hubs that stimulate the coordinated development of surrounding rural tourism sites. Such areas foster the clustering of rural tourism through the “scenic area radiation effect,” thereby serving as crucial drivers of rural tourism development. Their influence is most pronounced in Yuexi County, Taihu County, and Susong County, but relatively weak in Langxi County, Guangde City, and Xuanzhou District. This disparity may be attributed to the concentration of A-level tourist attractions in Yuexi and Taihu counties, where scenic zones overlap with rural spaces, encouraging longer visitor stays and accelerating the development of surrounding villages as complementary destinations. In contrast, Langxi County and Guangde City contain fewer A-level tourist attractions, limiting their capacity to promote rural tourism growth. Moreover, the spatial distribution of A-level tourist attractions is uneven, exhibiting both “clustered” and “scattered” patterns. Western regions often form clusters around core scenic areas, whereas attractions in the east are more dispersed. This unevenness creates marked differences in the range and intensity of their influence on rural areas. The strong driving effect of high-grade attractions in the west thus contrasts sharply with the weaker influence of medium- and low-grade attractions in the east, further reinforcing spatial disparities.
Cultural resources emerge as a dominant factor shaping the spatial distribution of tourism villages. As shown in Figure 10b, their influence follows an “east-high, west-low” pattern with a difference value of 0.013, indicating marked spatial heterogeneity and a positive correlation. Anhui Province is endowed with abundant cultural assets, including 99 national and 479 provincial intangible cultural heritage items, alongside 175 national and 915 provincial key cultural relics protection units. These resources provide villages with distinctive cultural identities and rich heritage depth, constituting the core of tourism appeal, mitigating homogenized competition, and fostering rural tourism development. At the same time, rural tourism contributes to the preservation and transmission of intangible heritage and cultural relics, further reinforcing its developmental role. Spatially, the impact of cultural resources is most pronounced in Ningguo City, Langxi County, and Guangde City, whereas it is relatively weaker in Yuexi County, Qianshan City, and Taihu County. This divergence may be explained by differences in resource endowments: areas such as Yuexi, rich in natural landscapes, primarily rely on scenic resources with culture serving as a supplement, while eastern counties such as Langxi, lacking high-grade natural assets, depend more heavily on cultural resources, which thus exert stronger influence. In this way, cultural resources complement the earlier-discussed formation of Grade A tourist attractions, functioning as substitutes where natural resources dominate and as complements where they are scarce.
4. Discussion

By analyzing the significance and variability of influencing factors across four dimensions—natural environment, socio-economic conditions, regional transportation, and tourism culture—this study establishes a framework for understanding the mechanisms shaping the spatial distribution of tourism villages in the Greater Mount Huang district (Figure 11). The four influencing dimensions do not operate in isolation; rather, through interactions and feedback loops, they constitute an integrated system that mutually supports and influences each component, collectively shaping the spatial patterns of tourism villages in the Great Mount Huang district. The natural environment provides the foundational basis for rural tourism, setting developmental thresholds, shaping the uniqueness of tourism resources, guiding the choice of development models, and influencing long-term sustainability. Its baseline constraints establish the fundamental parameters for the development of tourism culture, regional transportation planning, and socio-economic growth. Regional transportation acts as the critical artery of rural tourism, enhancing accessibility to remote villages, expanding tourist catchment areas, facilitating short trips, and promoting the two-way flow of urban and rural resources. Its coupling integrates the natural environment, tourism culture, and socio-economic factors, simultaneously enhancing the connectivity of natural resources, facilitating the dissemination of tourism culture, and providing channels for the flow of socio-economic capital. Socio-economic conditions, including population size, consumption capacity, and urban–rural linkages, supply the momentum and structural support for development, affecting resource utilization, market demand, and the sustainability of tourism. As a driving force, it supplies capital and stimulates consumer demand to support the conservation and utilization of the natural environment, the development of tourism culture, and the construction of regional transportation infrastructure. Tourism culture serves as the “soul” of rural tourism. Cultural distinctiveness mitigates homogenized competition, enriches visitor experiences through participation in traditional practices, and stimulates the revival of crafts and cultural heritage, making it a core driving force for rural tourism in the Greater Mount Huang district. It shapes the artistic conception of the landscape based on the natural environment, provides cultural guidance for regional transportation planning, and drives capital formation as well as value transformation within the socio-economic sphere.
The Great Mount Huang district, centered on world-class natural and cultural heritage sites such as Huangshan Scenic Area and Jiuhua Mountain within the Huangshan Mountain Range, closely parallels internationally renowned “scenic-area-dependent” rural regions, including the Swiss Alps and the areas surrounding Mount Fuji in Japan. This study systematically examines the spatial distribution of tourism villages and their influencing factors at both municipal and county levels within the Great Mount Huang district. Theoretically, it expands the regional scope and sample diversity of research on China’s high-quality tourism villages, providing methodological insights for optimizing the allocation of rural tourism resources. By revealing differentiated influence patterns across Huangshan, Anqing, Chizhou, and Xuancheng, the study offers foundational data for promoting high-quality rural tourism development, optimizing spatial layout, and supporting rational allocation of urban–rural resources. As a representative case of China’s rural tourism, the Great Mount Huang district demonstrates a “core-periphery” distribution pattern of tourism villages, with core factors such as the number of A-level tourist attractions and cultural resources exhibiting differentiated influence. These findings provide practical reference for villages surrounding scenic areas in developing countries and offer generalizable insights for optimizing collaborative development frameworks between scenic areas and adjacent rural communities. Additionally, the study’s analysis of balancing ecological conservation with tourism development can help avoid the pitfall of prioritizing resource exploitation over sustainability.
However, this study has certain limitations. From a methodological perspective, the use of GIS mapping and the GWR model is constrained by the reliance on Euclidean or Manhattan distances for spatial calculations, which may introduce biases in capturing spatial relationships. In addition, due to the difficulty of obtaining township-level data, the present analysis was limited in scope. Future research will therefore prioritize systematic surveys and data collection at the township scale within the Greater Huangshan region, thereby expanding the sample size and enabling the construction of a more robust spatial weight matrix of influencing factors. Building on this foundation, further work will attempt to apply the MGWR model to more comprehensively analyze the spatial distribution patterns of tourism villages and their driving mechanisms. Such efforts are expected to provide stronger theoretical and empirical support for the high-quality development of rural leisure tourism in the Greater Huangshan region, while also contributing to the broader international discourse on rural tourism development.

5. Conclusions and Recommendations

5.1. Conclusions

By integrating methods such as the nearest neighbor index, imbalance index, and kernel density analysis, this study conducted an in-depth analysis of the spatial distribution of 235 tourism villages in the Great Mount Huang district. Using a geographic detector and geographically weighted regression analyses, the study investigated the factors influencing the distribution of these tourism villages. The conclusions are as follows:
  • The spatial distribution of tourism villages in the Great Mount Huang district demonstrates pronounced clustering and spatial imbalance, forming an overall pattern of “one cluster, two cores, and three points.” The Core-Periphery Theory: Mapping the Spatial Distribution of Tourism Villages. Among the four cities in the region, Anqing exhibits the highest degree of concentration and imbalance, followed by Chizhou, Huangshan, and Xuancheng. The overall spatial distribution demonstrates a significant positive correlation, with hotspots primarily clustered around the core area of Huangshan Scenic Area and cold spots predominantly located in peripheral regions.
  • Factor detection analysis reveals that A-level tourist attractions and cultural resources possess significantly greater explanatory power than other variables, establishing them as dominant factors. Average elevation, average gradient, river system, urbanization rate, and road traffic function as major factors, while the remaining variables act as general factors. Across the dimensions of influence, explanatory power decreases in the order of tourism culture, natural environment, regional transportation, and socio-economics. Interaction detection further demonstrates that the synergistic effects among influencing factors far exceed expectations. This suggests that, in analyzing the spatial distribution of tourism villages in the Great Mount Huang district, multiple factors must be jointly considered, and the sustainable development of these villages should emphasize multi-dimensional coordination.
  • Through spatial differentiation analysis of various factors, average slope, distance from townships, road density, and urbanization rate exhibited negative correlations with the distribution of tourism villages, whereas the remaining factors displayed positive correlations. The influence of average slope and urbanization rate followed a “higher in the south, lower in the north” pattern, while population size and cultural resources showed a “higher in the east, lower in the west” pattern. The other factors conformed to a “higher in the west, lower in the east” pattern. Notably, road density, per capita disposable income, cultural resources, and the number of A-level tourist attractions demonstrated pronounced spatial variability.

5.2. Recommendations

Tourism villages in the Great Mount Huang district demonstrate considerable potential for tourism development due to their unique natural and cultural resources. However, they also face challenges such as uneven spatial distribution, pronounced homogenized competition in certain areas, and inadequate accessibility to remote villages. These issues constrain the overall high-quality development of tourism villages in the region to some extent. To address these challenges and promote the sustainable development of tourism villages in the Great Mount Huang district, the following recommendations are proposed based on this study:
The differentiated strategies of the four cities must navigate the double-edged effects of path dependence. Huangshan City should consolidate its path-dependent advantages while mitigating homogenization; Anqing City needs to overcome path lock-in to activate its late-mover advantages; and Chizhou City and Xuancheng City ought to leverage improved transportation to enhance market accessibility and optimize path selection. In promoting market accessibility, overreliance on highway construction that causes ecological damage must be avoided. Balancing accessibility with sustainability through low-carbon transportation and corridor connectivity will establish a comprehensive tourism framework characterized by “core leadership, secondary support, and node linkage.” This framework will guide the tourism villages across the Great Mount Huang district toward high-quality, sustainable development.
  • Spatial layout should be optimized based on the “core-periphery” theory to promote regional coordination and balanced development. As the primary core, Huangshan City must strengthen its radiating influence on the surrounding areas. By establishing cross-city tourism routes and shared service platforms, it can facilitate the diffusion of tourist flows and information to peripheral regions. Secondary core areas, such as Anqing and Chizhou, should increase investments in transportation infrastructure and public services to enhance resource integration and visitor capacity, thereby alleviating pressure on the core zone. As a key node, Xuancheng City should leverage its east–west connectivity to develop tourism corridors and cultural stations, strengthening regional linkage and overall competitiveness.
  • Emphasizing cultural empowerment and differentiated development is essential to avoid homogenized competition. The Great Mount Huang district possesses abundant yet unevenly distributed cultural resources, necessitating that each locality define thematic positioning based on its resource endowments. Huangshan City should concentrate on Huizhou culture, promoting the revitalization of ancient villages and the integration of intangible cultural heritage experiences. Anqing and Chizhou should leverage resources such as Tianzhu Mountain and Jiuhua Mountain to develop distinctive products, including ecological wellness, religious culture, and red tourism, thereby forming a diversified product system complementary to the core area. Xuancheng City can exploit corridor advantages, such as the “South Anhui Sichuan-Tibet Route,” to advance an integrated “transportation + tourism + culture” model, enhancing both accessibility and the experiential value of cultural resources.
  • Improving transportation accessibility and activating the potential of remote rural areas are essential for promoting equitable tourism development. Priority should be given to upgrading roads connecting Grade A scenic spots and rural villages, while introducing dedicated tourist bus lines. Cycling and walking trails should be optimized to diversify transportation options within villages. Innovative transportation empowerment models, aligned with the “micro-vacation” trend, can promote self-driving campsites and shared electric vehicles in suburban areas with comparative advantages. In ecologically sensitive areas, the development of low-carbon transportation should balance landscape protection with enhanced accessibility, ensuring sustainable tourism growth.
  • Strengthening the concept of sustainable development requires taking environmental carrying capacity as a fundamental constraint in guiding tourism development. All tourism projects should undergo rigorous ecological impact assessments, with particular emphasis on the strict protection of ecologically sensitive spaces such as water bodies, wetlands, and areas rich in biodiversity. The adoption of low-carbon construction and operational practices should be prioritized, including the use of locally sourced materials, renewable energy, and green technologies, in order to minimize ecological disturbance and resource consumption. At the same time, it is essential to establish and refine community participation mechanisms, enhancing the capacity of local residents both to share in the benefits of tourism development and to improve their environmental awareness. Through such measures, tourism development can achieve the organic integration of economic growth, social well-being, and ecological sustainability.

Supplementary Materials

The following supporting information can be downloaded at: https://www.mdpi.com/article/10.3390/su17198943/s1, Table S1: Tourism Village Dataset for the Great Mount Huang district. Table S2: CountyDistrict Data. Table S3: GWR_Regression Results Analysis. Table S4: GWR_Preliminary Analysis of Results.

Author Contributions

Conceptualization and design, Y.C. and C.L.; Literature review, C.L.; Methodology, Y.C. and C.L.; Data organization, C.L.; Drafting of the manuscript, C.L.; Reviewing and editing, Y.C. All authors have read and agreed to the published version of the manuscript.

Funding

This research was supported by the Anhui Provincial Housing and Urban–Rural Development Science and Technology Program (2023-RK015); and the Key Project of the Peak Discipline Research Program at Anhui University of Architecture (2021-115); Research on Standardized Design of House Types (HYB20230144).

Institutional Review Board Statement

Not applicable.

Informed Consent Statement

Not applicable.

Data Availability Statement

The original contributions presented in this study are included in the article/Supplementary Material. Further inquiries can be directed to the corresponding author.

Conflicts of Interest

The authors declare no conflicts of interest.

References

  1. Wang, B.; Wu, L.H. Problems and countermeasures of rural tourism development in Yunxi County from the perspective of cultural self-confidence. Contemp. Econ. 2019, 35, 118–120. [Google Scholar]
  2. Opinions of The General Office of the State Council of the People’s Republic of China on Further Deepening Rural Reform—Steadily Promoting the Comprehensive Revitalization of Rural Areas. Available online: https://www.gov.cn/zhengce/202502/content_7005160.htm (accessed on 14 April 2025).
  3. Gilbert, D.; Tung, L. Public organizations and rural marketing planning in England and Wales. Tour. Manag. 1990, 11, 164–172. [Google Scholar] [CrossRef]
  4. Bramwell, B. Rural tourism and sustainable rural tourism. J. Sustain. Tour. 1994, 2, 1–6. [Google Scholar] [CrossRef]
  5. Ibanescu, B.C.; Eva, M.; Gheorghiu, A.; Iatu, C. Tourism-Induced Resilience of Rural Destinations in Relation to Spatial Accessibility. Appl. Spat. Anal. Policy 2022, 16, 11–18. [Google Scholar] [CrossRef]
  6. Tomej, K.; Liburd, J.J. Sustainable accessibility in rural destinations: A public transport network approach. J. Sustain. Tour. 2020, 28, 129–146. [Google Scholar] [CrossRef]
  7. Lo, M.-C.; Choy-Sheung, S.C.; Mohamad, A.A.; Chin, C.-H. Local Communities Perceptions on Rural Tourism Competitive Advantage: A Study on Kampung Bako (Bako National Park), Kuching, Sarawak. Int. J. Asian Soc. Sci. 2018, 8, 918–928. [Google Scholar] [CrossRef]
  8. Vasyukova, L.; Masyuk, N.; Bushueva, M.; Bessonova, A.; Mosolova, A.N. Increasing the availability of financial services in remote, sparsely populated and hard-to-reach regions through the development of an entrepreneurial initiative in rural tourism. SHS Web Conf. 2020, 73, 01031. [Google Scholar] [CrossRef]
  9. Fafurida; Purwaningsih, Y.; Mulyanto; Suryanto. Potential mapping of rural tourism clusters through application of spatial decision making system as a base of sustainable tourism planning. IOP Conf. Ser. Earth Environ. Sci. 2023, 1180, 012053. [Google Scholar] [CrossRef]
  10. Pinho, J.C.; Nogueira, S.; Macedo, I. A configurational approach to understanding trust in rural tourism accommodation during the COVID-19 pandemic crisis. Consum. Behav. Tour. Hosp. 2023, 18, 140–154. [Google Scholar] [CrossRef]
  11. Dixit, S.K.; Langstieh, K.C.S.; Abraham, A. Integrating indigenous knowledge and rural tourism in Kongthong, the “whistling village” of India. Worldw. Hosp. Tour. Themes 2023, 15, 41–51. [Google Scholar] [CrossRef]
  12. MohammadzadehLarijani, F.; Darban Astane, A.; Gholami, A. Supply Chain Performance Assessment of Mountainous-Forest Rural Tourism Resorts (Case Study: Central Mazandaran, Iran). J. Qual. Assur. Hosp. Tour. 2022, 23, 1210–1244. [Google Scholar] [CrossRef]
  13. Fafurida, F.; Daerobi, A.; Riyanto, G. Implementation Model of Community Based Tourism on Rural Tourism. Int. J. Sustain. Dev. Plan. 2022, 17, 507–512. [Google Scholar] [CrossRef]
  14. Yang, X. It is imperative to develop “rural tourism”. Tour. Trib. 1992, 7, 38–41+61. [Google Scholar]
  15. He, J.M.; Li, L.H. Discussion on the Concept of “Rural Tourism”. J. Southwest Univ. Soc. Sci. Ed. 2002, 46, 125–128. [Google Scholar]
  16. Lu, X.L.; Li, W.W.; Wang, L.W. Identification of the Connotation Standards of Rural Tourism and Comparative Study: Quantitative Analysis of 50 Concepts of Rural Tourism at Home and Abroad. Resour. Dev. Mark. 2017, 33, 759–763. [Google Scholar]
  17. Ma, X.F.; Liao, Y.Y. Research on the process and mechanism of rural tourism to promote coordinated integration between construction of harmonious and beautiful countryside and improvement of residents’ happiness level: Take Zhushan village in Fenghuang county as an example. J. Nat. Res. 2025, 40, 1032–1047. [Google Scholar] [CrossRef]
  18. Wu, Z.C.; Xiong, J. Research on the impact of rural tourism development on rural household income mobility: Based on empirical data from CFPS. Tour. Trib. 2024, 39, 156–168. [Google Scholar]
  19. Wang, R.J. Integrated development of intangible cultural heritage protection and inheritance and rural leisure tourism. J. Shanxi Univ. Financ. Econ. 2025, 47, 121–123. [Google Scholar]
  20. Ma, B.; Gao, L.X.; Kou, M. A Brief Discussion on the High-quality Development of Rural Tourism in Chinese-style Urbanization. J. Cent. China Norm. Univ. Nat. Sci. 2024, 58, 13–24. [Google Scholar]
  21. Zhu, Y.F.; He, D.; Fan, Z.J. Influencing factors of well-being of residents in rural tourism destinations and their action paths. Geogr. Sci. 2023, 43, 1598–1607. [Google Scholar]
  22. Zhang, Y.X.; Li, W.Z.; Li, Z.Y.; Yang, M.Y.; Zhai, F.F.; Li, Z.G.; Yao, H.; Li, H.D. Spatial Distribution Characteristics and Influencing Factors of Key Rural Tourism Villages in China. Sustainability 2022, 14, 14064. [Google Scholar] [CrossRef]
  23. Du, J.S.; Zhao, B.B.; Feng, Y.C. Spatial distribution and influencing factors of rural tourism: A case study of Henan Province. Heliyon 2024, 10, e29039. [Google Scholar] [CrossRef] [PubMed]
  24. Zou, Q.Y.; Sun, J.W.; Luo, J.X.; Cui, J.; Kong, X.S. Spatial Patterns of Key Villages and Towns of Rural Tourism in China and Their Influencing Factors. Sustainability 2023, 15, 13330. [Google Scholar] [CrossRef]
  25. Fan, L.; Liu, Y.; Zhang, D.Y. Spatial pattern and influencing factors of tourism development in traditional villages in China. Econ. Geogr. 2023, 43, 203–214. [Google Scholar]
  26. Christaller, W. Some considerations of tourism location in Europe: The peripheral regions-under-developed countries-recreation areas. Pap. Reg. Sci. Assoc. 1964, 12, 95–105. [Google Scholar] [CrossRef]
  27. Hills, T.L.; Lundgren, J. The impact of tourism in the Caribbean: A methodological study. Ann. Tour. Res. 1977, 4, 248–267. [Google Scholar] [CrossRef]
  28. Britton, S.G. The Spatial Organisation of Tourism in A Nec-Colonial Economy: A Fiji Case Study. Pac. Viewp. 1980, 21, 144–165. [Google Scholar] [CrossRef]
  29. Walford, N. Patterns of development in tourist accommodation enterprises on farms in England and Wales. Appl. Geogr. 2001, 21, 331–345. [Google Scholar] [CrossRef]
  30. Pavlovich, K. The evolution and transformation of a tourism destination network: The Waitomo Caves, New Zealand. Tour. Manag. 2003, 24, 203–216. [Google Scholar] [CrossRef]
  31. Xu, H.; Fang, Y.L. Spatial distribution and industrial characteristics of key villages for tourism poverty alleviation: A case study of Anhui Province. Resour. Dev. Mark. 2018, 34, 1587–1592. [Google Scholar]
  32. Liu, Y.J.; Zhou, Y.; Liu, X.D.; Xiao, L.; Huang, H.; Wen, Q.Z. Spatial distribution pattern and influencing factors of “key villages in rural tourism” in China. J. Cent. China Norm. Univ. Nat. Sci. 2022, 56, 211–220. [Google Scholar]
  33. Liu, G.L.; Tang, M.; Yang, Y.K.; Zhang, J.Y. Research on Spatial Differentiation, Influencing Factors and Optimization and Improvement of Rural Tourism Spots in Henan Province. J. Henan Norm. Univ. Nat. Sci. Ed. 2023, 51, 69–74. [Google Scholar]
  34. Yu, Q.; Li, S. Research on the spatial pattern and accessibility of rural tourist attractions in Shanghai. Tour. Sci. 2018, 32, 51–62. [Google Scholar]
  35. Wang, T.; Tai, P.F. Spatial differentiation characteristics and influencing factors of national rural tourism destinations in Shandong Province. Econ. Geogr. 2016, 36, 161–168. [Google Scholar]
  36. Wu, J.Y.; Chu, J.G.; Zhan, J.X. Spatial pattern characteristics and main controlling factors of characteristic villages in the Yellow River Basin. Res. Soil Water Conserv. 2025, 32, 305–315. [Google Scholar]
  37. Zhang, H.; Li, J.C.; Liu, J.L. Spatial differentiation characteristics and influencing factors of key villages in rural tourism in Hunan Province. J. Cent. S. Univ. For. Technol. 2023, 43, 171–180. [Google Scholar]
  38. Lin, Z.; Xiao, G. Research on the types and spatial patterns of rural tourism in Hunan Province. Chin. J. Agric. Resour. Reg. Plan. 2023, 44, 131–141. [Google Scholar]
  39. Wu, X.Y.; Zhang, W.Z. Research on the spatial distribution and influencing factors of rural tourism destinations in Henan Province. Chin. J. Agric. Resour. Reg. Plan. 2020, 41, 238–246. [Google Scholar]
  40. Feng, Y.C.; Du, J.S.; Wang, Y.; Zhao, B.B. Analysis on Spatial Distribution and Influencing Factors of Rural Tourism Characteristic Villages in Henan Province. Tour. Manag. Technol. Econ. 2023, 6, 1–11. [Google Scholar] [CrossRef]
  41. Wu, H.Y. Research on the Development Model and Spatial Distribution Pattern of Rural Tourism in Chongqing Based on Targeted Poverty Alleviation. Chin. J. Agric. Resour. Reg. Plan. 2019, 40, 244–249. [Google Scholar]
  42. Huang, K. Spatial Characteristics of Rural Tourism Resources in Chongqing and Its Relationship with Rural Revitalization. Chin. J. Agric. Resour. Reg. Plan. 2020, 41, 216–224. [Google Scholar]
  43. Liu, S.T.; Huang, H.B.; Wang, K. Spatial distribution and influencing factors of key villages of rural tourism in the Yangtze River Delta Urban Agglomeration. Henan Sci. 2025, 43, 1034–1041. [Google Scholar]
  44. Zhu, Z.W.; Chu, Z.W.; Huang, Y.T. Study on Spatial Distribution Characteristics and Driving Forces of Boutique Villages in Anhui Province. J. Jiamusi Univ. Nat. Sci. Ed. 2025, 43, 95–99. [Google Scholar]
  45. Tang, H.Y.; Tian, W.X.; Liu, T.S.; Li, D.D. Study on the Spatial Distribution and Influencing Factors of Famous Towns and Villages with Characteristic Tourism in Anhui Province. J. Anhui Jianzhu Univ. 2023, 31, 27–36. [Google Scholar]
  46. Fang, L.L.; Su, Q. Spatial Distribution Characteristics and Influencing Factors of Rural Tourism Demonstration Villages in Anhui Province. Yunnan Geogr. Environ. Res. 2019, 31, 8–15. [Google Scholar]
  47. Wang, J.F.; Xu, C.D. Geodetector: Principle and prospective. Acta Geogr. Sin. 2017, 72, 116–134. [Google Scholar]
  48. Fotheringham, A.S.; Yang, W.B.; Kang, W. Multiscale geographically weighted regression (MGWR). Ann. Am. Assoc. Geogr. 2017, 107, 1247–1265. [Google Scholar] [CrossRef]
  49. Gao, S.Q.; Guo, F.Y. Spatial-Temporal Differentiation Characteristics and Driving Factors of Industrial Ecologization in Restricted Development Zones of Shandong Province. Geogr. Geo-Inf. Sci. 2021, 37, 128–134. [Google Scholar]
  50. Huang, J.X.; Li, W.Q.; Deng, H.; Wan, S.J.; Li, X.; Mao, X.C. Quantitative study on spatial non-stationarity of ore-controlling processes based on exploration big data: A case study of Sanshandao gold deposit. Earth Sci. Front. 2025, 32, 317–328. [Google Scholar]
Figure 1. Location map of the Great Mount Huang District.
Sustainability 17 08943 g001
Figure 2. Distribution map of tourism villages in the Great Mount Huang District.
Sustainability 17 08943 g002
Figure 3. Lorenz curve graph of the spatial distribution of tourism villages in the Great Mount Huang District.
Sustainability 17 08943 g003
Figure 4. Kernel density distribution map of tourism villages in the Great Mount Huang District.
Sustainability 17 08943 g004
Figure 5. Distribution map of hot and cold spots for tourism villages in the Great Mount Huang District.
Sustainability 17 08943 g005
Figure 6. Interactive detection results of influencing factors of tourism villages in the Great Mount Huang District.
Sustainability 17 08943 g006
Figure 7. Standardized regression coefficients of the natural environment impact dimension based on GWR. (a) Average elevation. (b) Average slope. (c) River system.
Sustainability 17 08943 g007
Figure 8. Standardized regression coefficients of regional traffic impact dimensions based on GWR. (a) Distance from townships; (b) Road traffic.
Sustainability 17 08943 g008
Figure 9. Standardized regression coefficients for socio-economic impact dimensions based on GWR. (a) Population size; (b) Per capita disposable income; (c) Urbanization rate.
Sustainability 17 08943 g009
Figure 10. Standardized regression coefficients for tourism cultural impact dimensions based on GWR. (a) A-level tourist attractions; (b) Cultural resources.
Sustainability 17 08943 g010
Figure 11. Influencing mechanism of spatial distribution of tourism villages in the Great Mount Huang District.
Sustainability 17 08943 g011
Table 1. Research objects and data sources.
DirectorySourceURL
National Key Villages for Rural TourismMinistry of Culture and Tourism of the People’s Republic of China https://www.mct.gov.cn/, accessed on 10 June 2025
Historic and Cultural VillageMinistry of Housing and Urban–Rural Development of the People’s Republic of China, National Cultural Heritage Administrationhttps://www.mohurd.gov.cn/?medium=01, accessed on 10 June 2025
http://www.ncha.gov.cn/index.html, accessed on 11 June 2025
Beautiful Leisure Villages in ChinaMinistry of Agriculture and Rural Affairs of the People’s Republic of Chinahttps://www.moa.gov.cn/, accessed on 15 June 2025
100 Model Villages for Rural Tourism (Poverty Alleviation)Anhui Provincial Department of Culture and Tourismhttps://ct.ah.gov.cn/, accessed on 13 June 2025
Rural Tourism Demonstration Village
The Cleanest Scenic Spots and Tourism Villages
The First Batch of Anhui Province’s Characteristic Tourism Villages
Rural Tourism “Specialty Food Villages” and “Premium Theme Villages”
Provincial-Level Famous Village for Unique Scenic Beauty and TourismAnhui Provincial Department of Culture and Tourism, Anhui Provincial Department of Housing and Urban–Rural Developmenthttps://ct.ah.gov.cn/, accessed on 13 June 2025
http://dohurd.ah.gov.cn/, accessed on 13 June 2025
Table 2. Types of dual-factor interaction detection results.
Interaction TypeCriteria for Judgment
Nonlinear Attenuationq(X1∩X2) < Min(q(X1), q(X2))
Single-factor Nonlinear AttenuationMin(q(X1), q(X2)) < q(X1∩X2) < Max(q(X1), q(X2))
Dual-factor Enhancementq(X1∩X2) > Max(q(X1), q(X2))
Factor Independenceq(X1∩X2) = q(X1) + q(X2)
Nonlinear Enhancementq(X1∩X2) > q(X1) + q(X2)
Note: Min(q(X1), q(X2)): Take the minimum value between q(X1) and q(X2); Max(q(X1), q(X2)): Take the maximum value between q(X1) and q(X2); q(X1) + q(X2): Sum q(X1) and q(X2); q(X1∩X2): Intersection of q(X1) and q(X2) [47].
Table 3. Results of the coefficient of variation, imbalance index, and geographic concentration index.
IndicatorsGreat Mount Huang DistrictHuangshanAnqingChizhouXuancheng
CV88.98%77.86%96.12%88.42%76.00%
S0.1940.2950.6140.3330.218
G51.7541.6345.1655.7739.88
G050.0037.8231.6950.0637.83
Table 4. Index system of influencing factors for the spatial distribution of tourism villages in the Great Mount Huang District.
Impact DimensionInfluencing FactorsNote
Natural EnvironmentX11: Average elevationElevation
X12: Average slopeThe ratio of the slope’s vertical height to horizontal width
X13: River systemCounty and district water system density/(km/km2)
Regional TransportationX21: Distance from townshipsCounty and district average distance from villages to towns within the region
X22: Road trafficCounty and district road density at the township level and above/(km/km2)
Socio EconomicX31: Population sizeCounty and district regional population (ten thousand people)
X32: Per capita disposable incomePer capita disposable income of residents (Yuan)
X33: Urbanization rateThe proportion of the urban population in the total population
Tourism CultureX41: A-level tourist attractionsNumber of A-level tourist attractions (Individual)
X42: Cultural resourcesNumber of provincial-level and above intangible cultural heritage and cultural heritage sites (Individual)
Table 5. Detection results of influencing factors of tourism villages in the Great Mount Huang District.
IndicatorX11X12X13X21X22X31X32X33X41X42
q-value0.3680.2630.2630.1200.2530.1640.0360.2680.5910.521
p-value0.0000.0000.0000.0000.0000.0000.0000.0000.0000.000
Table 6. OLS and GWR parameter results.
ParametersOLSGWR
R20.8660.855
Adj. R20.7760.739
AICc156.66272.666
Table 7. Statistical table of regression coefficients for factors influencing the spatial distribution of tourism villages in the GWR model.
Influencing FactorsEst.MeanSTDMinMedianMaxBandwidth
Intercept0.000−0.0010.002−0.003−0.0010.002622,950.630
Average elevation0.2520.2520.0010.2510.2520.253
Average slope−0.064−0.0640.001−0.065−0.064−0.062
River system0.0880.0880.0030.0820.0880.093
Distance from townships−0.329−0.3290.003−0.333−0.329−0.325
Road traffic−0.361−0.3600.004−0.368−0.361−0.351
Population size0.1720.1720.0030.1670.1720.177
Per capita disposable income0.1040.1050.0040.0970.1050.112
Urbanization rate−0.082−0.0810.000−0.082−0.081−0.080
A-level tourist attractions0.7770.7760.0030.7700.7760.781
Cultural resources0.1590.1600.0040.1530.1600.166
Table 8. Statistics on the elevation and slope of tourism villages in the Great Mount Huang District.
FactorsClassificationQuantity/IndividualProportion/%
Elevation≤1008937.87
100~2006427.23
200~5006326.81
500~1000187.66
≥100010.43
Slope0~0.5 (Plain)20.85
0.51~2 (Gentle slope)229.36
2.01~5 (Mild slope)8737.02
5.01~15 (Slope)10243.40
15.01~35 (Steep slope)229.36
35.01~55 (Precipitous slope)00
>55(Vertical Cliffs)00
Table 9. Statistics of the water system buffer in tourism villages of the Great Mount Huang District.
Buffer Distance/kmNumber of Villages/IndividualProportion/%
<19440.00
1~23615.32
2~33314.04
3~42510.64
4~5177.23
>53012.77
Table 10. Buffer statistics of distance between towns and townships in tourism villages of the Great Mount Huang District.
Buffer TypeBuffer Distance/kmNumber of Villages/IndividualProportion/%
Distance from Townships0~28234.89
2~46427.23
4~65121.70
6~8208.51
8~10114.68
>1072.98
Road Distance<0.516168.51
0.5~12410.21
1~22711.49
2~3135.53
3~472.98
4~520.85
>510.43
Disclaimer/Publisher’s Note: The statements, opinions and data contained in all publications are solely those of the individual author(s) and contributor(s) and not of MDPI and/or the editor(s). MDPI and/or the editor(s) disclaim responsibility for any injury to people or property resulting from any ideas, methods, instructions or products referred to in the content.