Article

Cultural Ecosystem Services in Rural Areas: Assessing Demand and Supply for Ecologically Functional Areas (EFA)

by
Malwina Michalik-Śnieżek
1,
Halina Lipińska
1,
Ilona Woźniak-Kostecka
1,
Agnieszka Komor
2,
Agnieszka Kępkowicz
1,
Kamila Adamczyk-Mucha
1,*,
Ewelina Krukow
1 and
Agnieszka Duniewicz
3
1
Department of Grassland Science and Landscaping, University of Life Sciences in Lublin, Akademicka Street 13, 20-950 Lublin, Poland
2
Department of Management and Marketing, University of Life Sciences in Lublin, Akademicka Street 13, 20-950 Lublin, Poland
3
Department of Architectural Design and History of Architecture, Institute of Architecture and Urban Planning, Faculty of Architecture, Bialystok University of Technology, 15-351 Białystok, Poland
*
Author to whom correspondence should be addressed.
Sustainability 2025, 17(19), 8822; https://doi.org/10.3390/su17198822
Submission received: 27 August 2025 / Revised: 22 September 2025 / Accepted: 25 September 2025 / Published: 1 October 2025
(This article belongs to the Section Health, Well-Being and Sustainability)

Abstract

Cultural ecosystem services (CES) play a key role in the sustainable development of rural areas—yet they remain poorly quantified in planning practice. This study examines the relationship between the supply and demand of CES provided by various types of Ecological Focus Areas (EFAs) in a rural landscape, using the municipality of Sosnowica (eastern Poland) as a case study. Landscapes such as forests, agricultural land, wetlands, and inland waters were evaluated using a set of biophysical and socio-economic indicators that reflect both their potential (supply) and actual use (demand) in terms of services such as recreation, landscape aesthetics, and cultural heritage. The findings reveal significant spatial disparities between CES supply and demand: forests and inland waters exhibit the highest supply potential, while agricultural land shows untapped opportunities in tourism and recreation. Wetlands, in particular, face notable service deficits—highlighting the need for targeted infrastructure and management interventions. Statistical analyses (Pearson correlation, Kruskal–Wallis test, Tukey HSD test) confirmed that the key factors shaping CES are accessibility and environmental attractiveness. The results indicate that CES mapping is a valuable tool for supporting sustainable rural planning, reinforcing local identity, counteracting depopulation, and stimulating socio-economic development.

1. Introduction

Ecosystem services are defined as the benefits that individuals derive from the natural environment and from healthy, functioning ecosystems. Despite ongoing debates, these services are widely recognized as important instruments for managing biodiversity and ecosystems on a global scale [1]. Since the Millennium Ecosystem Assessment [2], research has primarily focused on provisioning, regulatory, and maintenance services. However, socio-cultural values are also essential to human well-being. These include both tangible and intangible relationships between people and nature that hold symbolic, cultural, or intellectual significance—commonly referred to as cultural ecosystem services (CES) [3,4].
Among these services is the aesthetic value of landscapes, which can enhance quality of life, health, and vitality by offering inspiration, harmony, and tranquility [5]. CESs also include recreational benefits, as many forms of outdoor activities—such as birdwatching, hiking, and hunting—are closely linked to biologically active areas, even though their specific contributions remain insufficiently documented [6]. Many of these services are integrated into agri-environmental subsidy schemes due to their biological and cultural significance [7]. Cultural services also encompass traditional livestock grazing, which contributes to social cohesion in rural landscapes [8].
Recognizing and appropriately quantifying ecosystem services is fundamental to their valuation—regardless of the chosen methodological framework (be it biophysical, social, or economic). Integrating these approaches remains one of the key challenges in contemporary ecosystem service research [9,10].
In this context, Ecological Focus Areas (EFAs) gain particular relevance. These are defined as areas that perform vital ecological functions—such as supporting biodiversity, retaining water, promoting rainfall infiltration, protecting soils, and mitigating climate change impacts. Within the EU’s Common Agricultural Policy (CAP), EFAs constitute a mandatory greening component, promoted as a means of supporting both agricultural production and ecosystem services [11,12].
Modern rural areas in Europe face multiple challenges—most notably a steady population decline and youth migration to cities—which leads to social and economic weakening of these regions [13,14]. Under such conditions, it becomes essential to recognize and economically value resources that are often overlooked in conventional economic assessments—particularly EFAs. Evaluating their potential through the lens of CES supply and demand can generate tangible socio-economic benefits.
Identifying the gap between supply (ecosystem potential) and demand (societal needs) allows not only for quantitative and qualitative assessment of service deficits but also helps pinpoint areas in need of intervention or investment. This approach is especially relevant in rural municipalities, where it can inform strategies supporting nature tourism, agritourism, local product development, and cultural heritage services [15,16].
An integrated supply-and-demand framework for CES—combining natural and social components—can serve as an effective tool for local rural development planning [16,17]. CES mapping enables the identification of areas with a surplus or deficit of recreational, aesthetic, or cultural functions—which supports targeted investments, funding programs, and educational initiatives. This approach is exemplified in the analytical frameworks proposed by Paracchini et al. [18]—which integrate natural resources, accessibility, and societal demand—and by Vrbičanová et al. [19], who emphasize landscape management and protection through mapping.
Studies indicate that villages with well-developed EFAs that support both natural and cultural services achieve higher levels of economic and social development—through increased tourism revenues, local business growth, and improved quality of life. Such activities help counteract depopulation and foster local identity—enhancing social cohesion and resident well-being [20].
Despite the growing importance of CES for rural development, effective tools for their spatial and quantitative assessment—especially in relation to supply-demand dynamics—remain limited. It is still unclear to what extent selected types of EFAs in rural areas meet local community needs for CES, and how significant the spatial and functional mismatches are between service provision and demand.
The objective of this study was to examine the relationship between the supply and demand for cultural ecosystem services (CES) across different types of ecologically functional areas (EFA), and to identify spatial imbalances as well as potential development pathways aligned with local social needs.
The purpose of assessing the balance between the supply and demand of CES in rural areas is not only to fill a research gap, but above all to provide a decision-making tool for sustainable spatial planning and rural policy. Such analysis makes it possible to identify where cultural ecosystem services are underutilized and could stimulate local economic development (e.g., tourism, recreation, education), and where demand already exceeds supply, creating risks of environmental degradation and social conflicts. In regions affected by depopulation, this knowledge is crucial to strengthen territorial identity, improve quality of life, and ensure the long-term resilience of rural communities.
Although exploratory in nature, these research questions required empirical testing. They were therefore translated into research hypotheses, formulated as tentative answers to the posed questions:
Research Question 1, addressing differences between EFA types, corresponds to Hypothesis 1, which posits that such differences are significant.
Research Question 2, concerning the identification of EFA types with the highest and lowest CES supply, is reflected in Hypothesis 2, which assumes that forests and agricultural land provide the greatest supply of CES, while wetlands represent a relative deficit.
Research Question 3, focused on the predominance of supply over demand and its implications for tourism, is addressed in Hypothesis 3, which proposes that CES supply generally exceeds demand, suggesting the existence of reserves in tourism and recreation that could potentially be mobilized through appropriate management and promotional activities.
Research Question 4, evaluating the applicability of an integrated method combining environmental and socio-economic indicators, corresponds to Hypothesis 4, which assumes that this approach effectively reveals spatial gaps in CES provision and can support local development planning.
The supply of cultural ecosystem services (CES) exceeds the observed demand, which may indicate the existence of reserves in tourism and recreation that could potentially be mobilized through appropriate management and promotional activities.
The conducted research was designed using indicators and parameters that can be applied in any rural municipality in Poland but also in other regions facing similar challenges, which gives it a universal and practical character. This means that the proposed approach may serve as a ready-to-use tool to support planning and strategic processes in other local governments, enhancing their capacity to manage natural and cultural resources more effectively and to better respond to community needs.

2. Materials and Methods

2.1. Study Area

Ecologically functional areas were studied within 28 villages of the Sosnowica municipality (Parczew County, Lublin Voivodeship, Poland). The study area was selected based on the following criteria, representing average values for rural areas in Poland (Topographic Objects Database—BDOT10k, Baza Danych Obiektów Topograficznych, scale 1:10,000; geoportal.gov.pl): (1) municipal area, (2) distance from urban settlements greater than 20 km, (3) forest cover (Forest Data Bank—BDoL, Bank Danych o Lasach), (4) arable land area (BDOT10k), (5) grassland area (BDOT10k), (6) demographic change (population per 1000 residents in Sosnowica), (7) number of enterprises per 1000 residents by size class, (8) percentage of residential buildings connected to technical infrastructure, and (9) financial balance (total revenues vs. expenditures) [21,22,23].
Sosnowica municipality is located in eastern Poland, in the Lublin Voivodeship, within the Polesie region, which is characterized by high natural values, as evidenced by the nearby Polesie National Park (Figure 1) [22,24,25]. Despite this location, the municipality has been experiencing a steady population decline. According to a 20-year projection (Statistics Poland—GUS, 2024 [26]), the number of residents is expected to decrease by more than 60%—from 2238 inhabitants in 2024 to 1451 in 2044. Similar demographic trends are forecasted for approximately 75% of rural municipalities in Poland (excluding suburban municipalities).
Despite the richness of its natural and cultural resources, the tourism infrastructure in Sosnowica is underdeveloped. At the same time, the municipality is undergoing unfavorable spatial changes—such as scattered development and biotope fragmentation—which may reduce both the accessibility and continuity of ecosystem service provision [27].

2.2. Spatial Data

Spatial datasets used were primarily accessed online within the National Geoportal [28], mainly as a part of the State Geodetic and Cartographic Resource.
Based on the EUNIS habitat classification [29] and local habitat conditions, 12 types of EFAs were identified and grouped into four main categories:
  • Agricultural land—arable land, meadows, pastures, allotment gardens, and fallow land
  • Forested land—coniferous, deciduous, and mixed forests
  • Wetlands—bogs, peatlands, and marshes
  • Aquatic land—rivers, lakes, ponds, and other inland water bodies
The analysis covered the entire municipality within its administrative boundaries, using 28 villages as the spatial units of data aggregation.
The identification of Ecologically Functional Areas (EFAs) was based on the following sources:
  • the graphic annex to the “Amendment to the Study of Conditions and Directions of Spatial Development of Sosnowica Municipality” [30]
  • soil and agricultural maps (Institute of Soil Science and Plant Cultivation—2021) [31]
  • cadastral data from the District Office in Parczew [32]
  • the Topographic Objects Database (BDOT10k) [33]
  • the authors’ own field inventory

2.3. Indicator-Based Analyses

2.3.1. CES Supply Assessment

The supply CES was estimated with two indicators, following the methodology used by Statistics Poland (GUS) for tourism assessment in Poland [34].
Two indicators—Tourism Attractiveness Index (TAI) and Transport Accessibility Index (TRAI)—were applied; their components and the evaluation procedure are presented in Table 1.
All indicators were constructed to ensure standardization and additivity. Whether a partial indicator (e.g., number of tourists, number of monuments), a component index (e.g., CAI, EAI), or the composite TAI, each is a sum of components normalized to 0–100 with weights summing to 1 [32,34].
Data sources: Statistics Poland (BDL), CRFOP (Central Register of Nature Conservation Forms), OpenStreetMap, and field surveys (2020–2023) [28,32].

2.3.2. CES Demand Assessment

CES demand was evaluated with three indicators: (1) Tourist Traffic Utilization (TTU); (2) Landscape Ecosystem Variability (LEVD); (3) Infrastructure Traffic Utilization (ITUI) (Table 2).

2.3.3. Supply–Demand Balance

Supply and demand matrices were prepared separately for EFAs/settlements on 0 or 1–5 scales.
Point-based scoring with Jenks natural breaks produced classes that minimize within-class variance and maximize between-class variance (clear, comparable intervals).
Interpretation scale (1–5): 1 very low, 2 low, 3 moderate, 4 high, 5 very high.
CES balance: (SUPPLY − DEMAND) ∈ [−5; +5], where −5 = strong deficit, 0 = equilibrium, +5 = strong surplus.
This enabled the identification of areas with:
  • balanced supply and demand,
  • untapped potential,
  • need for planning and infrastructure interventions.

2.4. Survey (Demand/Perception)

Sampling and Implementation

A cross-sectional survey was implemented to quantify CES demand and visitor perceptions. Data were collected with a mixed-mode design combining CAWI (Google Forms) and door-to-door interviews. The resident sample consisted of N = 253 participants selected by quota sampling on gender and place of residence to reflect the municipal population. The tourist sample comprised N = 228 respondents; owing to the absence of municipal visitor-flow statistics, sampling was benchmarked to the Lubelskie voivodeship distribution. Participation was voluntary and anonymous. Responses were used exclusively for research purposes.
The questionnaire comprised five sections (Attachment No. 1, Supplementary Material):
  • EFA identification and visit frequency within the previous 12 months.
  • Tourism attractiveness (survey-based TAI): up to three most frequently visited EFAs rated across environmental, cultural, and hospitality/service dimensions on a 1–5 Likert scale.
  • Transport accessibility (survey-based TRAI): assessment of access, parking, and distance/time barriers on a 1–5 Likert scale.
  • Visitor intensity and crowding: perceived crowding and its effect on comfort.
  • Use and expenditures (demand): recreational, educational, and spiritual activities in the last three years and willingness to pay (WTP) monthly contributions to maintain EFA values [4].
The sociodemographic block recorded gender, age, economic activity, education, place of residence, primary locality within the Sosnowica municipality, and net income per capita.
The obtained sample was approximately gender-balanced (≈50/50). The dominant age group was 45–64 years. In total, 44% reported monthly income > 2000 PLN. Vocational education was most frequent. Overall, 53% resided in the Sosnowica municipality, and nearly one half received retirement or pension benefits.

2.5. Statistical Analyses

Most variables exhibited right-skewness; therefore, a log10(x + 1) transformation was applied prior to inference. The transformation improved normality and stabilized variance, enabling parametric tests where appropriate. Group differences (e.g., among EFA types) were tested using Tukey’s HSD post-hoc procedure for unequal sample sizes with α = 0.05. For non-normal or ordinal variables (e.g., the CES balance), the Kruskal–Wallis test was used with post-hoc multiple comparisons to identify significant pairwise differences. Pearson’s correlation quantified associations of interest (e.g., between TAI and TRAI, and between the CES balance and land-use patterns). All analyses were performed in Dell Statistica 13.1. In the tables, means sharing the same letter do not differ significantly.

3. Research Results

Assessment of the supply (potential) of cultural ecosystem services (CES) for four types of ecologically functional areas (EFA) in the Sosnowica commune, based on the indicators of tourist attractiveness (TAI) and transport accessibility (TRAI) and their component variables, revealed significant differences among them.
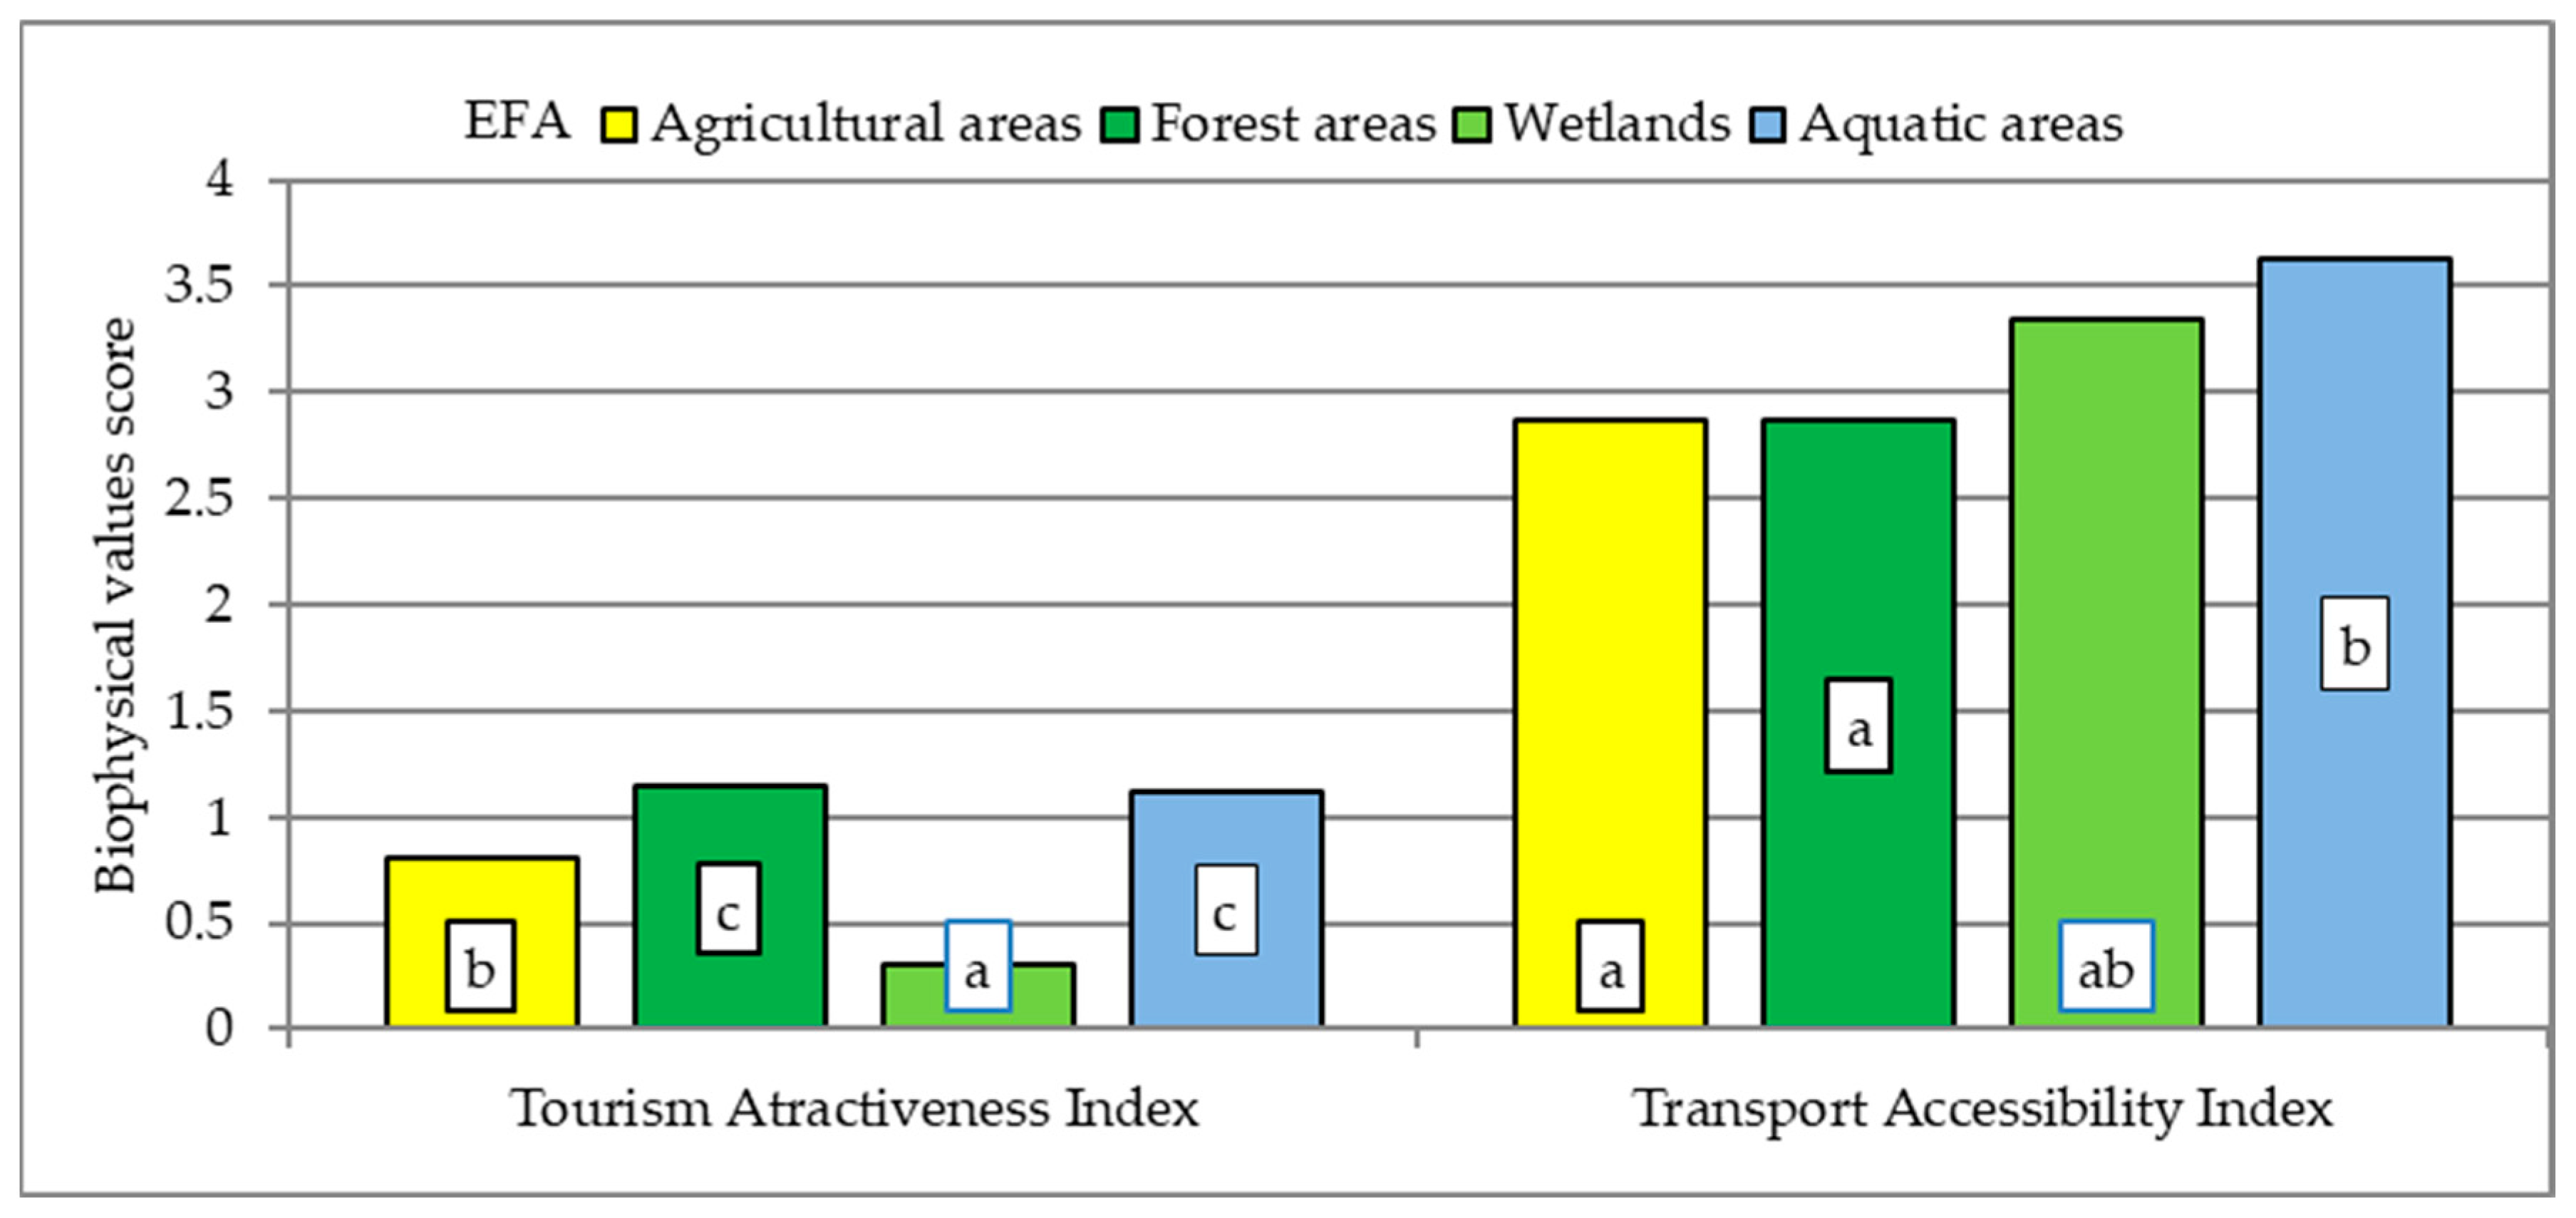
The highest TAI value was recorded for forest areas (1.14), followed closely by water areas (1.12). Agricultural land obtained considerably lower values (0.803), while wetlands reached the lowest TAI value (0.306) (Figure 2). Somewhat different results were obtained for the TRAI indicator. The highest values were attributed to water areas (3.63) and wetlands (3.35), which may be surprising given their low tourist attractiveness. Agricultural and forest areas both achieved significantly lower TRAI values (2.87), indicating moderate accessibility resulting from their peripheral location and insufficient infrastructure.
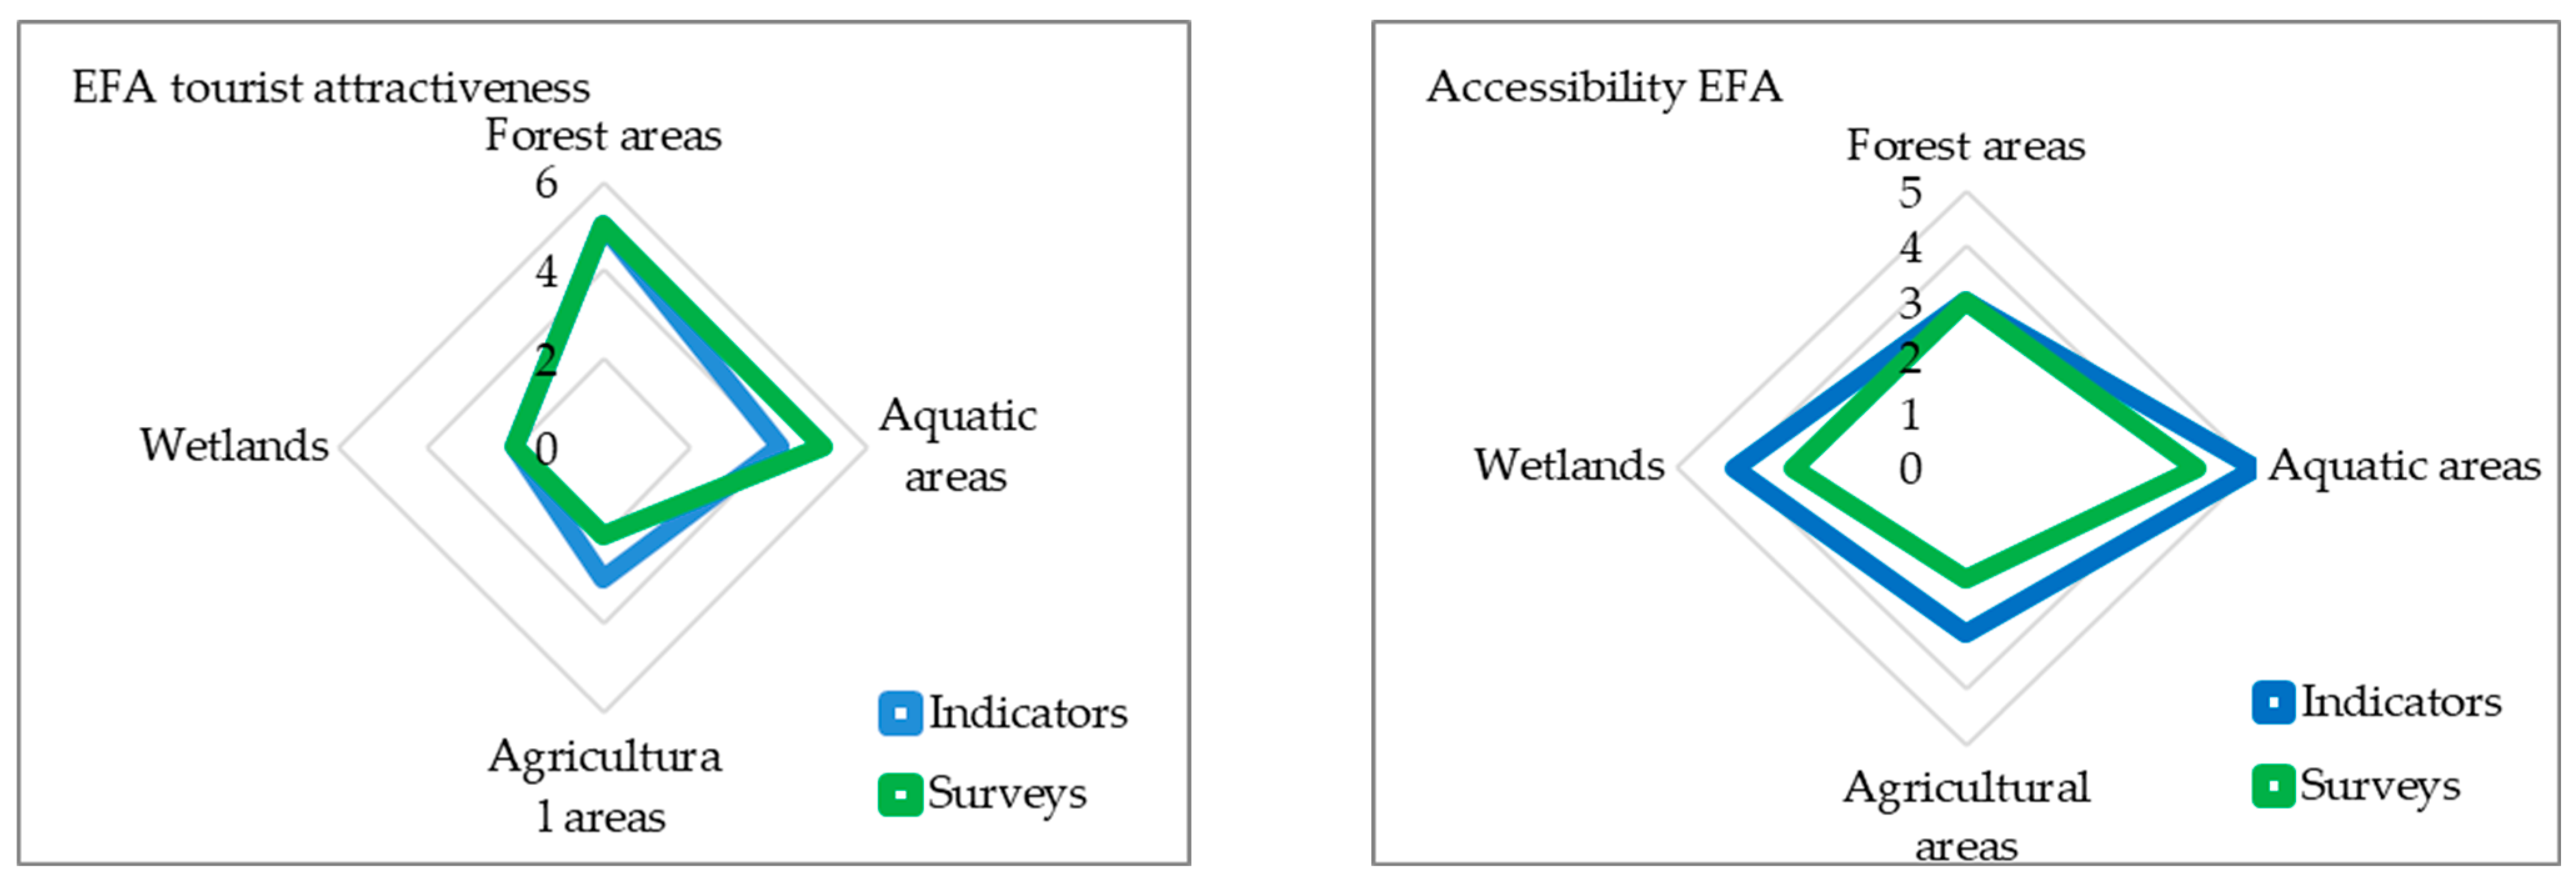
These assessments are consistent with the results of the survey. Respondents rated forests and water areas the highest, as they were the most frequently and systematically visited, whereas wetlands were considered the least attractive, and agricultural land was perceived more as part of the everyday landscape than as a tourism or recreation space. In terms of transport accessibility, water areas scored the best, offering both convenient access and relatively high parking availability; forests and agricultural land were rated moderately, with the latter being associated with parking difficulties.
A comparison of these evaluations with the index-based results revealed both consistencies and discrepancies (Figure 3). The strongest agreement concerns forests and water areas, which in both approaches hold dominant positions: forests were assessed as versatile in terms of environmental and cultural values, while water areas were identified as key for recreation, albeit limited by weaker infrastructure. In the case of agricultural land and wetlands, divergences were observed: the indices indicate moderate tourism potential for agricultural land and relatively high accessibility for wetlands, whereas respondents tended to downplay their tourism significance, assigning them rather everyday (agricultural) or protective and niche (wetland) functions. With regard to transport accessibility, water areas achieved the highest scores in both sources, while discrepancies appeared for wetlands—according to the indices they are highly accessible, whereas survey responses emphasized their practical limitations (parking) and low recreational use.
The analysis of the partial components of the Tourist Attractiveness Index (TAI) and the Transport Accessibility Index (TRAI) revealed clear differences among the types of ecologically functional areas (EFA). For TAI (comprising the sub-indices: CAI—cultural attractiveness, EAI—environmental attractiveness, BHAI—business attractiveness), it was found that the tourism attractiveness of EFAs is driven primarily by environmental and cultural values, whereas the importance of business infrastructure (BHAI) is limited. For agricultural and forest areas, both cultural offerings and natural assets play a key role. In water areas, EAI is the dominant factor (e.g., water quality, landscape attractiveness), with CAI serving only a complementary role. In wetlands, attractiveness is determined mainly by EAI linked to their unique natural features, while CAI and BHAI exert little influence.
The correlation analysis between infrastructural indicators (I1—access by paved road, I2—distance from the settlement center, I3—parking availability) and TRAI revealed the strongest relationships (r > 0.95) for agricultural land, where road network quality and parking proximity directly affect functionality (Table 3). Forest areas showed moderate correlations (r = 0.7–0.8), indicating that accessibility is relevant but does not determine their core ecological and recreational values. For water areas, correlations were medium (r = 0.63–0.8), reflecting mainly tourism needs, whereas wetlands were characterized by low values (r < 0.5), which mirrors their natural constraints and dominant ecological functions.
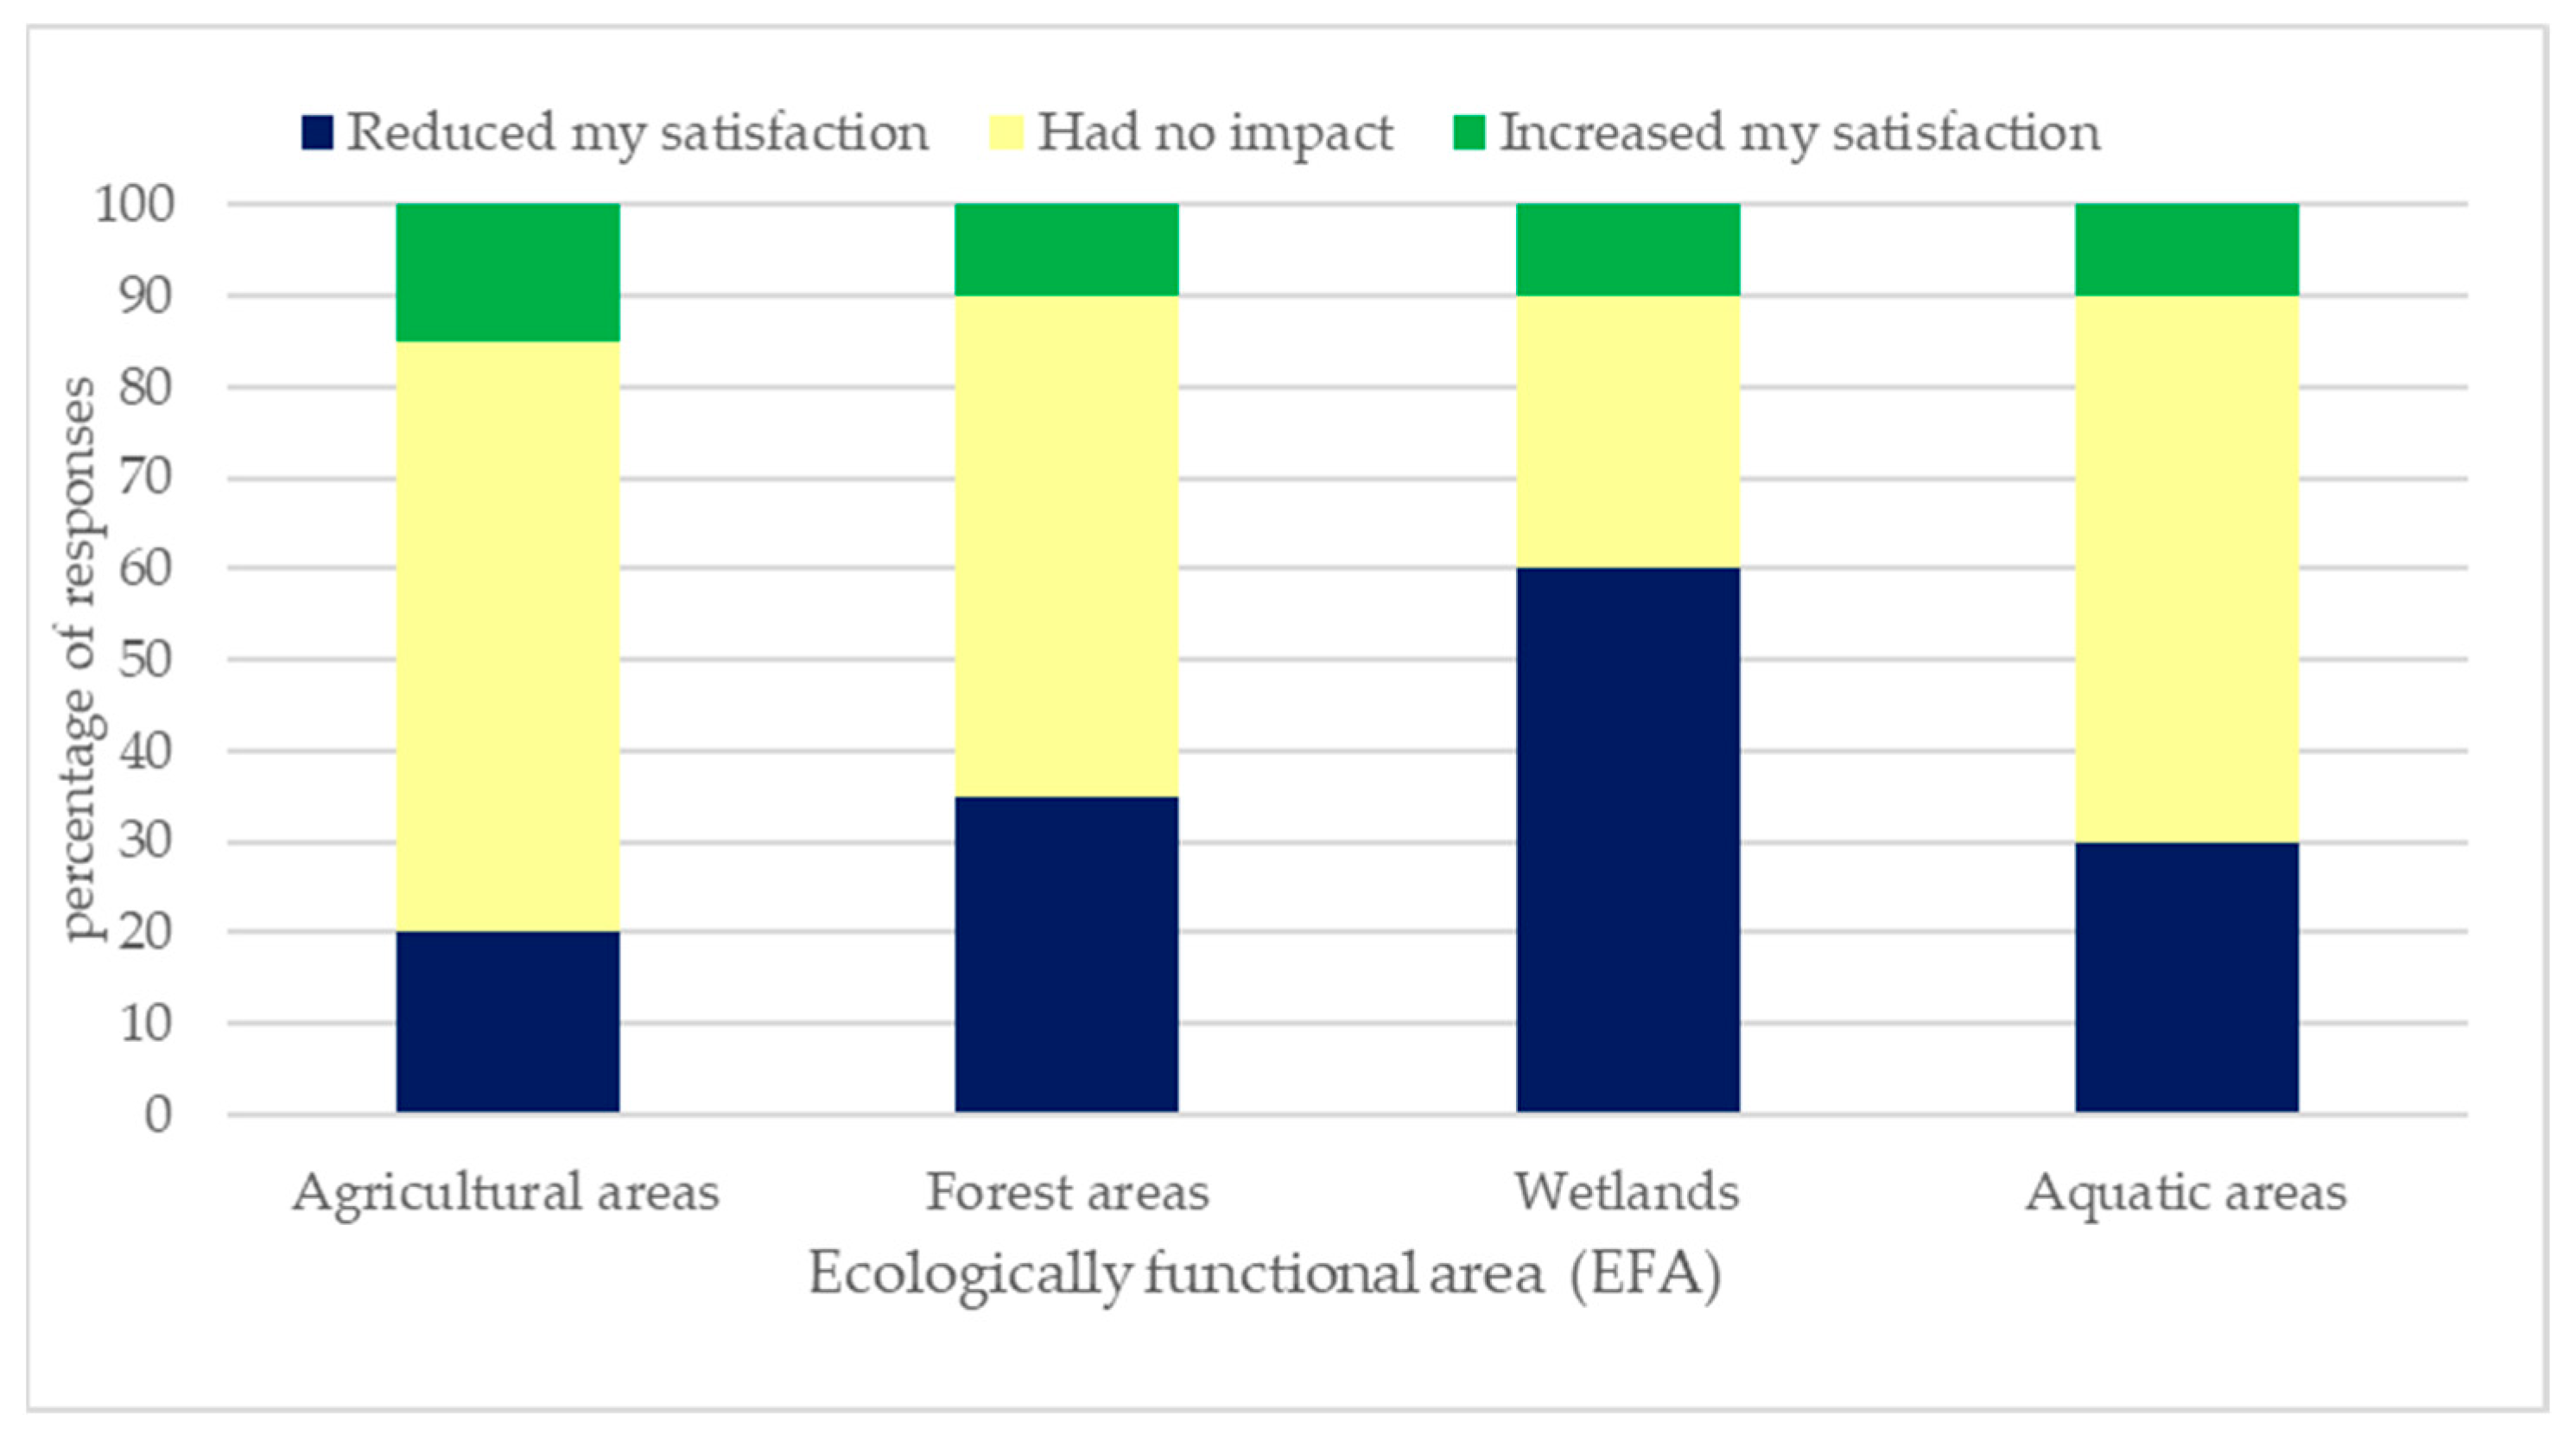
The results of the conducted analysis (TAI and TRAI indices) correlated with social perception. Forests were recognized as the most versatile areas—combining high environmental and cultural values with good accessibility (Figure 4). Water areas were perceived as exceptional in terms of natural qualities, although less developed in terms of infrastructure. Wetlands were regarded as potential sites for niche tourism, while agricultural land was considered the least significant for tourism. The survey also filled a gap in the index-based analyses by capturing perceptions of visitor congestion. Water areas were identified as the most heavily burdened, which may lead to overcrowding and a decline in user comfort. Forests were perceived as moderately visited and generally acceptable, whereas agricultural land and wetlands remained calm, which some respondents valued as a positive feature, while others regarded it as a limitation of attractiveness. Further analysis of the responses revealed how the perceived level of visitor congestion translated into visitor satisfaction. The findings show that congestion was most often perceived negatively.
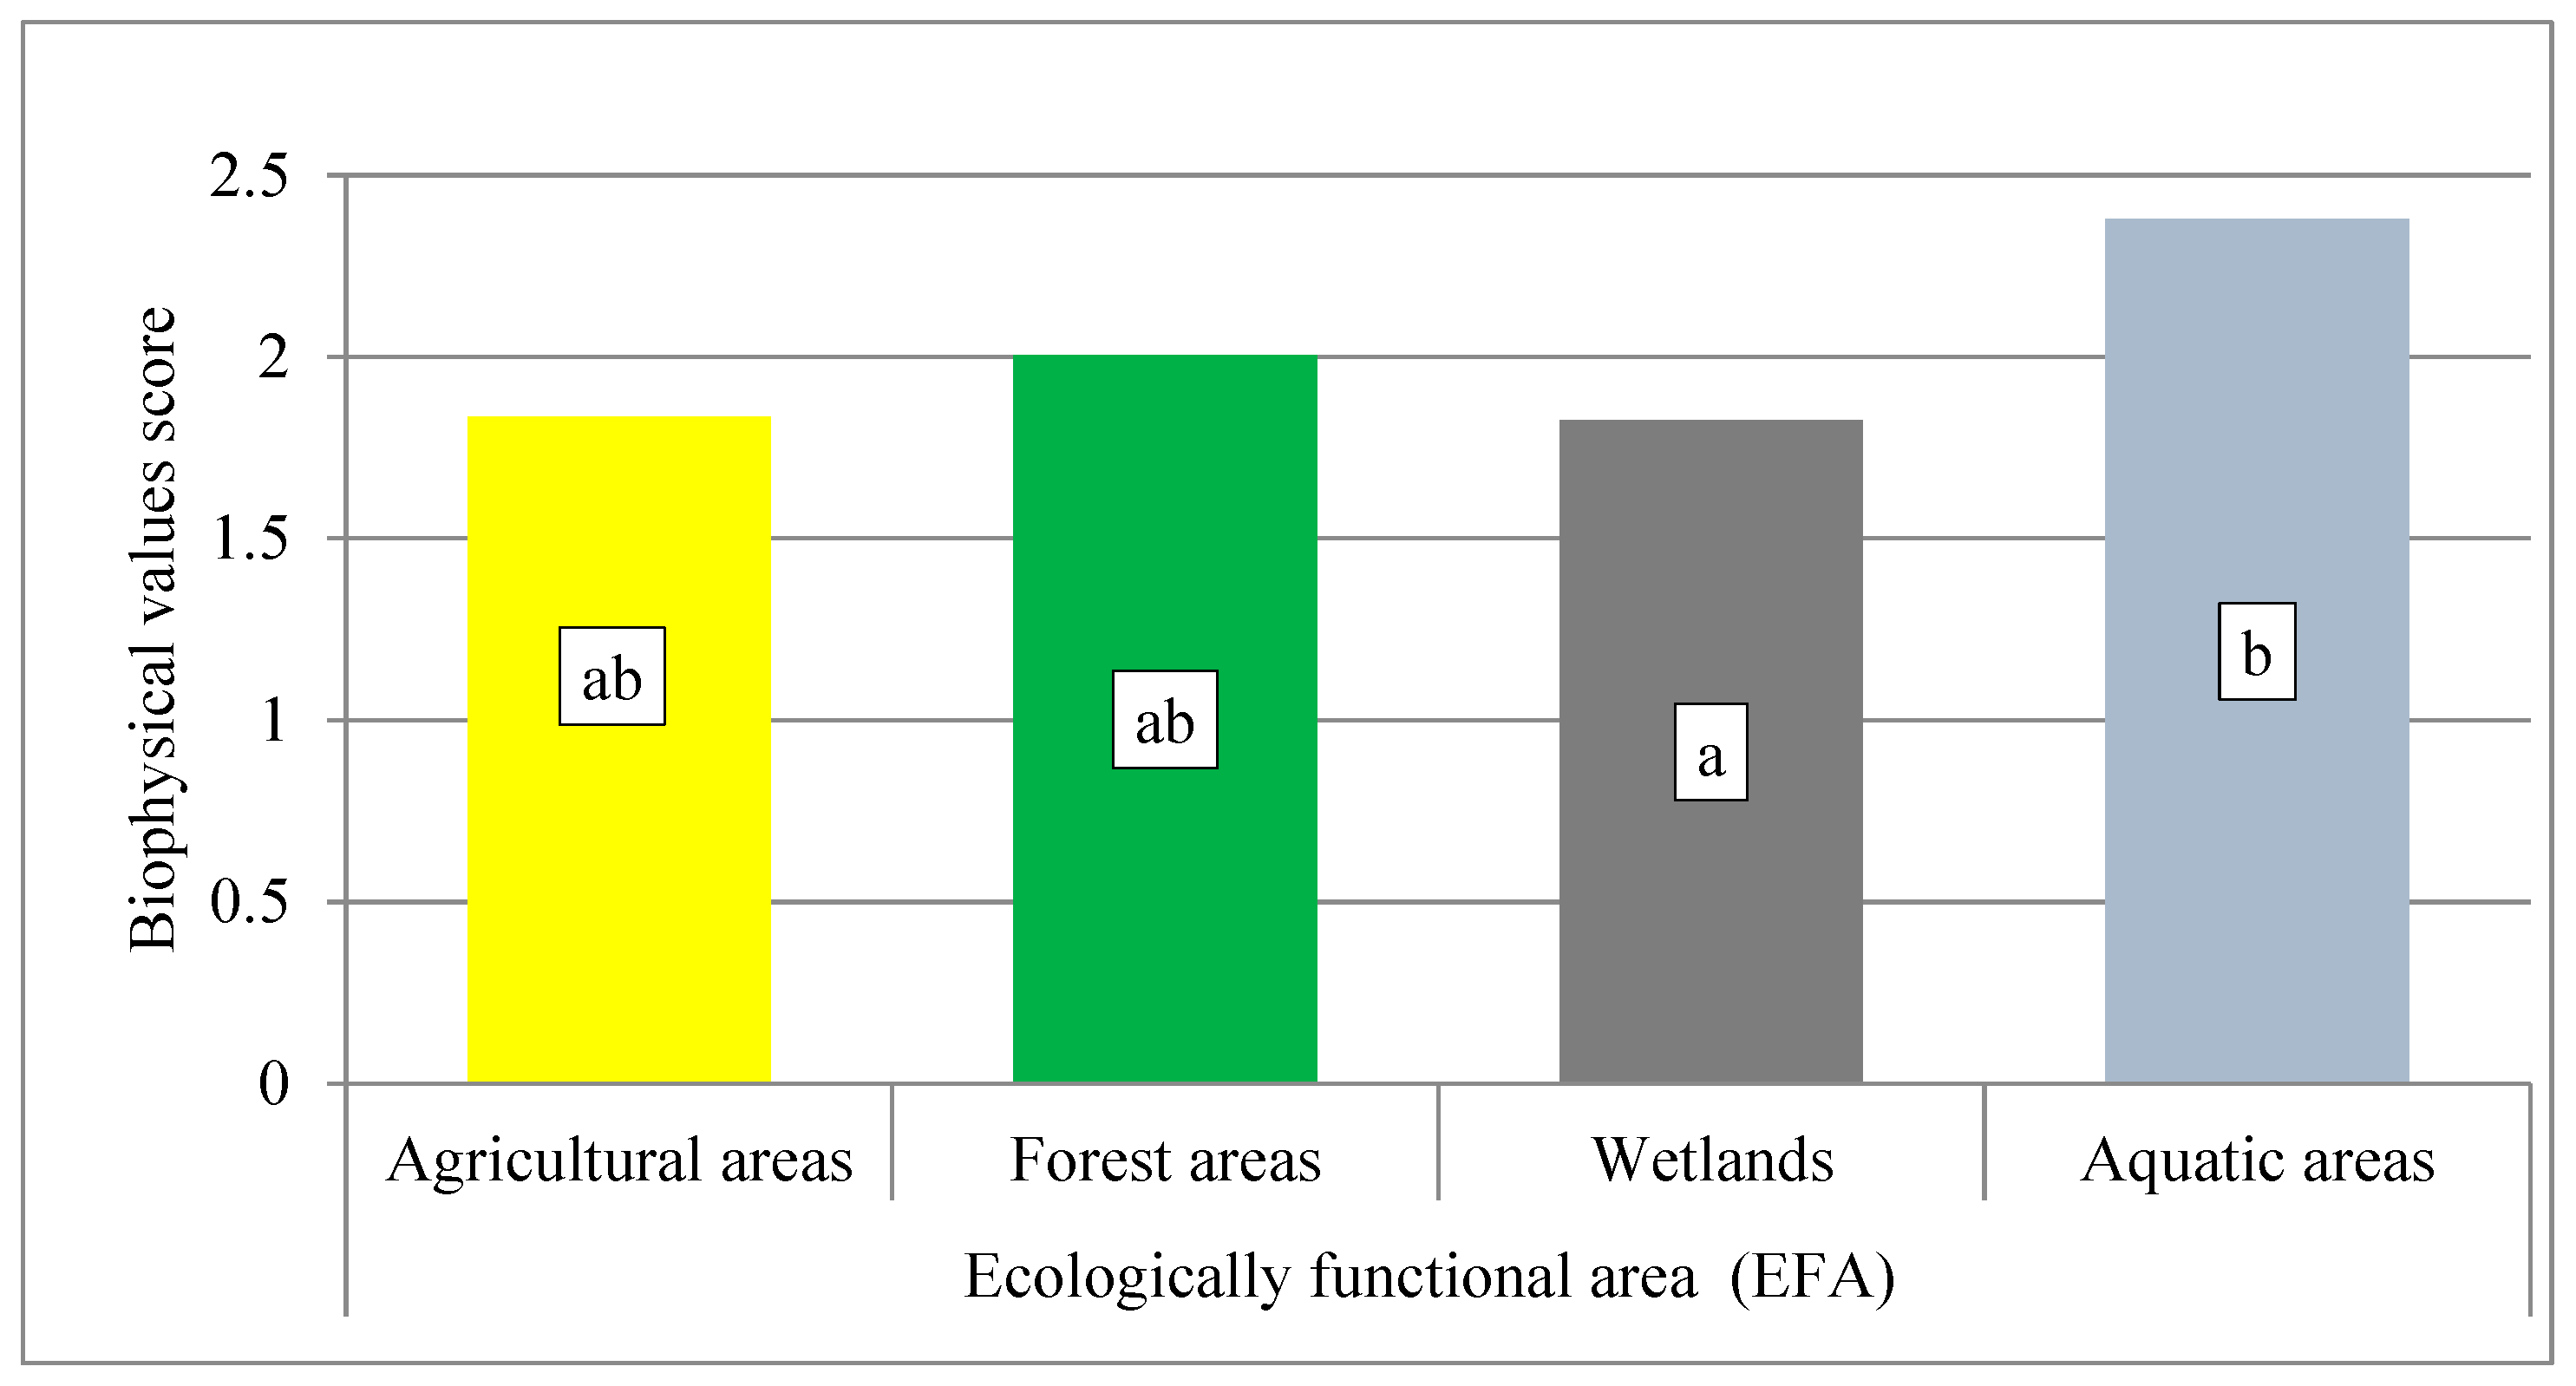
Considering the average (per village) values of the TAI and TRAI, aquatic areas (2.37) had the highest CES supply, indicating significantly greater attractiveness compared to wetlands and a somewhat higher level compared to agricultural and forested areas (Figure 5). Forested areas (2.00) and agricultural land (1.80) formed a common group, suggesting no statistically significant difference between them, despite slightly higher scores for forests. Wetlands (1.80) ranked statistically lower than aquatic areas, but not necessarily lower than other EFA types in terms of CES supply.
Correlation analysis (Table 4) showed that in agricultural areas, both the Tourism Attractiveness Index (TAI) and the Transport Accessibility Index (TRAI) strongly influence the supply of cultural ecosystem services (CES), confirming the high potential of these areas when appropriate infrastructure is in place. In forests, TAI plays a greater role, while TRAI is of secondary importance, as users are often willing to travel longer distances to access scenic landscapes. In the case of wetlands, both indices are critical, emphasizing the need to plan accessibility carefully while preserving the areas’ unique ecological features. For aquatic areas, TAI showed a negative correlation, which may indicate a saturation of service supply, while TRAI remains the key factor enhancing the recreational value of water bodies.

3.1. CES Demand—Biophysical Values

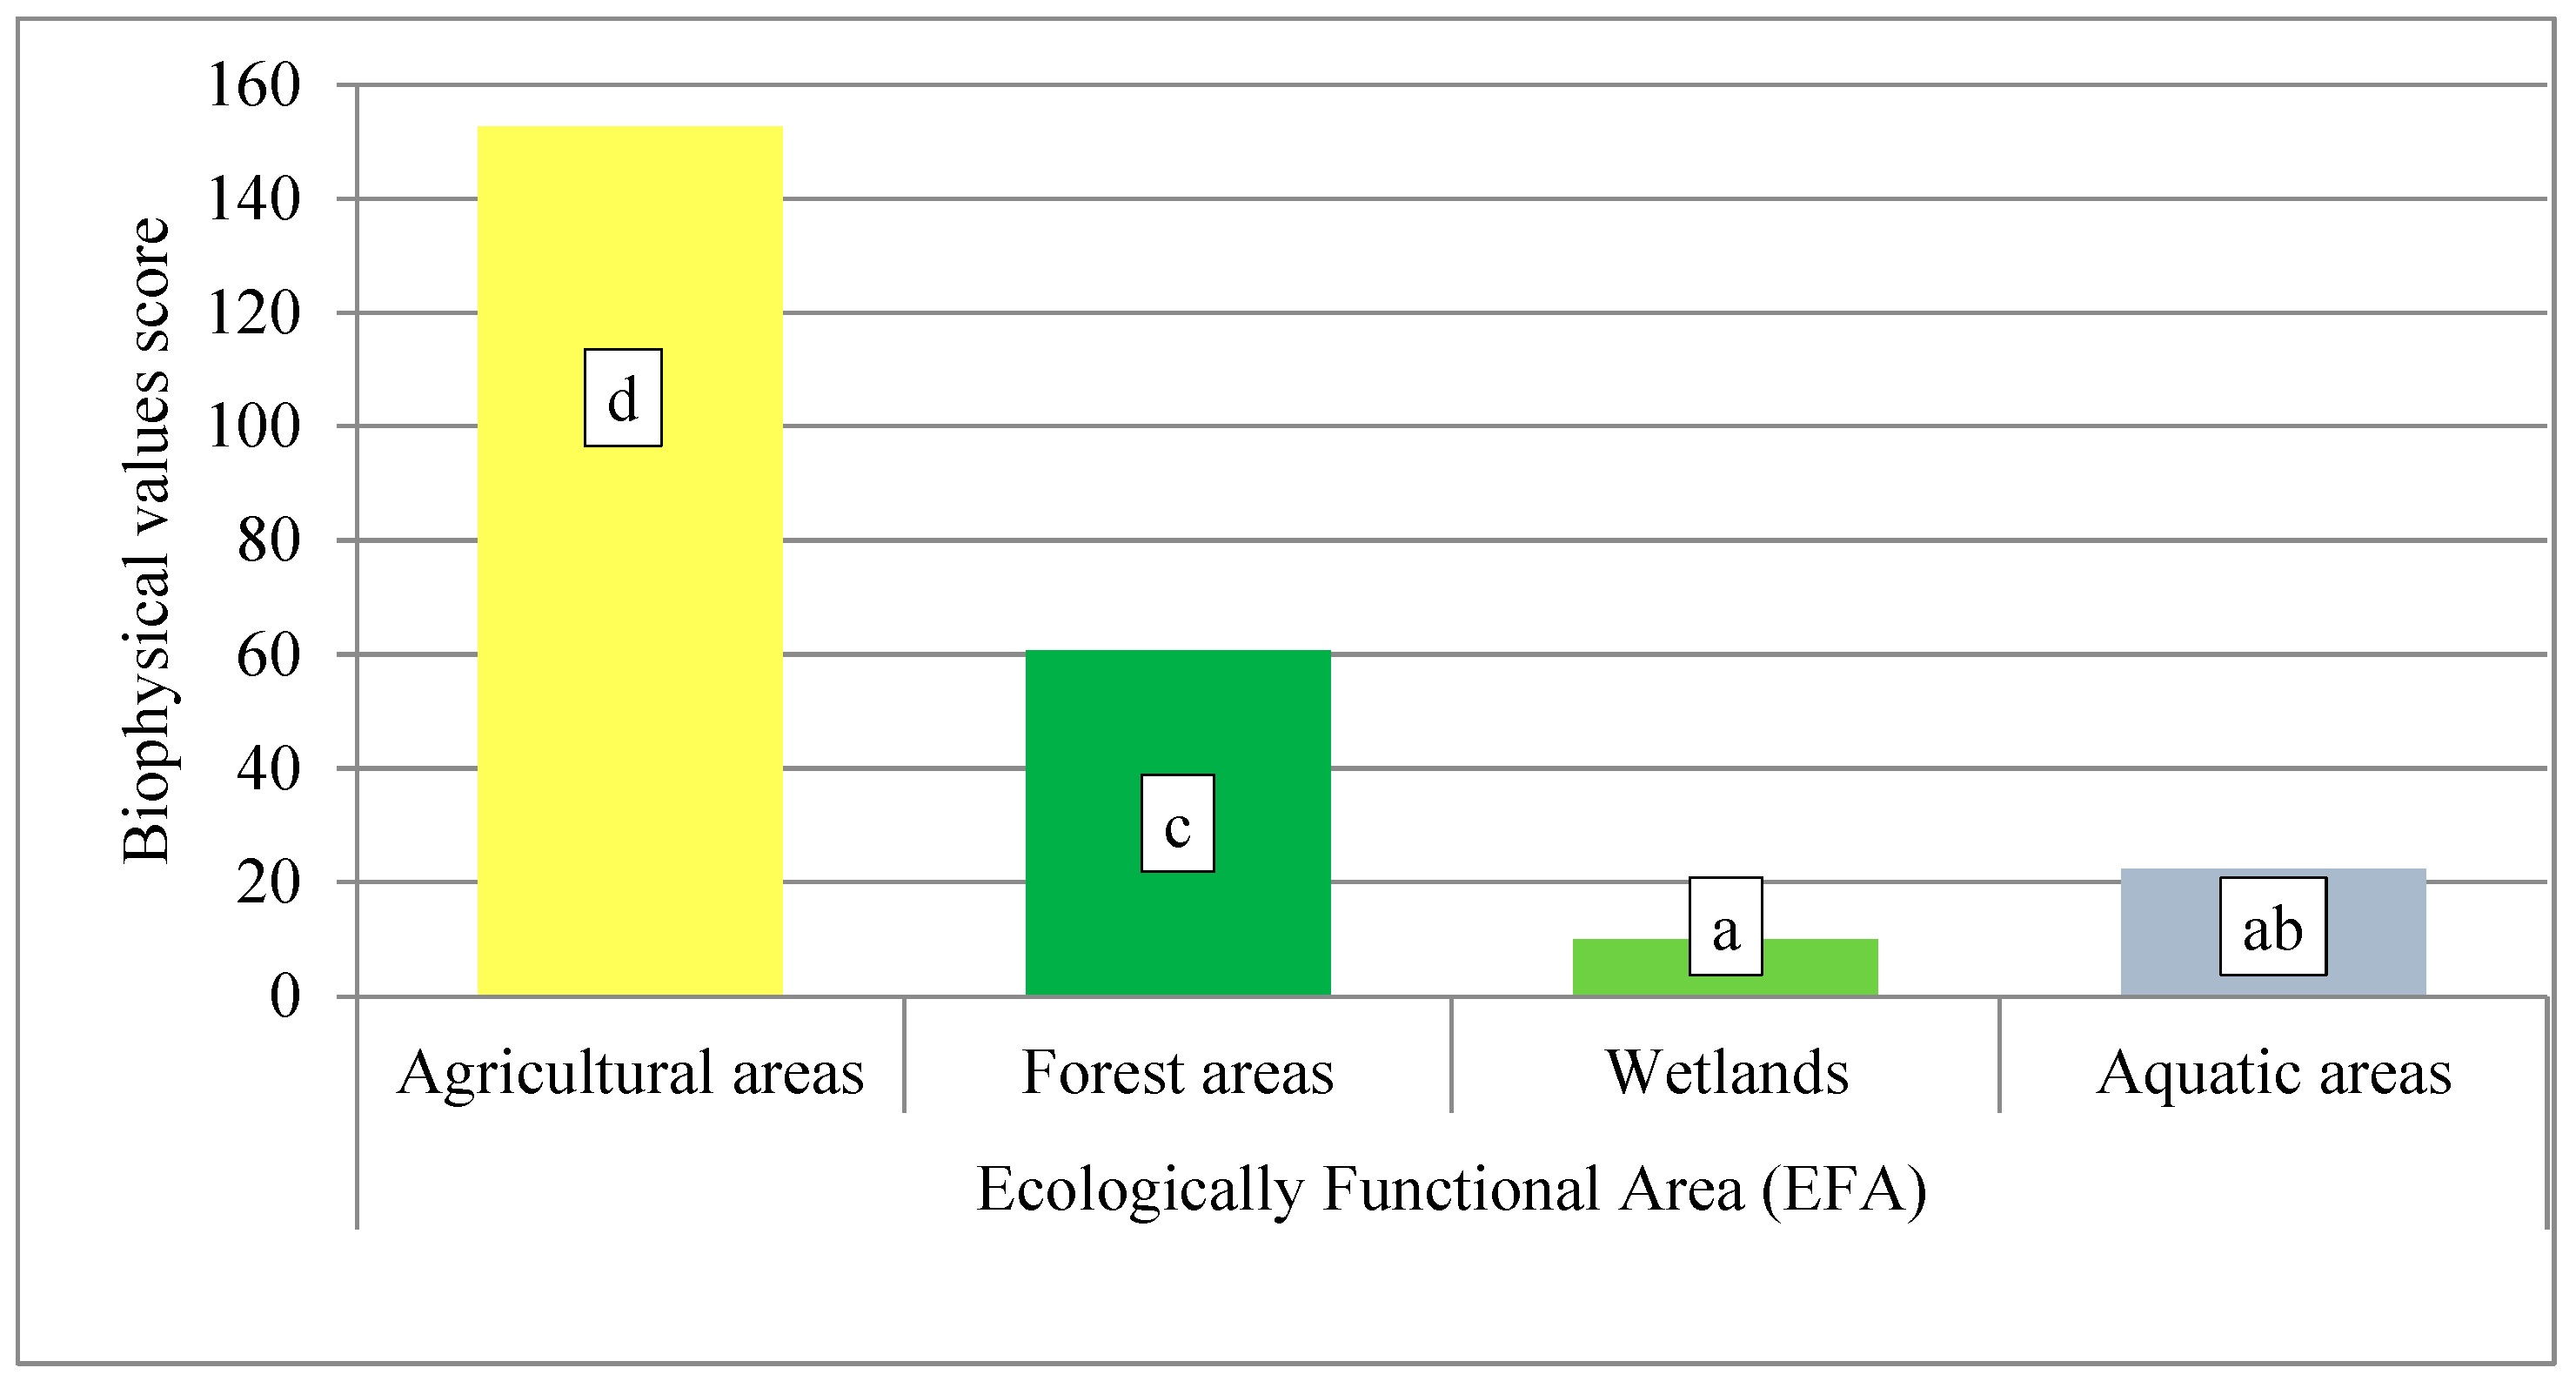
The analysis of demand indicators for cultural ecosystem services (CES) revealed considerable variation among the assessed types of EFAs (Figure 6). The highest demand (152.67) was recorded for agricultural land. Significantly lower values were observed for forest areas (60.8), as well as for water areas (21.67) and wetlands (10).
To determine the relationships between CES demand indices (TTU, LEVD, ITUI) and total demand values, Pearson correlation coefficients were calculated (Table 5). The highest correlations (0.99 for all indices) were found in aquatic areas, confirming their exceptional recreational and aesthetic potential, supported by tourism infrastructure. Forested areas also showed strong correlations (TTU = 0.93, LEVD = 0.97, ITUI = 0.98), highlighting the importance of landscape quality, tranquility, and available infrastructure in shaping their attractiveness. Wetlands exhibited high correlations (ranging from 0.78 to 0.84), resulting from their unique landscape values and biodiversity, despite limited accessibility. In contrast, for agricultural areas, only LEVD showed a very strong correlation (0.99), while TTU (0.41) and ITUI (0.63) were lower. This indicates high aesthetic potential not fully supported by tourism infrastructure.

3.2. Assessment of Supply and Demand

A point-based assessment of cultural ecosystem services (CES) supply and demand provides a quantitative representation of the relationship between a given type of environment’s (EFA’s) capacity to provide cultural services and the level of social demand for those services. The analysis used a five-point scale, where higher values indicate greater potential or higher demand. This assumption was also confirmed by the survey results.
In the scoring assessment, forest areas obtained the highest values both in terms of supply (4) and demand (4) for cultural ecosystem services (Figure 7). In the case of agricultural areas, despite a relatively high supply score (3), demand for their cultural services remains low (1). This may reflect underutilization of their potential, possibly due to limited landscape appeal, poor accessibility, or a lack of agritourism or educational offerings. Aquatic areas scored 3 points for both supply and demand, indicating moderate potential and an adequate level of public interest. Inland waters serve important recreational and aesthetic functions, and their accessibility aligns with the services they provide. Wetlands received the lowest scores (1 point for both supply and demand), likely due to limited accessibility and fewer aesthetic or recreational values. Despite this low cultural rating, wetlands possess high ecological value, which should be taken into account in spatial planning.
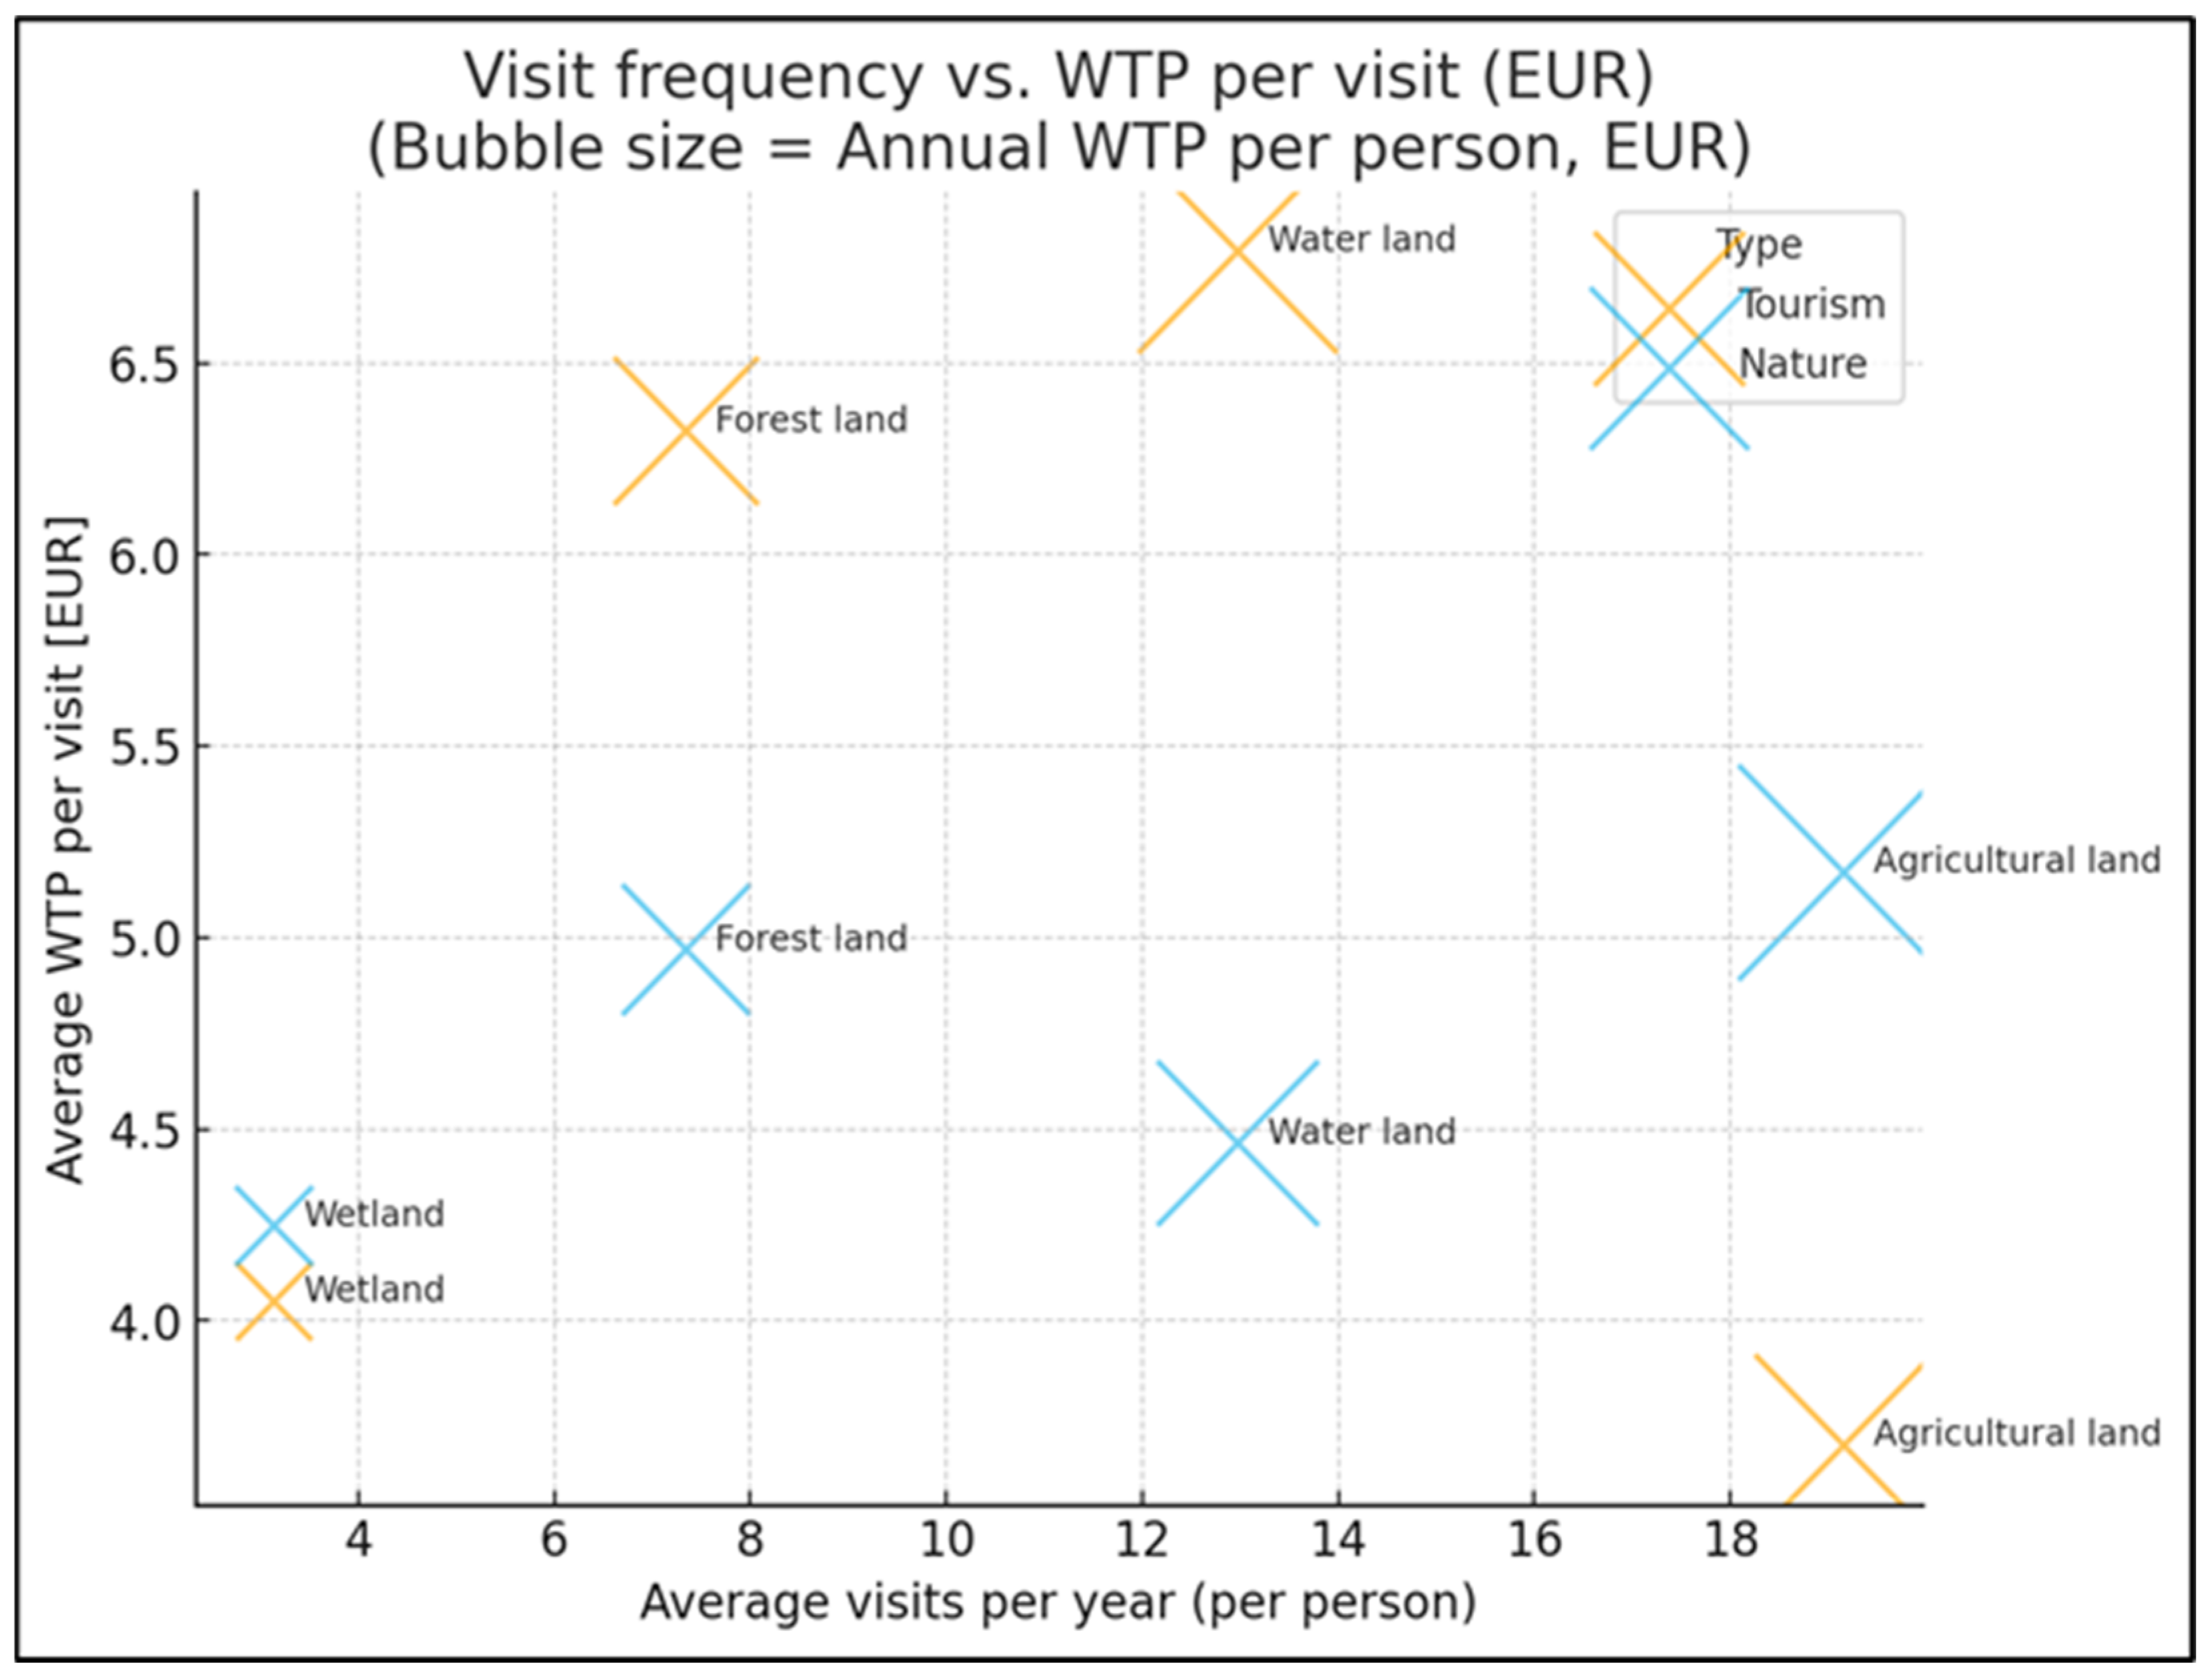
The index-based assessment of demand is well complemented by the survey results. User perception analysis indicates that agricultural land is the most frequently visited, yet it is associated with relatively lower willingness to pay (WTP), most likely due to its everyday character and lower perceived tourism value (Figure 8). Water areas, although visited less frequently than fields, are perceived as the most worthy of investment and protection, confirming their particular recreational and cultural importance. Forests occupy an intermediate position—visited fairly often and considered as areas deserving support—while wetlands show the lowest share in tourism use, despite recognition of their ecological role.
The comparison of WTP expressed in euros shows that, from a tourism perspective, the highest per-visit value is attributed to water areas (€7.39 per visit; approx. €96 annually per person), followed by forests (€6.32; approx. €46), agricultural land (€3.39; approx. €65, due to more frequent visits), and wetlands (€4.05; approx. €13) (Figure 8). From an ecological perspective, agricultural land ranks highest (€5.17; approx. €99 annually), followed by water areas (€4.46; approx. €58) and forests (€4.97; approx. €36), while wetlands remain the lowest (€4.25; approx. €13). The annual values result from combining the declared per-visit amount with the estimated frequency of visits. Thus, water areas act as the “engine” of tourism demand (a combination of frequent visits and high per-visit value), agriculture gains prominence when ecological protection is considered, forests are consistently valued, whereas wetlands have the lowest tourism use despite recognition of their ecological importance.

3.3. Balance of CES Supply and Demand Across EFAs

Sustainable development in rural areas requires aligning environmental resources with social needs. In this context, analyzing the balance between the supply and demand of cultural ecosystem services (CES) makes it possible to assess the extent to which various types of Ecologically Functional Areas (EFAs) meet user expectations.
The results (Figure 9) show considerable variation in the CES balance. The highest surplus of supply over demand was recorded for agricultural areas (+0.906), indicating untapped potential likely due to a lack of tourism infrastructure or insufficient promotion of landscape values. Forest areas exhibit an almost balanced relationship (+0.11), which supports the sustainable use of their resources without excessive recreational pressure. Wetlands are the only areas with a negative balance (–0.267), indicating that demand exceeds the availability of services, primarily due to limited infrastructure and growing interest in their natural values. Water areas, with a positive balance (+0.319), combine high demand and supply; however, part of their potential remains underutilized, creating opportunities for further development of recreational infrastructure.
This picture was complemented by the survey results. Respondents did not perceive agricultural land as a priority for tourism or recreation, despite its high service supply. In contrast, water areas and forests—consistent with the index analysis—were identified as areas of key importance, while wetlands were recognized as valuable. Despite low indicator values and limited visitation, respondents acknowledged the particular ecological value of marshes and wetlands and expressed willingness to support their protection. This indicates the potential to increase demand through educational and promotional activities.

3.4. Variation in the CES Supply—Demand Balance at the Local Level of the Municipality of Sosnowica

Rural spatial management requires balancing community needs with the environmental potential of Ecologically Functional Areas (EFAs). Analyzing the CES (Cultural Ecosystem Services) supply–demand balance at the village level helps identify areas with either untapped potential or signs of overuse. The results (Figure 10) reveal significant local variation in CES balance.
The largest surplus of CES supply was observed for agricultural areas—recorded in 27 out of 28 villages. In the case of aquatic areas, 19 villages showed a supply surplus (ranging from +0.33 to +3 points), and in 5 villages, CES supply and demand were in full balance. However, 5 other villages recorded negative values for aquatic area services (from −0.08 to −0.67), indicating a deficit. On the other hand, forested areas achieved CES supply–demand balance in only one location (settlement Turno 2). In contrast, demand exceeded supply in seven localities, while in 20 others an oversupply of cultural ecosystem services of this EFA was recorded. The lowest scores characterizing the balance of the assessed services were found for wetlands, which occur only sporadically (in just eight localities within the commune). In these areas, no balance of cultural ecosystem services was observed. The relationships described above were confirmed by the Kruskal–Wallis test, which revealed statistically significant differences among the EFA groups (Figure 10).
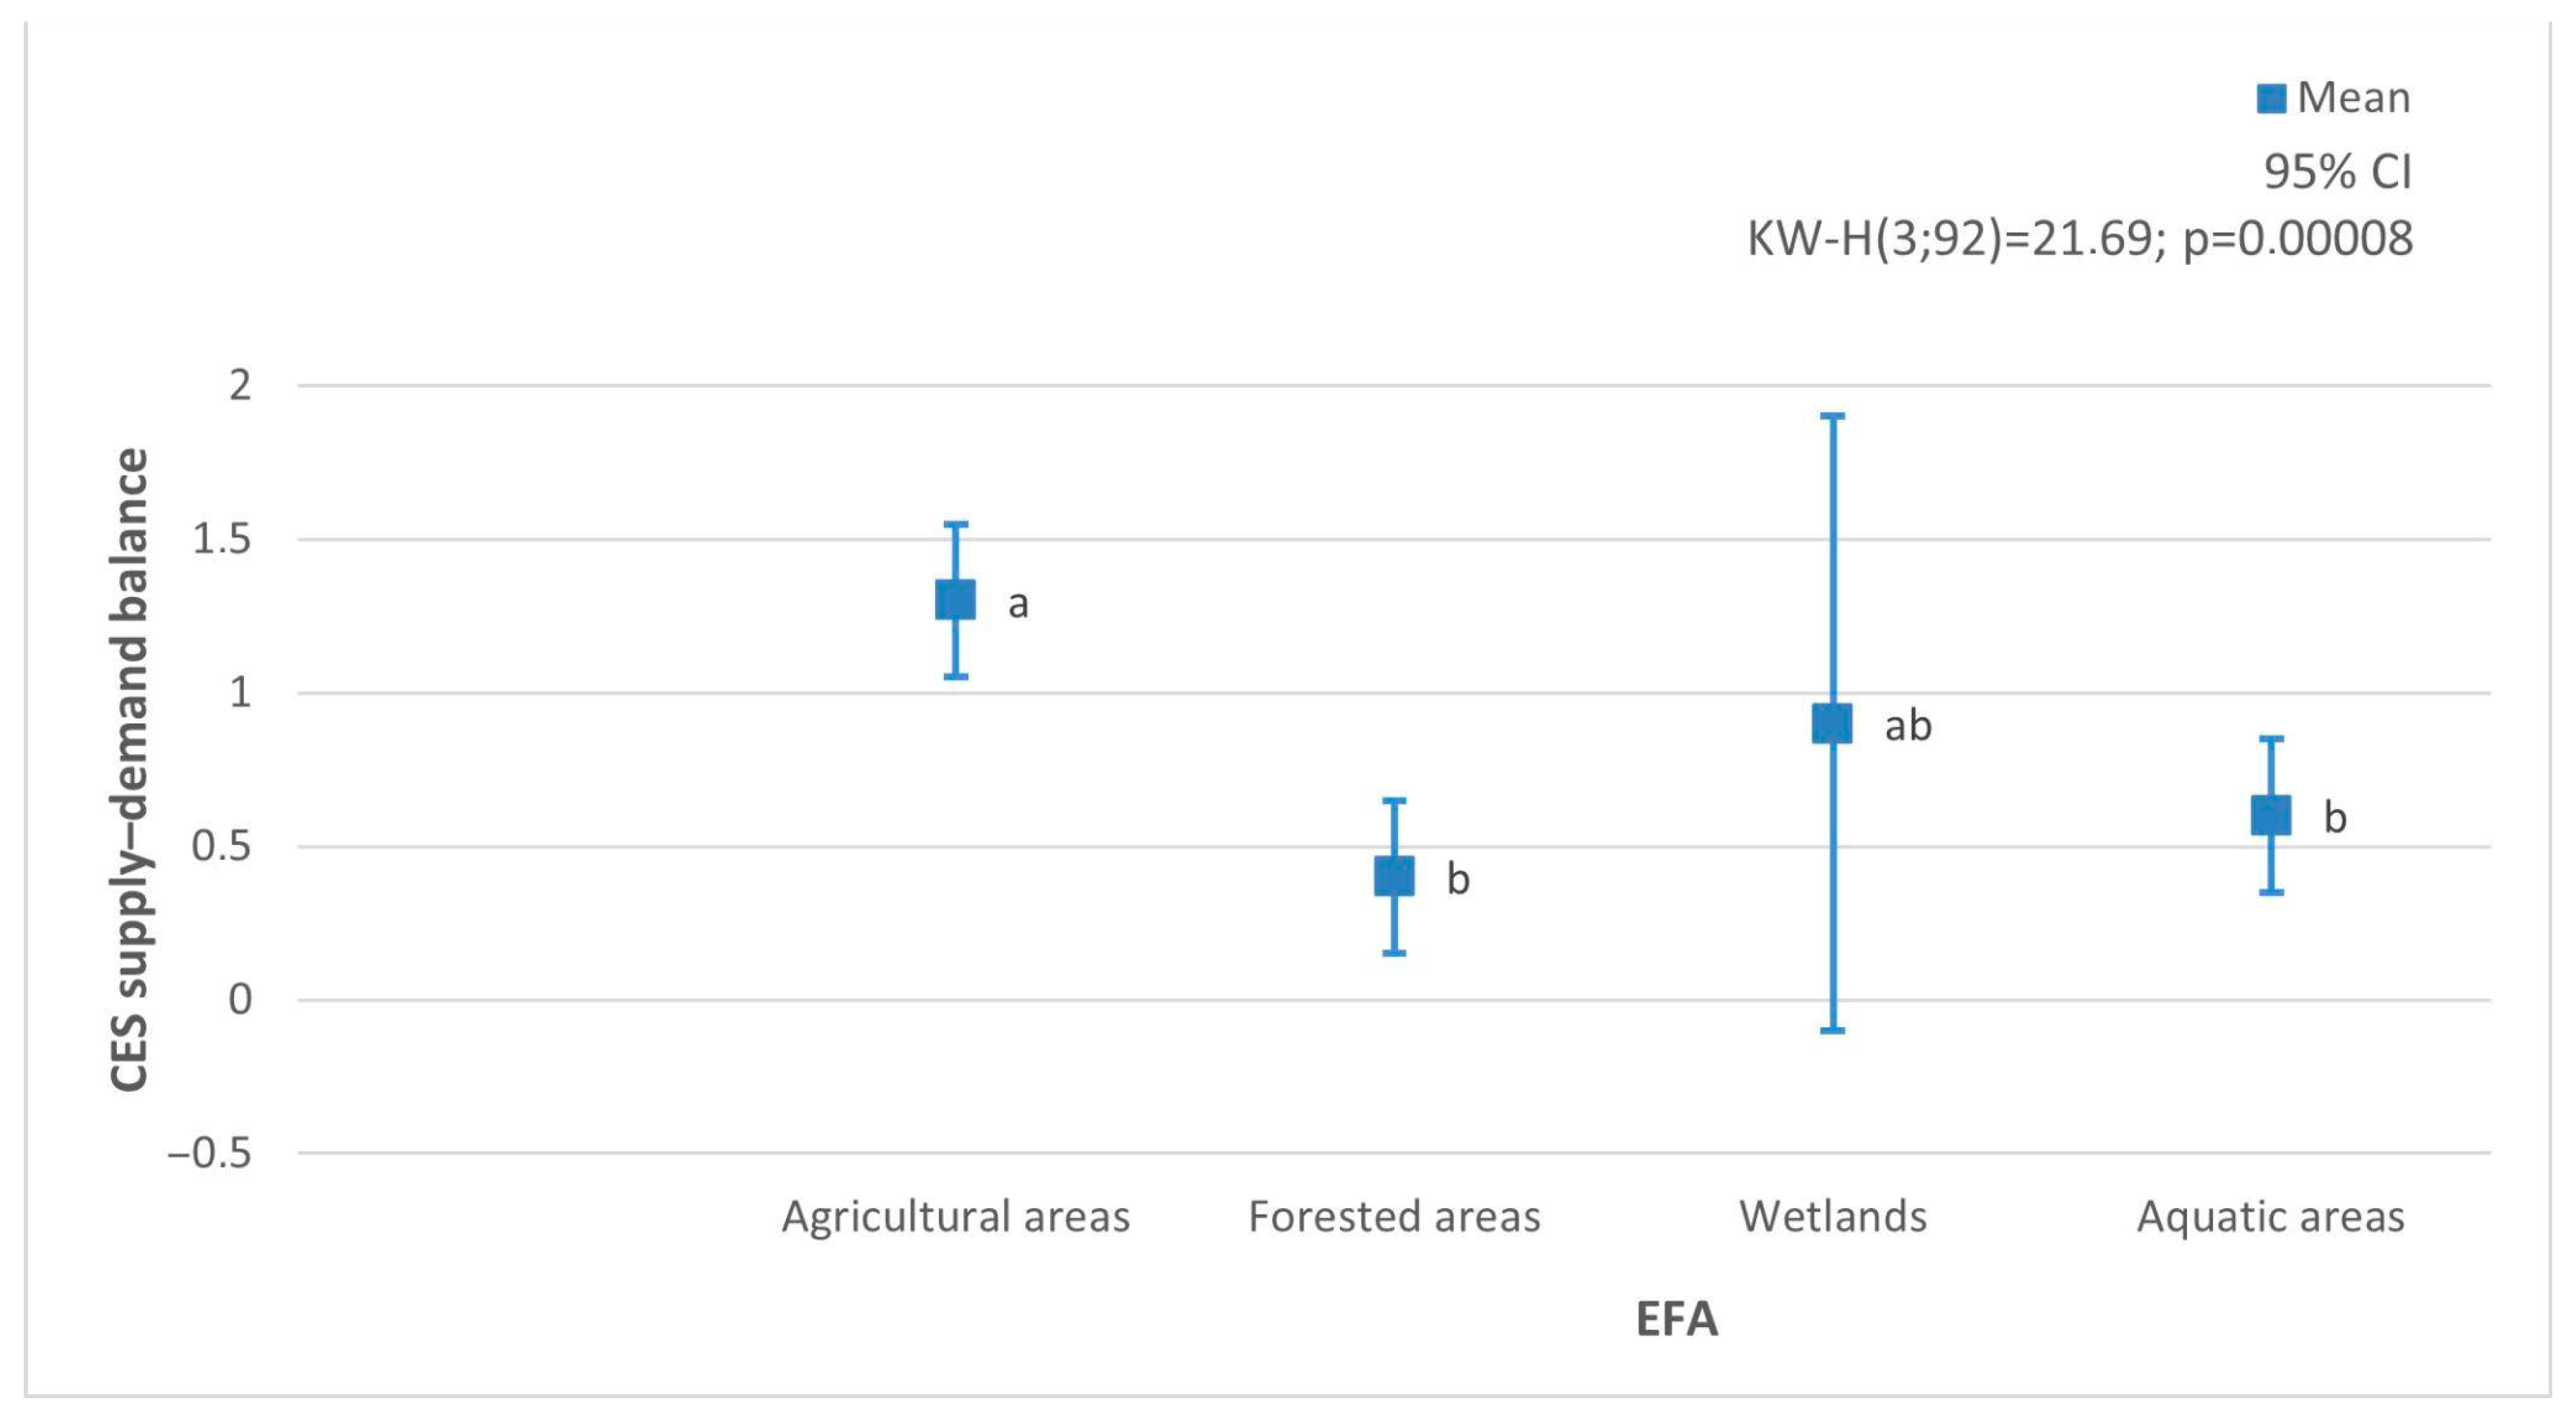
A Kruskal–Wallis test revealed statistically significant differences between EFA groups in terms of CES balance values (KW-H = 21.69; p < 0.001). The highest balance values were recorded for agricultural areas, which differed significantly from both forested areas (p < 0.001) and aquatic areas (p = 0.002) (Figure 11). In these types of EFAs, a clear dominance of environmental potential (supply) over actual spatial use (demand) was observed—indicating untapped opportunities for developing cultural functions such as tourism or environmental education.
In summary, both indicator analyses and survey research indicate the need for a differentiated approach to EFA management. Priority protection should be given to forests and waters, wetlands require educational and promotional support, and agricultural land primarily serves as a landscape backdrop and agritourism base. The combination of quantitative and participatory methods not only confirmed the research hypotheses, but also provided a better understanding of the differences between the environmental potential and social perception of these areas.

4. Discussion

Contemporary spatial planning increasingly incorporates not only environmental and economic aspects—but also social and cultural dimensions [36]. In this context, the identification and assessment of Cultural Ecosystem Services (CES)—the intangible benefits people derive from interactions with nature—gains particular importance [37]. Among these benefits are recreation and leisure in aesthetically appealing landscapes [38].
A key element in managing these services effectively is the evaluation of both supply (what the ecosystem provides) and demand (what users, residents, and visitors expect). This method integrates the environmental side (e.g., landscape accessibility, tranquility, recreation areas) with social expectations [39]. Comparing these two dimensions allows for the identification of both deficits and untapped potential, as well as to better align conservation and planning measures with social needs [40]. This approach enables the prioritization of interventions, the analysis of spatial mismatches, and the creation of indicators [41].
The ecosystem service matrix approach applied in this study helped to assess the relationship between the environment’s capacity to provide services and social demand. This method also enabled comparison of the impacts of different land uses on ecosystem functions and the evaluation of trade-offs between them. Normalization to a relative scale (0–5) allowed for the integration of different biophysical and economic dimensions, making them comparable [42]. Consequently, the method can be applied at local, regional, and national scales.
The assessed ecosystem services were classified according to the CICES framework [43,44], including, among others, recreation and tourism. Both supply and demand indicators were used for the assessment. The supply of CES was evaluated based on tourist attractiveness and transport accessibility, while demand was assessed using indicators such as tourism value, ecosystem diversity, and the use of tourist infrastructure.
CES supply was assessed based on tourism attractiveness (TAI) and the transport accessibility of individual areas. The study confirmed that different types of EFA contribute to the supply of cultural ecosystem services in distinct ways. The tourism attractiveness of agricultural, forested, and water areas was shaped by both cultural offerings and environmental qualities. Agricultural lands are often associated with the region’s cultural heritage—such as traditional farming, historic buildings, or local festivals—while visually attractive fields and pastures provide additional natural value. Likewise, forest and water tourism relies on the combination of unique environmental features [45] and the presence of cultural elements—such as educational trails, information boards, or cultural landmarks [46].
Business-related infrastructure (e.g., hotels) had a lesser influence. According to Plieninger et al. [47] and Schirpke et al. [48], in rural areas, business infrastructure plays a supporting, not decisive, role in the supply of cultural ecosystem services (CES). It is natural and cultural components that form the foundation of CES—deeply connected to people’s perception of place, emotions, and identity—not the presence of commercial facilities. While such infrastructure may enhance visitor numbers (demand), accessibility, and user comfort, it does not by itself create new cultural services. In excess, it may even reduce the aesthetic and authentic value of the landscape.
The Transport Accessibility Index outlines the importance of infrastructure in ensuring easy and efficient access to EFA areas. It captures the road network (main roads as well as local access roads), conditions, connectivity, and accompanying infrastructure (e.g., availability of parking). The findings indicate the critical role of road and transport infrastructure in determining the functionality of agricultural lands—where each improvement in accessibility may directly enhance the utility and attractiveness of the land. For other EFA types—such as forests, wetlands, or water bodies—transport accessibility remains supportive rather than decisive. Good road connections facilitate tourism development, resident mobility, and local economic growth. This knowledge can inform spatial development strategies by highlighting areas where infrastructure investments yield the greatest benefits [49].
The potential demand for cultural services was estimated using indicators of tourism value, landscape ecosystem variability, and tourism infrastructure use. The first of these indicators captures tourist activity—including visitor numbers and reviews—and is useful for identifying areas with high demand for CES [50]. Previous research [48] confirms that areas with higher landscape diversity are more valued by visitors for their aesthetic and recreational qualities. This diversity—encompassing a mix of habitats and natural features—influences both the visual appeal and the touristic attractiveness of a location.
Using tourism infrastructure as a proxy for demand is also well-supported in the literature. As Schirpke et al. [48] and Paracchini et al. [18] point out, easy access to attractive landscapes increases their recreational use—which in turn drives demand for supporting services and infrastructure. Findings by Plieninger et al. [47] confirm that physical and transport accessibility increases the frequency of landscape use, especially in rural and forested areas—thereby intensifying demand for CES.
The study clearly shows that among all evaluated biologically active areas, forested EFAs had the highest CES supply, delivering benefits to both local communities and visitors. The strong potential of these EFAs is confirmed by other studies in the field [51]. Their species richness, landscape diversity, and low human pressure make them places of active recreation, education, and inspiration [52,53]. Silence and fresh air promote well-being, as confirmed by research on the health-related functions of forests [54]. At the same time, forests and waters form a kind of recreational canon that shapes expectations toward other landscapes. They play a normative role by setting standards of attractiveness and becoming points of reference for evaluating other spaces [55].
Agricultural land demonstrated lower CES supply potential due to its dominance by production functions [47]. While they can provide some CES—such as landscape aesthetics or cultural heritage—their scope and intensity are far more limited compared to forests [56,57]. Such areas are often characterized by monotonous landscapes and a lack of recreational infrastructure [58,59]. At the same time, significant discrepancies in perception emerge: for some respondents, the agrarian landscape represents the everyday backdrop of life, while for others it remains unfamiliar. This dual perception is consistent with literature pointing to the undervaluation of the aesthetic and identity-related values of agricultural landscapes [57]. In this sense, agricultural land may be considered a “hidden resource,” whose potential can be activated through agritourism and cultural narratives.
In the studied municipality, the CES supply of EFA water-covered lands was at a moderate level (3 out of 5 possible points). The cultural attractiveness of these areas (recreation, aesthetics, tourism) was determined largely by transport accessibility, and to a lesser extent, by tourism attractiveness. According to the literature, the evaluation of such attractiveness depends on many factors. Among the most important are natural conditions, land use and infrastructure, and cultural heritage [48,59]. Similar perceptions of cultural ecosystem services were found in studies by Kowalska and Włodarczyk [60], which emphasized the importance of natural environmental features for cultural experiences—such as rest, contact with nature, quietness, and bird and landscape observation. Meanwhile, research by Kujawska et al. [61] on services such as recreation, education, and local identity showed limited awareness of CES terminology but an intuitive appreciation of their value by residents. These observations were confirmed by the survey, in which water areas played a particularly important role. Respondents identified them as especially worthy of protection and investment, which aligns with economic studies demonstrating high willingness to pay [62]. When compared with visitation frequency, a dichotomy becomes evident: even with moderate use, water areas are evaluated as resources requiring support. This shows that economic valuations are shaped not only by recreational practice but also by symbolic and normative values.
The lowest CES supply values were observed for wetlands. Although literature emphasizes their high ecological and environmental importance [63], in practice they are rarely chosen for recreation. This results from perceptual and infrastructural barriers—difficulties of use, lack of trails, or low symbolic value in public awareness [64]. The indicator-based results confirmed the survey findings: respondents assessed wetlands as less attractive, while simultaneously recognizing their high ecological value and declaring a willingness to support their protection. This indicates that the issue lies more in perception and lack of infrastructure than in an actual service deficit. The high ecological importance of wetlands does not translate into recreational experience because the absence of trails, viewpoints, and educational programs limits direct interaction. Therefore, wetlands should be treated as a “dormant resource” which—with appropriate access and interpretation—may gain greater cultural and tourism significance, as seen in peatland parks in Scandinavia or the Biebrza National Park in Poland [65]. This discrepancy between ecological potential and social accessibility highlights the need for educational initiatives and selective access to better utilize their cultural values.
The analysis of CES demand in Sosnowica municipality highlights the significance of landscape and infrastructure diversity in shaping real social interest in natural spaces [66]. The results indicate that agricultural land showed the highest demand level, likely due to high landscape heterogeneity and existing infrastructure, despite moderate levels of direct tourism use. Nevertheless, spatial diversity—resulting from the presence of hedgerows, ponds, small water bodies, or varied land use—increases the aesthetic perception of agricultural landscapes, making them more attractive to visitors. As shown by Assandri et al. (2018), traditional agricultural landscapes with mosaic structures and preserved natural elements not only support biodiversity but also strongly influence recreational and cultural heritage value [67]. Similarly, from a systems perspective, Abualhagag and Valánszki [66] indicate that tourism infrastructure and landscape compositional complexity are among the most commonly used indicators in CES demand assessment. Wang et al.’s [68] framework analysis of agricultural landscape heterogeneity also confirms that spatial diversity and space accessibility (paths, roads, viewpoints) are crucial for the spatial intensity of cultural use.
Additionally, the results of the survey confirm that the demand for cultural ecosystem services is expressed not only through landscape indicators but also in the direct behaviors and preferences of users. Respondents most frequently visited forests and aquatic areas, attributing to them the greatest touristic and identity-related importance, while agricultural land and wetlands remained in the background, playing rather complementary roles. The assessment of comfort of use and the declared willingness to support the protection of valued ecosystems indicate the growing importance of environmental quality perceptions and individual experiences in shaping demand. Similar conclusions are drawn by Plieninger et al. [47] Czajkowski et al. [62] and Chan et al. [69] who emphasize that recreational preferences, the sense of landscape aesthetics, and the social willingness to support conservation constitute key indicators of demand for cultural ecosystem services.
In Sosnowica, forest and water lands showed very strong correlations between all indices and overall CES demand, despite lower absolute demand values. This confirms the importance of aesthetics, accessibility, and infrastructure for users. In contrast, wetland areas—although rich in unique natural values—remain underappreciated due to limited development and restricted accessibility. The results align well with findings by Daniel et al. [70] and Plieninger et al. [47], who emphasize aesthetic perception and ease of access as key determinants of CES demand. They also confirm that symbolic or educational values do not automatically translate into high demand unless supported by infrastructure (e.g., interpretive trails, scenic viewpoints).
From the perspective of spatial planning and sustainable tourism development, this analysis provides important insights: enhancing the attractiveness of areas with high ecosystem potential requires not only nature protection but also investment in infrastructure that supports recreational and educational use. This is confirmed by Schröter et al. [71], who highlight that accessibility, amenities, and multifunctional land use capacity are key factors determining actual CES utilization. Thus, the cultural value of ecosystems is not inherently given—it can be significantly shaped by administrative and design decisions, as proposed by the “design for CES” approach, which incorporates user perception, spatial aesthetics, and the integration of recreational infrastructure with natural values [47,72]. Each of the EFAs analyzed displayed different relationships between CES supply and demand. In most cases, a surplus of supply over demand was observed, which corresponds to the concept of the “ecosystem service gap,” described in the literature as a situation where the availability of services does not translate into their actual use due to accessibility barriers, lack of social awareness, or insufficient integration of these services into local development strategies [71,73,74,75]. In the studied commune, wetlands were an exception: unlike other EFAs, they exhibited a CES supply deficit, which may be linked to limited infrastructure and specific site conditions [76]. At the same time, the results revealed marked differences between EFA types: forests and water areas showed the highest recreational and landscape potential, while agricultural land—despite relatively high supply—was characterized by lower recreational use, suggesting untapped opportunities for tourism development. These results are consistent with the observations of Kamiński [36] and Arnaiz-Schmitz et al. [38], who emphasized the importance of forests and waters in generating recreational and landscape values in rural areas, as well as with Hermes et al. [6], who highlighted that land-use diversity increases tourism attractiveness and supports local community development.
The CES balance analysis at the local level shows that villages with a high share of agricultural and water lands achieve better balance scores than those dominated by forest or wetland areas. These discrepancies call for a diversified planning approach—where surpluses occur, efforts should focus on improving accessibility and promoting resources, while in deficit areas, educational, infrastructural, and cultural landscape interpretation measures are necessary [77]. Such analyses serve not only as diagnostic tools but also as a foundation for sustainable spatial policy adapted to local socio-spatial conditions. Villages differ not only in land use structure but also in demographics, residents’ lifestyles, and development priorities [78,79].
In practice, there is often an imbalance between social demand and the actual ability to access CES—even when their value is high. According to Zhanga et al. [40] and Wu et al. [15], the causes are multidimensional: stemming from social, spatial, economic, and managerial factors. It is important to note that CES demand can vary depending on geographic location, EFA type, and social context. CES supply is often concentrated in areas distant from major population centers (e.g., mountains, wild forests, protected areas). Although cities generate the highest demand for CES, their use in rural areas may be limited by transport barriers and lack of infrastructure: no access roads, pathways, signage, or promotional activities. The presence of resources does not guarantee their use if they are not physically or organizationally accessible [80,81]. Balancing conservation with access is a key factor limiting CES availability, and uneven tourism distribution due to lack of promotion leads to both local overcrowding and underutilization of equally valuable areas. The mismatch between services offered and community needs worsens the issue [78]. Moreover, decision-makers often undervalue the intangible benefits of ecosystems, and the lack of investment in infrastructure, promotion, and CES management further restricts access to potential demand [82]. Other studies show that without active promotion of services and infrastructure, areas with great value may remain underutilized even when physically accessible [83]. Understanding these relationships is crucial for effective ecosystem resource management and spatial planning, and the obtained results support the relevance of a balance-based approach to CES assessment at spatial unit level.
In conclusion, the results confirm the key role of ecologically functional areas (EFA) in delivering CES—both in terms of recreation and the cultural identity of rural communities. The variation in supply and demand points to the need for planning and infrastructure actions tailored to local conditions—especially for agricultural lands and wetlands, which show untapped potential. Survey results confirmed these conclusions, showing that although agricultural land is frequently visited, it does not generate high willingness to invest in it as a tourism asset. This indicates that its potential does not lie in traditional tourism functions but in complementary services. Three realistic directions of action can be identified: (1) development of agritourism—educational programs, culinary and handicraft workshops, and engagement with traditional farming practices; (2) thematic trails—linking natural, historical, and cultural elements of agrarian landscapes (e.g., “farm-to-table” routes); and (3) small-scale infrastructure—resting places, cycling and walking paths—that improve accessibility without disrupting the everyday character of these areas. The findings align with international research [6,11], highlighting that proper EFA management supports tourism, social integration, and improved quality of life. Identified infrastructure deficits and unused potential of agricultural and wetland areas echo findings by Ottoy et al. [12], who argue that adequate management of EFA can significantly enhance recreational and tourism attractiveness in rural regions. Similar recommendations were presented by Pe’er et al. [11], stressing the importance of EFA in the EU’s Common Agricultural Policy for increasing ecosystem services, including CES. Future research should address changing tourist preferences, the impact of climate on EFA use, and more in-depth economic evaluations of CES to fully harness their potential in rural development strategies.

5. Conclusions

  • The relationships between the supply and demand of cultural ecosystem services (CES) differ significantly depending on the type of ecologically functional area (EFA). The applied method of integrating biophysical and socio-economic indicators not only confirmed these differences statistically (Kruskal–Wallis test) but also linked them to user perception.
  • Forests and agricultural land are characterized by a high supply of CES, although in the case of agricultural land this potential remains largely underutilized due to low social interest. Wetlands, in turn, exhibit a relative service deficit, which limits their tourism and recreational functions, despite their significant ecological and educational potential.
  • Agricultural land shows the largest surplus of supply over demand. Although its potential is not currently recognized by the community, it may support the development of agritourism, educational offerings, and cultural trails. However, addressing infrastructural issues (e.g., parking availability) will be essential.
  • Wetlands, despite being rated as having low tourism attractiveness by respondents, play important ecological roles and hold potential for niche forms of tourism (e.g., birdwatching, educational tourism). Local authorities should focus on protecting these areas while simultaneously promoting their unique values.
  • Most of the analyzed EFAs demonstrate a surplus of CES supply over demand, which indicates a general but underutilized potential for the development of tourism, recreation, and environmental education in the Sosnowica commune. However, the mere existence of a supply surplus does not guarantee community interest—spatial policies must be tailored to the specific characteristics of each EFA type.
  • The innovative contribution of this study lies in the integration of biophysical and social analyses within a single methodological framework. This approach enables not only the quantitative assessment of CES supply and demand but also the identification of discrepancies between environmental potential and social perception. In doing so, it provides a practical tool for planners and policymakers—highlighting where to invest in infrastructure, where to undertake promotional activities, and where to prioritize resource protection.

Supplementary Materials

The following supporting information can be downloaded at: https://www.mdpi.com/article/10.3390/su17198822/s1, File S1, Survey Questionnaire.

Author Contributions

Conceptualization, M.M.-Ś., H.L., K.A.-M. and A.D.; Methodology, M.M.-Ś., H.L., I.W.-K. and A.K. (Agnieszka Komor); Software, I.W.-K.; Validation, H.L., A.K. (Agnieszka Kępkowicz), K.A.-M., E.K. and A.D.; Resources, A.K. (Agnieszka Kępkowicz) and E.K.; Data curation, I.W.-K., A.K. (Agnieszka Kępkowicz) and E.K.; Writing—original draft, M.M.-Ś., H.L., K.A.-M. and A.D.; Writing—review & editing, M.M.-Ś., H.L., K.A.-M. and A.D.; Visualization, I.W.-K., E.K. and A.D.; Supervision, M.M.-Ś., H.L. and K.A.-M. All authors have read and agreed to the published version of the manuscript.

Funding

This research received no external funding.

Institutional Review Board Statement

This study is waived for ethical review by paragraph 7, point 2 of the Regulations of the University Ethics Committee for Research Involving Human Participants.

Informed Consent Statement

Informed consent forms of all participants have been obtained for this study.

Data Availability Statement

The data presented in this study are available on request from the corresponding author.

Conflicts of Interest

The authors declare no conflict of interest.

References

  1. Tribot, A.-S.; Deter, J.; Mouquet, N. Integrating the Aesthetic Value of Landscapes and Biological Diversity. Proc. R. Soc. B 2018, 285, 20180971. [Google Scholar]
  2. Millennium Ecosystem Assessment, Ecosystems and Human Well-Being: Synthesis; Island Press: Washington, DC, USA, 2005.
  3. Lausi, L.; Amodio, M.; Sebastiani, A.; Fusaro, L.; Manes, F. Assessing Cultural Ecosystem Services During the COVID-19 Pandemic at the Garden of Ninfa (Italy). Ann. Bot. 2022, 12, 63–75. [Google Scholar]
  4. Wyłupek, T.; Lipińska, H.; Kępkowicz, A.; Adamczyk-Mucha, K.M.; Lipiński, W.; Franczak, S.; Duniewicz, A. Cultural ecosystem services of grassland communities: A case study of lubelskie province. Sustainability 2025, 17, 6697. [Google Scholar] [CrossRef]
  5. Mikkonen, J.; Raatikainen, K.J. Aesthetics in Biodiversity Conservation. Art Crit. 2024, 82, 174–190. [Google Scholar]
  6. Hermes, J.; Van Berkel, D.; Burkhard, B.; Plieninger, T.; Fagerholm, N.; von Haaren, C. Assessment and valuation of recreational ecosystem services of landscapes. Ecosyst. Serv. 2018, 31, 289–295. [Google Scholar] [CrossRef]
  7. Notte, A.L.; Marongiu, S.; Masiero, M.; Molfetta, P.; Molignoni, R.; Cesaro, L. Livestock and Ecosystem Services: An Exploratory Approach to Assess Agri-Environment-Climate Payments of RDP in Trentino. Land 2015, 4, 688–710. [Google Scholar] [CrossRef]
  8. Huntsinger, L.; Oviedo, J.L. Ecosystem services are social–ecological services in a traditional pastoral system: The case of California’s Mediterranean rangelands. Ecol. Soc. 2014, 19, 8. [Google Scholar] [CrossRef]
  9. Vihervaara, P.; Viinikka, A.; Brander, L.; Santos-Martín, F.; Poikolainen, L.; Nedkov, S. Methodological Interlinkages for Mapping Ecosystem Services—From Data to Analysis and Decision-Support. One Ecosyst. 2019, 4, e26368. [Google Scholar] [CrossRef]
  10. Legesse, F.; Degefa Geleto, S.; Soromessa, T. Valuation Methods in Ecosystem Services: A Meta-analysis. World J. For. Res. 2022, 1, 1–12. [Google Scholar] [CrossRef]
  11. Pe’er, G.; Zinngrebe, Y.; Hauck, J.; Schindler, S.; Dittrich, A.; Essl, F. Adding some green to the greening: Improving the EU’s Ecological Focus Areas for biodiversity and farmers. Conserv. Lett. 2014, 10, 517–530. [Google Scholar] [CrossRef]
  12. Ottoy, S.; Angileri, V.; Gibert, C.; Paracchini, M.L.; Pointereau, P.; Terres, J.-M.; Van Orshoven, J.; Vranken, L.; Dicks, L.V. Impacts of selected Ecological Focus Area options in European farmed landscapes on climate regulation and pollination services: A systematic map protocol. Environ. Evid. 2018, 7, 10. [Google Scholar] [CrossRef]
  13. Newsham, N.; Rowe, F. Understanding Trajectories of Population Decline Across Rural and Urban Europe: A Sequence Analysis. Popul. Space Place 2022, 28, e2630. [Google Scholar] [CrossRef]
  14. Bański, J. Współczesne problemy i wyzwania rozwoju obszarów wiejskich w Polsce. Stud. Obsz. Wiej. 2023, 60, 15–31. [Google Scholar]
  15. Wu, S.; Liu, K.-D.; Zhang, W.; Dou, Y.; Chen, Y.; Li, D. To better understand realized ecosystem services: An integrated analysis framework of supply, demand, flow and use. arXiv 2023, arXiv:2309.15574. [Google Scholar] [CrossRef]
  16. Zhang, W.; Luo, Y.; Yi, T.; Wang, N.; Wu, J. Mapping and Assessing the Supply and Demand of Rural Cultural Ecosystem Services in Changhong Township, China. Land 2024, 14, 302. [Google Scholar] [CrossRef]
  17. Bennett, E.M.; Peterson, G.D.; Gordon, L.J. Ecosystem services supply and demand assessment: Why social–ecological dynamics matter. One Ecosyst. 2017, 2, e13276. [Google Scholar]
  18. Paracchini, M.L.; Zulian, G.; Kopperoinen, L.; Maes, J.; Schägner, J.P.; Termansen, M.; Bidoglio, G. Mapping cultural ecosystem services: A framework to assess the potential for outdoor recreation across the EU. Ecol. Indic. 2014, 45, 371–385. [Google Scholar] [CrossRef]
  19. Vrbičanová, G.; Kaisová, D.; Močko, M.; Petrovič, F.; Mederly, P. Mapping Cultural Ecosystem Services Enables Better Informed Nature Protection and Landscape Management. Sustainability 2020, 12, 2138. [Google Scholar] [CrossRef]
  20. Turčinović, M.; Vujko, A.; Stanišić, N. Community-Led Sustainable Tourism in Rural Areas: Enhancing Wine Tourism Destination Competitiveness and Local Empowerment. Sustainability 2025, 17, 2878. [Google Scholar] [CrossRef]
  21. Available online: https://www.bdl.lasy.gov.pl/portal (accessed on 17 May 2022).
  22. Available online: https://stat.gov.pl/statystyki-eksperymentalne/uslugi-publiczne/analiza-walorow-turystycznych-powiatow-i-ich-bezposredniego-otoczenia,1,1.html (accessed on 7 December 2022).
  23. Available online: https://nowa.sosnowica.pl/gmina/walory-gminy (accessed on 4 December 2022).
  24. Available online: https://polesie-sosnowica.pl/ (accessed on 8 October 2020).
  25. Strategia Rozwoju Gminy Sosnowica na Lata 2015–2020. 2015. Available online: https://nowa.sosnowica.pl/wp-content/uploads/2020/06/006_Aktualizacja_strategii_rozwoju_gminy_SOSNOWICA_2015_2020.pdf (accessed on 2 June 2021).
  26. Available online: https://lublin.stat.gov.pl/opracowania-biezace/opracowania-sygnalne/ludnosc/stan-i-ruch-naturalny-ludnosci-w-wojewodztwie-lubelskim-w-2024-r-,1,29.html (accessed on 15 June 2025).
  27. Available online: https://crfop.gdos.gov.pl/CRFOP/ (accessed on 18 March 2022).
  28. Available online: https://geoportal.gov.pl (accessed on 25 February 2021).
  29. Available online: https://www.eea.europa.eu/data-and-maps/data/eunis-habitat-classification (accessed on 6 November 2020).
  30. Modification of the Spatial Development Plan Study for the Municipality of Sosnowica original: Zmiana studium uwarunkowań i kierunków zagospodarowania przestrzennego gminy Sosnowica. Kierunki, 2011. Available online: https://mpzp.igeomap.pl/doc/parczew/sosnowica/000.pdf (accessed on 15 January 2021).
  31. Available online: https://geoserwis.gdos.gov.pl/mapy/ (accessed on 11 September 2020).
  32. Available online: https://bdl.stat.gov.pl/bdl/start (accessed on 10 May 2021).
  33. Available online: https://www.geoportal.gov.pl/dane/baza-danych-obiektow-topograficznych-bdot (accessed on 16 January 2020).
  34. Available online: https://stat.gov.pl/files/gfx/portalinformacyjny/pl/defaultaktualnosci/5494/1/13/1/turystyka_w_2015.pdf?fbclid=IwY2xjawM4vcJleHRuA2FlbQIxMABicmlkETA2TklLUXJuUHg2blppaDFPAR64yklnwgVRaPGXH7mHDTwntRtepbD-b3ewEoEgevtmNyqTg4Bz1Lkgyx5p-Q_aem_7zXSJHhWtySkfGfunBbpWA (accessed on 25 February 2021).
  35. Szromek, A.R. Pomiar funkcji turystycznej obszarów za pomocą wskaźników funkcji turystycznej na przykładzie obszarów państw europejskich. Studia Ekonomiczne. Zastos. Metod. Mat. W Ekon. I Zarządzaniu 2013, 132, 91–103. [Google Scholar]
  36. Kamiński, P. Valuation of Recreational Ecosystem Services: Examples and Application Issues. Stud. I Pr. WNEiZ 2022, 69, 34–47. [Google Scholar]
  37. Tindale, S.; Vicario-Modro, V.; Gallardo-Cobos, R.; Hunter, E.; Miskolci, S.; Newell Price, P.; Sánchez-Zamora, P.; Sonnevelt, M.; Ojo, M.; McInnes, K.; et al. Citizen Perceptions and Values Associated with Ecosystem Services from European Grassland Landscapes. Land Use Policy 2023, 127, 106574. [Google Scholar] [CrossRef]
  38. Arnaiz-Schmitz, C.; Herrero-Jáuregui, C.; Gutiérrez-Angonese, J.; Schmitz, M.F. Cultural ecosystem services and social-ecological resilience in rural landscapes: A case study in Mediterranean dehesas. Landsc. Urban Plan. 2021, 214, 104164. [Google Scholar] [CrossRef]
  39. Zhao, S.; Li, Y.; Nie, Z.; Li, Y. Supply–Demand Assessment of Cultural Ecosystem Services in Urban Parks of Plateau River Valley City: A Case Study of Lhasa. Land 2025, 14, 1301. [Google Scholar] [CrossRef]
  40. Zhang, J.; He, C.; Huang, Q.; Li, J.; Qi, T. Evaluating the supply and demand of cultural ecosystem services in the Tibetan Plateau of China. Landsc. Ecol. 2022, 37, 2131–2148. [Google Scholar] [CrossRef]
  41. Yang, Y.; Jiang, L.; Ma, X.; Liu, S.; Wang, L. A Comprehensive Approach to Identifying the Supply and Demand of Urban Park Cultural Ecosystem Services in the Megalopolis Area of Shanghai, China. Land 2025, 14, 455. [Google Scholar] [CrossRef]
  42. Liu, Y.-L.; Chiang, J.-T.; Ko, P.-F. The Benefits of Tourism for Rural Community Development. Humanit. Soc. Sci. Commun. 2023, 10, 137. [Google Scholar] [CrossRef] [PubMed]
  43. Haines-Young, R.; Potschin, M. Common International Classification of Ecosystem Services (CICES) V5.1—Guidance on the Application of the Revised Structure; European Environment Agency: Copenhagen, Denmark, 2018; Available online: https://cices.eu/resources/ (accessed on 10 June 2021).
  44. Solon, J.; Zielińska, E.; Affek, A.; Kowalska, A.; Grabińska, B.; Kruczkowska, B.; Wolski, J.; Degórski, M.; Kołaczkowska, E.; Regulska, E.; et al. Świadczenia Ekosystemowe w Krajobrazie Młodoglacjalnym. Ocena Potencjału i Wykorzystania; Instytut Geografii i Przestrzennego Zagospodarowania PAN, Wydawnictwo Akademickie SEDNO: Warszawa, Poland, 2017; ISBN 9788379630622. [Google Scholar]
  45. Fornal-Pieniak, B.E.; Żarska, B. Evaluation of Landscape Natural Values in Tourism, with Special Emphasis on Vegetation. Pol. J. Environ. Stud. 2021, 30, 663–674. [Google Scholar] [CrossRef]
  46. Kreye, M.M.; Adams, D.C.; Ghimire, R.; Morse, W.; Bowker, J.M. Forest Ecosystem Services: Cultural Values. In General Technical Report SRS-226; U.S. Department of Agriculture Forest Service, Southern Research Station: Asheville, NC, USA, 2017; pp. 1–20. [Google Scholar]
  47. Plieninger, T.; Dijks, S.; Oteros-Rozas, E.; Bieling, C. Assessing, mapping, and quantifying cultural ecosystem services at community level. Land Use Policy 2013, 33, 118–129. [Google Scholar] [CrossRef]
  48. Schirpke, U.; Scolozzi, R.; Dean, G.; Haller, A.; Jäger, H.; Kister, J.; Kovács, B.; Sarmiento, F.O.; Sattler, B.; Schleyer, C. Cultural ecosystem services in mountain regions: Conceptualising conflicts among users and limitations of use. Ecosyst. Serv. 2020, 46, 101210. [Google Scholar] [CrossRef]
  49. Chen, W.; Zeng, Y.; Zeng, J. Impacts of traffic accessibility on ecosystem services: An integrated spatial approach. J. Geogr. Sci. 2021, 31, 1816–1836. [Google Scholar] [CrossRef]
  50. Zhang, Y.; Fu, B.; Sun, J.; da Silva, R.F.B. Quantifying supply and demand of cultural ecosystem services from a dynamic perspective. Land Use Policy 2025, 148, 107414. [Google Scholar] [CrossRef]
  51. Leban, V.; Zadnik Stirn, L.; Pezdevšek Malovrh, Š. Investigating potential supply of ecosystem services in cultural landscapes through efficiency analysis. Environ. Manag. 2024, 74, 161–179. [Google Scholar] [CrossRef]
  52. Torralba, M.; Lovrić, M.; Roux, J.-L.; Budniok, M.-A.; Mulier, A.-S.; Winkel, G.; Plieninger, T. Examining the relevance of cultural ecosystem services in forest management in Europe. Ecol. Soc. 2020, 25, 2. [Google Scholar] [CrossRef]
  53. Janeczko, E.; Woźnicka, M.; Kargul Plewa, D. Leśne ścieżki edukacyjne a problematyka gospodarowania wodą w lasach. Stud. I Mater. CEPL W Rogowie 2016, 18, 162–169. [Google Scholar]
  54. Soroka, A.; Mazurek-Kusiak, A.; Wojciechowska-Solis, J.; Hawlena, J. Importance of forest resources in health tourism—Wigierski National Park case study. Sylwan 2016, 160, 64–70. [Google Scholar]
  55. Janeczko, E.; Woźnicka, M.; Woźnicki, S. Funkcje zdrowotne lasów i ich wykorzystanie w rekreacji i turystyce. Sylwan 2018, 162, 524–534. [Google Scholar]
  56. Pellaton, R.; Lellei Kovács, E.; Báldi, A. Cultural ecosystem services in European grasslands: A systematic review of threats. Ambio 2022, 51, 2462–2477. [Google Scholar] [CrossRef]
  57. Milcu, A.I.; Hanspach, J.; Abson, D.; Fischer, J. Cultural ecosystem services: A literature review and prospects for future research. Ecol. Soc. 2013, 18, 44. [Google Scholar] [CrossRef]
  58. Balázsi, Á.; Dänhardt, J.; Collins, S.; Schweiger, O.; Settele, J.; Hartel, T. Understanding cultural ecosystem services related to farmlands: Expert survey in Europe. Land Use Policy 2021, 100, 104900. [Google Scholar] [CrossRef]
  59. Gonda, T. The importance of infrastructure in the development of accessible tourism. Journal of Infrastructure. Policy Dev. 2024, 8, 2735. [Google Scholar]
  60. Kowalska, A.; Włodarczyk, B. Ekosystemowe usługi kulturowe w planowaniu przestrzennym. Turyzm/Tourism 2020, 30, 23–30. [Google Scholar]
  61. Kujawska, M.; Łuczaj, Ł.; Typek, J. Cultural ecosystem services of rural landscapes: A case study from Poland. Sustainability 2020, 12, 4036. [Google Scholar]
  62. Czajkowski, M.; Budziński, W.; Campbell, D.; Giergiczny, M.; Hanley, N. Spatial Heterogeneity of Willingness to Pay for Forest Management. Environ. Resour. Econ. 2017, 68, 705–727. [Google Scholar] [CrossRef]
  63. Ghermandi, A.; van den Bergh, J.C.J.M.; Brander, L.M.; de Groot, H.L.F.; Nunes, P.A.L.D. Values of natural and human-made wetlands: A meta-analysis. Water Resour. Res. 2010, 46, W12516. [Google Scholar] [CrossRef]
  64. Sucholas, J.; Molnár, Z.; Łuczaj, Ł.; Poschlod, P. Local traditional ecological knowledge about hay management practices in wetlands of the Biebrza Valley, Poland. J. Ethnobiol. Ethnomed. 2022, 18, 9. [Google Scholar] [CrossRef]
  65. Kiryluk, H.; Borkowska Niszczota, M. Evaluating attractiveness of Biebrza National Park tourist values as a result of questionnaire research. Ekon. I Zarządzanie 2009, 1, 63–87. [Google Scholar]
  66. Abualhagag, A.; Valánszki, I. Overview Analysis of Cultural Ecosystem Services: Mapping Indicators and Categories Classification. Pol. J. Nat. Sci. 2021, 36, 333–358. [Google Scholar]
  67. Assandri, G.; Bogliani, G.; Pedrini, P.; Brambilla, M. Beautiful agricultural landscapes promote cultural ecosystem services and biodiversity conservation. Agric. Ecosyst. Environ. 2018, 326, 200–210. [Google Scholar] [CrossRef]
  68. Wang, X.; Wu, Y.; Manevski, K.; Fu, M.; Yin, X.; Chen, F. A Framework for the Heterogeneity and Ecosystem Services of Farmland Landscapes: An Integrative Review. Sustainability 2021, 22, 12463. [Google Scholar] [CrossRef]
  69. Chan, K.M.A.; Guerry, A.D.; Balvanera, P.; Klain, S.; Satterfield, T.; Basurto, X.; Bostrom, A.; Chuenpagdee, R.; Gould, R.; Halpern, B.S.; et al. Where are ‘Cultural’ and ‘Social’ in Ecosystem Services? BioScience 2012, 62, 744–756. [Google Scholar] [CrossRef]
  70. Daniel, T.C.; Muhar, A.; Arnberger, A.; Aznar, O.; Boyd, J.W.; Chan, K.M.A.; Dunk, A. Contributions of cultural services to the ecosystem services agenda. Proc. Natl. Acad. Sci. USA 2012, 109, 8812–8819. [Google Scholar] [CrossRef] [PubMed]
  71. Schröter, M.; van der Zanden, E.H.; van Oudenhoven, A.P.E.; Remme, R.P.; Serna-Chavez, H.M.; de Groot, R.S.; Opdam, P. Ecosystem services as a contested concept: A synthesis of critique and counter-arguments. Conserv. Lett. 2014, 7, 514–523. [Google Scholar] [CrossRef]
  72. Tengberg, A.; Fredholm, S.; Eliasson, I.; Knez, I.; Saltzman, K.; Wetterberg, O. Cultural ecosystem services provided by landscapes: Assessment of heritage values and identity. Ecosyst. Serv. 2012, 2, 14–26. [Google Scholar] [CrossRef]
  73. Burkhard, B.; Kroll, F.; Nedkov, S.; Müller, F. Mapping ecosystem service supply, demand and budgets. Ecol. Indic. 2012, 21, 17–29. [Google Scholar] [CrossRef]
  74. Geijzendorffer, I.R.; Martín-López, B.; Roche, P.K. Improving the identification of mismatches in ecosystem services assessments. Ecol. Indic. 2015, 52, 320–331. [Google Scholar] [CrossRef]
  75. Baró, F.; Gómez-Baggethun, E.; Haase, D. Mapping ecosystem service capacity, flow and demand for landscape and urban planning: A case study in the Barcelona metropolitan region. Land Use Policy 2016, 57, 405–417. [Google Scholar] [CrossRef]
  76. Wood, K.A.; Jupe, L.L.; Aguiar, F.C.; Collins, A.M.; Davidson, S.J.; Freeman, W.; Kirkpatrick, L.; Lobato-de Magalhães, T.; McKinley, E.; Nuno, A. A global systematic review of the cultural ecosystem services provided by wetlands. Ecosyst. Serv. 2024, 70, 101673. [Google Scholar] [CrossRef]
  77. Balzan, M.V.; Caruana, J.; Zammit, A. Assessing the capacity and flow of ecosystem services in multifunctional landscapes: Evidence of a rural-urban gradient in a Mediterranean small island state. arXiv 2017, arXiv:1712.02851. [Google Scholar] [CrossRef]
  78. Turkelboom, F.; Leone, M.; Jacobs, S.; Kelemen, E.; GarcíaLlorente, M.; Baró, F.; Barton, D.N. When we cannot have it all: Ecosystem services tradeoffs in the context of spatial planning. Ecosyst. Serv. 2018, 29, 566–57851. [Google Scholar] [CrossRef]
  79. Beichler, S.A.; Hasibovic, S.; Davidse, B.J.T.; Deppisch, S.; Koo, H.G. Integrative analysis of ecosystem services in human-environment systems: Integrating stakeholder perspectives and scientific modelling. J. Environ. Manag. 2015, 161, 409–423. [Google Scholar]
  80. Valánszki, I.; Kristensen, L.S.; Jombach, S.; Ladányi, M.; Filepné Kovács, K.; Fekete, A. Assessing Relations between Cultural Ecosystem Services, Physical Landscape Features and Accessibility in Central-Eastern Europe: A PPGIS Empirical Study from Hungary. Sustainability 2022, 14, 754. [Google Scholar] [CrossRef]
  81. Li, C.; Pan, Y.; Yin, W.; Lan, S. Spatial distribution and influencing factors of rural cultural ecosystem services: A case study of Fujian, China. Sci. Rep. 2025, 15, 10510. [Google Scholar] [CrossRef] [PubMed]
  82. Fu, B.; Xu, P.; Wang, Y.; Guo, Y.; Zhang, Y.; Li, S. Critical areas linking the supply and demand of cultural ecosystem services: Accessibility and geological disasters. Glob. Ecol. Conserv. 2020, 21, e00839. [Google Scholar] [CrossRef]
  83. Cheng, X.; Van Damme, S.; Li, L.; Uyttenhove, P. Cultural ecosystem services in an urban park: Understanding bundles, tradeoffs, and synergies. Landsc. Ecol. 2022, 37, 1693–1705. [Google Scholar] [CrossRef]
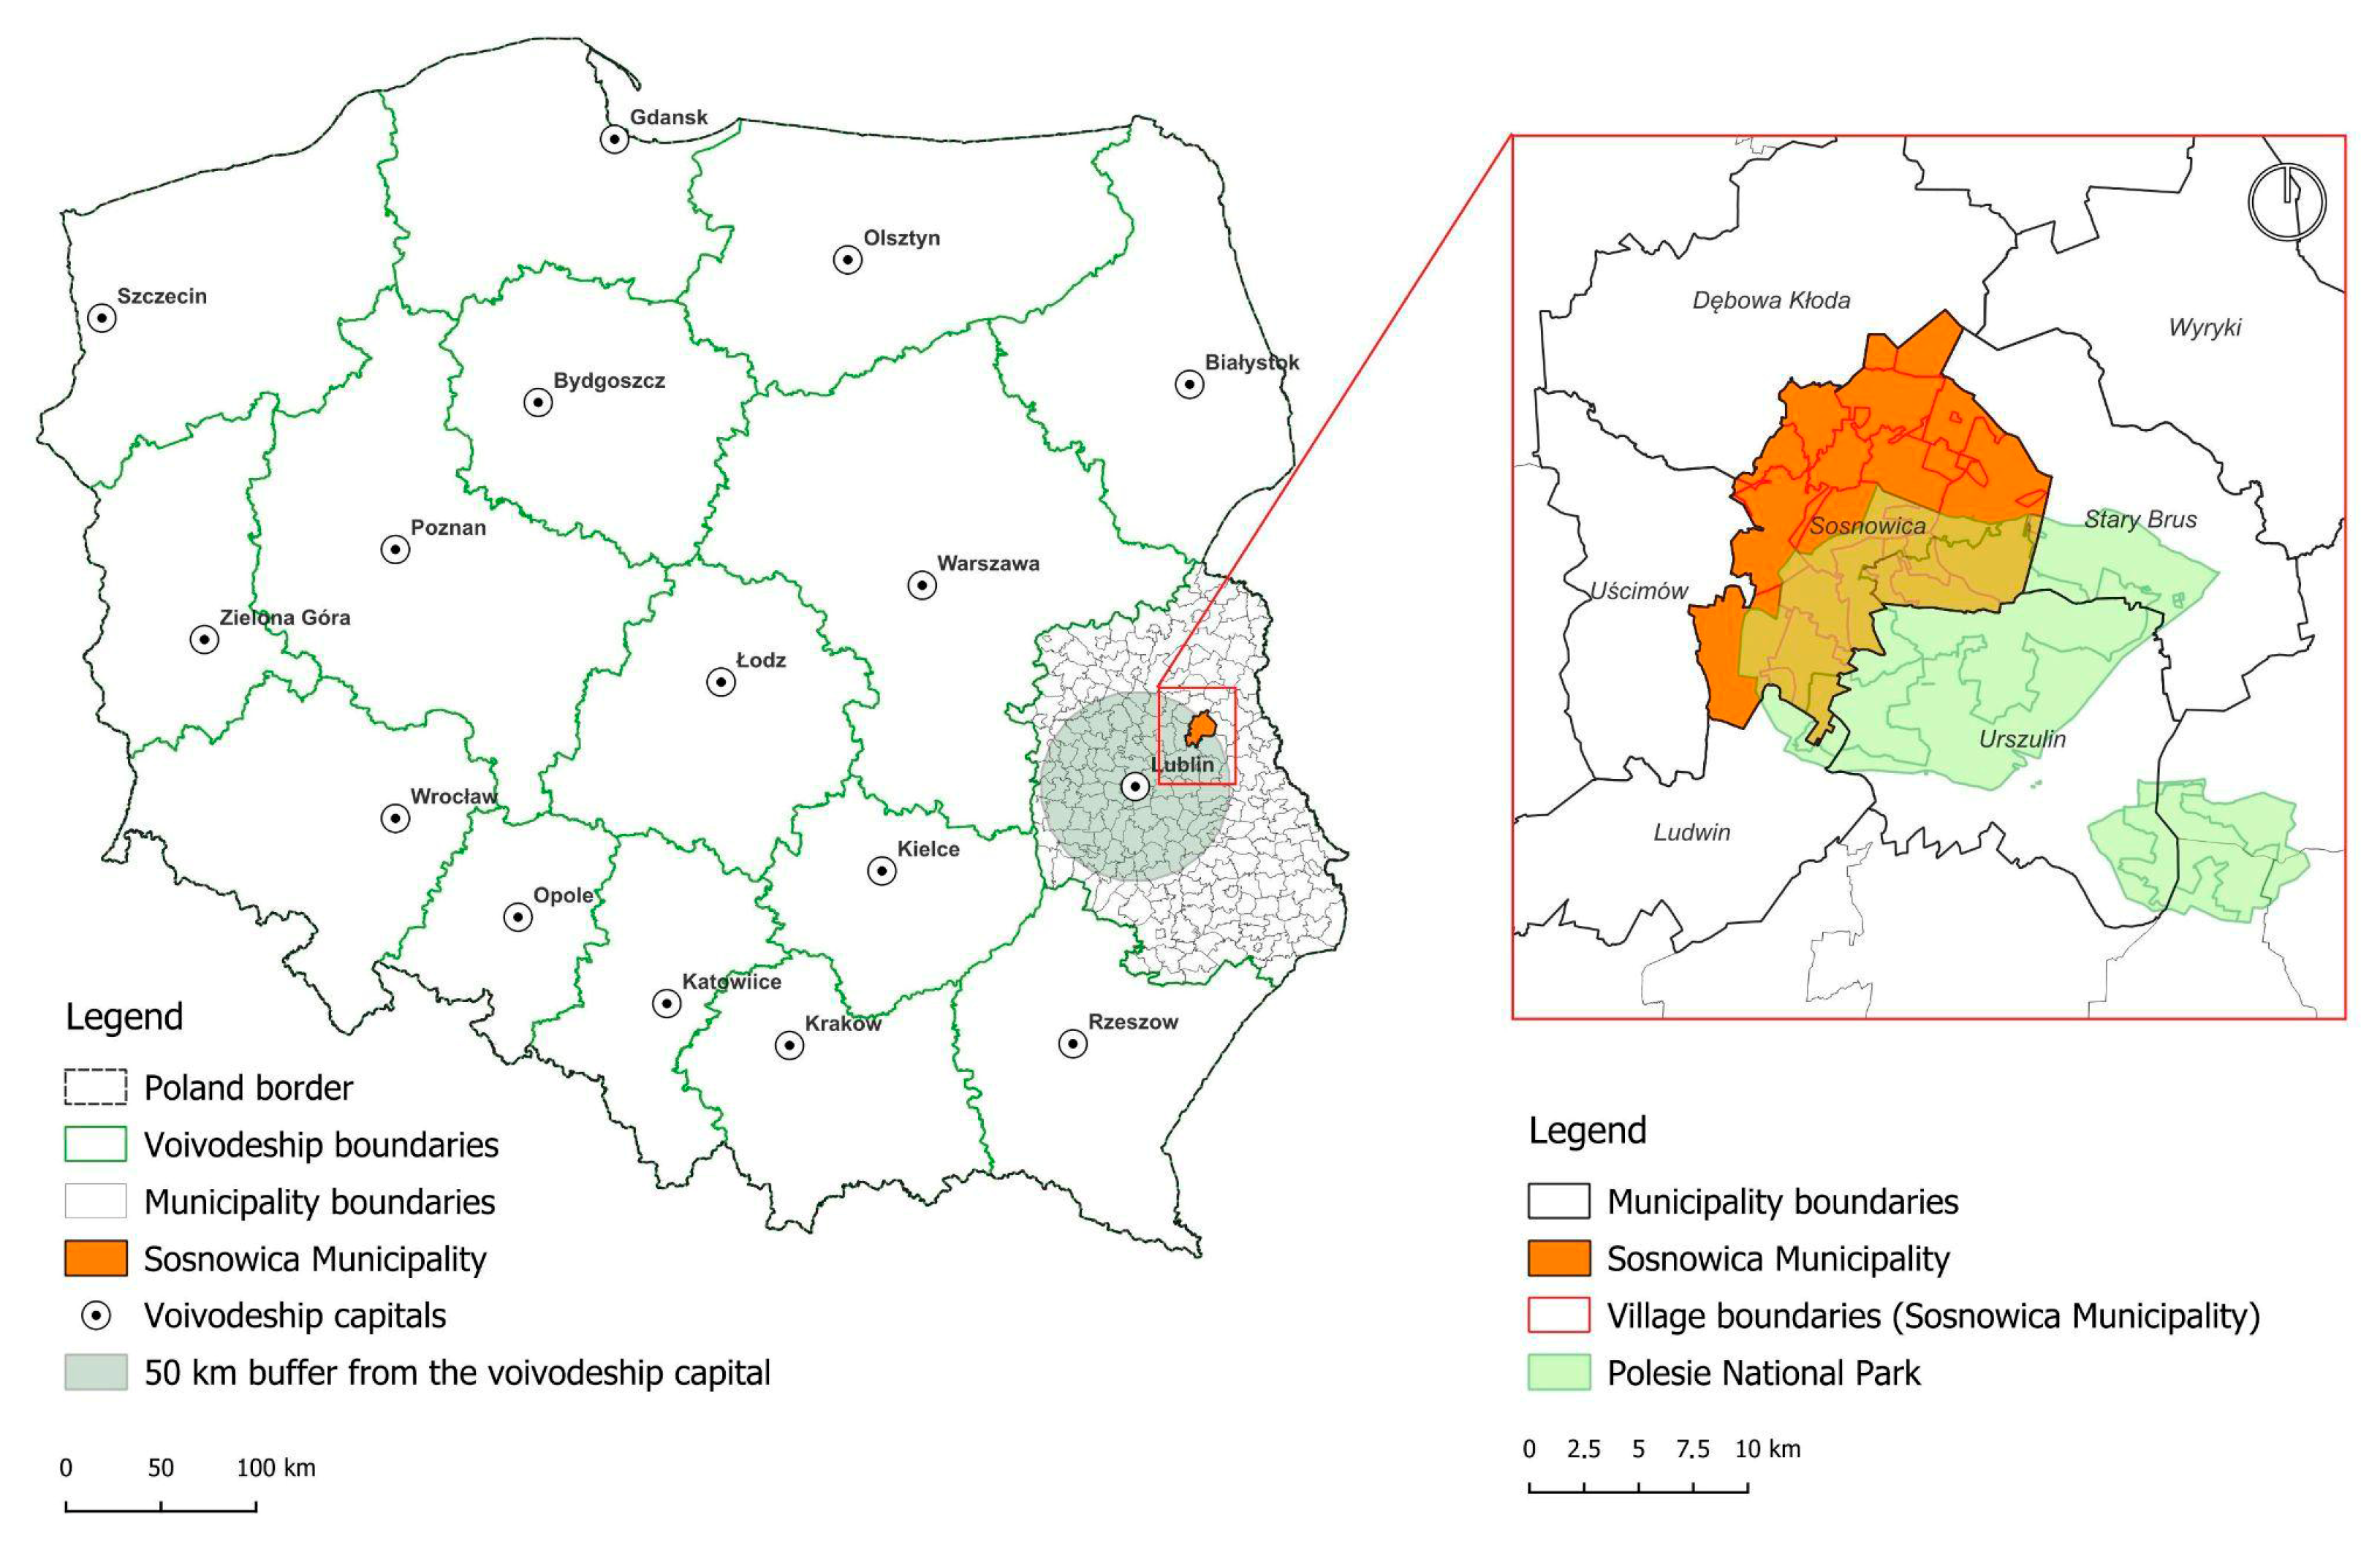
Figure 1. Location of the study area against the background of the administrative division of Poland.
Sustainability 17 08822 g001
Figure 2. Average (by village) biophysical values of the components of the Tourism Attractiveness Index (TAI) and the Transport Accessibility Index (TRAI) in the Sosnowica commune, calculated as mean values for the period 2020–2023 (Same letters (e.g., two bars labeled with the letter “a”)—no significant difference between these groups; Different letters (e.g., “a” vs. “b”)—significant difference between these groups; Letter “ab”—this group is not significantly different from either group “a” or “b”—it is intermediate).
Sustainability 17 08822 g002
Figure 3. Comparison of survey data with indicator-based assessment of tourism attractiveness and transport accessibility of ecologically functional areas (EFA) in the Sosnowica commune. The results are presented on a five-point scale: 0—none, 1—very low, 2—low, 3—moderate, 4—high, 5—very high, 6—extreme high.
Sustainability 17 08822 g003
Figure 4. Percentage of responses indicating how visitor satisfaction was affected by traffic intensity across different locations (Agricultural areas, Forested areas, Wetlands areas, Aquatic areas).
Sustainability 17 08822 g004
Figure 5. Biophysical values of CES supply (mean of TAI and TRAI) in EFAs of the municipality of Sosnowica (mean values for 2020–2023) (Same letters (two bars labeled with the letters “ab”)—no significant difference between these groups; Different letters (“a” vs. “b”)—significant difference between these groups; Letter “ab”—this group is not significantly different from either group “a” or “b”—it is intermediate).
Sustainability 17 08822 g005
Figure 6. Average (by village) biophysical values of demand for cultural ecosystem services and their value depending on EFA in the municipality of Sosnowica (average for 2020–2023) (Different letters (“a”, “c”, “d”)—significant difference between these groups; Letter “ab”—intermediate group is not significantly different from group “a”).
Sustainability 17 08822 g006
Figure 7. Point-based (matrix) assessment of CES supply and demand across EFAs in the municipality of Sosnowica (average for 2020–2023). Legend: supply or demand rating: very high—5 pts; high—4 pts; moderate—3 pts; low—2 pts; very low—1 pt; none—0.
Sustainability 17 08822 g007
Figure 8. Use vs. Willingness to Pay (WTP) for Maintaining Tourism and Nature Values. Each marker (cross) in the figure represents a combination of average number of visits per year per person (x-axis) and average willingness to pay (WTP) per visit in EUR (y-axis) for a given type of ecologically functional area (EFA: agricultural land, forest land, water land, wetland). Annual WTP = Average visits per year × Average WTP per visit.
Sustainability 17 08822 g008
Figure 9. Discrepancy between CES supply and demand across EFAs in the municipality of Sosnowica (average for 2020–2023).
Sustainability 17 08822 g009
Figure 10. Balance of CES supply and demand across EFAs in individual villages of the Sosnowica municipality (average for 2020–2023).
Sustainability 17 08822 g010
Figure 11. Comparison of CES supply–demand balance by EFA type (groups not sharing letters “a–b” differ significantly) a–b—groups not sharing the same letters differ significantly in distribution.
Sustainability 17 08822 g011
Table 1. Indicators Used to Assess CES Supply.
IndexComponents of the IndexPoint Rating
Tourism Attractiveness Index (TAI)Environmental Attractiveness Index (EAI)
e.g., shoreline length, surface of waters/protected areas/Natura 2000
0–5
Cultural Attractiveness Index (CAI)
e.g., number of tourists, heritage assets (incl. UNESCO/Historic Monuments), event participants
Business and Hospitality Attractiveness Index (BHAI)
e.g., accommodation capacity, conference rooms
Procedure:
aggregate components → normalize to 0–5 → synthesize into TAI (higher value = higher attractiveness).
Transport Accessibility Index (TRAI)Access to Ecologically Functional Areas (EFA) via paved roads [km] (I1)1–5
Road distance from the village center to the EFA [km] (I2)
Distance from the EFA to the nearest parking lot or designated stopping point [km] (I3)
Procedure:
Distance classes: 0–1; 1.1–2; … >5 km; the farther, the lower the score
Table 2. Indicators Used to Assess CES Demand [35].
IndexComponents of the IndexPoint Rating
Tourist Traffic Utilization Index (TTU)Number of tourists using overnight accommodations1–5
with thresholds from the data distribution (Jenks natural breaks)
Area of ecologically functional land [km2]
Landscape Ecosystem Variability Index (LEVD)Area of land-use change in 1990–20211–5
greater change/loss of natural values → lower score
Infrastructure Traffic Utilization Index (ITUI)Counts of pedestrians, cyclists, and vehicles near EFAs (field surveys in July–August 2021)1–5
increase with traffic intensity
Table 3. Pearson’s linear correlation coefficients between the partial indicators of tourism attractiveness (CAI—Cultural Attractiveness Index, EAI– Environmental Attractiveness Index, BHAI—Business Attractiveness Index) and transport accessibility (I1—access via paved road, I2—road distance from the village center, I3—distance to the nearest parking lot) and their respective synthetic indices TAI (Tourism Attractiveness Index) TRAI (Transport Accessibility Index), describing the supply of cultural ecosystem services (CES) in ecologically functional areas (EFA) of the Sosnowica commune.
EFATAI ComponentTRAI Component
CAIEAIBHAII1I2I3
Agricultural areas0.830.980.590.980.950.96
Forested areas0.790.930.660.80.730.7
Wetlands0.970.990.190.470.490.38
Aquatic areas0.80.930.490.80.630.69
Table 4. Pearson’s correlation coefficients between TAI and TRAI values and the CES supply level in Ecologically Functional Areas (EFAs) in the municipality of Sosnowica.
EFAAgricultural AreasForested AreasWetlandsAquatic Areas
IndicesTAITRAITAITRAITAITRAITAITRAI
CES Supply0.730.780.720.480.910.96−0.250.96
TAI—Tourism Attractiveness Index, TRAI—Transport Accessibility Index.
Table 5. Pearson’s correlation coefficients between TTU (Tourist Traffic Utilization Index), LEVD (Landscape Ecosystem Variability Index), and ITUI (Infrastructure Traffic Utilization Index), and the total CES demand for each EFA type in the municipality of Sosnowica.
CES Sub-IndicesEFA
Agricultural AreasForested AreasWetlandsAquatic Areas
TTU0.410.930.800.99
LEVD0.990.970.780.99
ITUI0.630.980.840.99
Disclaimer/Publisher’s Note: The statements, opinions and data contained in all publications are solely those of the individual author(s) and contributor(s) and not of MDPI and/or the editor(s). MDPI and/or the editor(s) disclaim responsibility for any injury to people or property resulting from any ideas, methods, instructions or products referred to in the content.