1. Introduction
The glacial melting of ice and the expansion of warm water due to global warming have accelerated sea level rise (SLR) in coastal regions [
1]. The global average rate of SLR was 0.06 inches/yr (1.5 mm/yr) from 1880 to 2013, whereas the relative sea level change in the mid-Atlantic coast and parts of the Gulf Coast of the United States (US) has been registered as more than 8 inches (20.3 cm), which equates to 0.13 inches/yr (3.3 mm/yr) on average between 1960 and 2021 [
2]. Without any mitigation strategies to curb greenhouse gas (GHG) emissions, the global temperature is predicted to increase 37.9 °F (3.3 °C) over the pre-industrial level, and the corresponding SLR will be 22.6 inches (57.4 cm) above the 2021 level by 2100 [
3]. Recent forecasts highlight accelerating feedbacks, where higher global temperatures increase ice sheet mass loss and thermal expansion, compounding the pace of SLR through the end of the century [
1,
3]; the US indicator records confirm this acceleration in relative sea level since the late twentieth century [
2].
Rising water tables and salinity can cause significant changes in freshwater forested wetlands. This impact is characterized by loss of species diversity, seedling regeneration, and distribution of salt-sensitive species. As tidal freshwater forests deteriorate, they are more vulnerable to salinity intrusion and inundation, which can displace forest cover and force transitions to marshland or open water [
4]. Such ghost forest formations are already well documented along the Atlantic and Gulf Coasts, highlighting the vulnerability of southeastern coastal forests to SLR [
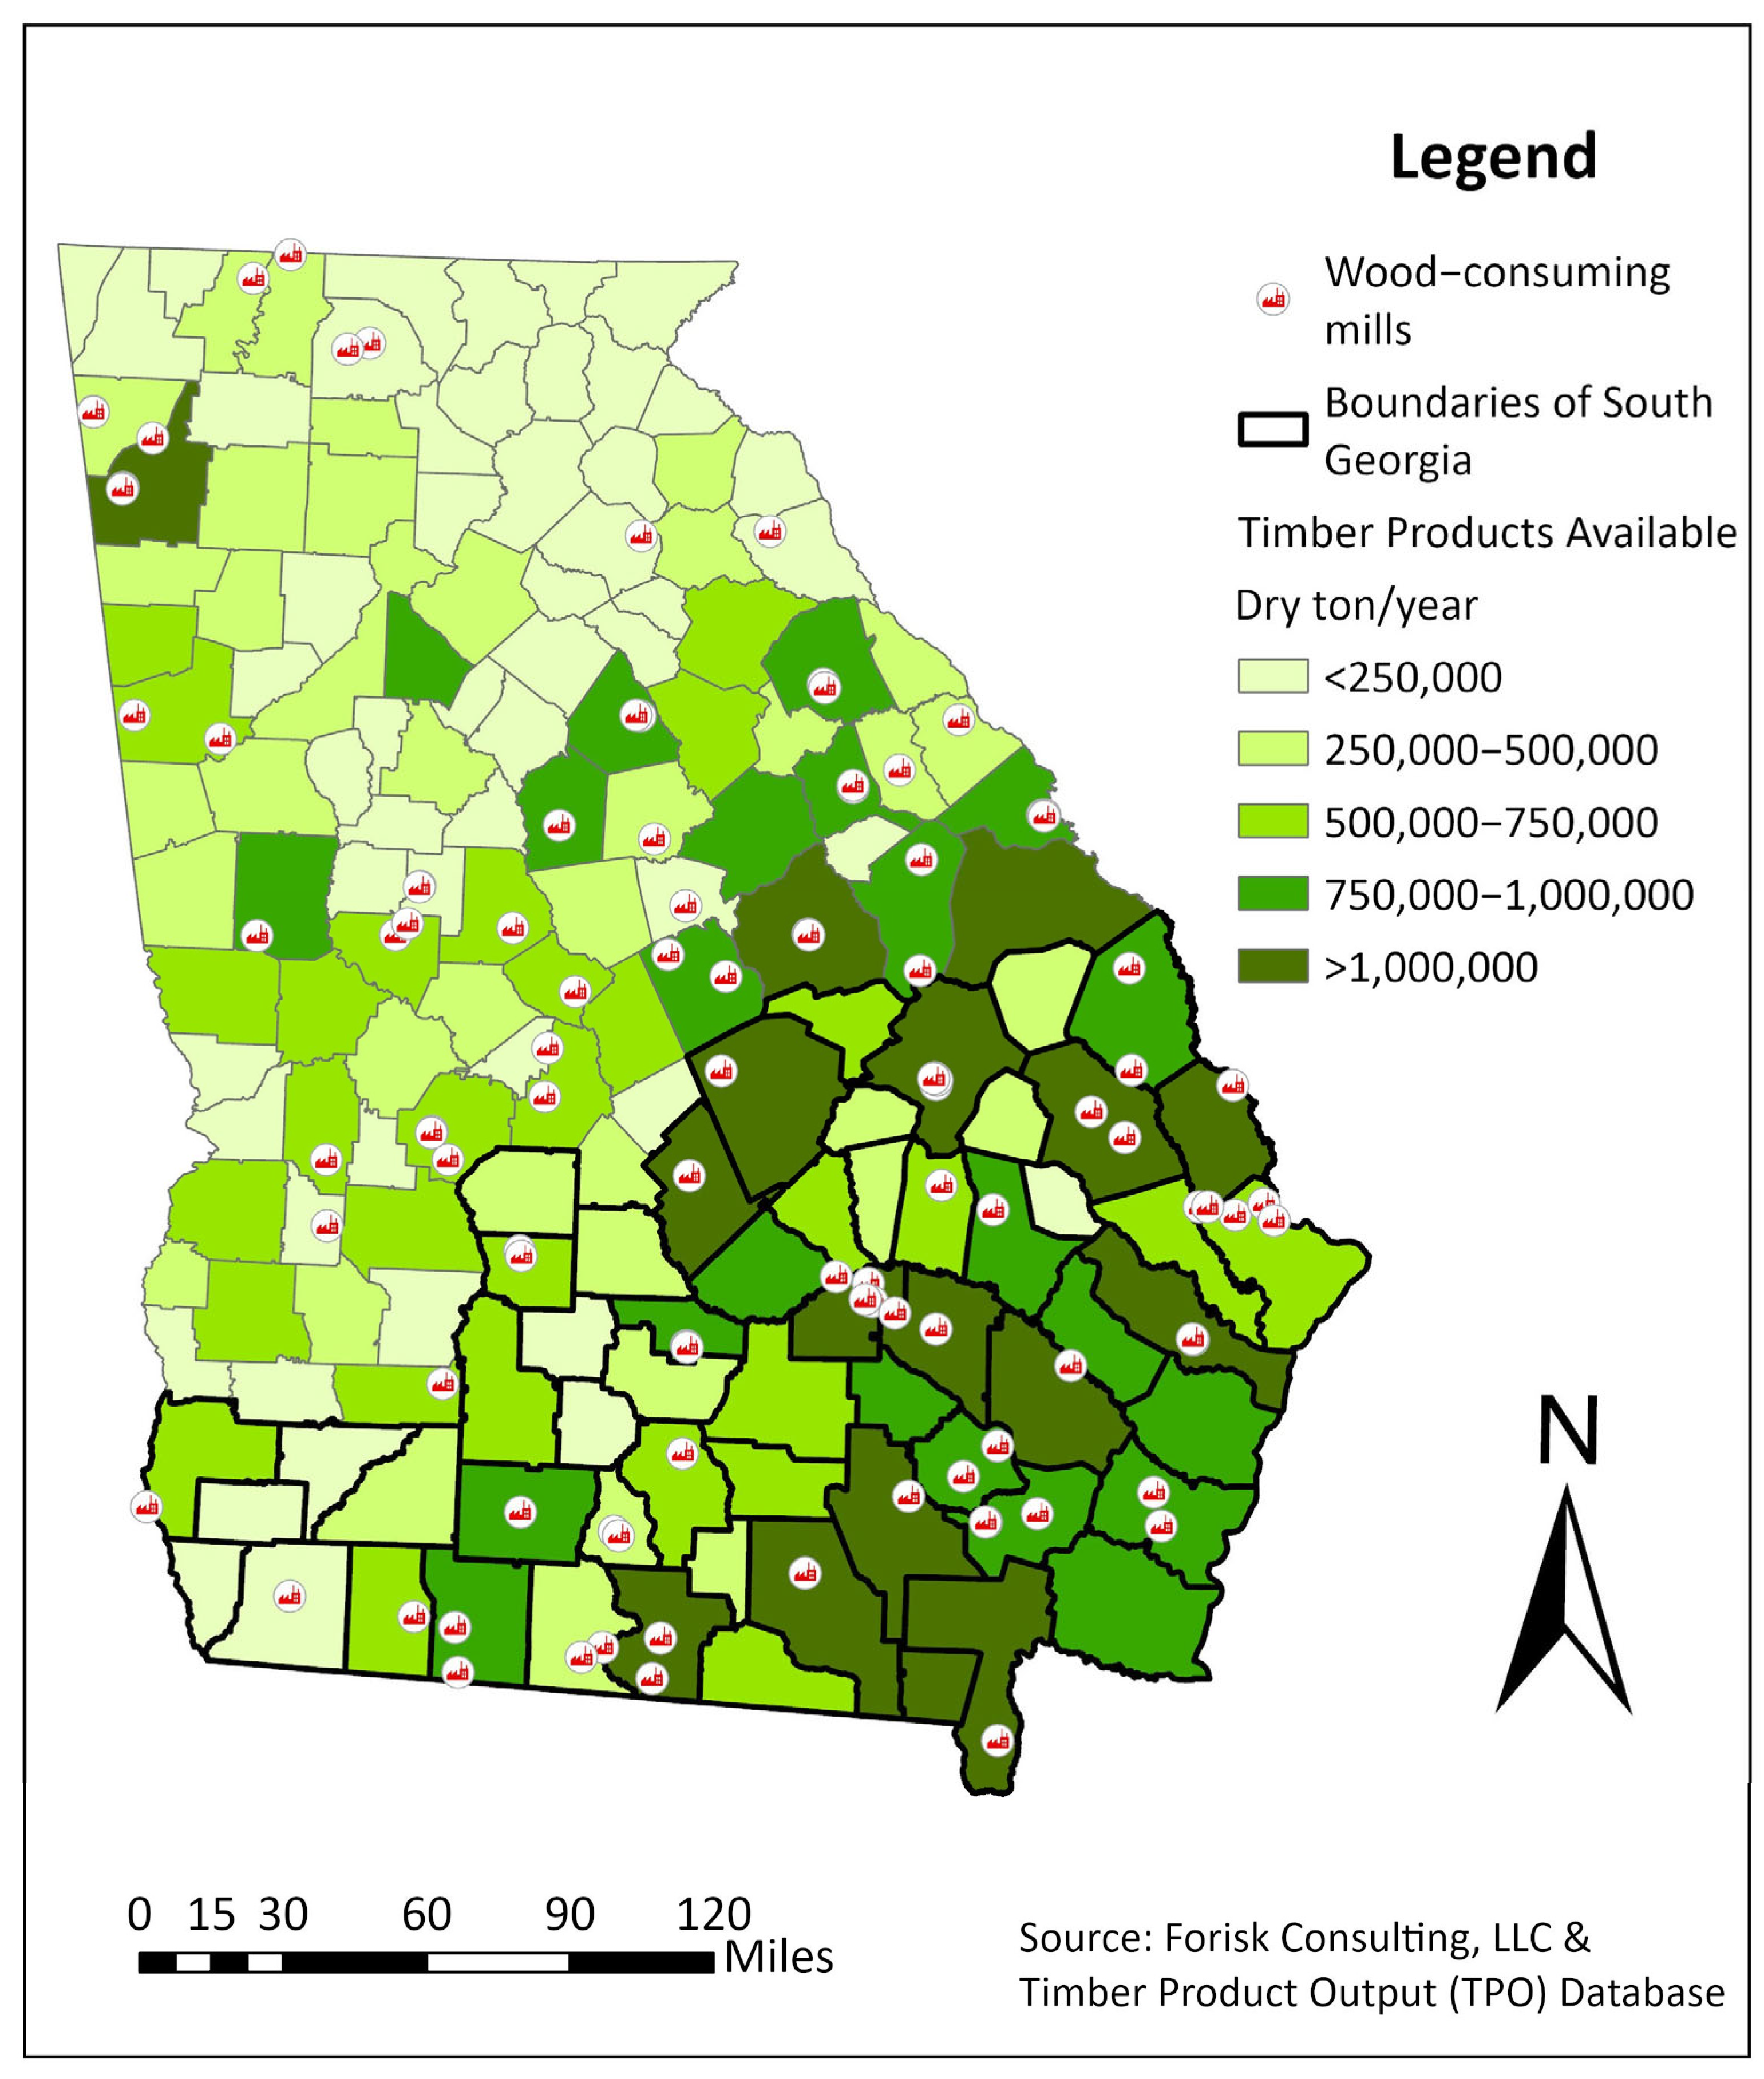
4]. Within this national context, Georgia stands out as one of the leading forestry states in the US, with extensive timber resources located in its low-lying coastal zone [
5,
6,
7].
Georgia provides about 4% of the national wood production [
5]. The state has 22 million acres (8.9 million ha) of commercially available private timberland [
6]. Around 17.2 million short tons (15.7 million metric tons) of solid pine products and 26.1 million short tons (23.6 million metric tons) of pine pulpwood products are supplied from Georgia, higher than any other southern state as of 2022. Moreover, Georgia accounts for 11.1% of the national export of forest products [
6]. The economic impact of the forest industry in Georgia was USD 42 billion in 2022 [
7]. However, wood-consuming mills in coastal areas face heterogeneous exposure to SLR-driven forest loss, creating location-specific vulnerabilities. Nevertheless, the sea level has risen by 1.20 ft (0.37 m) around Fort Pulaski Station in Georgia since 1935 [
8]. This localized trend is consistent with broader regional patterns of rising coastal water levels reported by national indicators [
2]. Due to SLR, the forestlands across a 100-mile (160.9 km) coastline and 14 barrier islands in Georgia are under the potential threat of saltwater intrusion, tidal inundation, conversion of forested land to marshland, and formation of ghost forests (forested areas dominated by dead trees) [
9].
Hydrologic models have been developed to examine the impact of SLR on coastal land cover. The impact of SLR on six estuaries of Florida’s Gulf Coast employing SLAMM (Sea Level Affecting Marsh Model) has been studied, and it was found that 18% of the coastal forest will be affected by 3 ft (0.91 m) of SLR by 2100 [
10,
11]. The Hydro-MEM (Marsh Equilibrium Model) has been used to capture the dynamics of SLR on the Apalachicola estuarine system in Florida [
10]. The results showed that higher SLR scenarios (6.6 ft, 2.0 m) caused marsh areas to be completely submerged, with wetlands migrating to higher land on the periphery by 2100. The SLOPE (Sea Level Over Proportional Elevation) model was applied to forecast the migration and retreat of coastal forests from projected SLR along the northern Gulf of Mexico [
4]. They suggested that SLR will cause salt marsh and mangrove migration, with western gulf states experiencing greater migration than eastern gulf states. Millions of acres of coastal forest will be displaced, impacting biodiversity. A dramatic decline in the species-rich coastal forest along thirteen 0.10-acre (404.7 m
2) plots in Waccasassa Bay, Florida was found [
11]. The results indicated a drastic increase in mortality of
Juniperus virginiana (southern red cedar) and
Sabal palmetto (cabbage palm), along with a massive decline in the species richness of the Bay Area. Around 4.81 million acres (1.94 million ha) of coastal forest have declined from 1996 to 2016 due to SLR, tropical storms, and the topography of the coastal area in the North American Coastal Plain [
12]. Taken together, these studies indicate that low-elevation forested landscapes are susceptible to salinity intrusion, inland marsh migration, and conversion to wetland or open water under higher SLR scenarios [
4,
10,
11].
From a supply chain perspective, salinity-driven forest change and permanent inundation within mill procurement areas reduce the accessible wood base and can increase average haul distances, concentrating risk in low-elevation coastal counties [
4,
8,
9]. As the conceptual framework in
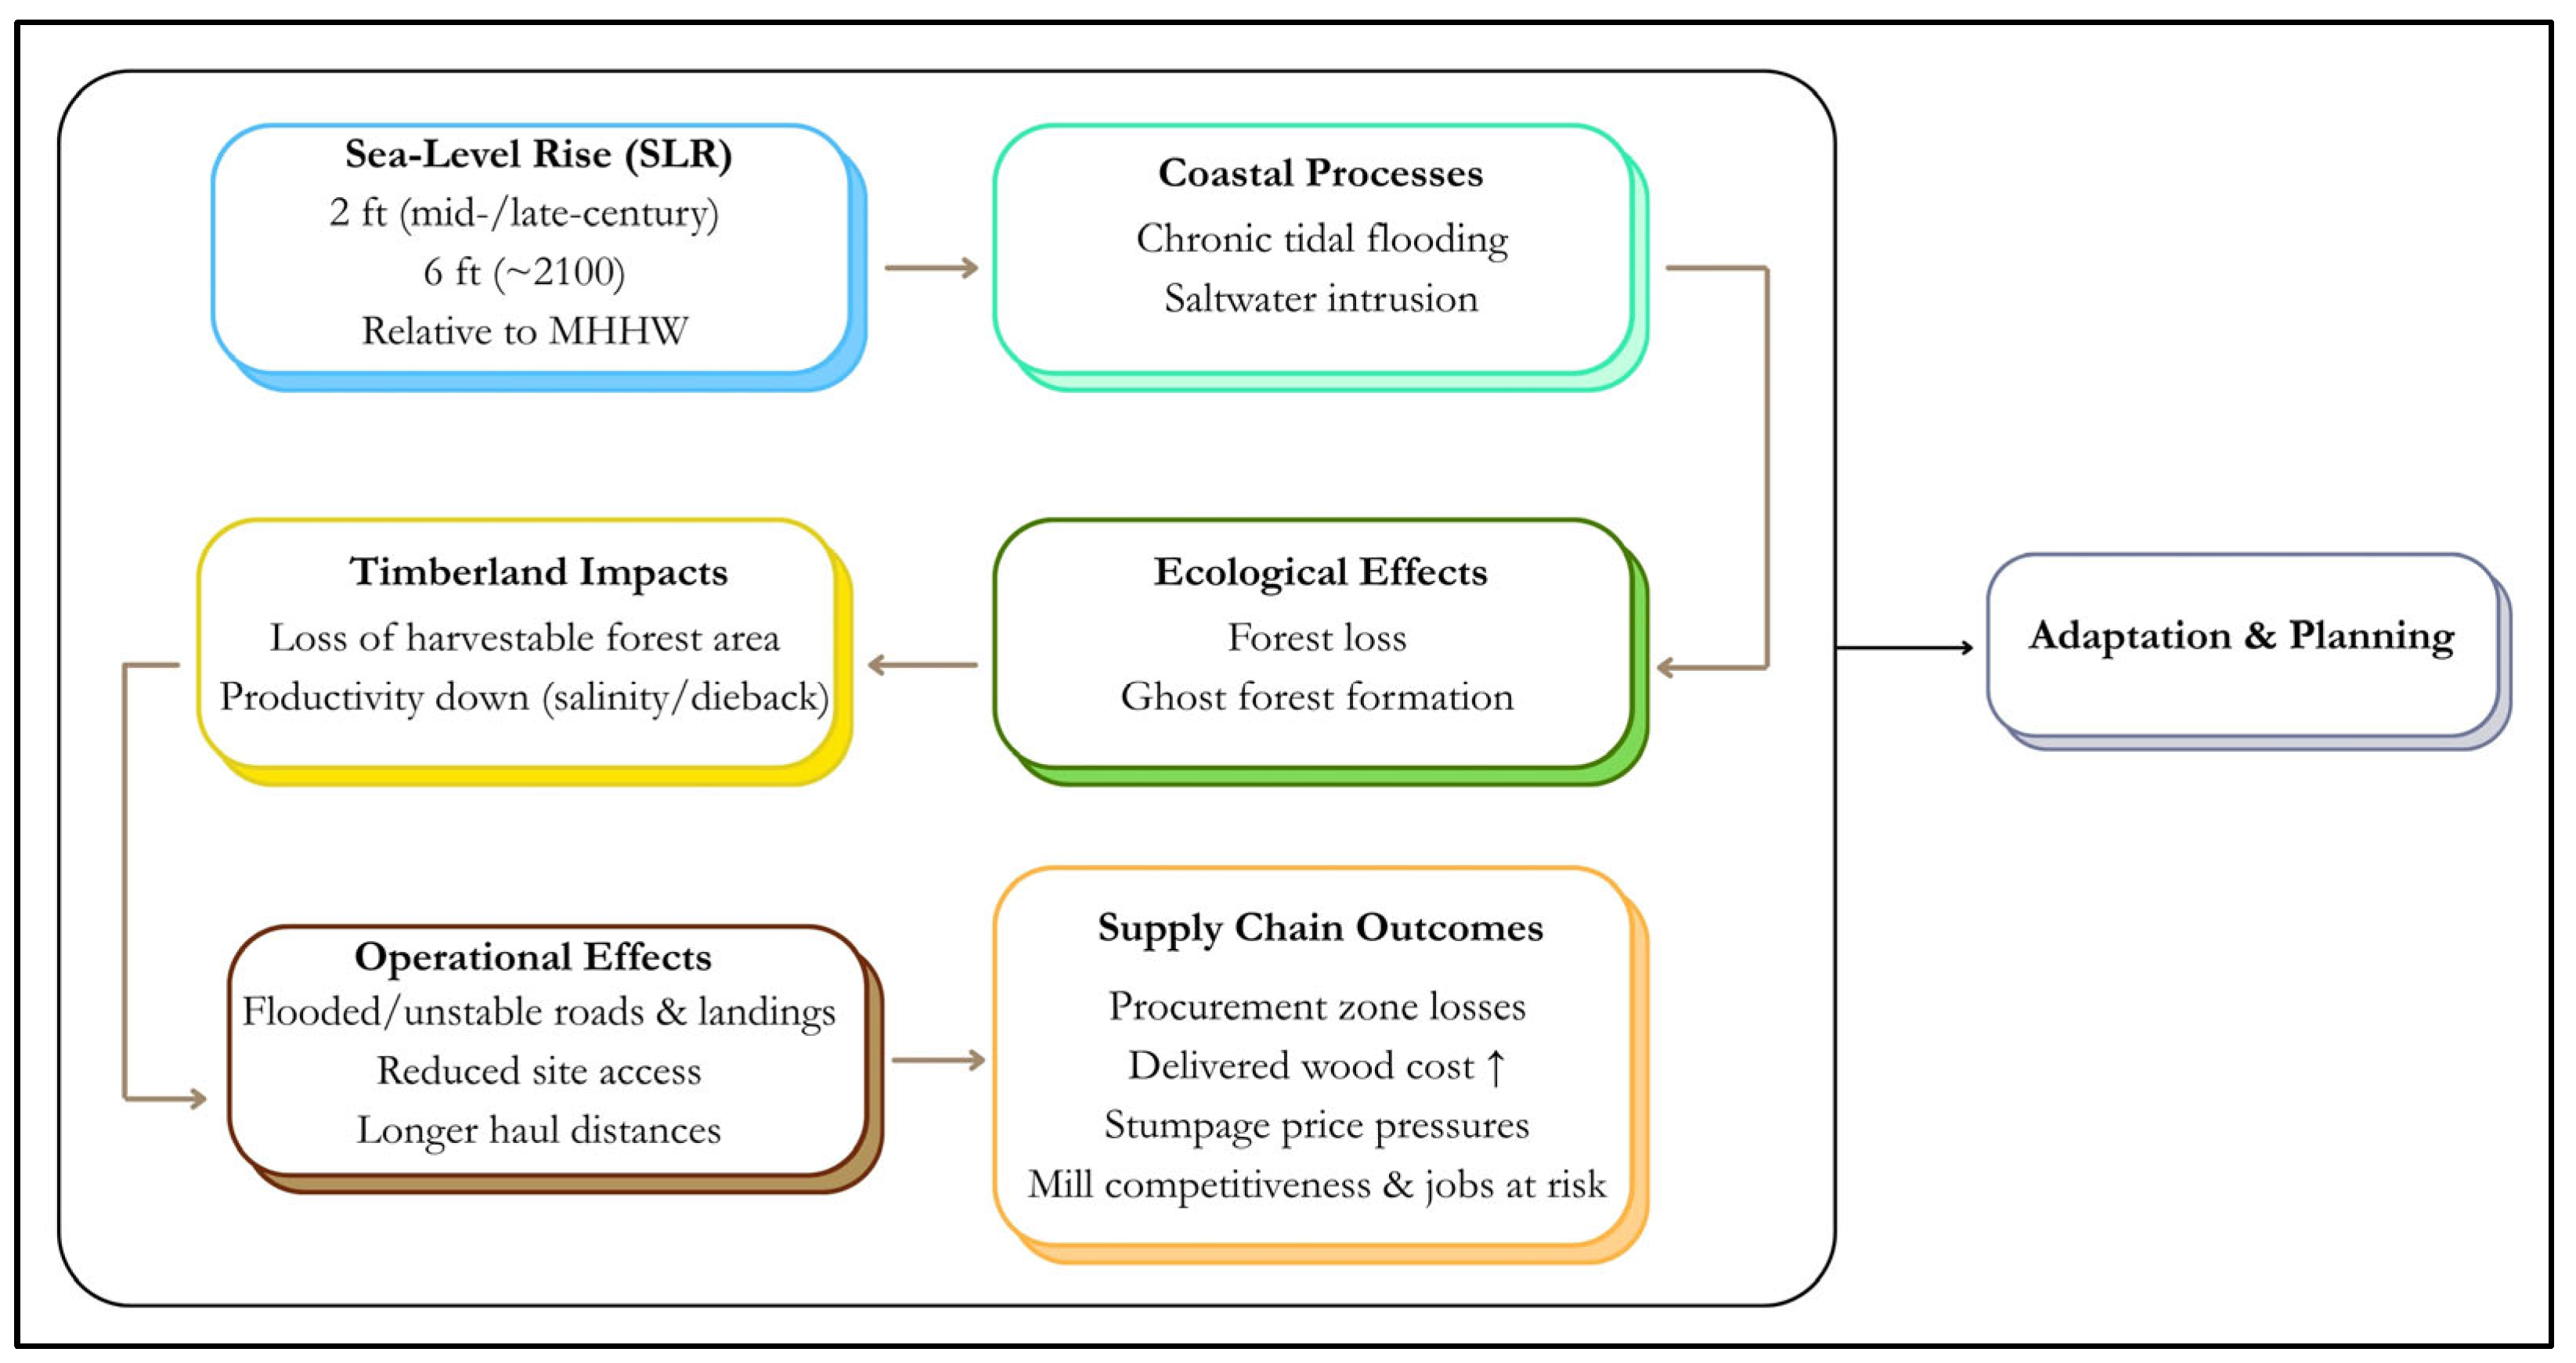
Figure 1 illustrates, these risks emerge through a sequence of processes: SLR introduces chronic tidal flooding and saltwater intrusion, which drive ecological changes, such as forest loss and ghost forest formation. These ecological impacts translate into timberland constraints, including reduced harvestable areas and declining productivity from salinity stress and dieback. Operational challenges follow, as flooded or unstable roads and landings restrict site access and force longer haul distances. Together, these dynamics culminate in supply chain outcomes: procurement zone losses, rising delivered wood costs, stumpage price pressures, and risks to mill competitiveness and local employment. Given the sector’s statewide economic contribution, even localized disruptions may carry broader market implications in Georgia [
7].
Against this background, we focus on location-dependent exposure of industrial wood procurement zones rather than landscape-wide forest loss, clarifying how proximity to projected inundation interacts with procurement radius. To the best of our knowledge, no study has calculated the impact of SLR-driven area loss on the wood procurement zones of wood-consuming mills in coastal areas. In this context, the objective of this study is to calculate the percentage of the total area of wood procurement zones flooded due to SLR for wood-consuming mills located in coastal counties of South Georgia. We specifically examine how impacts vary by mill location and procurement radius. We quantify the exposure of industrial wood procurement zones to SLR, providing a supply chain vulnerability perspective that—to our knowledge—has not been addressed for coastal Georgia. The results will guide policymakers in designing adaptive solutions to safeguard the forestry sector from the threats attributed to SLR.
3. Results
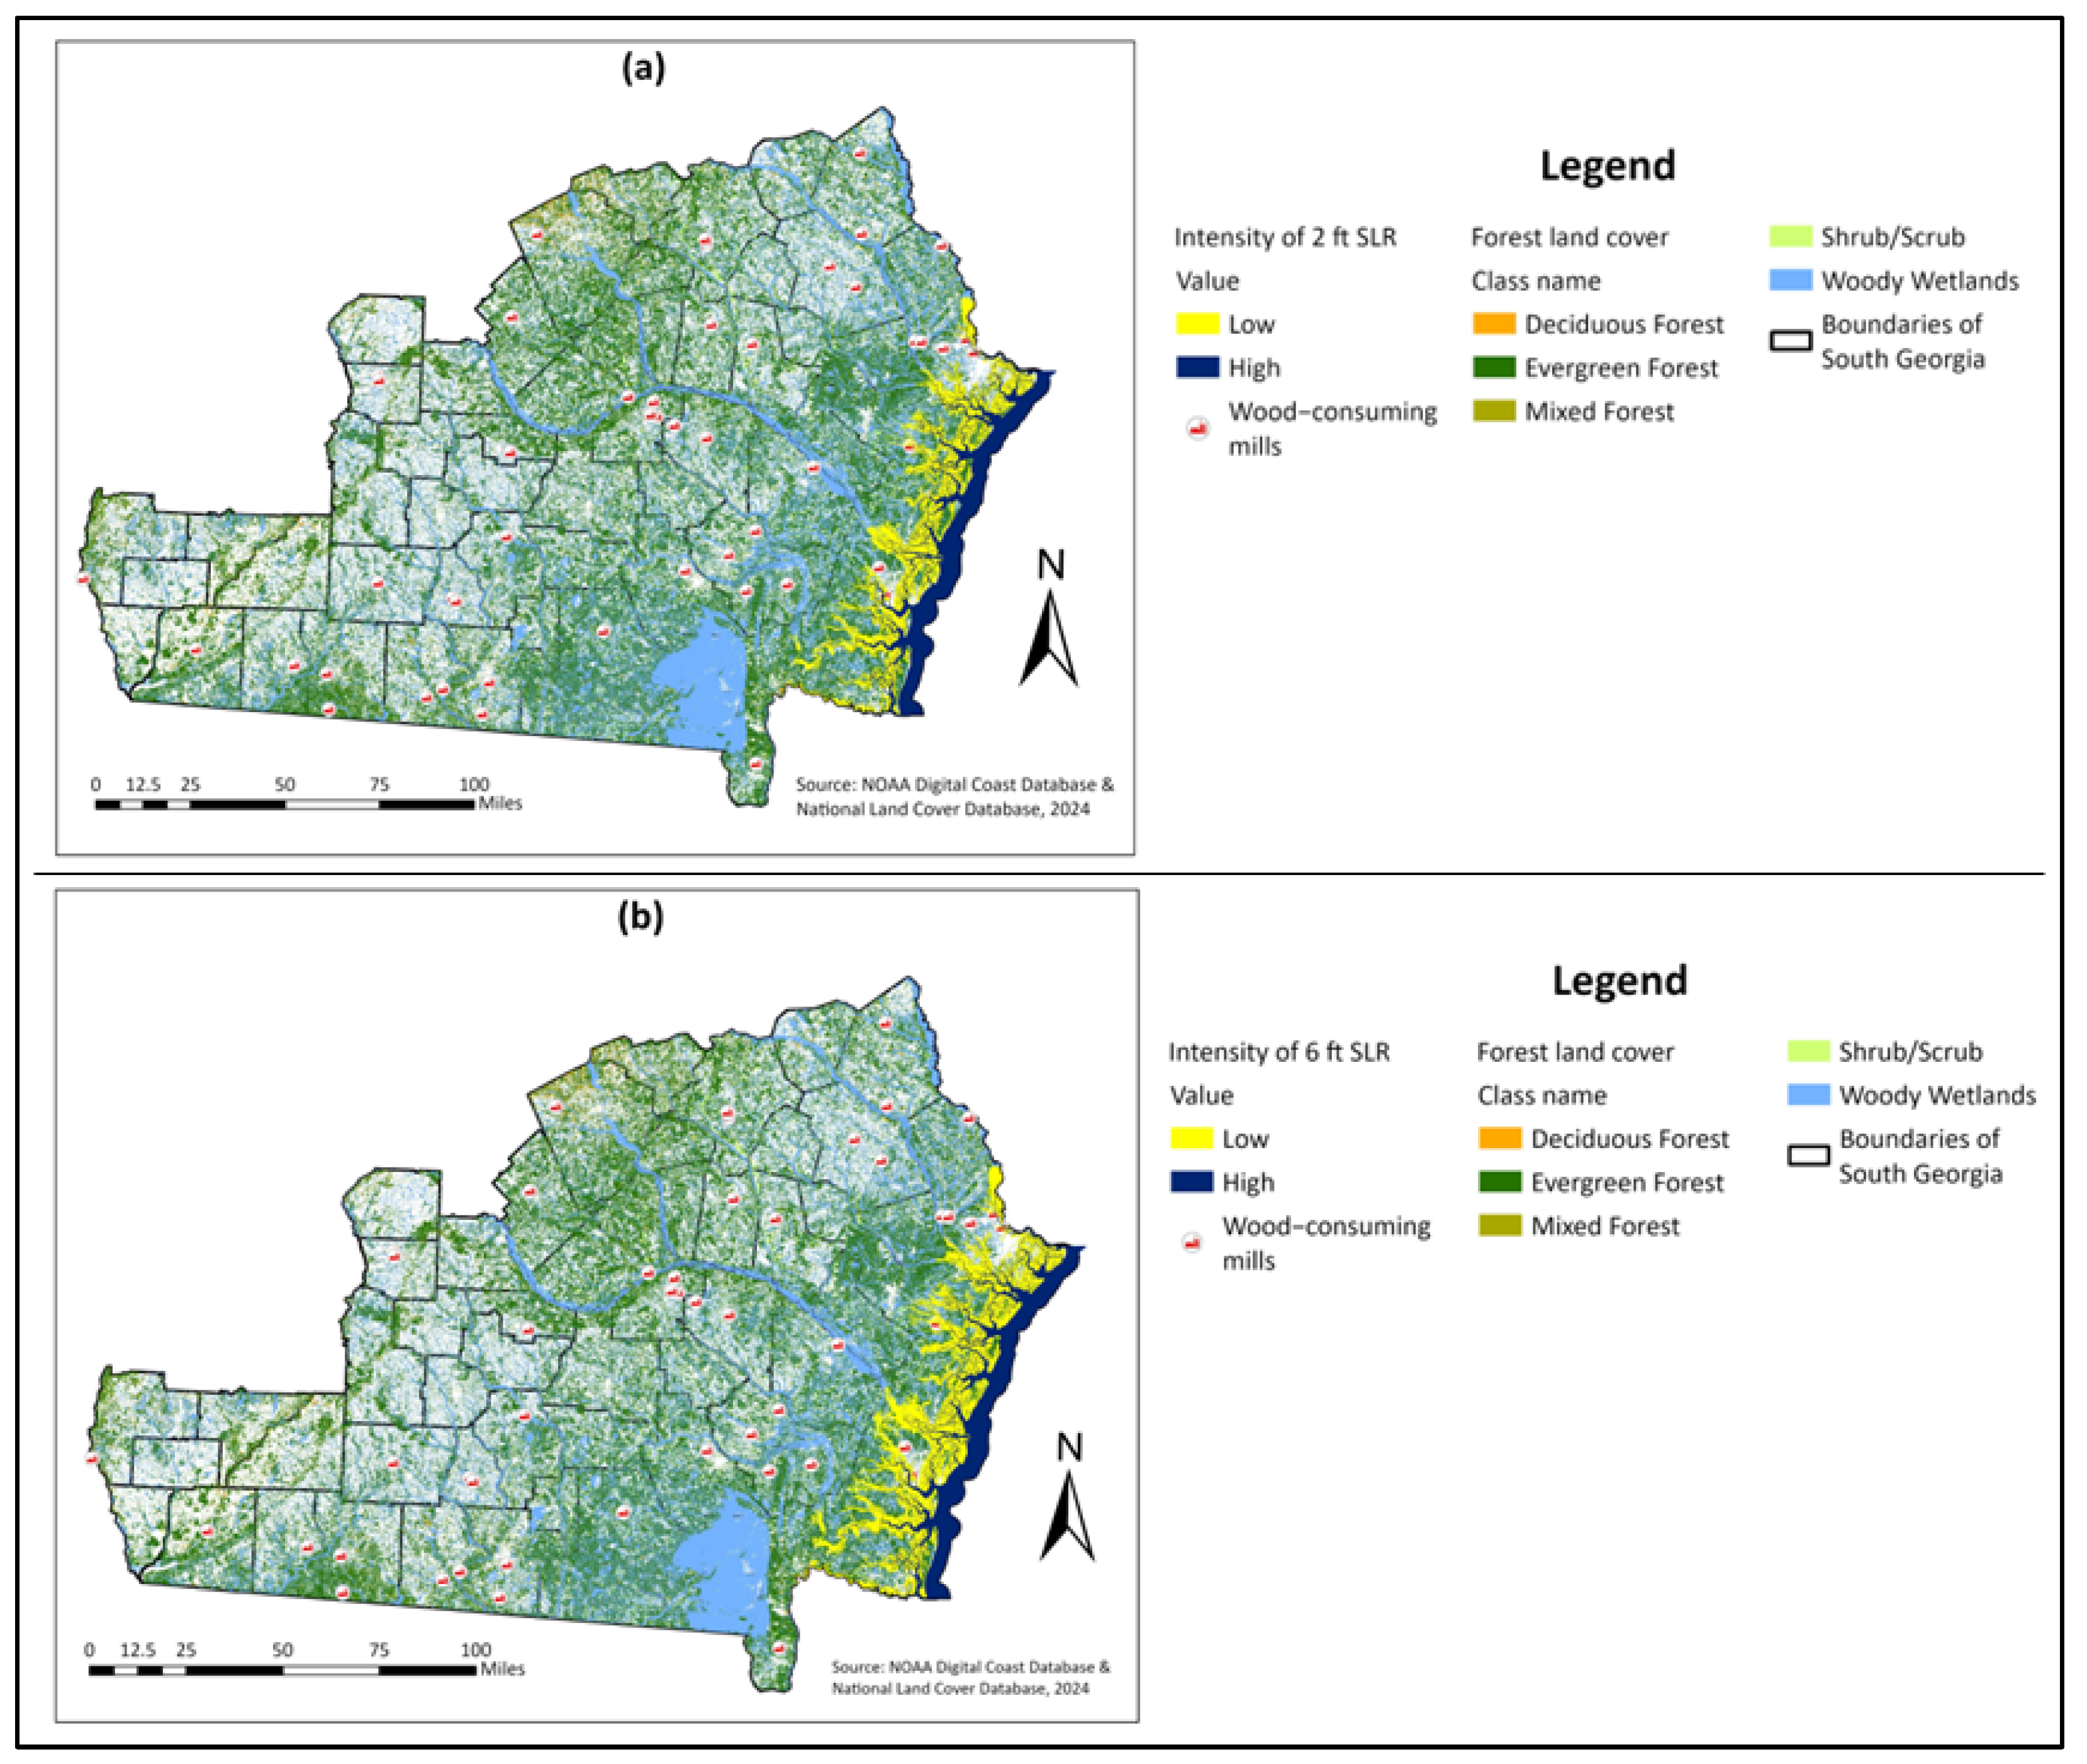
Around 987,749 acres (399,727.83 ha) of land will be inundated with a projected sea level rise of 2 ft. However, with a projected 6 ft SLR, the total inundated land area increases by 17%, covering 1,155,480 acres (467,606.2 ha). The counties that show the highest inundation are Chatham, Bryan, Liberty, McIntosh, Glynn, Camden, Effingham, Long, Brantley, and Wayne (
Figure 4).
Table 1 consolidates the detailed impacts of projected SLR scenarios of 2 ft and 6 ft on areas of wood procurement zones within the 40-mile and 64-mile procurement radii of wood-consuming mills in coastal Georgia.
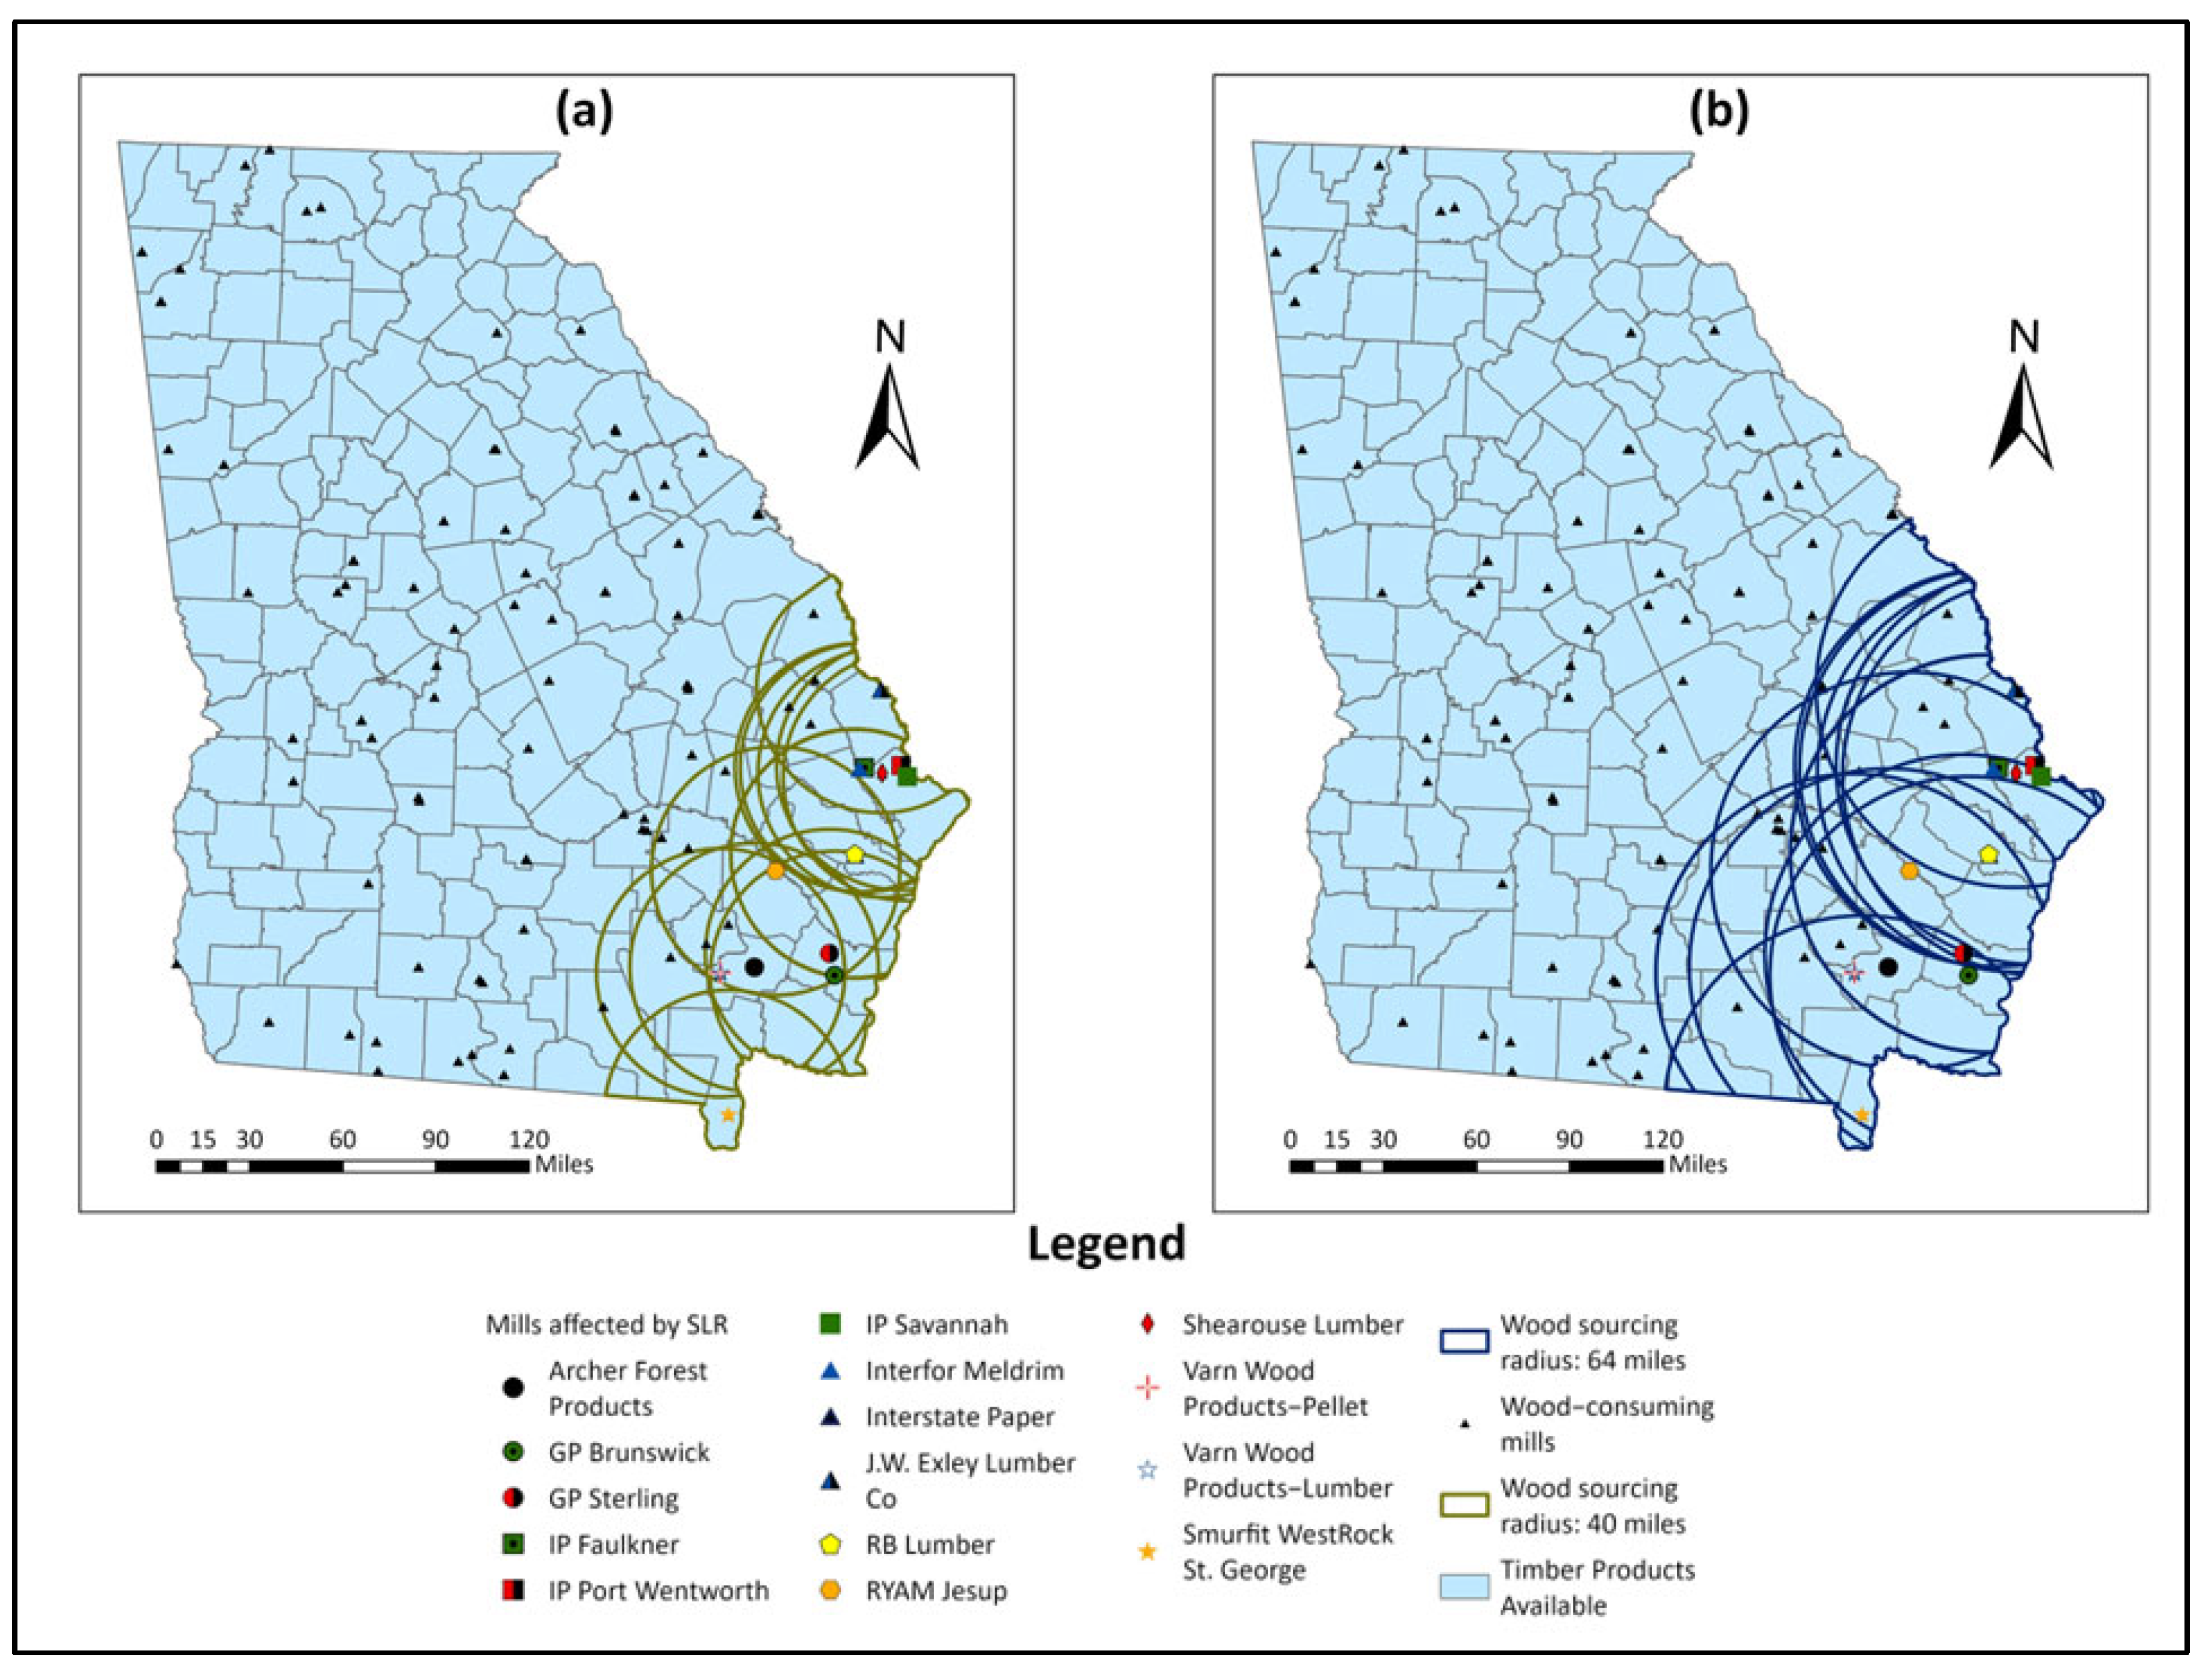
Under 2 ft of SLR within a 40-mile procurement zone: Wood procurement areas of 15 wood-consuming mills were found to be impacted. Only four mills (GP Brunswick and GP Sterling in Glynn County; Interstate Paper and RB Lumber in Liberty County) experienced a 15–25% loss of procurement area. Seven mills (primarily in Chatham County) lost 8–12.5% of their wood procurement areas, while the remaining mills lost <4%. This highlights acute vulnerability in Glynn and Liberty Counties.
Under 6 ft of SLR within a 40-mile procurement zone: Losses increased significantly for already high-vulnerability mills: GP Brunswick (24.10%), GP Sterling (26.11%), Interstate Paper (25.13%), and RB Lumber (25.07%). Wood-consuming mills in Chatham County saw losses rise to 13–14.95%, while others remained below 6%. Glynn and Liberty Counties consistently showed the highest losses.
For the 64-mile procurement zone: Losses were substantially lower for the areas under 64-mile wood procurement radii. Under 2 ft of SLR, the maximum loss was 6.50% (GP Sterling). Under 6 ft of SLR, Glynn and Liberty mills still showed the highest losses (6.19–8.51%), while others lost ≤5.93%. A larger procurement radii buffer did not eliminate location-based disparities (
Table 1).
To aid transparency, we report full per-mill results for both buffers and SLR scenarios in
Table 1 and provide NLCD forest class-level exposure by mill in
Supplementary Tables S1–S4. These tables list, for each facility, the percent inundation of woody wetlands and upland forest classes under 2 ft and 6 ft of SLR within 40-mile and 64-mile procurement areas, enabling replication and comparison across mills and counties.
Land-cover-specific impacts within procurement zones: Across mills, woody wetlands experience the largest proportional losses (please see
Tables S1–S4 in the accompanying
Supplementary Material). Under 6 ft of SLR with 40-mile buffers, woody wetland loss reaches 18.33% for GP Brunswick and 17.33% for GP Sterling (Glynn County), compared to 9.13% and 8.71% for deciduous forest and 6.77% and 6.38% for evergreen forest, respectively (
Table S2). In Chatham County, IP Savannah shows 12.48% woody-wetland loss, with 2.45% deciduous and 5.22% evergreen losses (40-mi, 6 ft;
Table S2). Under 2 ft of SLR, class-level losses are smaller but preserve the same ranking; for example, GP Brunswick exhibits 9.72% woody wetland loss, 1.40% deciduous loss, and 1.01% evergreen loss (40-mi;
Table S1). Enlarging the procurement zone to 64 miles reduces these shares while preserving the pattern; at GP Brunswick, woody wetland losses are 9.40% (6 ft) and 4.88% (2 ft), with deciduous at 4.38%/0.74% and evergreen at 4.50%/0.78% (
Tables S3 and S4). Overall, woody wetlands are disproportionately exposed across mills and scenarios, whereas upland forest classes (deciduous, evergreen, and mixed) see comparatively lower shares, especially under 2 ft of SLR.
4. Discussion
Our study demonstrates that the impact of SLR on wood procurement zones varies significantly based on geographic location. Mills closer to the coastline faced notably higher reductions in their available areas of wood procurement zones, compared to those located further inland. For instance, mills in Glynn and Liberty Counties faced disproportionate risk, losing between 24% and 26% of their wood procurement zones under 40-mile procurement areas and the 6 ft SLR scenario—double the losses estimated for mills in Chatham County (13–15%) and as much as 4 to 6 times higher than those faced by inland mills. The procurement radius plays a key role in mediating and mitigating this risk. Although expanding the radius to 64 miles reduces maximum losses to 8.5% or less, spatial hierarchies remain—losses in Glynn and Liberty still exceed those of non-coastal mills by 35–60%. This disparity stems from the location of inundation hotspots. Under the 6 ft scenario, 17% more land is projected to flood, compared to the 2 ft scenario, and this additional flooding is concentrated in low-elevation counties such as Liberty, Glynn, and Chatham, where wood procurement zones significantly overlap with vulnerable coastal forests (
Figure 4). These spatially explicit findings clearly indicate that geographic proximity to coastal inundation zones substantially increases vulnerability to SLR. Importantly, the nature of the land cover within these zones further shapes which timberland types are most at risk.
Within these vulnerable procurement zones, our NLCD overlay indicates that woody wetlands account for most of the near-term SLR exposure. Low-lying coastal forests along the marsh edge are often the first to suffer from saltwater intrusion and flooding, leading to tree death and the spread of “ghost forests”. These areas are typically replaced by shrubland or marsh, a process already documented along the mid-Atlantic and southeastern US coasts [
20,
21]. Studies also show that rising water levels and storm events push salt marshes inland, further stressing low-elevation forests [
22,
23]. In contrast, upland stands at higher elevations face little direct flooding under 2 ft of SLR and only modest exposure under 6 ft of SLR, consistent with evidence that upland retreat lags behind sea level rise [
20,
24]. For mills, these ecological shifts matter because wetter conditions and more frequent ponding can flood or weaken forest roads, reduce access, and increase soil disturbance, shrinking the harvestable area, even where uplands remain above water [
25].
Although SLR-induced coastal forest loss [
12,
26] and ecological impacts like ghost forest formation [
4,
11] have been widely studied in ecological literature, a critical gap remains in understanding how wood supply chains respond to location-specific inundation threats. Previous studies have neither quantified industrial vulnerability nor assessed spatial variability in wood procurement zones, despite the wood products industry contributing USD 42 billion annually to Georgia’s economy [
7]. Our study addresses this gap by mapping SLR exposure for 15 coastal mills, explicitly evaluating how loss patterns vary based on geographic location and procurement radius.
Our finding that 22% of coastal Georgia’s land area faces inundation under 6 ft of SLR aligns with global projections [
3]; however, this study contributes novel insights specific to the forest products industry. About 31% of protected coastal lands in the eastern US are exposed to SLR [
27]. Our lower estimate—26% maximum—likely reflects the fact that wood procurement zones include a mix of land uses, not solely high-risk protected zones. Similarly, mechanisms driving ecological transformation in coastal forests, such as salinity intrusion and ghost forest formation, have direct parallels in industrial procurement. An 11% loss of coastal forests in North Carolina due to salinity intrusion has been documented [
21]. We observe comparable impacts for Chatham County mills under 2 ft of SLR and much greater losses (up to 26%) for mills in lower-elevation counties, where topography can and does accelerate the pace and extent of saline intrusion [
28]. Our study differs from regional-scale models by showing that the resilience of a wood-consuming mill under SLR conditions depends not on the overall volume of forest loss across the landscape but on its specific location relative to projected inundation corridors.
Reductions in locally accessible timber—especially concentrated in Glynn and Liberty counties—are likely to increase mill procurement costs (longer average haul distances, higher delivered wood costs) and place upward pressure on stumpage prices in affected sub-regions. Such changes can compress margins for mills, particularly facilities with limited flexibility to expand sourcing radii, and may have downstream employment implications in logging and primary processing. Assessing magnitude and duration will require scenario-based timber market modeling (e.g., mill-type-specific sourcing responses and regional price dynamics), which we recommend as the next step.
Application: The spatial screening developed here can support procurement planning (e.g., contingency sourcing for high-risk mills in Glynn and Liberty Counties), infrastructure maintenance (prioritizing forest roads and landings susceptible to frequent ponding), and conservation targeting (maintaining coastal forest buffers most likely to reduce near-term woody wetland losses). It can also inform public–private coordination on adaptation investments where procurement losses cluster.
The study limitations must also be acknowledged. First, while our analysis distinguished forest land-cover classes (deciduous, evergreen, mixed) and woody wetlands within procurement zones, it did not incorporate data on merchantable timber volume. As a result, our estimates may still overstate functional timber losses compared with what Forest Inventory and Analysis (FIA) plot-based data could reveal. Incorporating FIA-derived wood volume estimates in future analyses would provide a more precise measure of potential supply impacts. Second, we used static procurement zones of 40 and 64 miles, whereas haul distances vary by mill type—for instance, pulp and paper mills often source from wider areas than sawmills [
29,
30]. Third, the modeling approach did not incorporate dynamic coastal processes like storm surges and short-duration extreme events, which can temporarily extend inundation beyond static projections and thus may lead to underestimation of near-term risk. In addition, gradual salinity intrusion can impair growth and cause forest dieback (“ghost forests”) before permanent tidal flooding occurs, reducing timber productivity and the accessible wood base in advance of full inundation. Another limitation is that we did not account for terrain factors such as slope and relief within the remaining non-flooded forest areas. Steeper or more irregular terrain can make timber extraction more difficult and costly, reducing effective harvestability, even where land remains above water. We have also not incorporated the relevance of migration of tree species or any adaptive forest management practices that wood-consuming mills could implement. This exclusion may lead to an underestimation of long-term resilience [
4]. Future research could also expand geographic coverage, explore the impacts of adaptive management strategies, and assess the economic implications of shifting procurement practices within the forestry industry, providing valuable insights into regional planning and adaptation.
Future research directions: Several other priorities also emerge from our analysis. Future work should replicate this framework using mill-type-specific procurement distances to evaluate differential vulnerability by facility type (e.g., pellet, lumber, or pulp mills). Second, research should model the economic ripple effects of wood shortages in high-risk areas like Glynn and Liberty Counties, particularly how such disruptions could impact regional wood prices and mill operations using TIMO or agent-based models. Third, there is a need to evaluate the cost-effectiveness of adaptation strategies, comparing options like green infrastructure (e.g., oyster reefs to mitigate salinity intrusion) against logistical changes, such as procurement radius expansion. Lastly, applying this spatial framework to other coastal regions, such as Louisiana or North Carolina, would improve generalizability and provide comparative baselines across the southeastern US, where ghost forests and SLR-related vulnerabilities are well-documented [
12].
SLR threatens Georgia’s forest products industry through spatially specific mechanisms concentrated in low-elevation coastal counties. These patterns demand tailored, location-specific policies rather than one-size-fits-all regional approaches. Understanding and planning for the spatial variability of risk is critical for enhancing the climate resilience of the southeastern US’s forestry infrastructure.
5. Conclusions
Our study shows that SLR would disrupt wood supply chains through location-dependent mechanisms, with Glynn and Liberty Counties emerging as high-risk hotspots. Wood-consuming mills in these counties could lose up to 26% of their wood procurement zones for a 40-mile wood procurement radius in a 6 ft SLR scenario—losses two to six times greater than those projected for inland counterparts. Although expanding the wood procurement zone to a 64-mile radius reduces maximum projected losses to 8.5% or less, it does not fully eliminate the underlying geographic disparities. The vulnerability of mills is thus driven not by total forest loss but by proximity to inundation zones.
We recommend four actions in response to these findings. First, priority conservation efforts should focus on maintaining coastal forests in Glynn and Liberty Counties through programs such as the US Department of Agriculture Climate Hubs. Second, more in-depth research studies should be undertaken to assess the risk broadly posed by SLR to the forestry sector in Georgia to ensure the resiliency of the supply chain. A need also exists to bring various stakeholder groups together to develop a consensus for broader climate adaptation planning. Third, adaptive forest and infrastructure practices should be adopted in at-risk areas, e.g., cultivating salt-tolerant tree species, adjusting silviculture to improve flood tolerance, and investing in nature-based defenses (e.g., living shorelines and wetland restoration) to mitigate salinity intrusion. Finally, the spatial framework developed in this study should be replicated across other regions of concern, including the Gulf Coast, to provide a basis for quantifying economic spillovers and testing adaptive strategies. Our analysis offers a foundational step toward ensuring the continuity and sustainability of wood supply chains in the face of accelerating SLR in the southern US and, hopefully, will guide suitable policies in the future.


