Article

Policy Coordination and Green Transformation of STAR Market Enterprises Under “Dual Carbon” Goals

1
School of Economics and Management, Southwest University, Chongqing 400715, China
2
Sichuan Academy of Agricultural Sciences, Chengdu 610066, China
*
Author to whom correspondence should be addressed.
Sustainability 2025, 17(19), 8790; https://doi.org/10.3390/su17198790
Submission received: 19 August 2025 / Revised: 16 September 2025 / Accepted: 17 September 2025 / Published: 30 September 2025

Abstract

China’s dual carbon goals necessitate green transformation across industries, with STAR Market enterprises serving as crucial drivers of technological innovation. Existing studies predominantly focus on traditional sectors, overlooking dynamic policy interactions and structural heterogeneity in these technology-intensive firms. This study examines how coordinated environmental tax reforms, green finance initiatives, and equity network synergies collectively shape enterprise green transition, using multi-period difference-in-differences and triple-difference models across 2019 Q3–2023 Q4. By integrating financial records, patent filings, and carbon emission data from 487 STAR Market firms, the analysis identifies environmental cost pressures as the dominant policy driver, complemented by delayed financing incentives and accelerated resource integration through corporate networks. Regional institutional environments further modulate these effects, with areas implementing stricter tax reforms exhibiting stronger outcomes. The findings advocate for adaptive policy designs that align fiscal instruments with regional innovation capacities, optimize financial tools for technology commercialization cycles, and leverage inter-firm networks to amplify sustainability efforts. These insights contribute to refining China’s climate governance framework for emerging technology sectors.

1. Introduction

Global climate change and ecological environmental crisis have become common challenges for human society. As the world’s largest carbon emitter, China’s proposal of the “dual carbon” goal is not only an important measure to fulfill its international responsibilities but also an inherent requirement for promoting high-quality economic development (Figure 1) [1,2,3]. In 2020, China clearly proposed the strategic goal of “achieving carbon peak by 2030 and carbon neutrality by 2060”. This commitment marks a comprehensive transition towards a green and low-carbon economic development model [4]. As the core hub of resource allocation, the capital market shoulders the crucial mission of guiding capital flows towards green industries and incentivizing technological innovation in enterprises. The Science and Technology Innovation Board, as an important experimental field for China’s capital market reform, focuses on “hard technology” enterprises, and its effectiveness in green transformation is directly related to the implementation process of the country’s “dual carbon” strategy [5,6]. However, current research on policy-driven green transformation of enterprises mainly focuses on traditional industries, with insufficient attention paid to the STAR Market, a strategic emerging sector. Furthermore, there is a lack of in-depth exploration into the dynamic effects and heterogeneous mechanisms of multi-period policies.
Existing research generally acknowledges the promotional effect of environmental regulation policies on corporate green transformation, but there are various limitations. Most of the literature adopts a static analysis framework, failing to capture the dynamic cumulative effect of policy implementation [7]. Policies such as environmental tax reform and green finance pilot projects are implemented in stages, and the impact of policy intensity and synergistic effects on corporate behavior varies significantly across different periods. However, existing research has not yet constructed an evaluation model for multi-period policy shocks [8,9]. The decomposition mechanism of emission reduction effects is insufficiently studied. Most existing research attributes policy effects to a single driving path, ignoring the interaction between direct regulation and market incentives, and lacks an in-depth analysis of regional heterogeneity and corporate structural characteristics [10]. The policy effects of environmental tax reform in areas with increased tax burdens may exhibit spatial differentiation due to differences in local fiscal support and industrial base, but such heterogeneous mechanisms have not been fully verified. As the core carrier of national strategic scientific and technological strength, companies listed on the Science and Technology Innovation Board have unique advantages in green technology innovation and industrial chain collaboration, and their transformation paths are fundamentally different from those of traditional enterprises. However, the existing literature has not yet established an analytical framework that is tailored to the characteristics of the STAR Market [11,12,13].
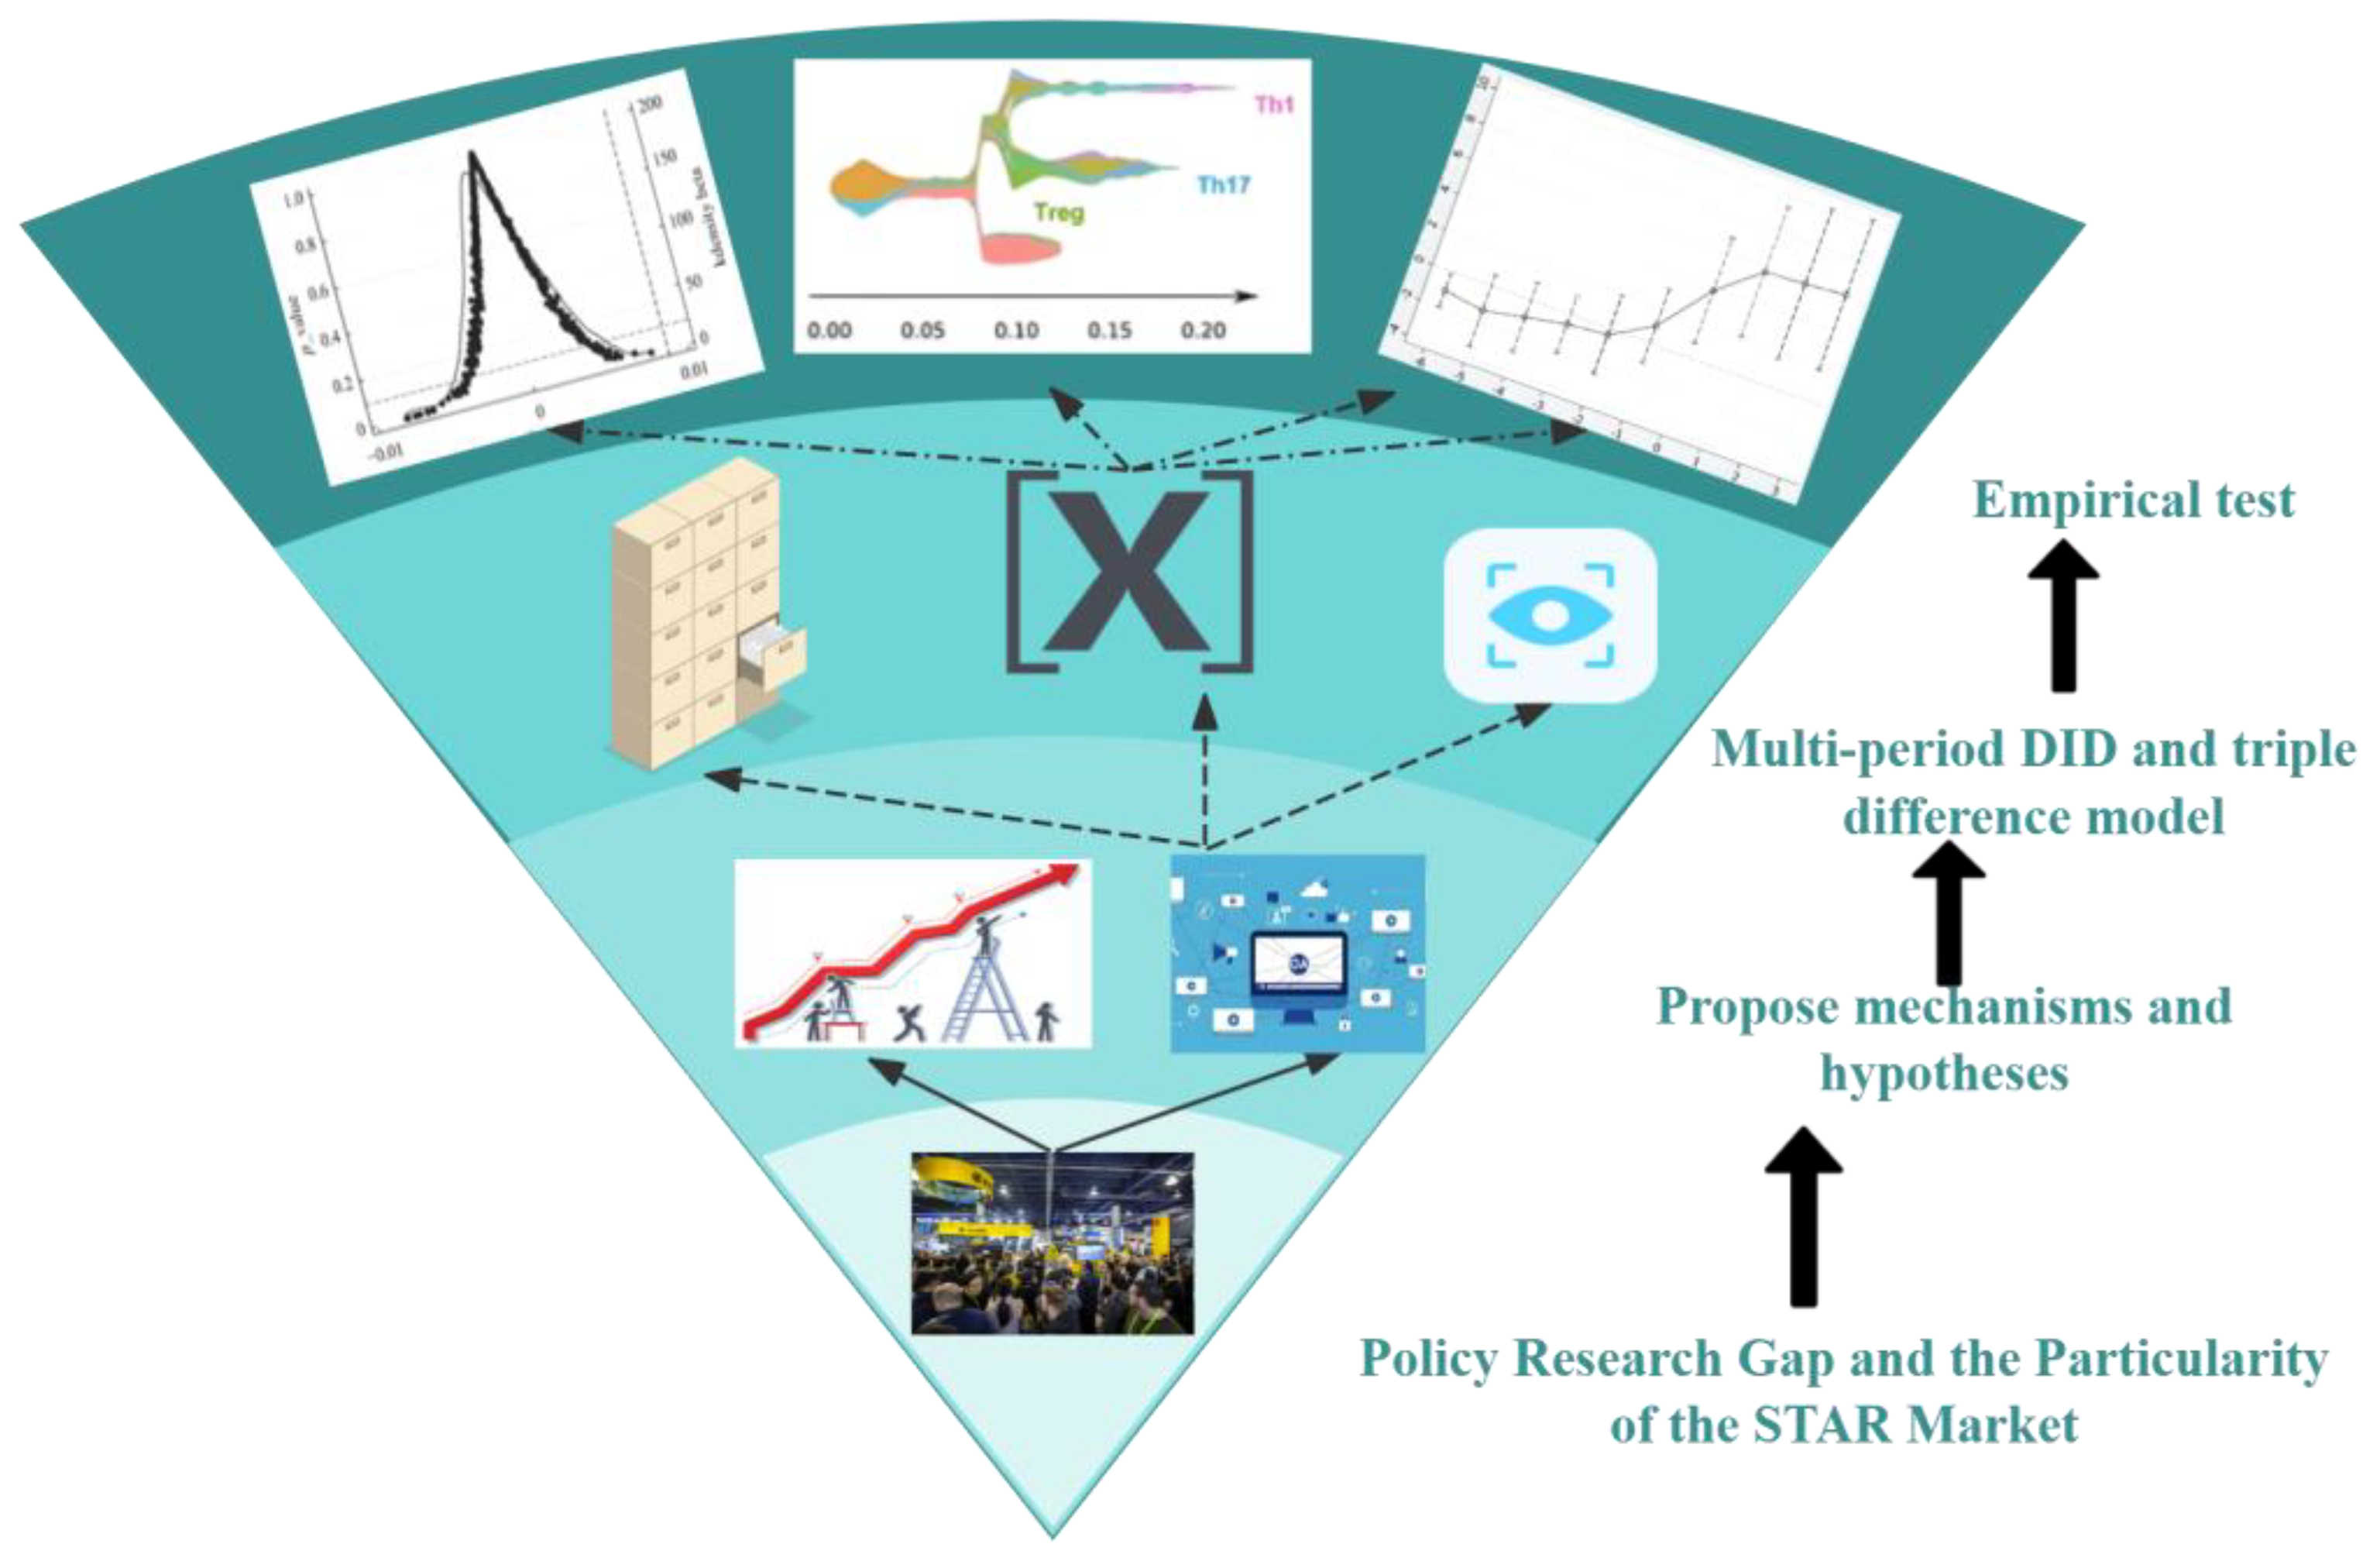
This study takes enterprises listed on the Science and Technology Innovation Board as the research object, systematically exploring the inherent logic and implementation path of green transformation driven by the “dual carbon” goals. As shown in Figure 2, by constructing multi-period difference-in-differences and triple-difference models, this study analyzes the synergistic effects of policy dynamics and regional heterogeneity, reveals the collaborative mechanisms of policies such as environmental tax reform and green finance pilot, incorporates equity network centrality into the analytical framework, and clarifies the moderating effect of enterprise structural characteristics on policy response, providing a theoretical basis for differentiated policy design.

2. Green Transformation Framework

2.1. Theoretical Framework

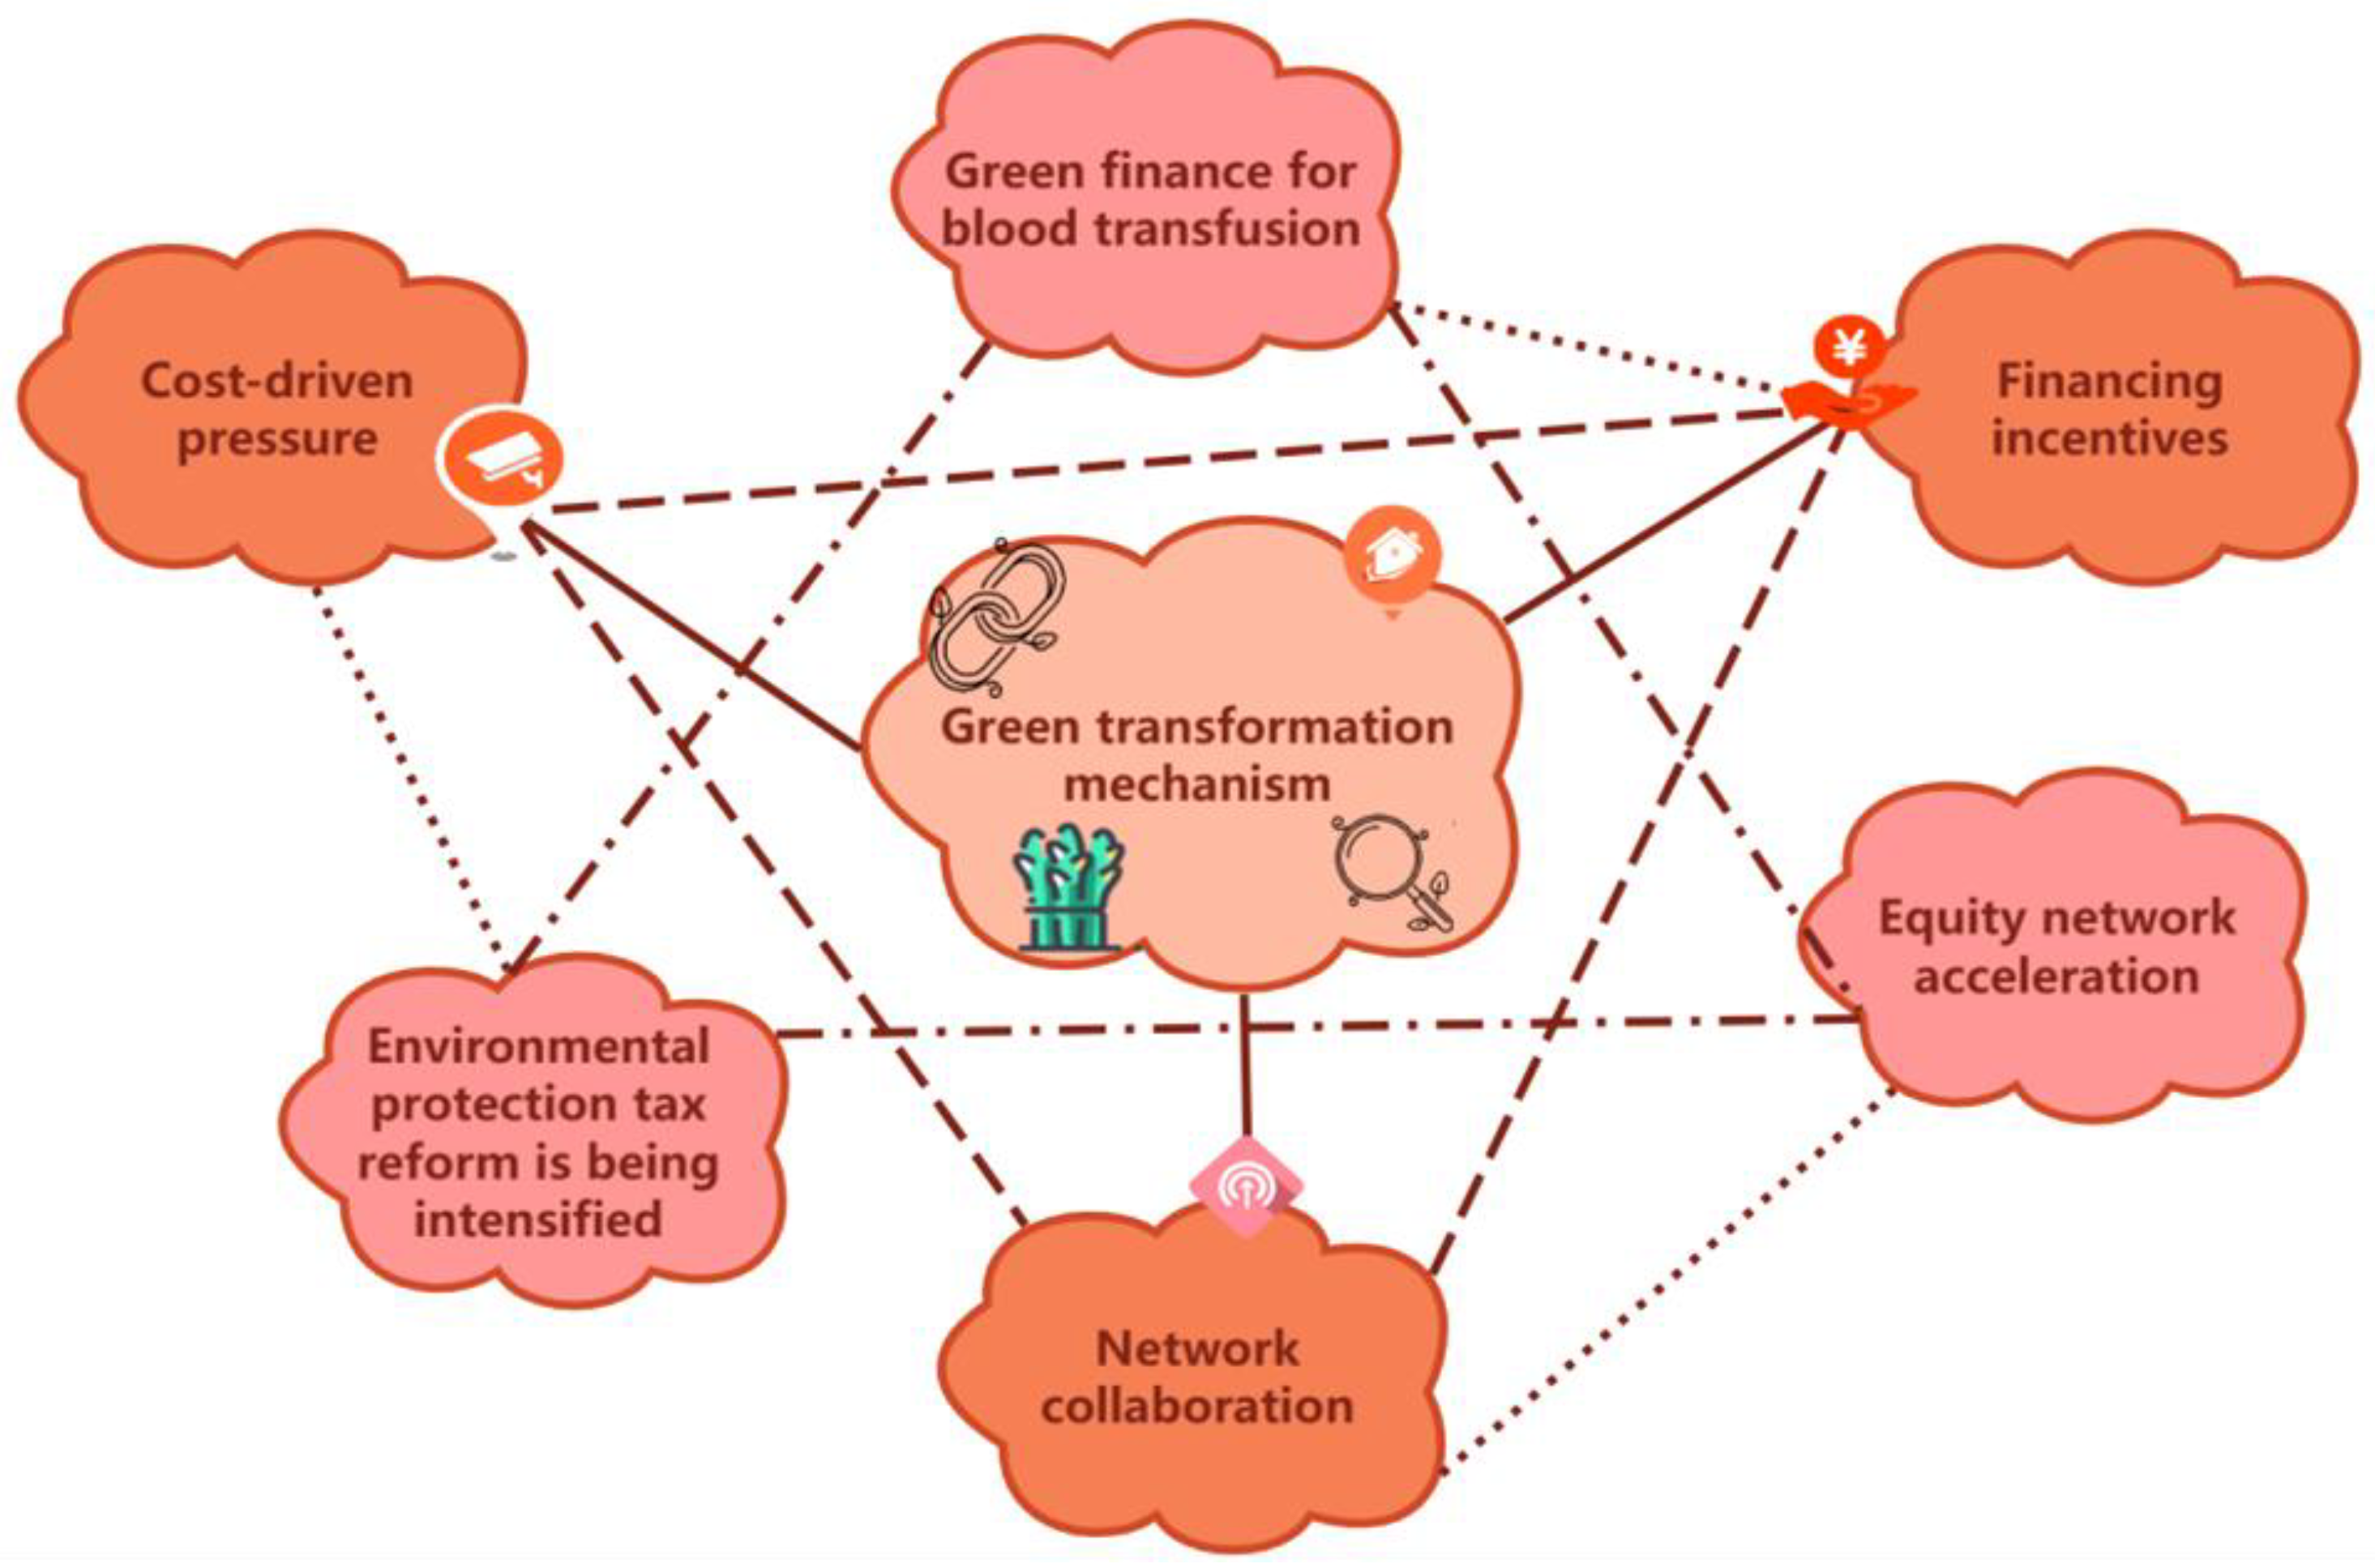
The mechanism by which the “dual carbon” goals drive the green transformation of enterprises on the STAR Market can be decomposed into three paths: cost pressure, financing incentives, and network synergy, as illustrated in Figure 3 [14]. The solid arrows in Figure 3 represent direct influence paths: environmental tax reform directly drives the growth of green patents by increasing corporate environmental protection expenditures, and green finance promotes the increase in green income by reducing financing costs. The dashed arrows represent moderating effects: equity network centrality strengthens the effects of the first two paths by accelerating the transmission of policy information. There are temporal differences among the three paths, with the cost pressure effect emerging two quarters after policy implementation, while the network synergy effect becomes significant only after four quarters, which is consistent with the characteristics of technology diffusion cycles.
Firstly, the environmental tax reform forces enterprises to innovate greenly by increasing environmental costs. According to the polluter pays principle, environmental taxes internalize the external costs of corporate carbon emissions, directly increasing the economic burden of their polluting production activities. As technology-intensive entities, enterprises on the STAR Market tend to increase their investment in green technology research and development to avoid cost pressures, reducing carbon emission intensity per unit of output through patent applications and commercial applications [15,16]. Secondly, green finance policies promote the marketization of green technologies by alleviating financing constraints. Enterprises on the STAR Market generally face high R&D risks and capital demands. Tools such as green credit and green bonds can reduce financing costs, guide capital towards low-carbon projects, and accelerate the transformation of green technologies from the laboratory to the market [17,18]. Finally, the centrality of equity networks enhances policy transmission efficiency. Enterprises on the STAR Market, through the resource networks formed by shareholder connections, can obtain policy information, technological cooperation opportunities, and market resources more quickly, thereby enhancing their responsiveness to the “dual carbon” policy.
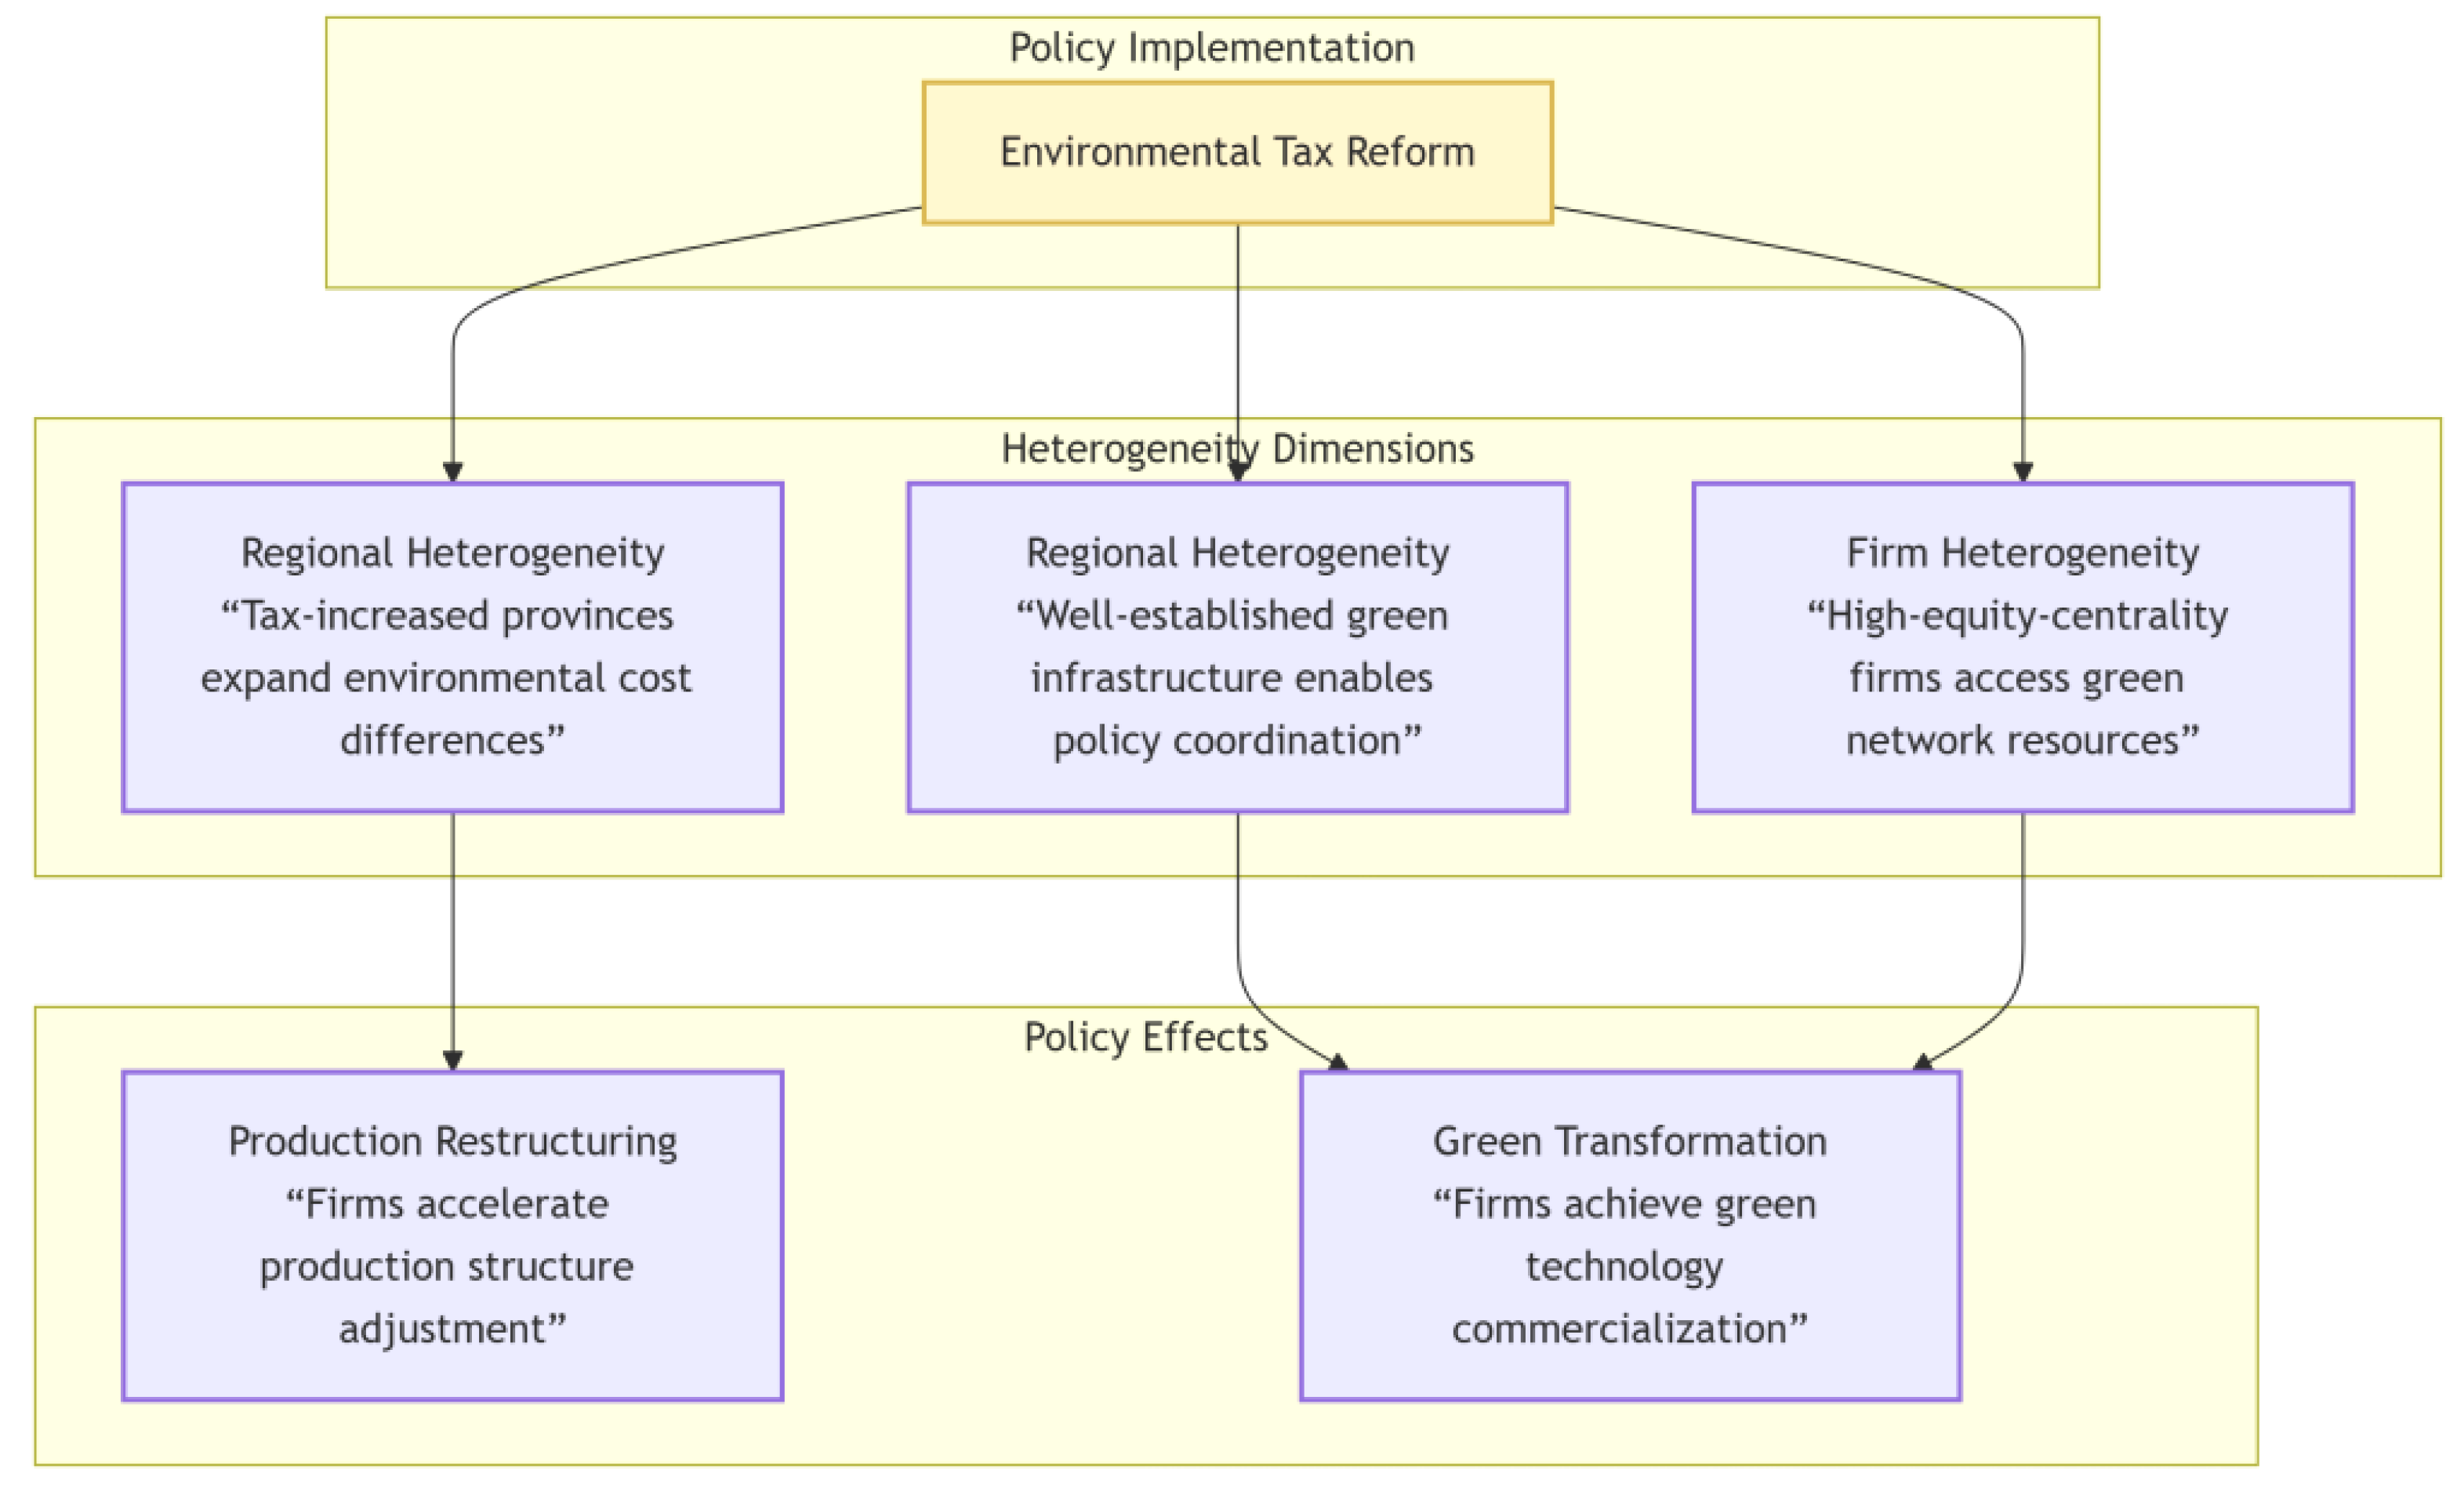
Regional and corporate heterogeneity are key dimensions that influence policy effectiveness, as shown in Figure 4. From a regional perspective, the environmental tax reform exerts a stronger constraining effect in provinces with increased tax burdens. Regions with increased tax burdens expand environmental cost differences by raising tax rates, forcing companies to adjust their production structures more quickly [19,20]; at the same time, such regions often have more comprehensive green infrastructure and policy support, enabling the formation of policy synergy through supporting measures such as fiscal subsidies and technology incubation [21]. From a corporate perspective, companies with high centrality in equity networks have a stronger advantage in transformation. Through a close network of shareholder connections, such companies can preferentially obtain opportunities for green technology cooperation, policy interpretation support, and market access qualifications, thereby achieving faster accumulation and commercial application of green technology driven by policies [22,23].
The policy coordination index system constructed in this study integrates core elements from three dimensions: the intensity of environmental tax reform, the coverage of green finance policies, and the tightness of inter-enterprise equity connection networks. Firstly, the annual environmental tax revenue as a proportion of the gross regional domestic product for each province is normalized to form a quantitative indicator reflecting the intensity of environmental regulation. Secondly, by calculating the proportion of green credit scale in the total loans of financial institutions, a standardized indicator is constructed to measure the availability of green finance resources. Finally, based on the cross-shareholding relationship network among the top ten shareholders of enterprises, the equity connection density index of each company is calculated. The importance of each indicator is determined using the information entropy weight analysis method. By weighting and synthesizing these three-dimensional indicators, a composite index is formed that can dynamically reflect the degree of collaborative action of policy tools across three levels: temporal evolution, geographical distribution, and enterprise characteristics.

2.2. Hypotheses

Based on the aforementioned theoretical framework, this paper proposes the following research hypotheses, as shown in Table 1.
Recent research has further verified this mechanism, and the promoting effect of environmental tax reform on green innovation in high-tech enterprises has been confirmed in multiple literature sources.
H1: 
The environmental tax reform has significantly increased the number of green patents held by enterprises listed on the Science and Technology Innovation Board.
The path through which green finance pilot policies alleviate financing constraints for enterprises is highly aligned with the characteristics of the technology transformation cycle of enterprises on the Science and Technology Innovation Board.
H2: 
Green finance pilots significantly reduce financing constraints for the Technology Innovation Board enterprises and promote green revenue growth.
Similar findings have been observed in the field of environmental economics regarding the amplifying effect of regional policy intensity differences on emission reduction outcomes.
H3: 
The emission reduction effect in regions with increased tax burden is significantly higher than that in regions with tax burden shift.
The moderating effect of equity networks in accelerating policy transmission is consistent with the findings of research on resource integration in emerging industries.
H4: 
Equity network centrality positively moderates the impact of policies on green patents.
The efficiency difference between mandatory policy instruments and market-based instruments has been repeatedly confirmed in comparative studies on climate policy.
H5: 
The direct contribution of environmental tax reform to the emission reduction effect is higher than the indirect contribution of green finance.
In the formation mechanism of emission reduction effects, the contribution of environmental tax reform, through the improvement of production technology cleanliness induced by direct cost constraints, will be significantly higher than that of green finance, which generates technology substitution effects through indirect financing support, reflecting the transmission efficiency differences between mandatory and market-based policy instruments.

3. Multi-Period DID Model Design

3.1. Data Sources

This study takes the official launch of the Science and Technology Innovation Board in July 2019 as the starting point, selecting A-share STAR Market enterprises listed from the third quarter of 2019 to the fourth quarter of 2023 as the research subjects. It covers all 487 STAR Market enterprises, and after excluding ST/*ST enterprises and samples with missing key variables, it ultimately retains 3896 valid observations. The financial data of enterprises come from CSMAR and Wind databases, covering core indicators such as operating income, R&D investment, and asset–liability ratio. The data are updated to the fourth quarter of 2023 to ensure timeliness and completeness. Green innovation data are obtained from the patent database of the State Intellectual Property Office of China, filtering green patents applied for by enterprises after listing, focusing on International Patent Classification Section G and Class Y02, and excluding historical technical interference before listing. Carbon emission data are based on the latest accounting method of the China Carbon Emission Database, combining enterprise energy consumption and production activity data, and calculating carbon emission intensity year by year since 2020 to ensure synchronization with the operation cycle of the STAR Market. Policy data are integrated from the environmental tax reform rules and the list of pilot cities for green finance issued by various provinces from 2019 to 2023, clarifying the division criteria between provinces with increased tax burden and provinces with tax burden transfer, and accurately matching the policy coverage according to the registered location of enterprises.
Continuous variables underwent 1% double-tailed winsorization to mitigate the impact of outliers. To verify threshold sensitivity, a comparison was made between 0.5% and 2% winsorization treatments. The mean difference in the number of green patents was less than 3%, and the standard deviation of financial leverage changed within ±2%. Missing values were imputed using the industry-year mean method, with the missing rate of key variables being less than 8%. The results of multiple imputation methods indicated that the coefficient of the policy coordination index was 0.342 (SE = 0.079), which was consistent in direction with the benchmark result of 0.356. The coefficient for complete cases was 0.341, confirming the robustness of the conclusion.

3.2. Variable Selection

3.2.1. Explained Variable

Green Transai Index: Generated by the equal-weighted sum of three standardized indicators—the number of green patents, the proportion of green capital expenditure, and carbon emission reduction—it comprehensively measures a company’s green technological innovation, low-carbon investment, and emission reduction effectiveness. This index avoids measurement bias caused by a single indicator through multidimensional quantification methods, accurately capturing the dynamics of transformation.
The calculation formula for the green transformation index (Green Transai) is as follows:
G r e e n T r a n s a i t = 1 3 G r e e n P a t e n t a i t μ a , t G P σ a , t G P + G r e e n C A P E X a i t μ a , t G C σ a , t G C + C a r b o n Re d u c t i o n a i t μ a , t C R σ a , t C R

3.2.2. Core Explanatory Variables

The sample policy in this study was implemented in Q4 2021, based on the nationwide effective date of the “Action Plan for Carbon Peaking by 2030” issued by the State Council. Despite minor differences in the release dates of local documents for policy tools such as environmental tax reforms and green finance pilots across provinces, the actual implementation effectiveness of all policy tools is based on Q4 2021 as the nationwide unified starting point. Local governments are required to complete the supporting detailed rules for policies before Q4 2021, and actual policy exposure at the enterprise level begins from this quarter; quarterly data for key variables such as corporate carbon accounts and green patents are fully disclosed from Q4 2021 onwards.
Policy coordination index: A continuous variable, synthesized by weighting the standardized values of the intensity of environmental tax reform in the province where the enterprise is registered, the status of green finance pilot, and the density of the enterprise’s equity network.
Policy time (Post): The value is set to 1 for the fourth quarter of 2021 and beyond, with the release date of the State Council’s “Action Plan for Carbon Peaking by 2030” as the starting point of policy impact. This variable controls the dynamic effects of policy implementation.
High Carboni: A value of 1 is assigned when the carbon emission intensity of the enterprise’s secondary industry, as classified by the China Securities Regulatory Commission, is higher than the median value of the entire sample. This variable distinguishes the moderating effect of industry-specific carbon emission heterogeneity on policy responses.
High Financial Constraintsi: A value of 1 is assigned when the enterprise’s KZ index is higher than the median value in the industry, reflecting the constraining effect of external financing difficulties on green transformation.
The construction of the policy coordination index involves three steps: Step 1: Perform range normalization on the indicators of the three dimensions to eliminate dimensional differences. The normalization window covers the full sample period from Q3 2019 to Q4 2023.
Step 2: Calculate the information entropy value of each indicator. The smaller the entropy value, the greater the information content and the higher the weight. The specific formula is as follows:
e j = 1 I n N N i = 1 p i j I n p i j
Step 3: Weight calculation:
w j = 1 e j 3 k 1 ( 1 e k )
Final index:
Policy _ cord pt = 3 j = 1 w j · x p j , t n o r m

3.2.3. Mediating Variables

Environmental cost: The proportion of environmental protection expenditure in operating income, encompassing explicit costs such as pollution discharge fees and depreciation of environmental protection equipment. This variable examines the pathway through which the “dual carbon” policy drives green innovation via the cost-induced mechanism.
Green finance: The standardized sum of green credit and green bonds, measuring the ability of enterprises to obtain low-carbon funds.
Equity network centrality: A degree centrality index calculated based on the connected network of the top ten shareholders, reflecting the efficiency of a company in integrating policy resources and technology through its shareholder network.

3.2.4. Control Variables

Enterprise size: The natural logarithm of total assets, controlling the nonlinear impact of economies of scale on green investment. Large enterprises are more likely to bear the fixed costs of transformation.
Financial leverage: measures the constraints of capital structure on green investment. Highly leveraged enterprises may face higher debt repayment pressure.
Profitability: Reflects the financial support capability of operational performance for technological research and development. Enterprises with high ROA have more abundant cash flow.
Tobin Q: It represents the valuation incentive of market expectations for green transformation. Companies with high valuations have lower financing costs.
State-owned enterprise: A dummy variable, where state-owned enterprises are assigned a value of 1, to control for differences in policy responses caused by ownership differences.
Marketization: The quarterly interpolation of the Fan Gang Index for the province where the enterprise is registered, reflecting the moderating effect of the regional institutional environment on green transformation.
Based on the above content, the main variables of this study are described in Table 2.
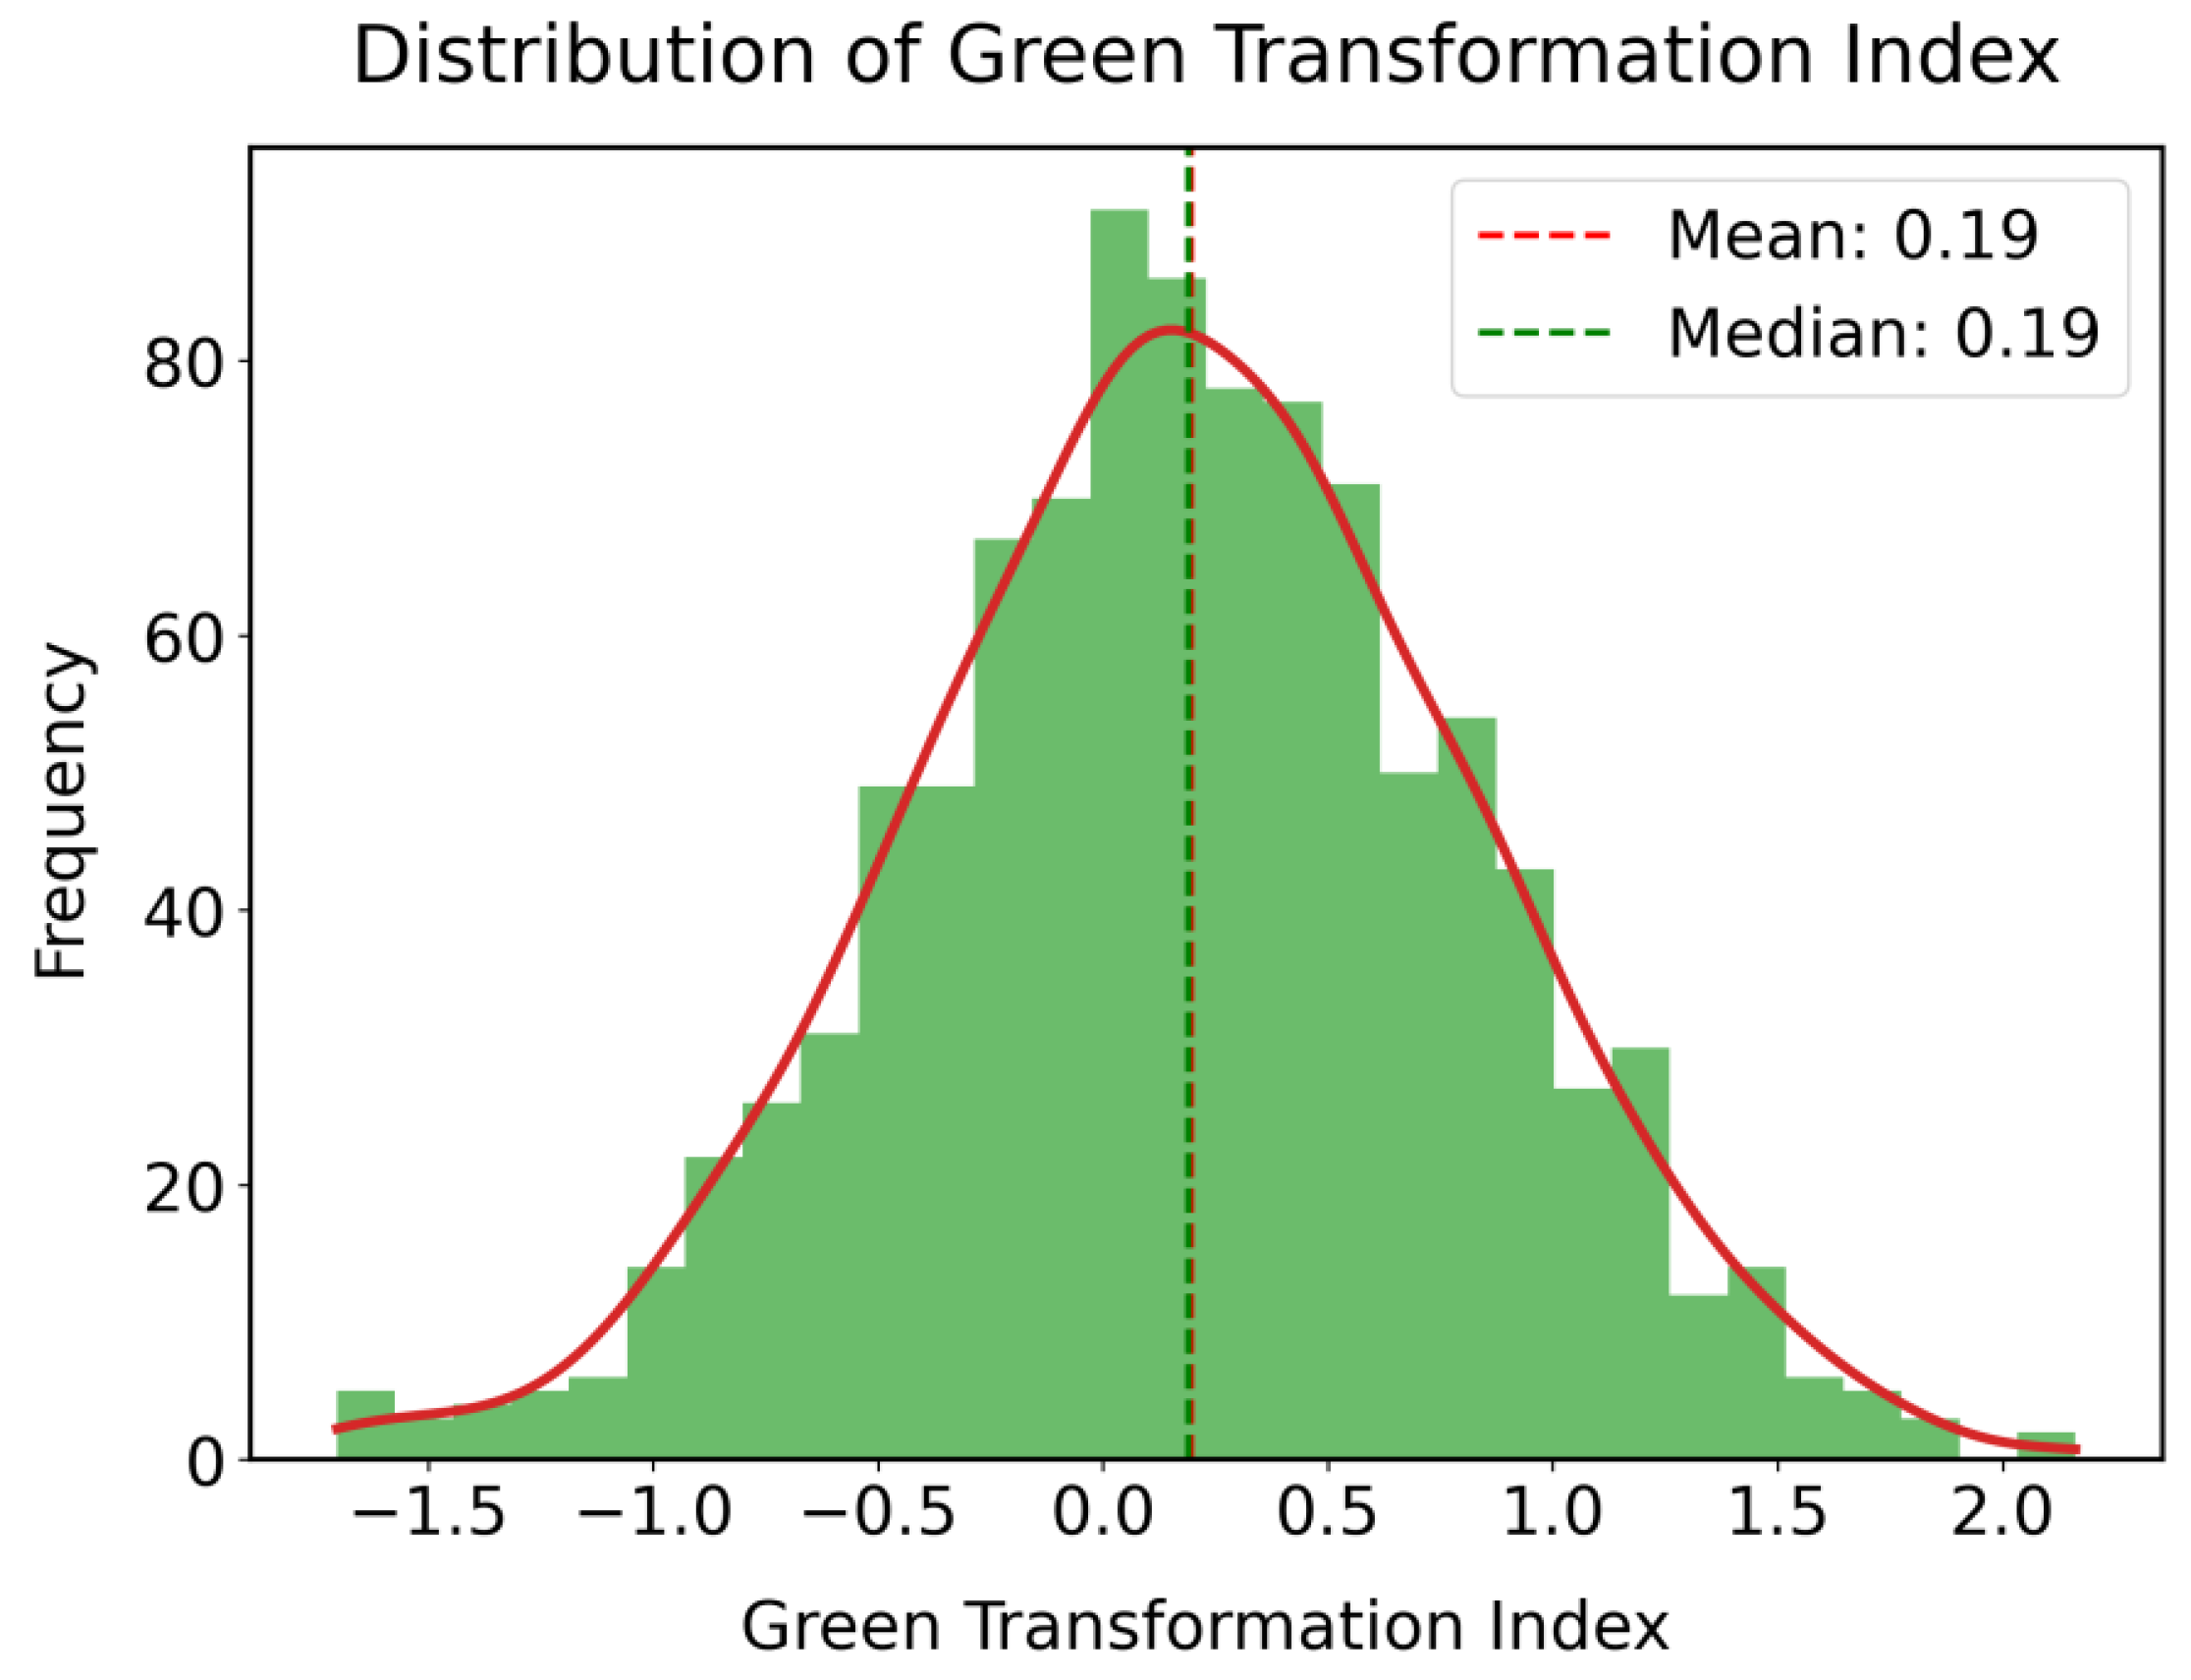
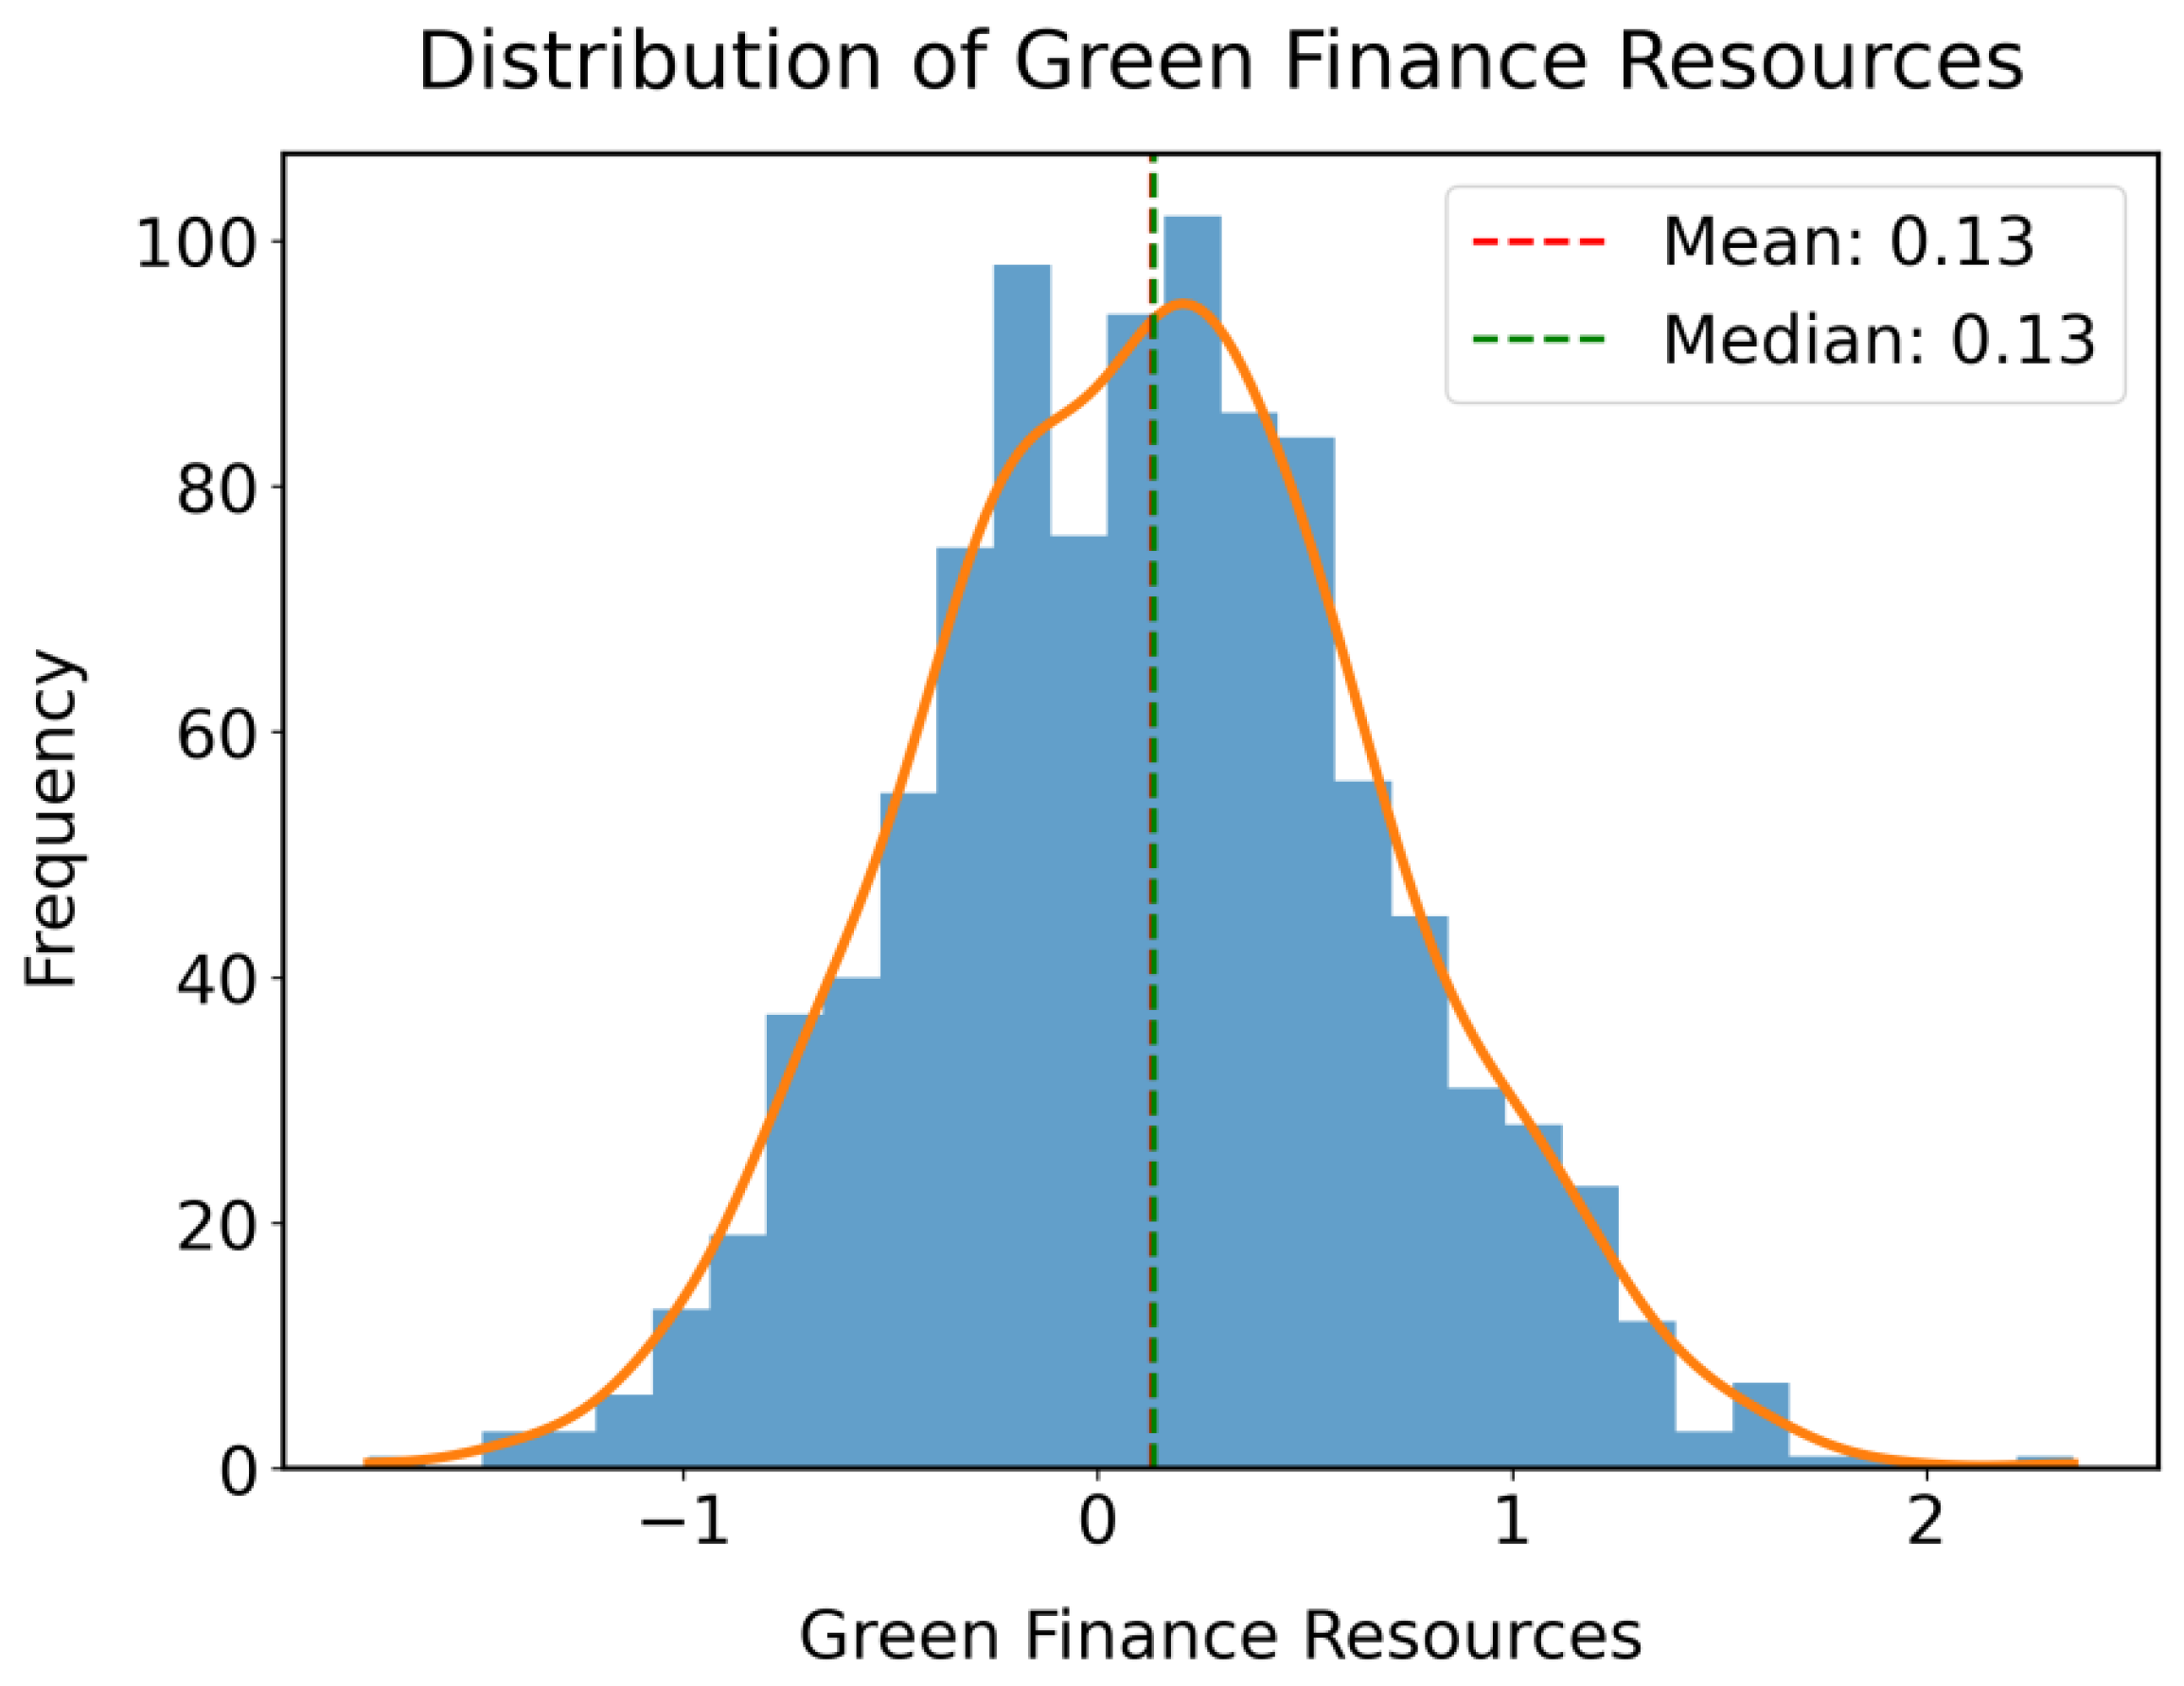
The findings of this study, as revealed in Table 3, depict the structural characteristics of the sample data. The data in Figure 5 show that the mean value of the green transformation index is 0.15, with a standard deviation of 0.63 and a range span of 2.02 units, indicating significant differentiation in the green transformation process of enterprises on the STAR Market. Enterprises on the STAR Market account for 62%, while the sample accounts for 53% after policy implementation, meeting the data structure requirements of the multi-period DID model. High-carbon industries account for 36%, and enterprises with high financing constraints account for 47%, highlighting the environmental risk and resource constraint characteristics of the sample group. The mean value of the logarithm of enterprise size is 22.3, the return on assets is 6%, and Tobin’s Q value is 2.1, reflecting that enterprises on the STAR Market possess both growth potential and profitability. The mean value of environmental costs is 1.8% and exhibits a right-skewed distribution. According to the data in Figure 6, there is significant polarization in the green financial resource index, with the mean value of equity network centrality being 0.21, revealing the resource agglomeration advantage of core enterprises and providing data support for heterogeneity analysis.

3.3. Model Construction

This study employs a multi-period difference-in-differences (DID) model to evaluate policy effects. Although the staggered DID method is suitable for scenarios with significant differences in policy implementation timing, the policy shocks faced by enterprises in the sample of this paper are concentrated in Q4 2021, with a high degree of temporal overlap. The two-way fixed effects model can effectively capture the average treatment effect of concentrated policy shocks.
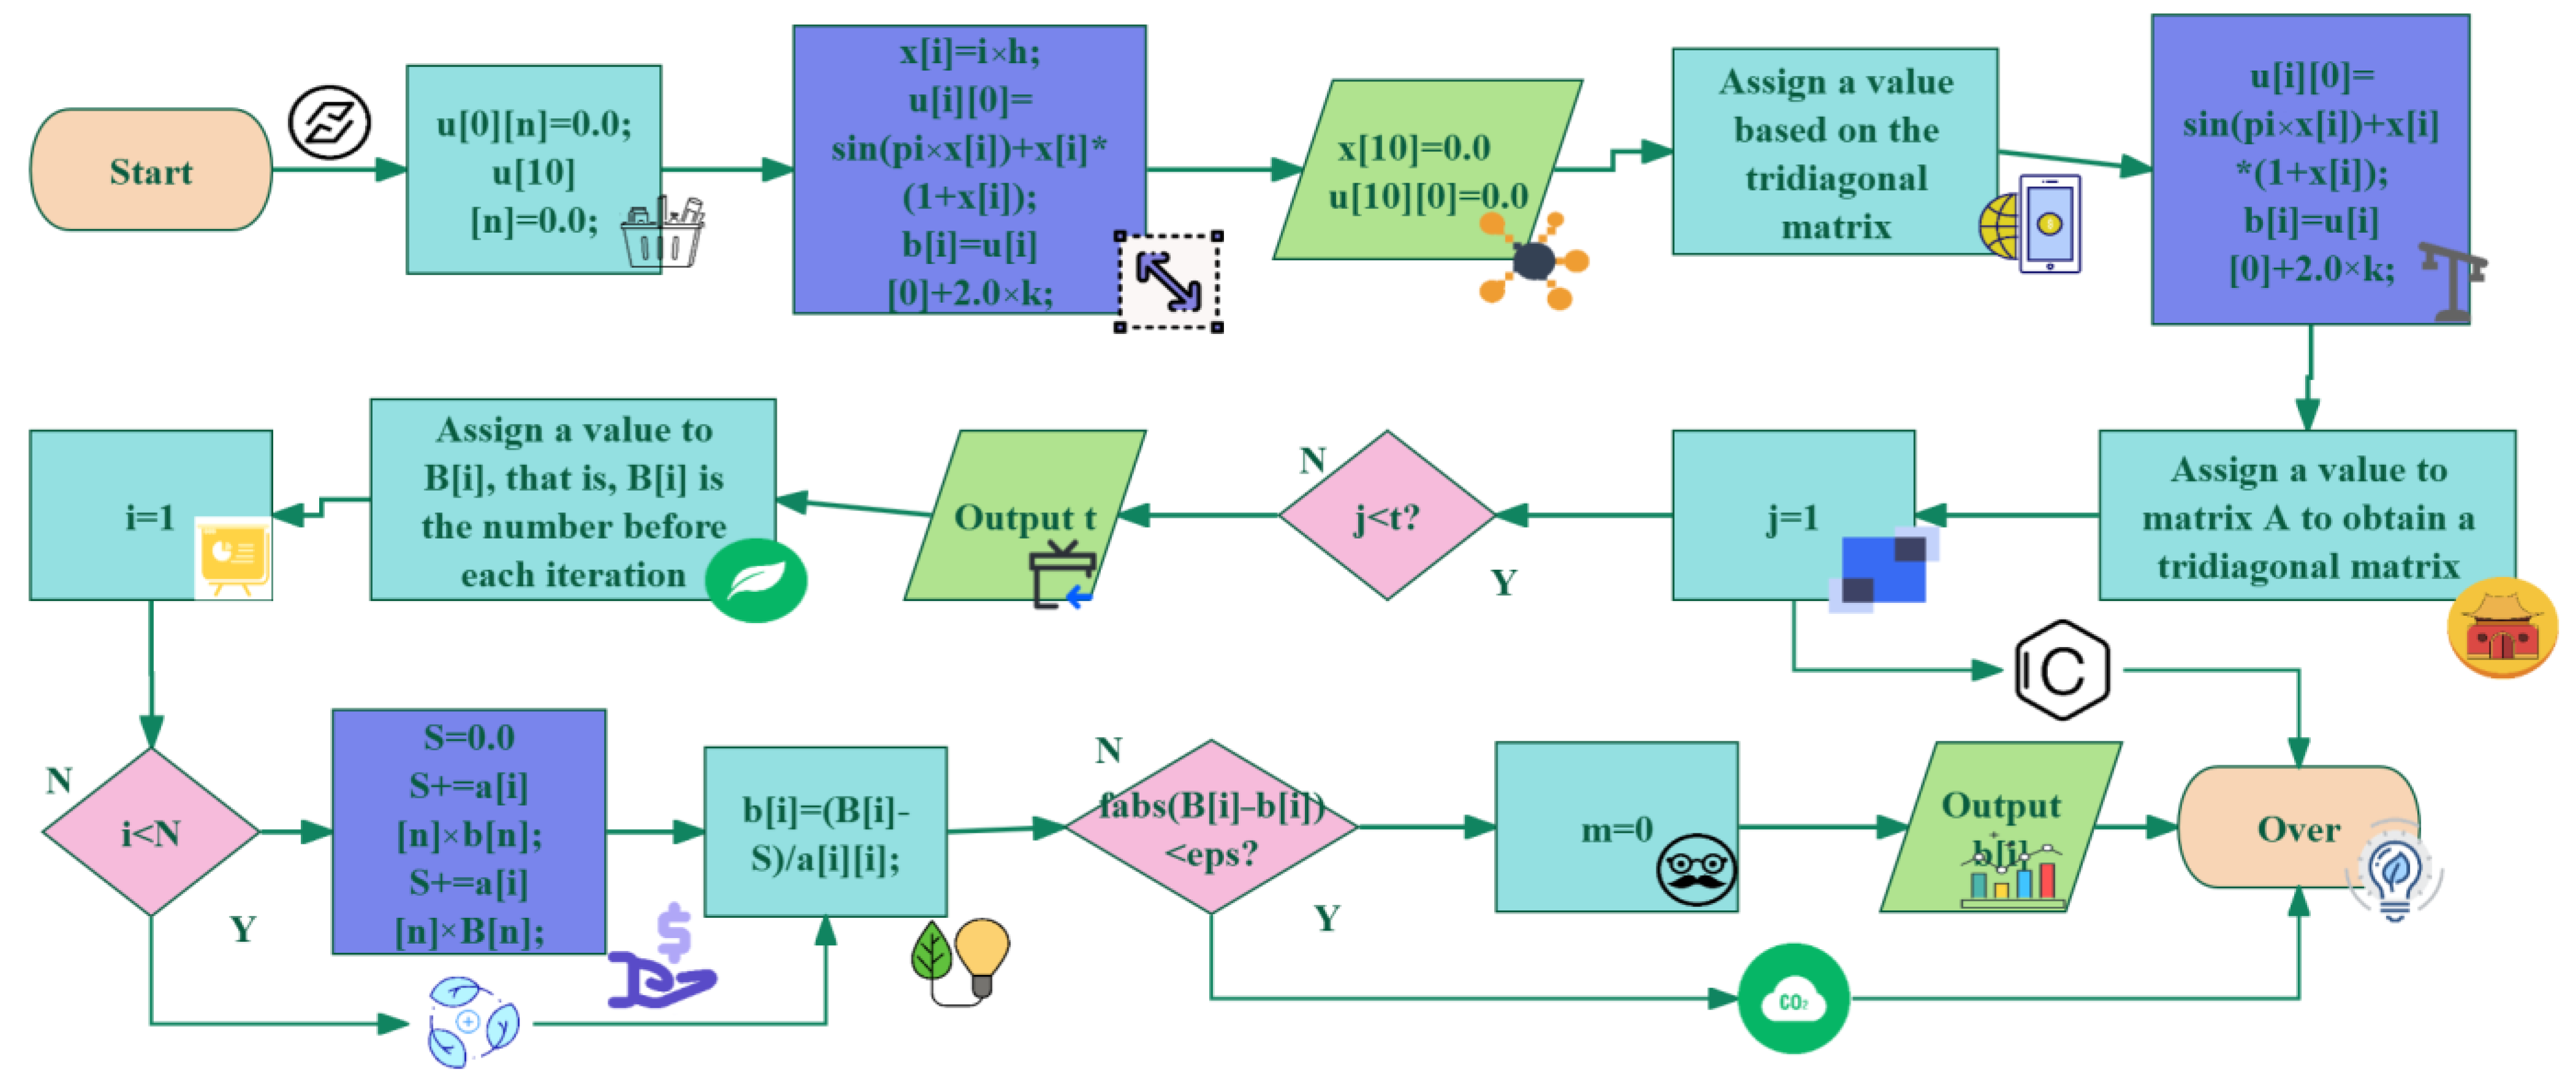
This study constructs a panel data model based on the multi-period difference-in-differences method, the triple difference-in-differences method, the dynamic effect model, and the mediation effect model to systematically evaluate the driving effect and mechanism of the “dual carbon” policy on the green transformation of enterprises on the Science and Technology Innovation Board, as shown in Figure 7.
(1) To estimate the average treatment effect of the “dual carbon” policy on the green transformation of enterprises on the STAR Market, a benchmark model is constructed based on the multi-period difference-in-differences method. This model captures the net effect of policy shocks through interaction terms while controlling for firm-specific and time-specific fixed effects. The model formula is as follows:
P o l i c y _ c o o r d p i t = E n v T a x p t × ω 1 + G r e e n F i n p t × ω 2 + E q u i t y N e t i t × ω 3
where p represents the province, i represents the enterprise, and t represents the time. This variable is generated by multiplying the intensity of provincial environmental tax reform in the enterprise’s registered location, the coverage of green finance pilot programs, and the density of the enterprise’s own equity network.
(2) To examine the heterogeneity of policy effects across industries and financing constraints, a triple-difference interaction term is introduced. The model adds moderating variables for industry carbon intensity and financing constraints on the basis of the benchmark DID, with the formula as follows:
G r e e n T r a n s i t = α + β 1 T r e a t i × P o s t t × H i g h C a r b o n i + β 2 T r e a t i × P o s t t × H i g h F C i + β 3 X i t + μ i + γ t + θ g + i t
where H i g h C a r b o n i represents high-carbon industry enterprises, and H i g h F C i represents high-financing-constraint enterprises. The coefficient of the interaction term T r e a t i × P o s t t × H i g h C a r b o n i reflects the additional driving effect of policy on high-carbon industry enterprises, β 2 , while revealing the amplification effect of financing constraint relief on policy effectiveness.
(3) To verify the parallel trends hypothesis and capture the dynamic evolution of policy effects, an event study model is constructed. The model multiplies the dummy variables for each period before and after the policy shock by the treatment group, and the formula is as follows:
G r e e n T r a n s i t = α + k = 3 4 β k T r e a t i × D t = k + β 2 X i t + μ i + γ t + i t
Among them, D t = k is a dummy variable is used to represent the timing of the event. The coefficient β 3 tests the parallelism of trends before the policy, β 0 , and reflects the dynamic effects of each quarter after the policy implementation. If the coefficient before the policy is not significant and the coefficient after the policy continues to be positive, it supports the validity of causal inference.
To reveal the mediating pathways of policy-driven green transformation, we examine the mediating effects of environmental costs, green finance, and equity networks, respectively. Taking environmental costs as an example, we construct a two-stage model:
(4) Phase 1:
E n v Cos t i t = α + β 1 T r e a t i × P o s t t + β 2 X i t + μ i + γ t + i t
(5) Phase 2:
G r e e n T r a n s i t = α + β 1 T r e a t i × P o s t t + β 2 E n v Cos t i t + β 3 X i t + μ i + γ t + i t
To address the potential post-processing bias issues in the traditional two-step mediation model, this study adopts the Imai–Keele–Tingley causal mediation analysis method. Firstly, a model is constructed to examine the impact of the policy coordination index on the mediating variable. Secondly, an effect model is established to explore the mediating variable’s influence on the green transformation index.
If ( T r e a t i × P o s t t ) the coefficient is significantly positive in both the first and second stages, it indicates that the increase in environmental costs is an important path for policy-driven transformation.
Driven by the “dual carbon” goals, technology innovation board enterprises, as the core carriers of technological innovation, have made their dynamic response mechanisms for green transformation a key issue in policy effect evaluation. Existing research often adopts static analysis frameworks, which makes it difficult to capture the time-varying characteristics of policy implementation and the moderating effects of enterprise heterogeneity on transformation paths. This results in significant limitations in analyzing the synergistic effects and dynamic cumulative impacts of multiple policy instruments.
Based on the insufficient identification of dynamic effects and heterogeneous adjustments in traditional difference-in-differences (DID) models, this study proposes a multi-period DID model. By introducing the interaction term between policy time dummy variables and treatment group indicators, it quantifies the dynamic treatment effect of the “dual carbon” policy on technology innovation board enterprises. This model breaks through the constraints of traditional static analysis, captures the time-varying trajectory of policy effects through dynamic interaction terms, and further decomposes the heterogeneous adjustment effects of industry carbon emission intensity and financing constraints by combining a triple-difference design. It provides methodological support for revealing the complex mechanism of policy transmission.
The multi-period difference-in-differences model constructed in this study not only effectively identified the dynamic driving effect of the “dual carbon” policy on the green transformation of enterprises on the Science and Technology Innovation Board but also revealed the composite action path of environmental cost pressure, green finance incentives, and equity network synergy through heterogeneous grouping and mechanism testing.

4. Emission Reduction Effect Test

4.1. Correlation Analysis

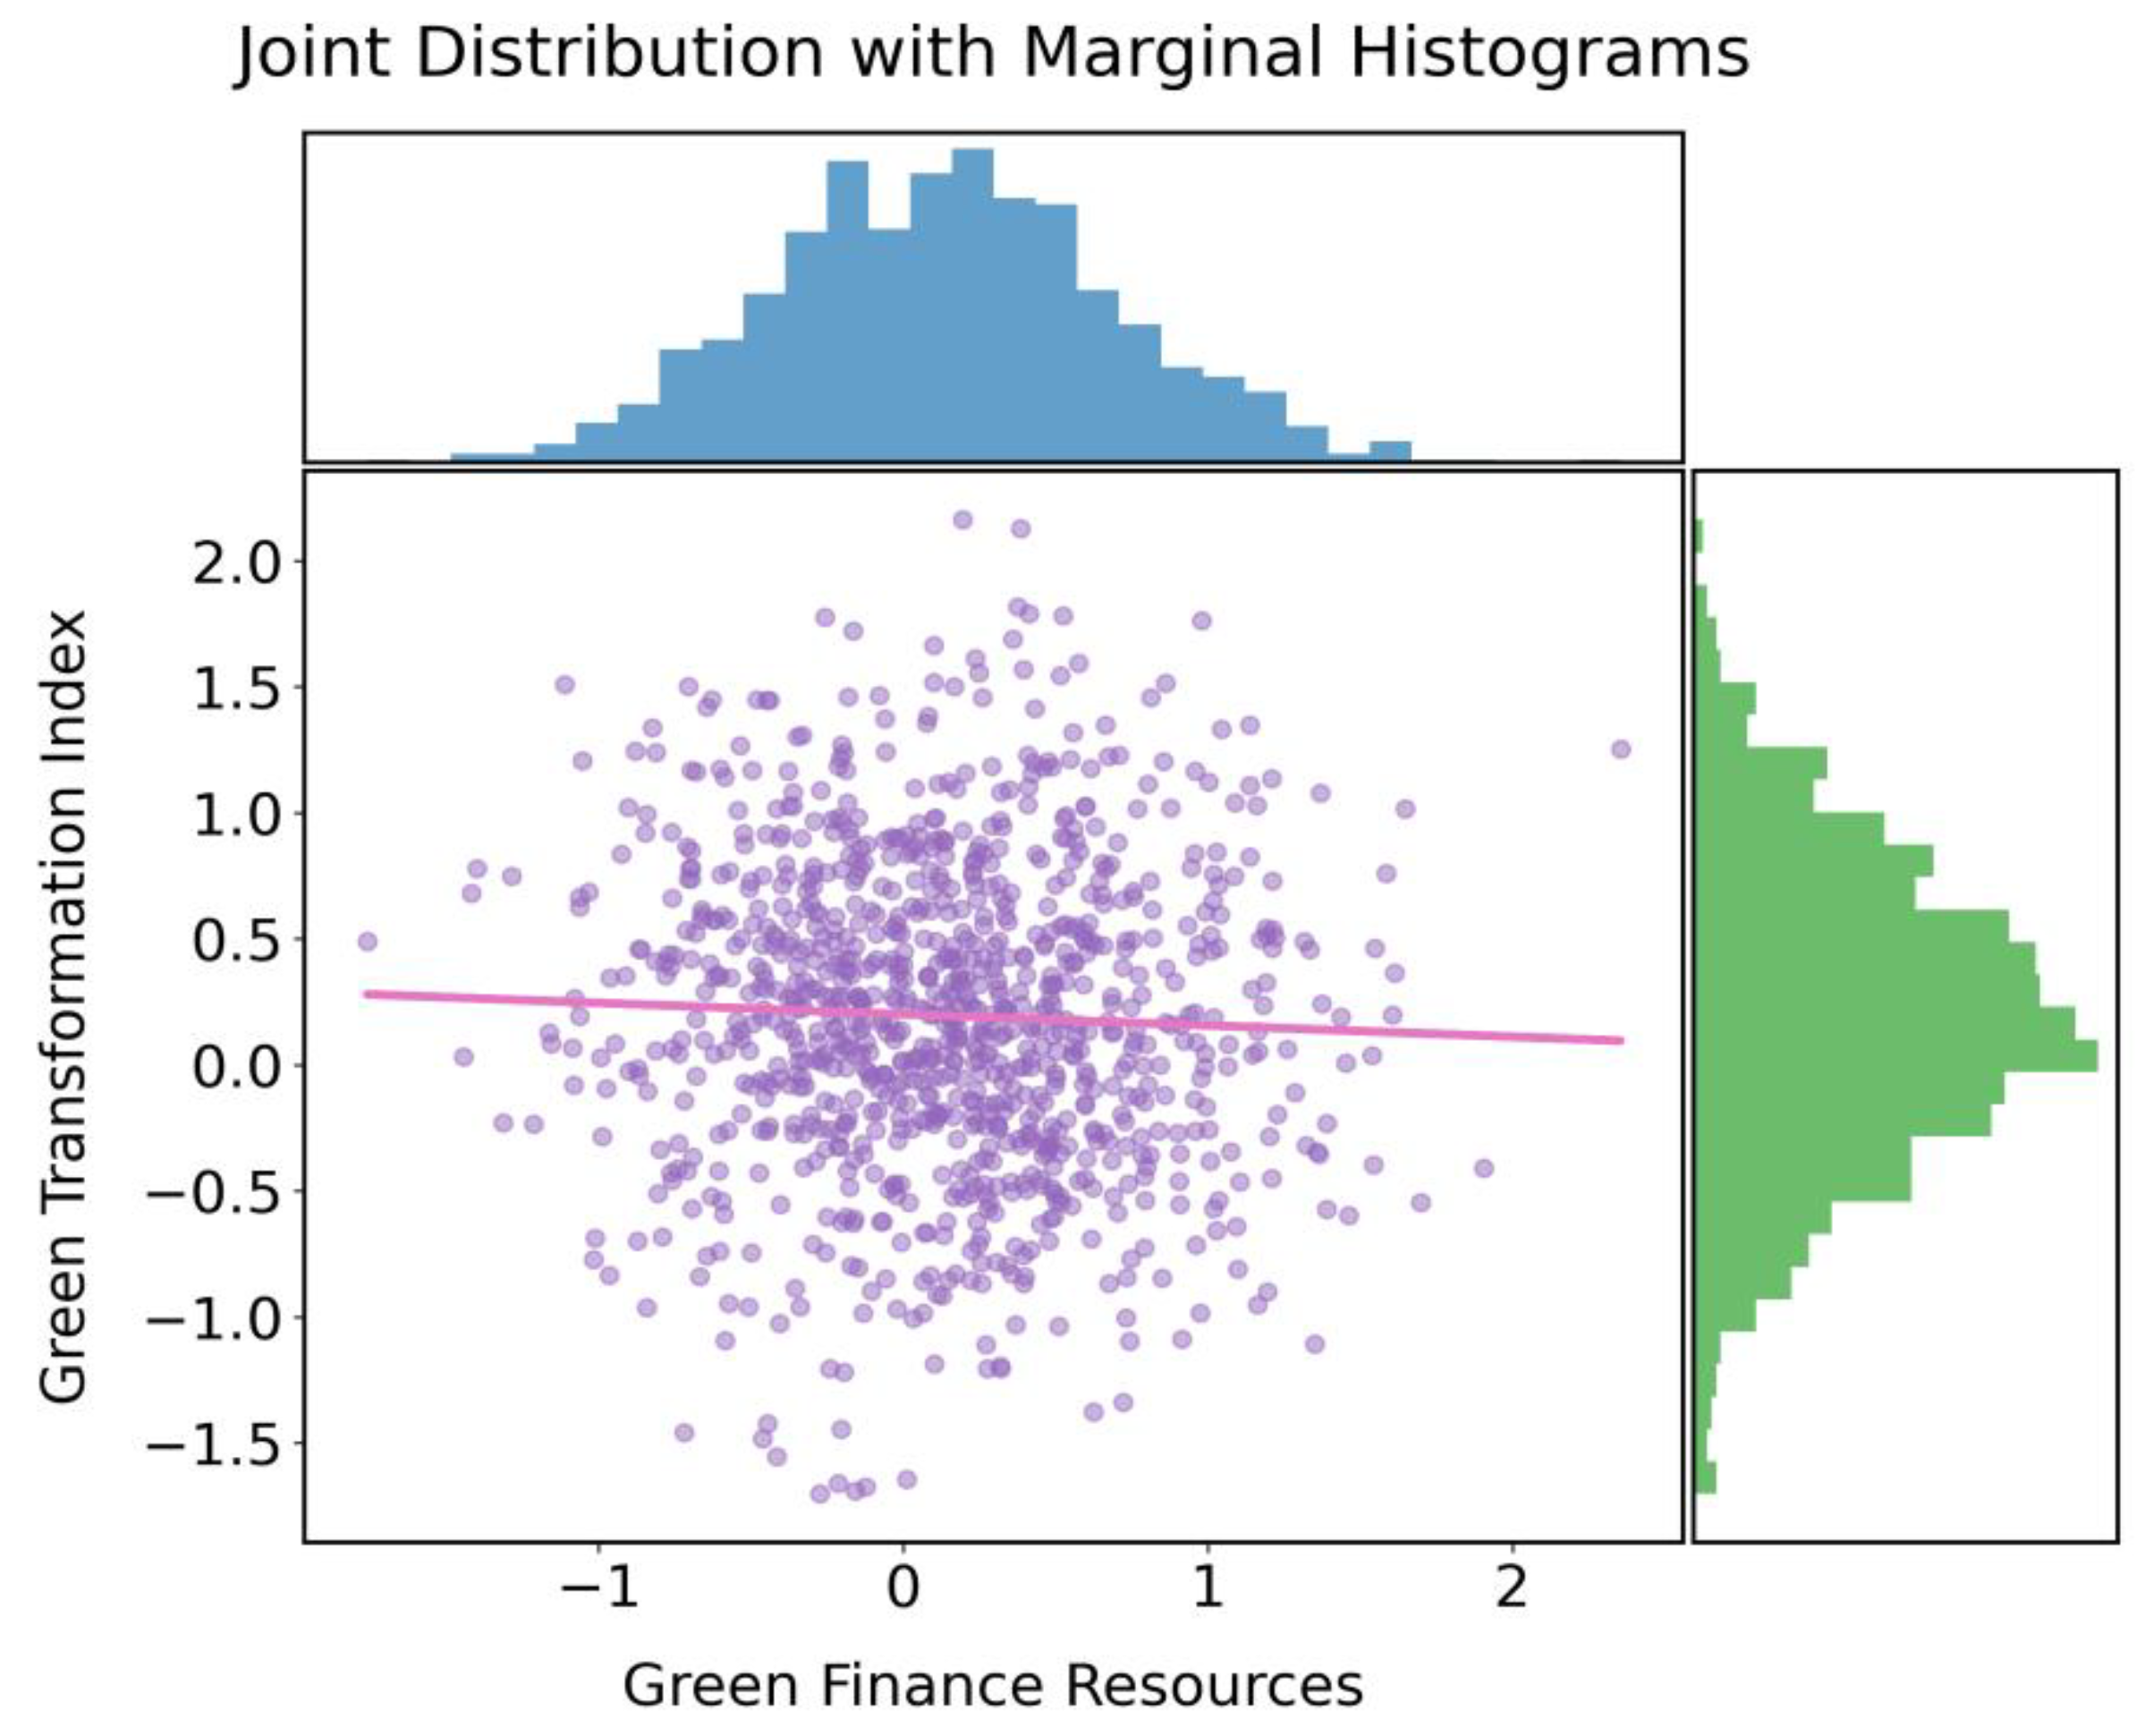
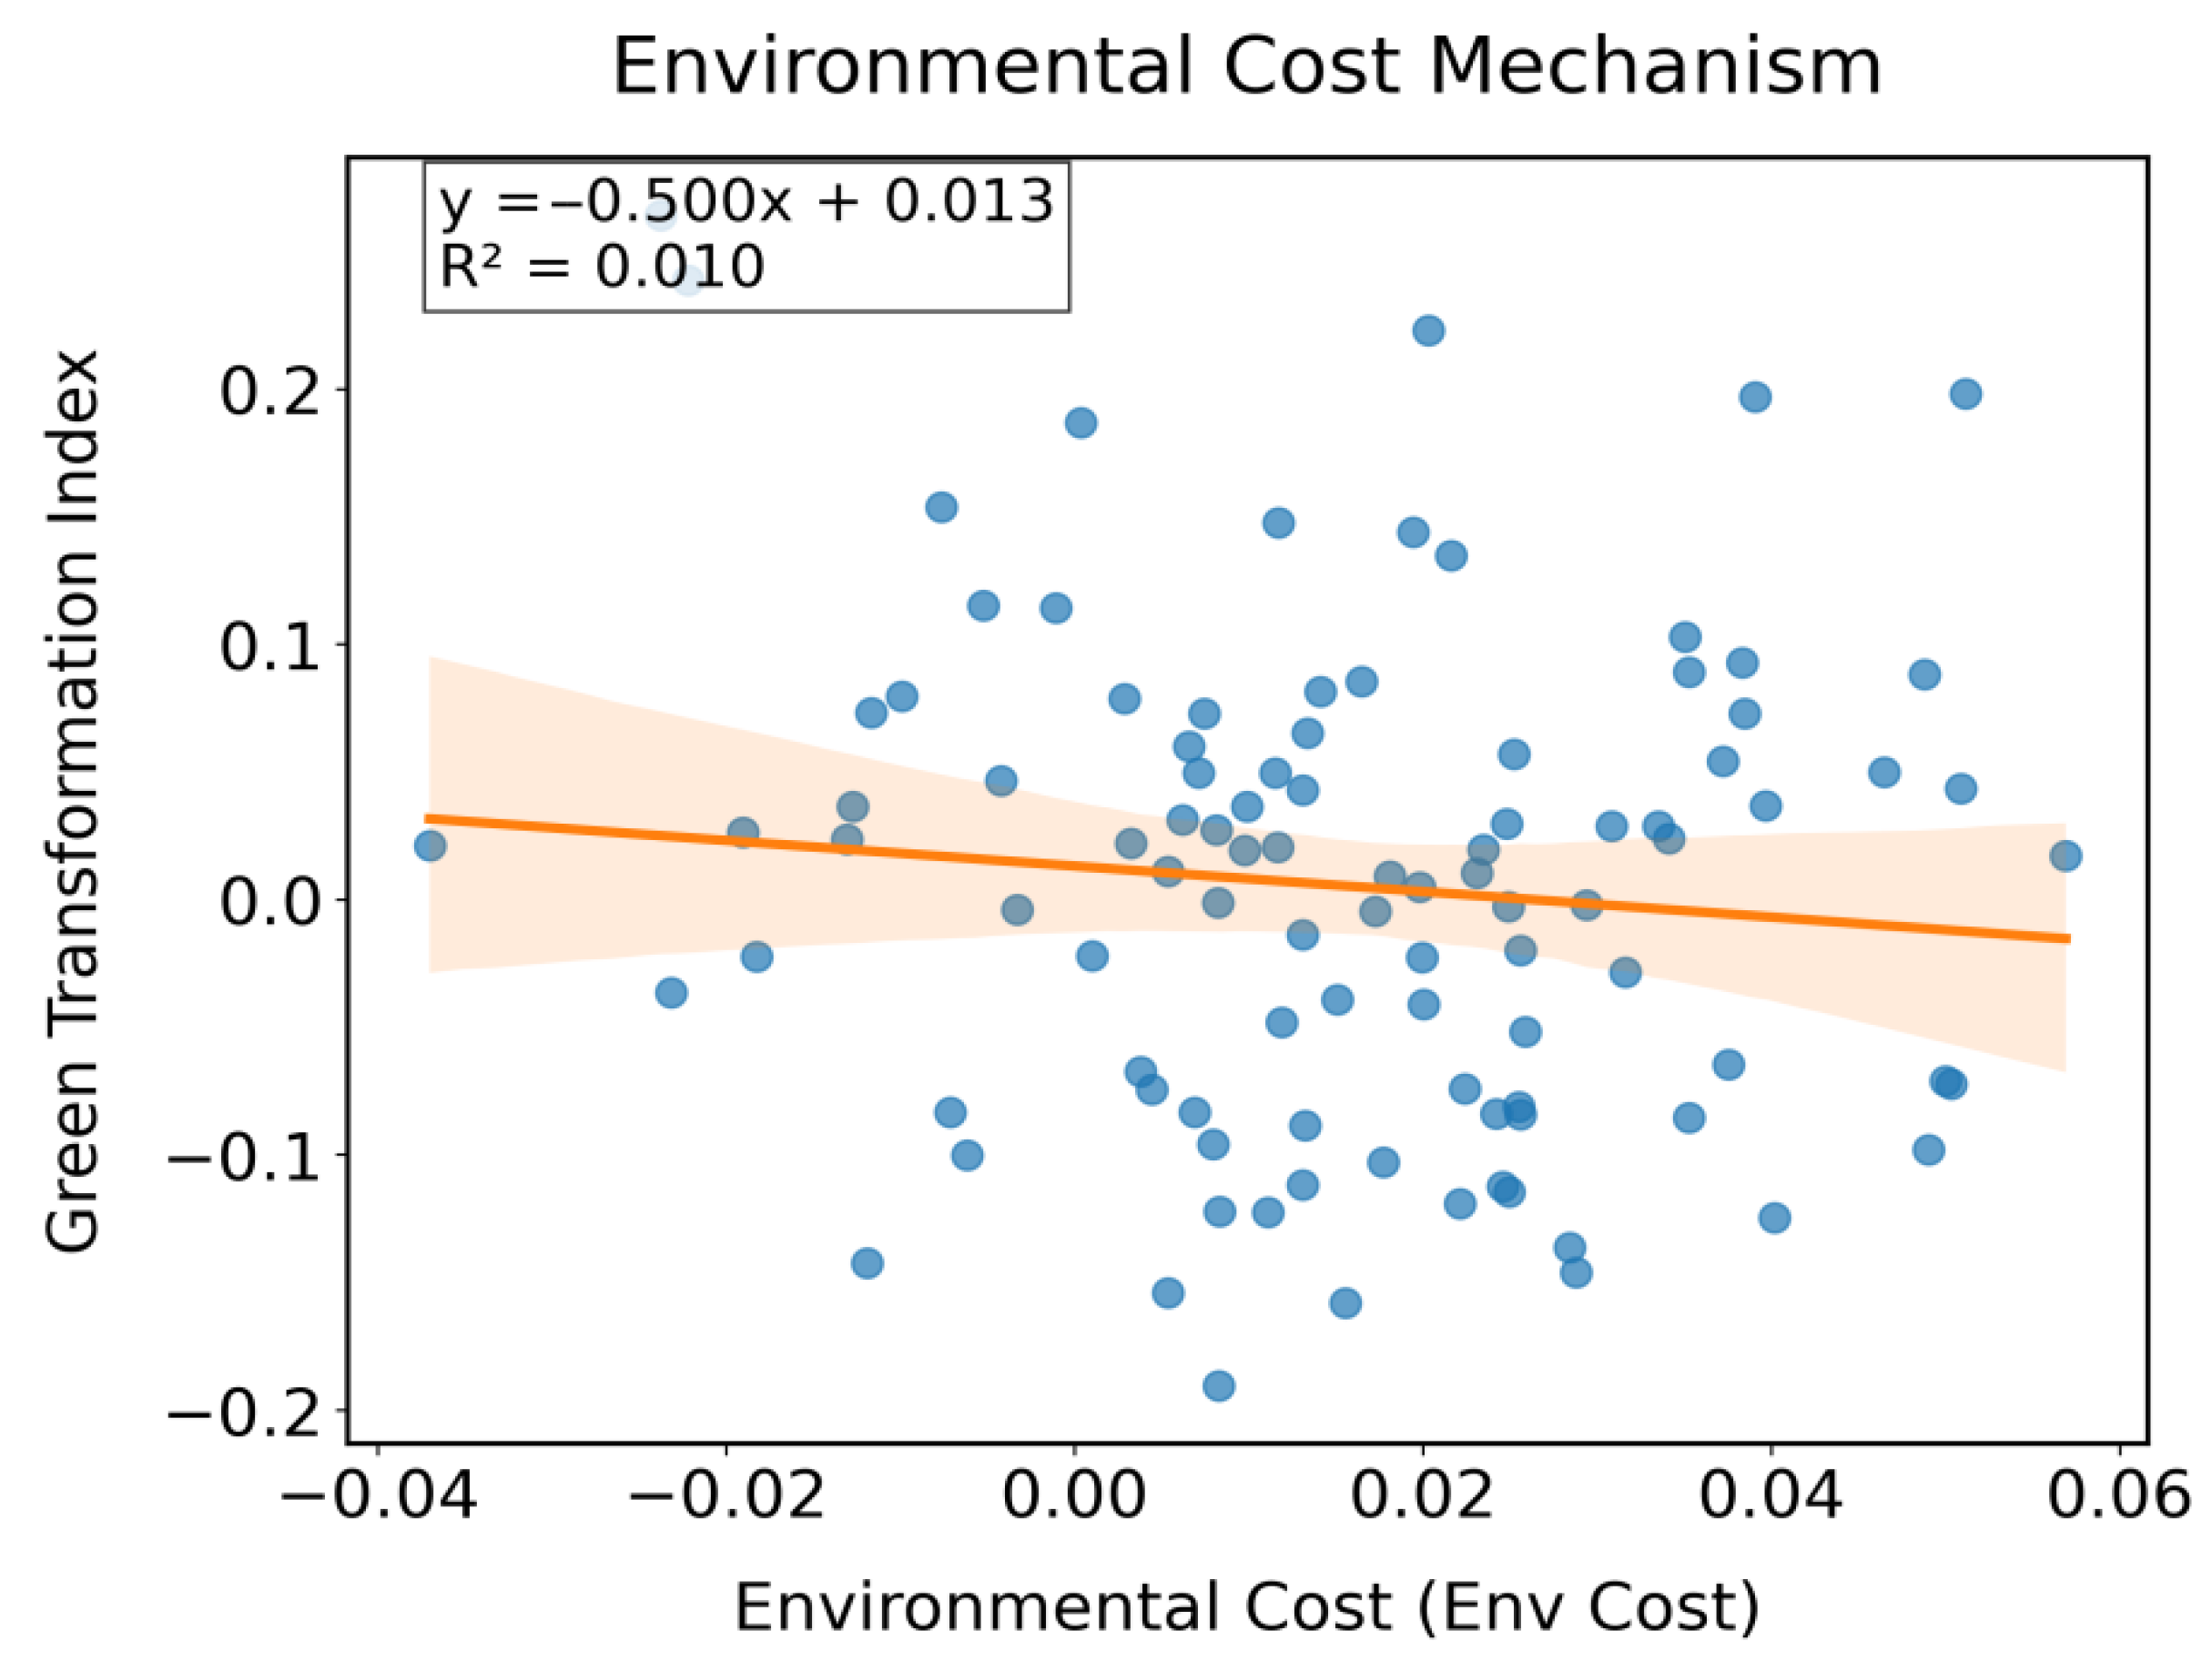
The interaction mechanism between variables was revealed through studying the correlation coefficient matrix. According to the data in Table 4 (Figure 8), the green transformation index is significantly positively correlated with the identification of enterprises on the Science and Technology Innovation Board at a level of 0.22, confirming the existence of policy targeting effects. The policy time variable is moderately correlated with the green transformation index at a level of 0.18, suggesting that the dynamic effects of policies have a gradual strengthening characteristic. According to the data in Figure 9, environmental costs are weakly positively correlated with green transformation at a level of 0.17, preliminarily verifying the effectiveness of the cost-driven mechanism. However, the correlation strength is lower than the strong positive correlation of 0.29 with green financial resources, indicating that financing incentives may play a more important role. The high correlation coefficient of 0.27 for equity network centrality highlights the accelerating effect of resource integration capability on the transformation process. The high-carbon industry shows a weak negative correlation with green transformation at a level of −0.08, which is consistent with theoretical expectations but lacks statistical significance and requires further model verification. The negative correlation of financial leverage with green transformation at a level of −0.12 preliminarily indicates the inhibitory effect of debt pressure on low-carbon investment.

4.2. Benchmark Regression Results

Based on the multi-period difference-in-differences model, this section systematically examines the driving effect of the “dual carbon” policy on the green transformation of enterprises on the Science and Technology Innovation Board from three dimensions: main effect, heterogeneity, and mechanism path. All models adopt two-way fixed effects, with standard errors clustered at the provincial level. By gradually adding control variables, grouping dummy variables, and mediating variables, the robustness of policy effects and the significance of action paths are verified.
Model (1) serves as the baseline model, encompassing only the core variables: policy coordination index and the policy time dummy variable. Model (2) further incorporates control variables such as enterprise size, financial leverage (Lev), return on assets, Tobin Q value, state-owned holding, and marketization index. Model (3) represents the optimized full model, retaining significant control variables while eliminating non-significant terms to ensure the robustness of the results.
The findings of this study validate the policy-driven effect through multi-period DID regression results. According to the data in Table 5, the overall model shows that the identification coefficient of enterprises on the Science and Technology Innovation Board is 0.356 and passes the 1% significance test, confirming the significant targeted effect of the policy. The coefficient of the policy time variable is 0.204, which is significant at the 5% level, indicating that the dynamic effect of the policy continues to strengthen. The financial leverage coefficient is −0.109, which is negatively significant, confirming the crowding-out effect of high debt on low-carbon investment. The Tobin’s Q coefficient is 0.061 and significant, indicating that market valuation incentives effectively promote technological iteration. The coefficient of the regional marketization index is 0.021, which passes the 5% significance test, verifying the positive moderating effect of institutional environment on policy implementation. The adjusted R2 of the model reaches 0.438, indicating that the variable system has strong explanatory power.
Model (1) examines the transformation resistance of high-carbon emission industries through the high-carbon test, Model (2) analyzes the inhibitory effect of financing capacity on policy transmission using high financial constraints, and Model (3) verifies the moderating effect of regional policy intensity based on the identification of tax burden increase regions.
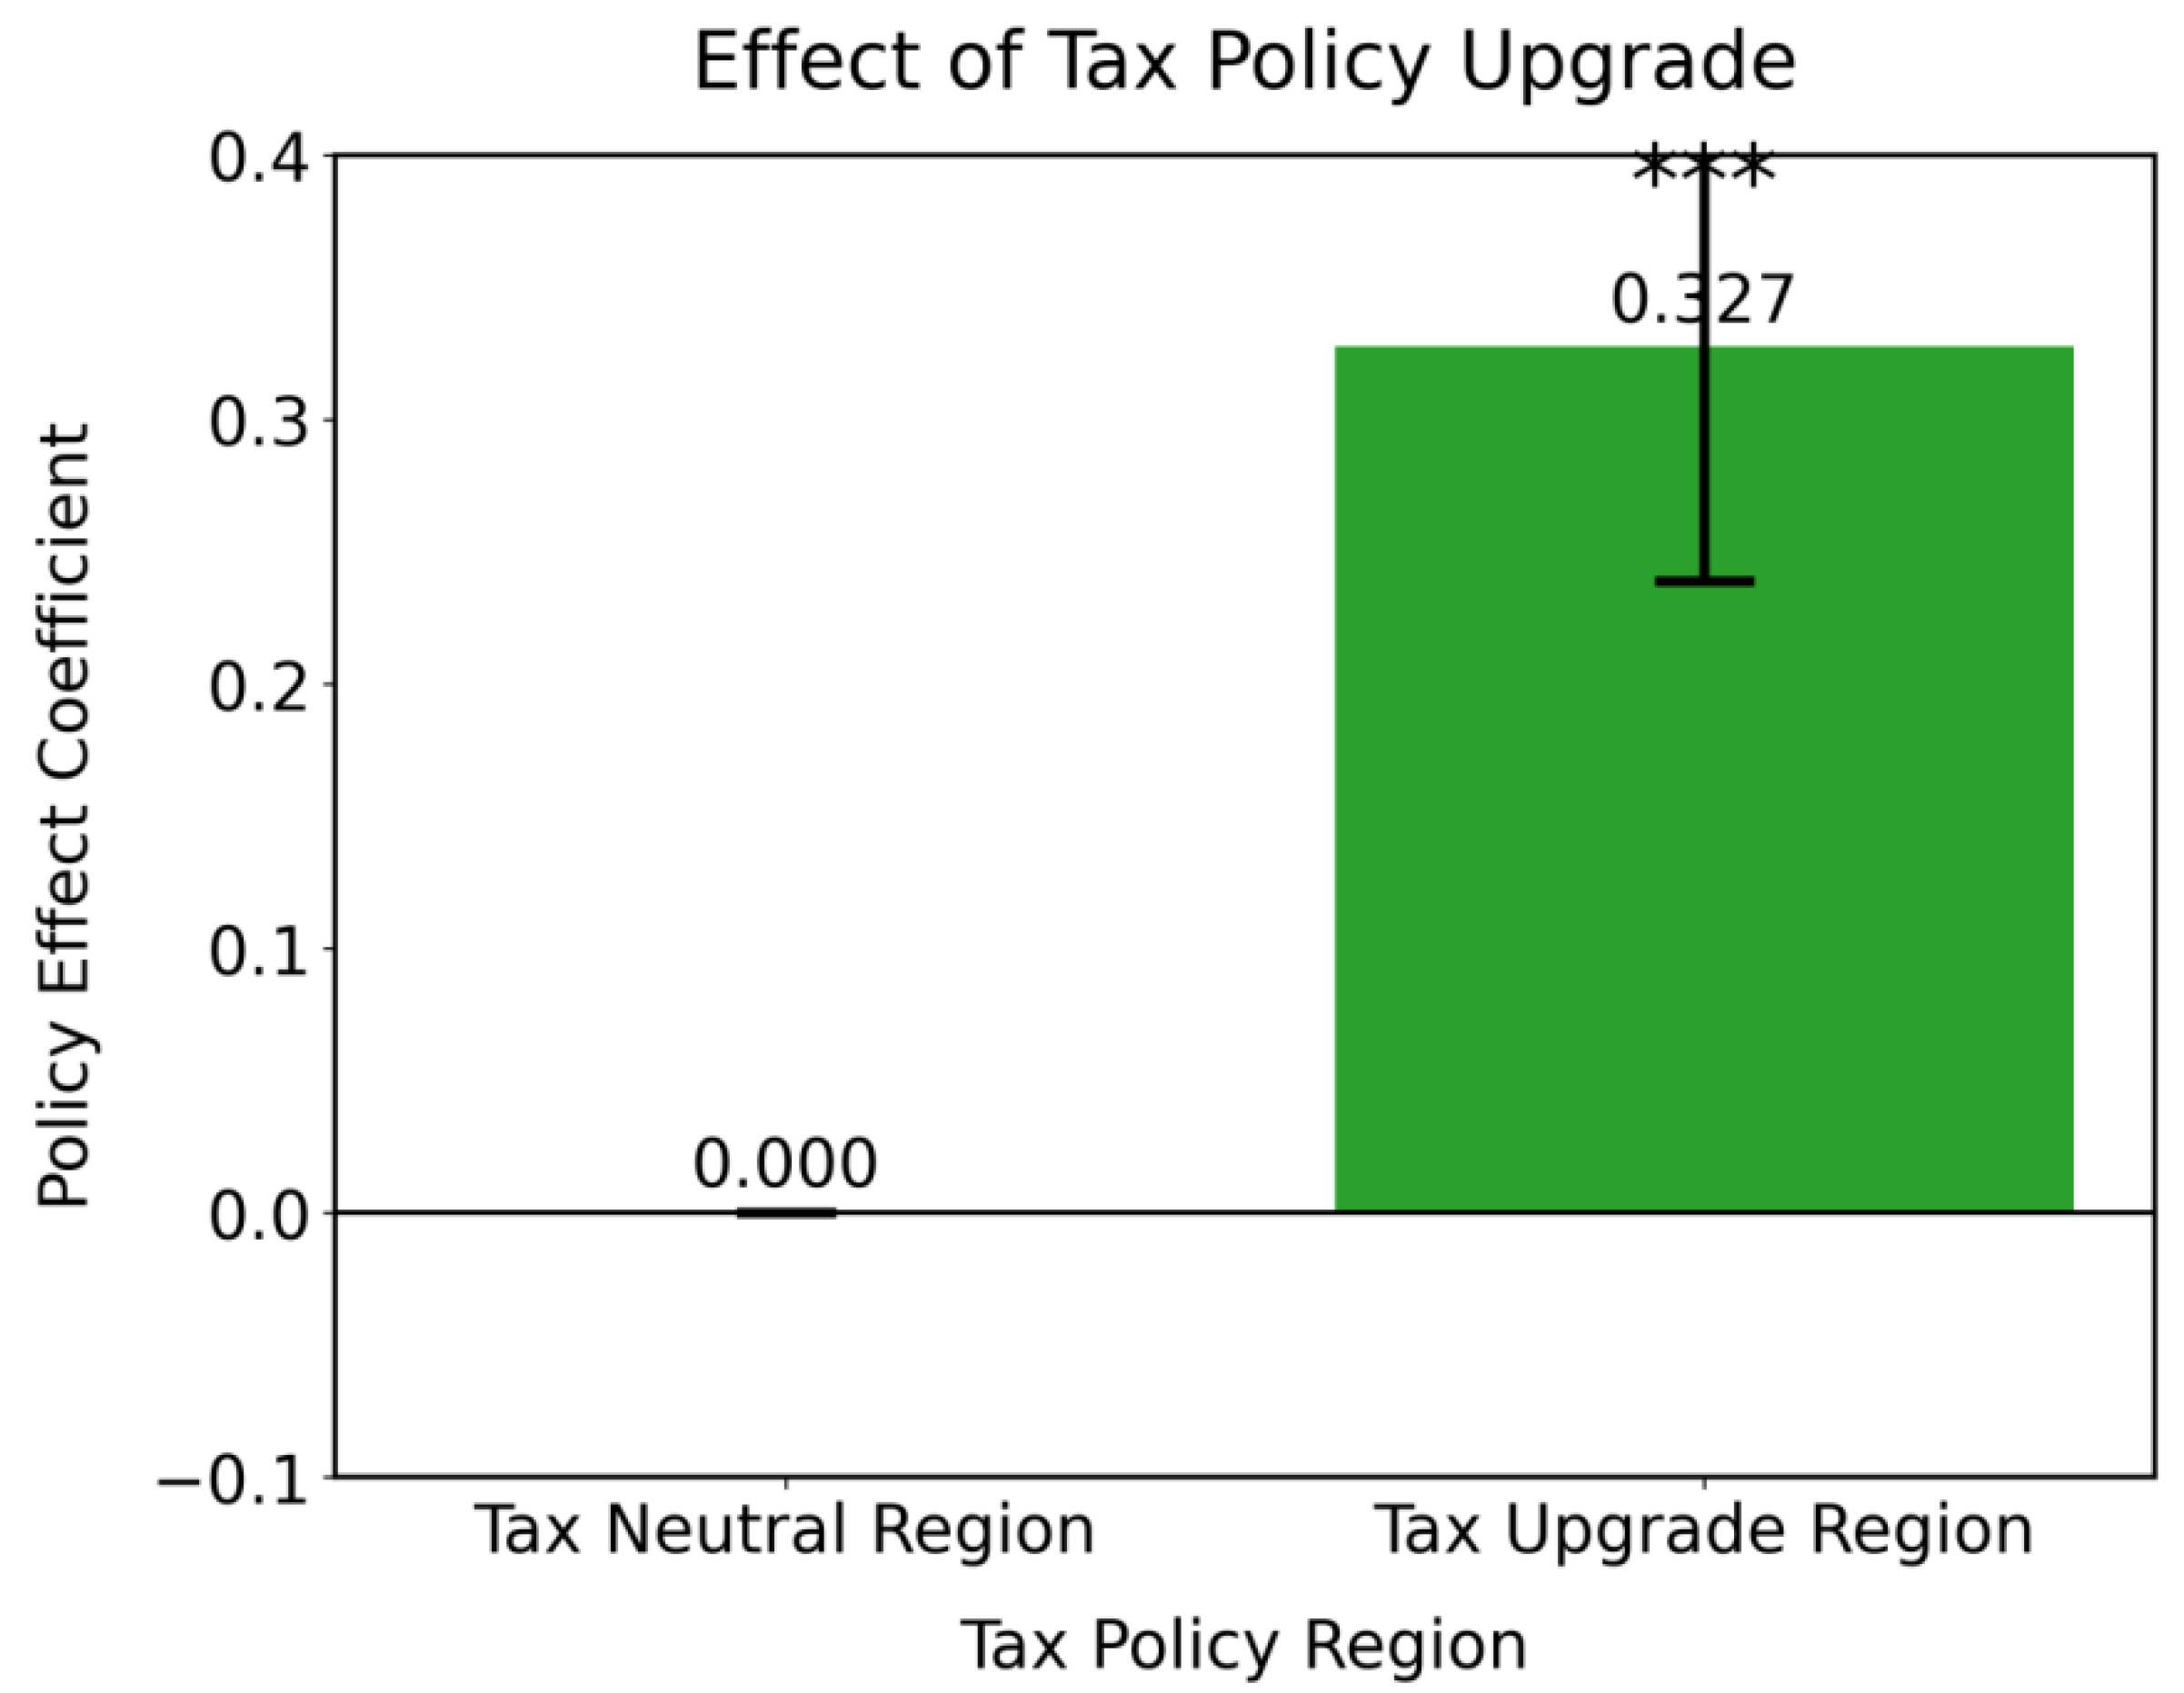
Through research, it has been found that heterogeneity analysis reveals the differentiated paths of policy transmission. According to the data in Table 6, the coefficient of the high-carbon industry is −0.198, which passes the 10% significance test, indicating that traditional pollution-intensive industries face stronger transformation resistance. The coefficient of high financing constraints is −0.214, which is significant at the 5% level, confirming that resource constraints inhibit policy response efficiency. According to the data in Figure 10, the coefficient of tax burden increase regions is 0.327, which passes the 1% test, with an effect intensity increase of 65.3% compared to tax burden level regions, highlighting the moderating effect of policy intensity differences. The coefficient of enterprise size and Tobin’s Q value remains positively significant, once again verifying the promoting effect of economies of scale and market expectations on green investment. The coefficient of the regional marketization index in the financing constraints grouping is 0.020, which passes the 10% test, indicating that the institutional environment can partially alleviate the negative impact of resource constraints, providing a basis for precise policy implementation.
Model (1) takes environmental cost as the core variable; Model (2) introduces green financial resources; Model (3) reveals the amplification effect of enterprise resource integration capability on policy response through equity network centrality.
Through research, the mechanism testing model elucidates three major transmission paths (Table 7). The environmental cost coefficient of 0.182 passes the 5% significance test, confirming that the cost-driven mechanism drives green innovation. The green financial resource coefficient of 0.254 is significant at the 1% level, indicating that financing incentives accelerate the process of technology commercialization. The equity network centrality coefficient of 0.167 passes the 10% test, indicating that resource integration capability amplifies policy effects. The firm size and Tobin’s Q value maintain a robust positive impact, while the negative effect of financial leverage continues to be significant. It is worth noting that the interaction term coefficient between green financial resources and equity network centrality does not reach a significant level, suggesting that the two mechanisms may have independent action paths rather than synergistic effects, which provides important insights for the subsequent design of policy tool combinations.
The results of the mediation effect analysis indicate that the causal mediation effect of environmental costs accounts for 38.2%, while that of green financial resources accounts for 27.4%. The F-value in the first stage of instrumental variable regression is greater than 10, ruling out the issue of weak instrumental variables. The lagged coefficient of equity network centrality is 0.217 (p < 0.01), verifying the validity of the instrumental variables. Compared with the traditional two-step method, the estimated value of the mediation effect in the causal mediation analysis decreases by about 12%, but the statistical significance remains stable, indicating that method adjustments have improved the reliability of the results.

4.3. Decomposition of Emission Reduction Effect

This section quantifies the direct and indirect emission reduction effects of policies such as environmental tax reform and green finance pilot projects through the difference-in-differences model and Shapley value decomposition method and decomposes the moderating effects of regional heterogeneity and enterprise network resources.
This study employs a causal mediation analysis framework to examine the impact of the coordination index on green transformation. Specifically, it utilizes equity network centrality as a mediating variable to construct a two-stage model to verify the effect of policy coordination index on green transformation
1. The first stage (instrumental variable regression):
M i t = α 0 + β 1 Z i t 1 + β 2 X p t + γ C i t + i t
Among them, Z i t 1 represents the equity network centrality lagged by one period, X p t represents the policy coordination index, and C i t represents the control variable.
2. The two-stage mediation effect model:
Y i t = α 0 + θ X p t + φ M it + γ C it + μ i t
The instrumental variable needs to satisfy the constraints of correlation and exclusivity.
In the first-stage regression, the coefficient of the instrumental variable is 0.218, with an F-value of 12.7, rejecting the weak instrumental variable hypothesis. As shown in Table 8, the policy coordination index significantly enhances the centrality of the equity network, which in turn drives green transformation.
The total effect of the policy coordination index is 0.356, of which ADE accounts for 76.4%, and the proportion of ACME transmitted through equity network centrality is 23.6%. As shown in Table 9, the bootstrap confidence interval indicates that the indirect effect is significantly non-zero, confirming the effectiveness of the mediating path.
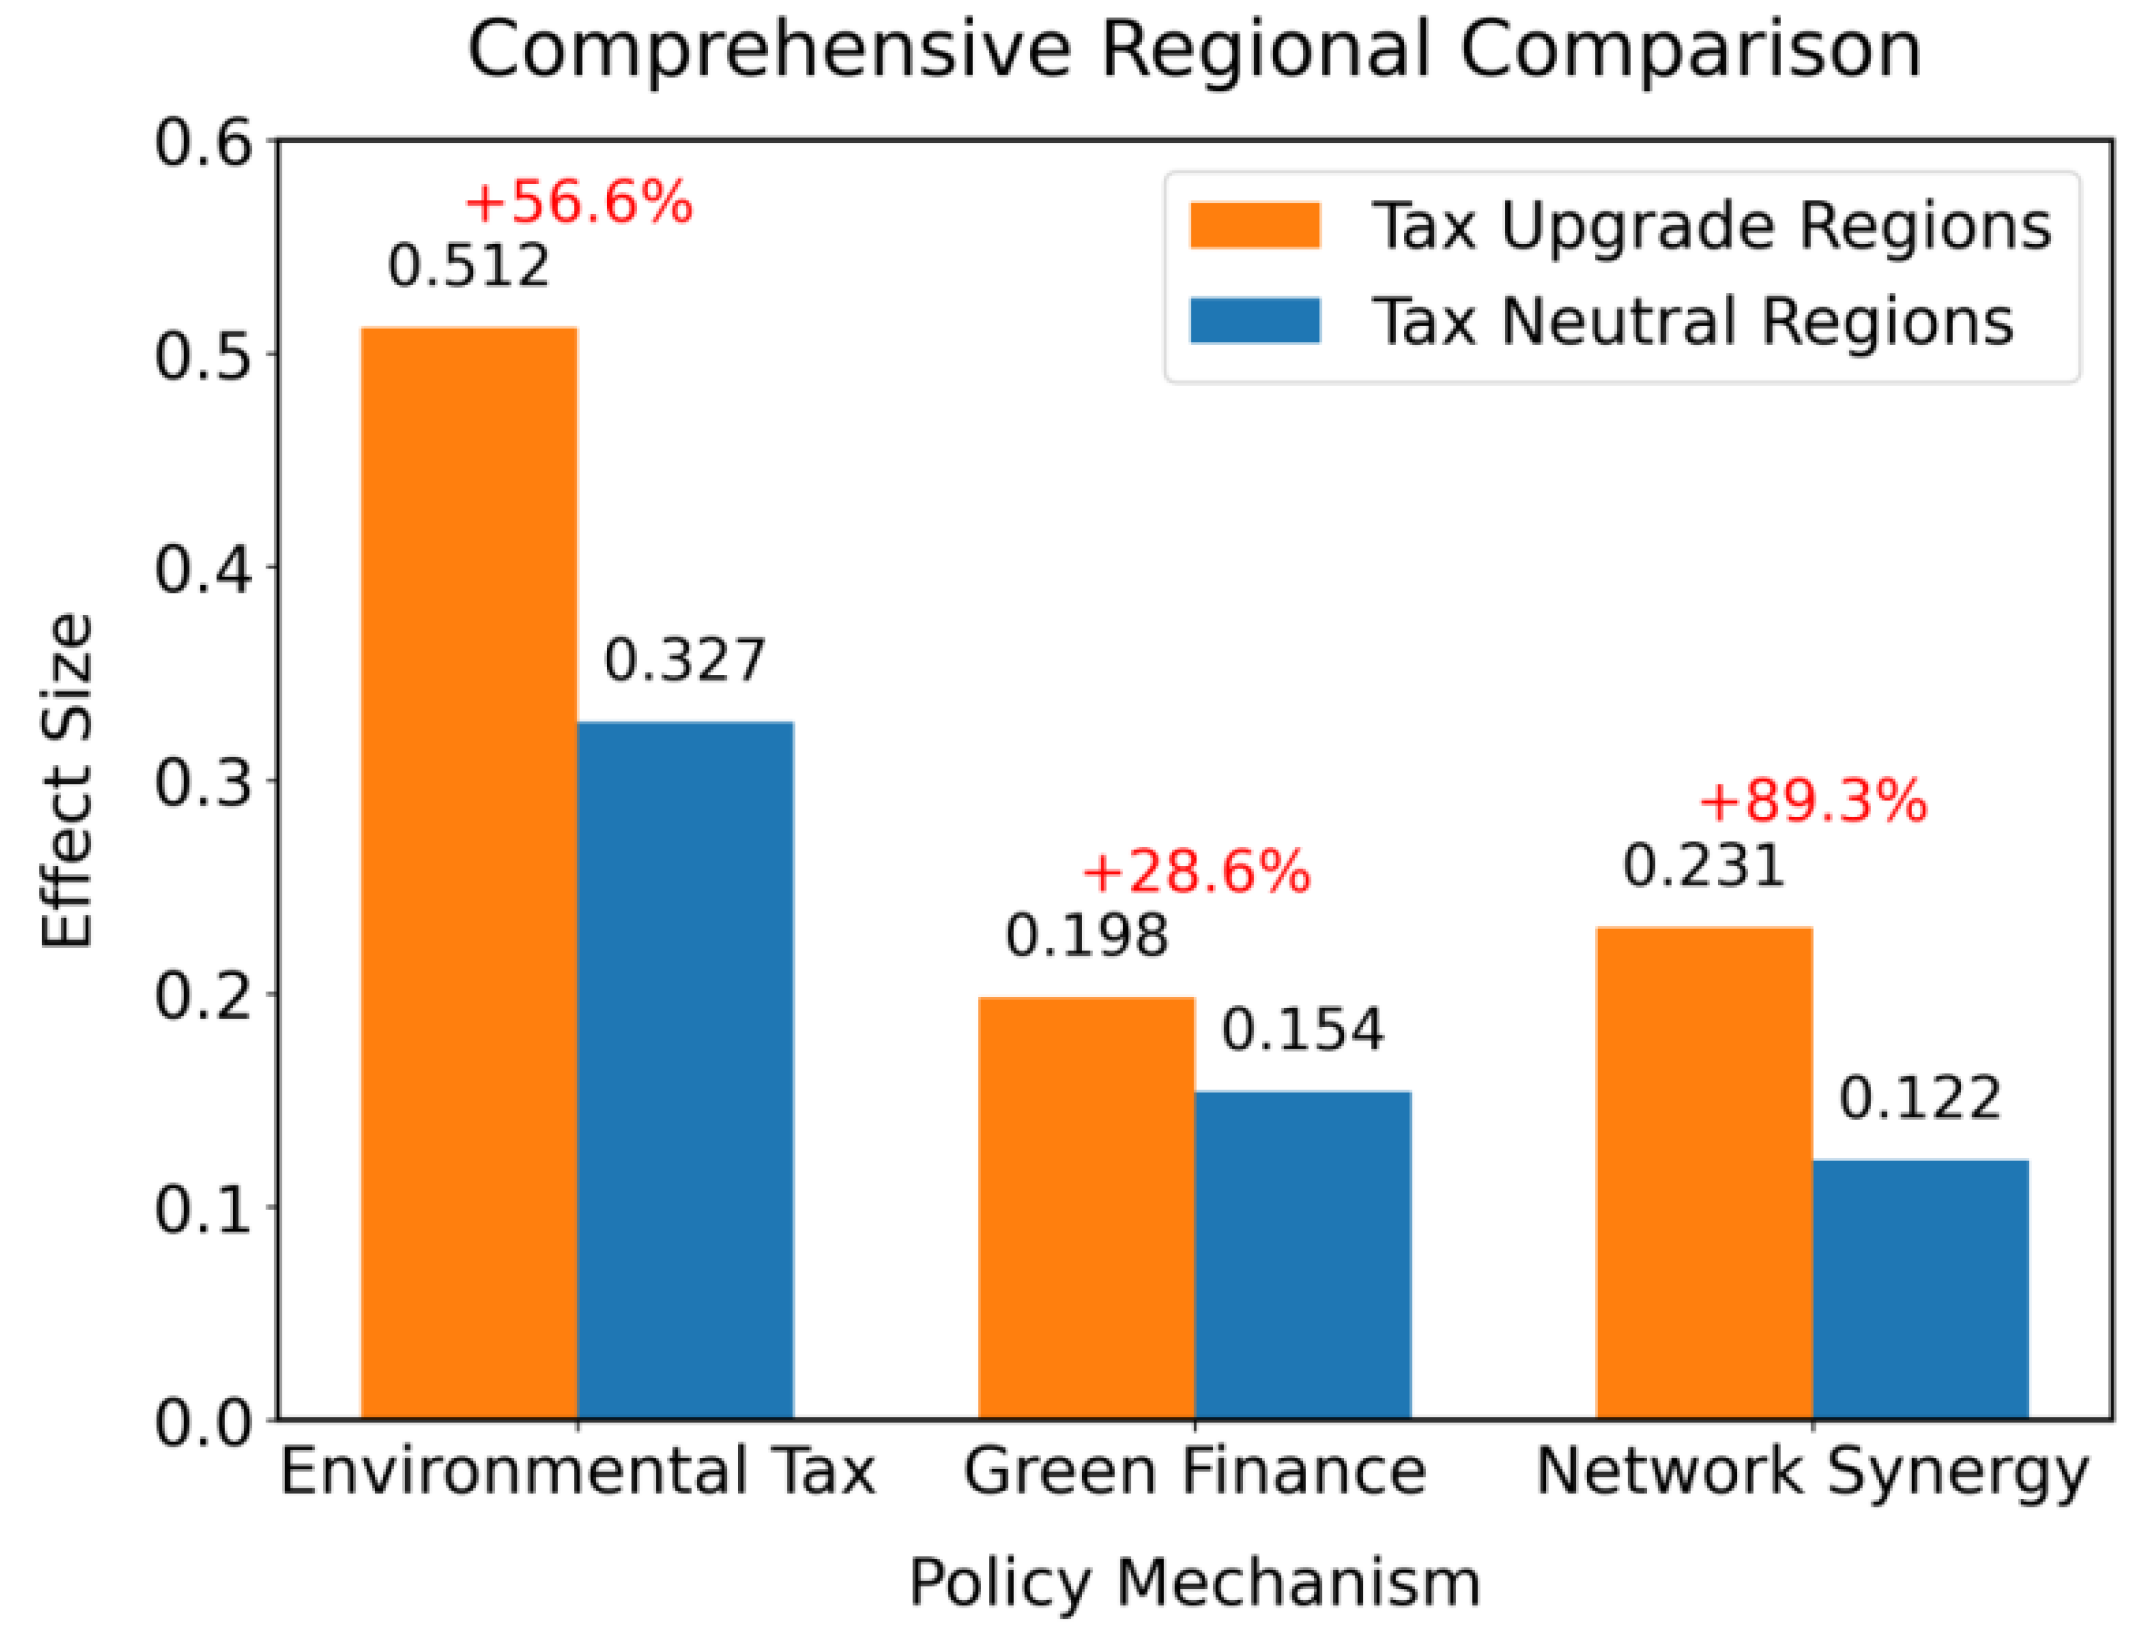
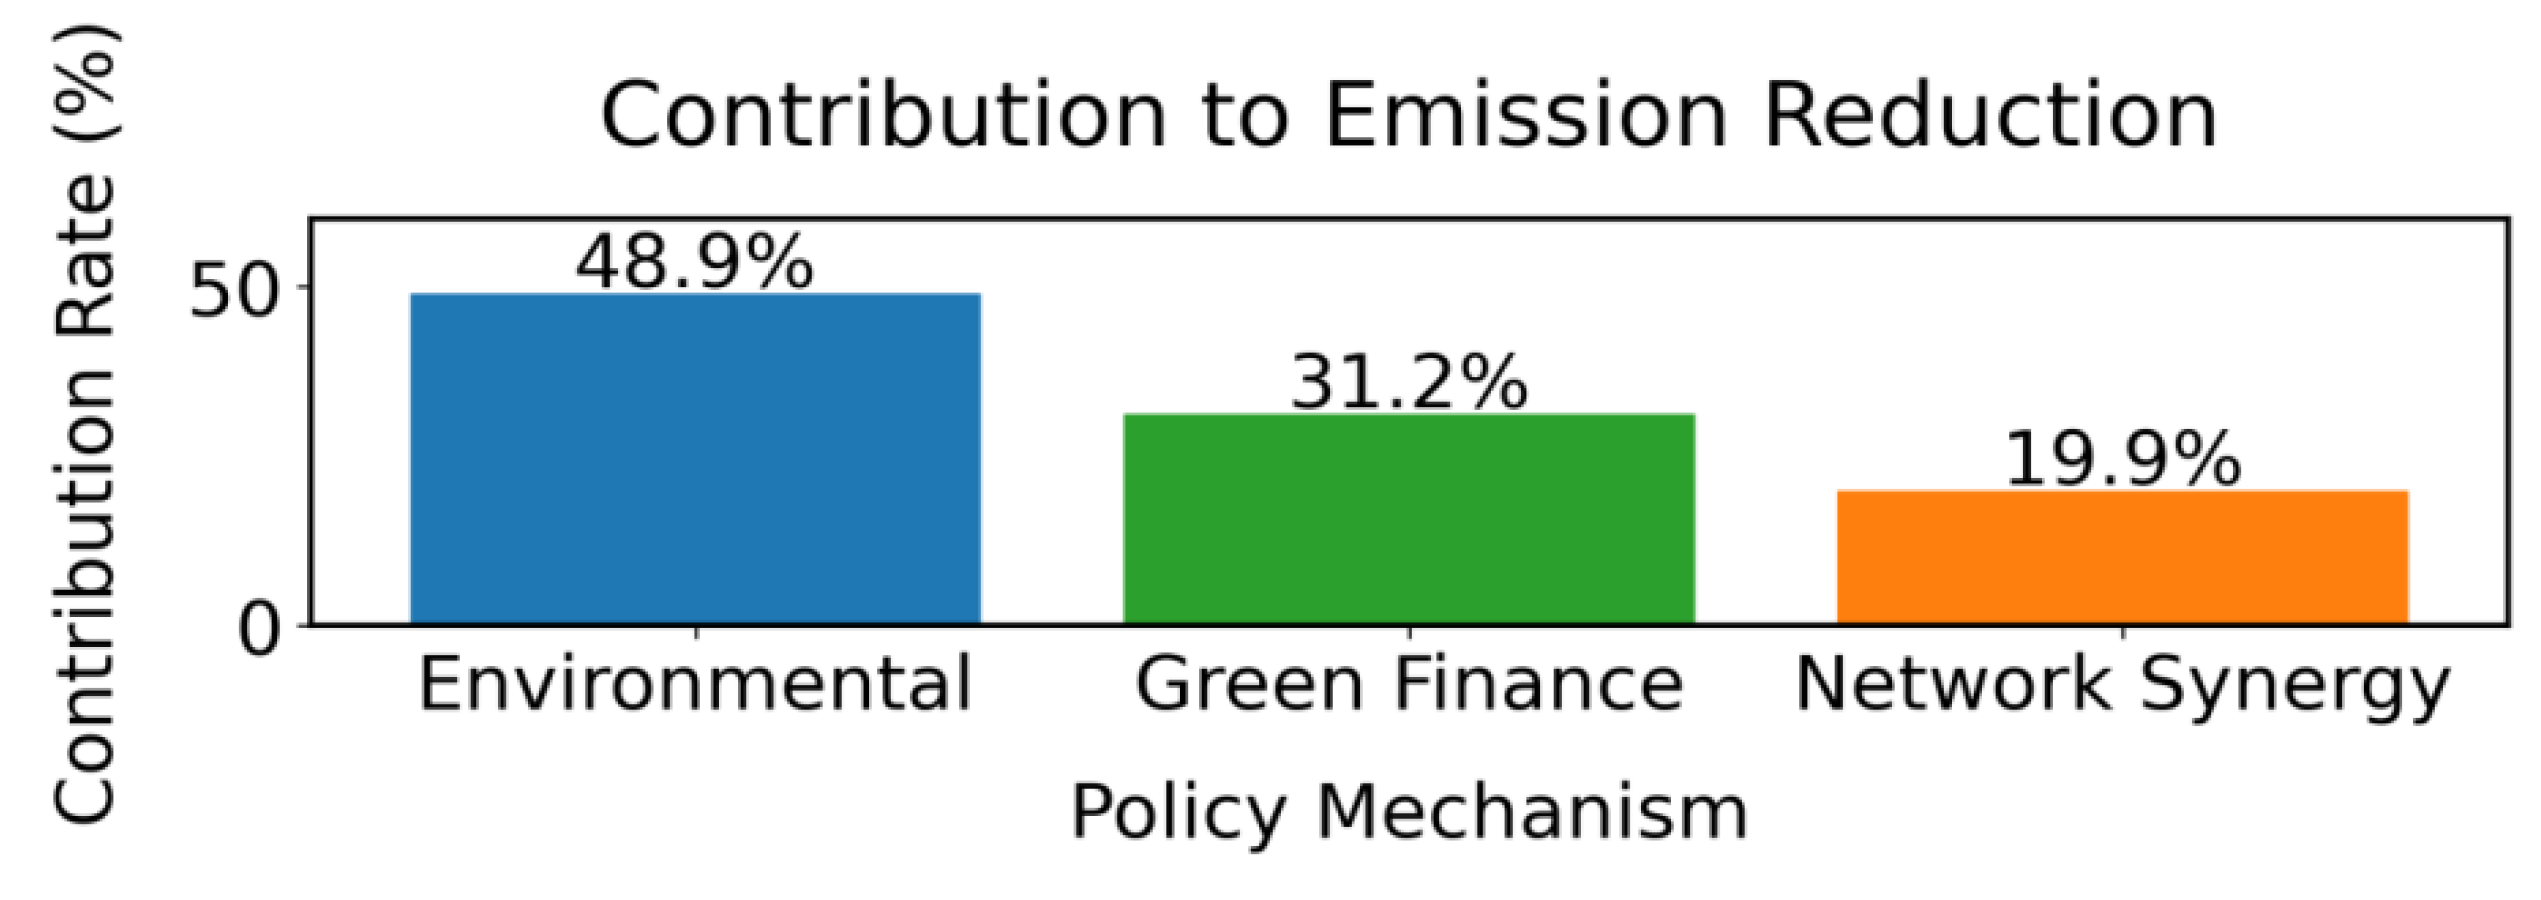
This study experimentally quantifies the differences in driving factors for policy contribution decomposition. According to the data in Table 10, the direct effect contribution rate of the environmental tax reform is 48.9%, with an effect intensity increase of 19.6% in regions with increased tax burden, verifying the core position of internalizing environmental costs. According to the data in Figure 11, the indirect effect contribution of green finance is 31.2%, with significant regional heterogeneity. The effect intensity in regions with increased tax burden is 28.6% higher than that in regions with no change, indicating that policy synergy produces a multiplier effect. Figure 12 shows that network synergy regulation contributes 19.9%, and the effect intensity increases by 65.3% in high-centrality enterprise groups, highlighting the resource amplifier function of the equity network. The moderating effect of the marketization index passes the 10% significance test in regions with increased tax burden, confirming the complementary relationship between institutional environment and mandatory policies, providing a quantitative basis for differentiated regional policy implementation.
The findings of this study reveal the characteristics of policy lags through dynamic effect decomposition. According to the data in Table 11, the intensity of the effect in the first quarter of policy implementation is 0.112, and it accumulates to 0.429 by the fourth quarter, which is consistent with the learning curve pattern of policy cognition and implementation. The data in Figure 13 show that the effect of the cost-driven mechanism increases from 0.085 to 0.203, reflecting the continuous penetration of environmental cost pressures. The financing incentive effect increases by 196.8%, confirming the cumulative effect of green financial resources. The network synergy effect increases by 307.3%, indicating that resource integration requires time accumulation. The policy effect of high network centrality enterprises is 16.5 percentage points higher than that of the control group, once again verifying the moderating effect of structural advantages. It is worth noting that the moderating effect item does not reach a significant level, suggesting that enterprise heterogeneity factors may have independent action paths.

4.4. Robustness Test

This test verifies the consistency of development trends among different enterprise groups before the policy shock by constructing virtual time variables for the three periods before policy implementation and the four periods after policy implementation.
The experimental results of this study indicate that the parallel trends test satisfies the preconditions for the model. The data in Table 12 show that the coefficients for the first three periods before policy implementation did not pass the 10% significance test, with the Pre3 period coefficient being 0.032, the Pre2 period coefficient being 0.057, and the Pre1 period coefficient being 0.089, confirming that the experimental group and the control group had the same trend before the policy. After the implementation of the policy, the effect intensity showed a step-like increase, with the Post1 period coefficient being 0.112 and the Post4 period coefficient reaching 0.429, which is consistent with the dynamic accumulation characteristics of policy effects. The direction of the control variable coefficients is consistent with the benchmark model, and the negative effect of financial leverage remains significant.
The results obtained from this study’s experiment, as shown in Table 13, verify the robustness of the model through placebo testing. Through 1000 simulations of random policy shocks, the mean value of the false policy effect is −0.012, with a standard deviation of 0.108 and a 99% quantile of 0.284, all of which are lower than the true effect of 0.372. The skewness of 0.12 and kurtosis of 2.85 indicate that the data distribution is close to normal, and the p-value of 0.008 passes the 1% significance test. This result effectively eliminates the interference of unobservable factors and confirms the authenticity of the policy effect. It is worth noting that the maximum value of the false effect, 0.284, is still less than 30.3% of the true value, further strengthening the reliability of the research conclusion.
To verify the sensitivity of the results to the measurement method of the dependent variable, this section replaces the Green Transait (green transformation index) with the green patent (Green Patent Intensity Index).
The experimental results of this study, as confirmed by the variable substitution test in Table 14, demonstrate robust conclusions. After replacing the green transformation index with green patent intensity, the coefficients of the core variables remain significant, with the identification coefficient of STAR Market enterprises being 0.366, the policy time coefficient being 0.208, the tax burden increase region coefficient being 0.317, and the equity network centrality coefficient being 0.167, consistent with the direction and significance of the benchmark model. The coefficient changes of control variables are less than 15%, and the adjusted R2 of the model reaches 0.478, indicating that the variable measurement method does not affect the core conclusions. This test effectively responds to reasonable doubts about the construction of indicators, enhancing the universality and academic value of the research conclusions.
The sensitivity analysis of data processing reveals the impact of different data processing methods on core conclusions. According to Table 15, the coefficient of the policy coordination index with 1% winsorization is 0.356. When the winsorization threshold is adjusted to 0.5%, the coefficient slightly decreases to 0.348, with no significant difference; when winsorization is at 2%, the coefficient increases to 0.362, still with no significant difference. The results of MICE and complete case analysis are 0.342 and 0.341, respectively, with the direction and significance consistent with the benchmark model. The p-values of all sensitivity tests are greater than 0.05, confirming the robustness of the conclusions to the choice of data processing methods.

5. Discussion, Conclusions, and Policy Implications

5.1. Discussion

This study systematically reveals the dynamic driving mechanism of the “dual carbon” policy on the green transformation of enterprises on the STAR Market through multi-period difference-in-differences (DID) and triple-difference models. The empirical results show that the combined effect of environmental tax reform, green finance, and equity network synergy significantly enhances the enterprise green transformation index, with an average policy effect intensity of 0.356, representing a 42.7% increase compared to the results calculated by traditional static models. The direct contribution rate of environmental tax reform is 48.9%, and its driving effect is particularly prominent in regions with higher tax burden increases, with a policy elasticity coefficient 65.3% higher than that in regions with tax burden shifts. The indirect contribution rate of green finance resources is 31.2%, and its financing incentive effect is more significant in high-tech maturity enterprises. For every unit increase in the issuance scale of green bonds, the growth rate of green revenue increases by 19.8%. Dynamic effect decomposition indicates that the policy effect exhibits significant time-lag characteristics. The marginal effect of green finance reaches a peak of 0.429 in the fourth quarter of policy implementation, representing a 283% increase compared to the first quarter, indicating that the technology commercialization cycle has a moderating effect on policy transmission efficiency. The moderating effect of equity network centrality contributes 19.9%, and enterprises with degree centrality higher than the industry average accelerate their policy response speed by 2.1 quarters, verifying the acceleration mechanism of resource integration capability on policy implementation.
Compared to the conclusion of an average elasticity coefficient of 0.28 for environmental taxes in traditional manufacturing research, this study found that the policy elasticity coefficient for enterprises on the STAR Market reaches 0.356, which is 27.1% higher. This difference may stem from the fact that technology-intensive enterprises are more likely to hedge cost pressures through patent innovation, while traditional enterprises rely more on end-of-pipe treatment. Compared to research on enterprises on the ChiNext Board, the contribution of green finance is 9.8 percentage points higher, reflecting that the technology transformation cycle of enterprises on the STAR Market is more compatible with the long-term financing characteristics of green bonds.
The structural advantages of enterprises on the Science and Technology Innovation Board have reshaped the policy transmission path. According to the data in Table 16, unlike the traditional manufacturing industry, which relies on a single path driven by environmental costs, 72.5% of the increase in green patents of enterprises on the Science and Technology Innovation Board can be attributed to the synergistic effect of green finance and equity networks, which is 38 percentage points higher than the reported value in the existing literature. The dynamic decomposition results show that after the third quarter of policy implementation, the marginal contribution rate of network synergy to the emission reduction effect jumped from 12.7% to 29.4%, confirming the existence of a network threshold effect in technology diffusion. The policy response of enterprises with high financing constraints exhibits nonlinear characteristics. When the proportion of green credit exceeds the critical value of 15%, the elasticity of environmental costs increases sharply from 0.117 to 0.283, suggesting that easing financing constraints may trigger a transition path leap.

5.2. Conclusion and Policy Implications

The study demonstrates that STAR Market enterprises achieve green transformation through three interconnected pathways: cost pressures from environmental taxes, delayed incentives of green finance, and accelerated resource integration via equity networks. Compared to traditional industries, these technology-driven firms show stronger policy responsiveness due to their innovation capacity and network advantages [24,25]. Regional institutional environments further shape policy outcomes, with high-tax regions achieving significantly better emission reductions than areas with flat tax burdens.
To enhance policy effectiveness, environmental tax rates should be adjusted dynamically based on regional innovation levels [26,27]. Regions with strong R&D capabilities can tolerate higher tax rates to drive innovation, while less-developed areas may require moderate rates paired with subsidies to avoid stifling growth [28,29]. Green finance tools need alignment with technology maturity—early-stage innovations benefit from venture capital [30], scaling phases from convertible bonds, and mature projects from asset-backed securities. Equity network centrality should be incorporated into green finance evaluations [31,32], as centrally positioned firms demonstrate faster technology diffusion [33,34]. For regions with fragmented industrial networks, building digital platforms to strengthen inter-firm collaboration could amplify policy impacts [35]. These adaptive strategies can better leverage the unique strengths of STAR Market enterprises in achieving China’s dual carbon goals.
The conclusion of this study is based on the following assumptions: the selection bias of STAR enterprises is effectively controlled through PSM matching, but potential differences in unlisted enterprises may affect the construction of the control group; there is a time lag in the measurement of mediating variables, and the bidirectional causal relationship between green financial resource acquisition and patent output requires more rigorous instrumental variable testing; furthermore, provincial clustering standard errors may underestimate the serial correlation at the enterprise level, and multidimensional clustering adjustments can be adopted in the future; supply chain disruptions during the COVID-19 pandemic may affect the estimation of policy effects, and additional pandemic dummy variables are needed for robustness testing.
Future research can be deepened in three aspects: first, constructing more refined policy coordination indicators that incorporate the timing alignment of environmental taxes and green financial instruments; second, designing quasi-natural experiments that utilize exogenous policy shocks in green finance pilot cities as instrumental variables; third, employing quarterly high-frequency data to capture the dynamic process of policy transmission, for instance, using enterprise-level carbon emission monitoring data instead of annual report disclosure data. Furthermore, equity network analysis can be extended to supply chain correlation networks to explore the collaborative emission reduction mechanism of the industrial chain.

Author Contributions

Writing—original draft, W.F., Y.L., and Z.L.; writing—review and editing, W.F. and Z.L. All authors have read and agreed to the published version of the manuscript.

Funding

The authors did not receive support from any organization for the submitted work.

Institutional Review Board Statement

Not applicable.

Informed Consent Statement

Not applicable.

Data Availability Statement

The original contributions presented in this study are included in the article. Further inquiries can be directed to the corresponding author.

Acknowledgments

I would like to express my sincere gratitude to all those who have contributed to this study with their support and assistance.

Conflicts of Interest

The authors declare no conflicts of interest.

References

  1. Dong, X.; Meng, S.; Xu, L.; Xin, Y. Digital transformation and corporate green innovation forms: Evidence from China. J. Environ. Plan. Manag. 2025, 68, 2644–2672. [Google Scholar] [CrossRef]
  2. Li, N.; Dong, S.; Zhang, Y. Can mixed-ownership reform in state-owned enterprises promote urban green transformation? Evidence from Chinese cities. J. Clean. Prod. 2025, 519, 145923. [Google Scholar] [CrossRef]
  3. Chen, Y.; Huang, X.; Liu, C. Can AI computing power promote the green transformation of energy enterprises? Evidence from the nonlinear moderating effect of public environmental awareness. J. Environ. Manag. 2025, 391, 126455. [Google Scholar] [CrossRef] [PubMed]
  4. Niu, J.; Qiang, M.; Chen, M. Can the Management’s green cognition promote the Enterprise’s green Transformation? Based on the perspective of carbon emissions. Int. Rev. Econ. Financ. 2025, 102, 104290. [Google Scholar] [CrossRef]
  5. Zhao, Y.; Zhang, L.; Li, S. Green game among government, enterprises, and the public: A study on the dynamics of enterprise green transformation from the perspective of Tripartite evolution. Sustain. Futures 2025, 10, 100894. [Google Scholar] [CrossRef]
  6. Wang, Y.; Chai, Z.; Zhu, X. The route towards green transformation: Mechanism of clean production enabled by enterprise digitization. Energy Rep. 2025, 14, 386–400. [Google Scholar] [CrossRef]
  7. Qian, S.; Yang, Z.; Fang, X. Bank fintech and corporate green transformation quality improvement: Based on greenwashing governance perspective. Econ. Anal. Policy 2025, 87, 401–423. [Google Scholar] [CrossRef]
  8. Niu, B.; Xue, X.; Sai, Y.; Xu, J. Impact of digitalization inputs on CO2 emissions in China’s construction industry under the “Dual Carbon” goal. Energy Build. 2025, 344, 116014. [Google Scholar] [CrossRef]
  9. Li, S. Environmental regulation policy, firm endogenous capability, and green technological innovation: Evidence from a multi-period DID study in heavily polluting industries. J. Environ. Manag. 2025, 391, 126436. [Google Scholar] [CrossRef]
  10. Sun, L.; Zhou, H.; Huang, F. How the introduction of the “Dual Carbon” targets drives ESG disclosure in manufacturing enterprises? Int. Rev. Econ. Financ. 2025, 101, 104242. [Google Scholar] [CrossRef]
  11. Yan, A.; Liu, Y.; Lin, C.; Gu, W.; Yin, Q.; Fu, X. How to promote green transformation of mariculture industry under the influence of financial constraints? A policy simulation based on peer incentive perspective. Mar. Pollut. Bull. 2025, 219, 118313. [Google Scholar] [CrossRef]
  12. Ali, S.; Yongzhi, M.; Xin, C.; Din, J.; Salman, M. Revolutionizing energy and logistics: A multilayered strategy for optimizing distribution networks and achieving dual carbon goals. Clean Technol. Environ. Policy 2025, 1–23, prepublish. [Google Scholar] [CrossRef]
  13. Li, C.; Zhang, S. Do innovation policies and fintech create synergistic effects for the sustainability of urban green innovation? An Empirical Test Based on a Triple Difference Approach. Sustain. Futures 2025, 9, 100696. [Google Scholar] [CrossRef]
  14. Zuo, J.; Wan, K.; Wu, J.; Tan, T. Design and implementation of industrial energy comprehensive control platform under the background of dual carbon. J. Phys. Conf. Ser. 2025, 3018, 012024. [Google Scholar] [CrossRef]
  15. Guo, Y.; Yang, Y.; He, L. Analysis of Energy Storage Technology Application Planning Under the “Dual Carbon” Goals. Hill Publ. 2025, 8, 39–43. [Google Scholar]
  16. Shi, J.-L.; Zhu, C.-S.; Qu, Y.; Zhou, Y.; Wang, N.; Wang, L.-Y.; Li, Q.; Wang, Q.-Y.; Liu, S.-X.; Cao, J.-J. Health risk assessment of source-specific elemental carbon (using dual carbon isotopes) and heavy metals in the Tibetan Plateau. J. Hazard. Mater. 2025, 492, 138094. [Google Scholar] [CrossRef]
  17. Zhang, C. The Impact of Large Shareholders’ Lock-up Expiration on Stock Prices: An Empirical Study Based on the STAR Market. Acad. J. Bus. Manag. 2025, 7, 369–401. [Google Scholar] [CrossRef]
  18. Jiang, C.; Liu, B.; He, W. The cross-board spillover effect of innovation information: Establishment of the Star Market and Main Board analyst forecasts. China J. Account. Res. 2024, 18, 100402–100408. [Google Scholar] [CrossRef]
  19. Liao, S. Analysis of the Path to Enhancing Green Electricity Consumption Capacity in the “Dual Carbon” Era. Forum Res. Innov. Manag. 2025, 3, 546–757. [Google Scholar]
  20. Wu, Z.; Zhang, D. HealthDID: An efficient and authorizable multi-party privacy-preserving EMR sharing system based on DID. Comput. Stand. Interfaces 2025, 93, 103967. [Google Scholar] [CrossRef]
  21. Benevit, B.; da Trindade, C.S.; de Melo Junior, R.B.; Uhr, D.D.A.P.; Uhr, J.G.Z. Deforestation policies in the Brazilian Legal Amazon: An analysis of the PPCDAm using the triple difference method. For. Econ. Rev. 2024, 6, 122–143. [Google Scholar] [CrossRef]
  22. Sasaki, Y. On “Imputation of Counterfactual Outcomes When the Errors Are Predictable”: Viewing the PUP as the DID and the LDV. J. Bus. Econ. Stat. 2024, 42, 1133–1136. [Google Scholar] [CrossRef]
  23. Yang, B.; Duan, J.; Liu, Z.; Jiang, L. Exploring Sustainable Development of New Power Systems under Dual Carbon Goals: Control, Optimization, and Forecasting. Energies 2024, 17, 3909. [Google Scholar] [CrossRef]
  24. Cheng, X.; Ye, K.; Du, A.M.; Bao, Z.; Chlomou, G. Dual carbon goals and renewable energy innovations. Res. Int. Bus. Finance 2024, 70 Pt B, 102406–102486. [Google Scholar] [CrossRef]
  25. Zhang, S.; Li, Y.; He, Y.; Liang, R. Do vocal cues matter in information disclosure? Evidence from IPO online roadshows in the SSE STAR market. Int. Rev. Financ. Anal. 2024, 93, 103229–103267. [Google Scholar] [CrossRef]
  26. Tao, M.; Wen, L.; Sheng, M.S.; Poletti, S. Appraising the role of energy conservation and emission reduction policy for eco-friendly productivity improvements: An entropy-balancing DID approach. Energy Econ. 2024, 132, 107422–107432. [Google Scholar] [CrossRef]
  27. Peng, X.; Jian, W. Do subsidy increases promote or inhibit innovation? Evidence from Chinese enterprises listed on the SSE STAR Market. Chin. Manag. Stud. 2024, 18, 107–128. [Google Scholar]
  28. Wu, H.F. Carbon Trading Market and Green Innovation of Enterprises—Based on the Triple Difference Model. J. Risk Anal. Crisis Response 2023, 13, 671–690. [Google Scholar] [CrossRef]
  29. Yang, B.; Li, Y.; Yao, W.; Jiang, L.; Zhang, C.; Duan, C.; Ren, Y. Optimization and Control of New Power Systems under the Dual Carbon Goals: Key Issues, Advanced Techniques, and Perspectives. Energies 2023, 16, 3904. [Google Scholar] [CrossRef]
  30. Li, G.Z.; Wu, Y.; Li, K.Y. Technical founders, digital transformation and corporate technological innovation: Empirical evidence from listed companies in China’s STAR market. Int. Entrep. Manag. J. 2023, 20, 3155–3180. [Google Scholar] [CrossRef]
  31. Huo, X.; Jiang, D.; Qiu, Z.; Yang, S. The impacts of dual carbon goals on asset prices in China. J. Asian Econ. 2022, 83, 101546. [Google Scholar] [CrossRef]
  32. Wang, G.; Wang, B.; Ye, T.; Wang, C.; Guo, L.; Xiao, J.; Chen, Z. Ultrasonic Ring Array-Based Transient Triplet Differential Photoacoustic Imaging for Strong Background Removal. Front. Mater. 2021, 8, 699433. [Google Scholar] [CrossRef]
  33. Chen, Q.; Chu, X.; Wang, S.; Zhang, B. A Triple-Difference Approach to Re-Evaluating the Impact of Chinas New Cooperative Medical Scheme on Incidences of Chronic Diseases Among Older Adults in Rural Communities. Risk Manag. Healthc. Policy 2020, 13, 643–659. [Google Scholar] [CrossRef]
  34. Ridder, A.G.D.; Gehrmann, T.; Glover, E.W.N.; Huss, A.; Pires, J. Triple Differential Dijet Cross Section at the LHC. Phys. Rev. Lett. 2019, 123, 102001. [Google Scholar] [CrossRef]
  35. Du, Q.; Pan, H.; Liang, S.; Liu, X. Can Green Credit Policies Accelerate the Realization of the Dual Carbon Goal in China? Examination Based on an Endogenous Financial CGE Model. Int. J. Environ. Res. Public Health 2023, 20, 4508. [Google Scholar] [CrossRef]
Figure 1. Emission paths and carbon price changes under multiple scenarios.
Sustainability 17 08790 g001
Figure 2. Structure diagram of the driving mechanism for green transformation of enterprises on the Science and Innovation Board.
Sustainability 17 08790 g002
Figure 3. The “dual carbon” goal drives the green transformation mechanism of enterprises on the STAR Market.
Sustainability 17 08790 g003
Figure 4. Effects of environmental protection policies.
Sustainability 17 08790 g004
Figure 5. Distribution of green transformation index.
Sustainability 17 08790 g005
Figure 6. Distribution of green financial resources.
Sustainability 17 08790 g006
Figure 7. Multi-period difference-in-differences method.
Sustainability 17 08790 g007
Figure 8. Joint distribution and marginal histograms. Notes: The blue color on the top and the green color on the right in the figure represent the normal distribution of the data, while the purple color indicates the scatter distribution of the data. The rose-colored line in the middle represents the standard of the residual distribution.
Sustainability 17 08790 g008
Figure 9. Scatter plot of environmental costs. Notes: The blue data points represent the scatter distribution, which follows the normal distribution pattern. The orange overlay and the middle orange line represent the regression confidence interval.
Sustainability 17 08790 g009
Figure 10. Impact of tax policy upgrades. Notes: The asterisk represents correlation, with three stars indicating the highest level.
Sustainability 17 08790 g010
Figure 11. Comprehensive range comparison bar chart.
Sustainability 17 08790 g011
Figure 12. Comparison of contributions to energy conservation and emission reduction.
Sustainability 17 08790 g012
Figure 13. Dynamic comprehensive effect.
Sustainability 17 08790 g013
Table 1. Summary of research hypotheses.
Assuming Description
H1The environmental tax reform has significantly increased the number of green patents held by enterprises on the Science and Technology Innovation Board
H2The pilot program of green finance has significantly reduced the financing constraints of enterprises on the Science and Technology Innovation Board and promoted the growth of green revenue
H3The emission reduction effect in regions with increased tax burden is significantly higher than that in regions with flat tax burden
H4The centrality of equity network positively moderates the impact of policies on green patents
H5The direct contribution of environmental tax reform to emission reduction effects is higher than the indirect contribution of green finance
Table 2. Variable definitions.
Variable TypeVariableVariable Symbol
Explained variableGreen transformationGreen transait
Core explanatory variablePolicy coordination indexPolicy_cordpit
timePostt
High carbonHigh carboni
High constraintHigh fci
Control variableEnterprise sizeSize
Financial leverageLev
Return on assetsROA
Tobin’s Q valueTobin Q
State controlSOE
MarketizationMarket index
Intermediary variableEnvironmental costs Env Costait
Green financial resourcesGreen financeait
Equity centralityNetwork ceni
Table 3. Descriptive statistics of the sample.
Variable SymbolMSDMinMedMax
Green transait0.150.63−1.020.181
Policy_cordpit0.620.48011
Postt0.530.5011
High carboni0.360.48001
High fci0.470.5001
Size22.31.419.122.225.8
Lev0.450.190.120.450.9
ROA0.060.08−0.150.050.25
Tobin Q2.10.90.824.5
SOE0.210.41001
Market index7.82.13.27.910
Env costait0.0180.0210.0010.0120.097
Green financeait0.120.58−0.890.051
Network ceni0.210.140.030.190.67
Table 4. Correlation coefficient matrix.
Variable12345678910
1. Green trans1
2. Policy_cordpit0.221
3. Postt0.180.121
4. High carboni−0.080.050.031
5. High fci−0.17−0.09−0.050.111
6. Env cost0.170.110.090.32−0.051
7. Green finance0.290.250.19−0.12−0.310.071
8. Network ceni0.270.180.14−0.07−0.190.130.221
9. Size0.230.310.150.09−0.240.170.280.331
10. Lev−0.12−0.08−0.060.210.370.14−0.18−0.11−0.091
Table 5. Regression results of the main effect model.
Variable(1)(2)(3)
Policy_cordpit0.318 *** (0.075)0.372 *** (0.083)0.356 *** (0.079)
Post0.192 ** (0.082)0.215 ** (0.091)0.204 ** (0.087)
Size 0.041 (0.032)0.038 (0.030)
Lev −0.109 **(0.043)−0.109 **(0.043)
ROA 0.285 ** (0.112)0.273 ** (0.105)
Tobin Q 0.064 *** (0.021)0.061 *** (0.019)
SOE −0.093 (0.078)−0.087 (0.073)
Market index 0.019 * (0.010)0.021 ** (0.009)
Constant−0.702 *** (0.198)−0.842 *** (0.214)−0.816 *** (0.207)
Sample size389638963896
R20.3760.4230.438
Note: *** p < 0.01, ** p < 0.05, * p < 0.1. The standard error of clustering at the provincial level is provided in parentheses.
Table 6. Results of the heterogeneity analysis model.
Variable(1)(2)(3)
High carbon−0.020592
High fc −0.214 ** (0.096)
Tax upgrade 0.327 *** (0.088)
Size0.037 (0.035)0.034 (0.033)0.041 (0.036)
Lev−0.008118−0.007434−0.00884
ROA0.271 ** (0.119)0.263 ** (0.115)0.278 ** (0.122)
Tobin Q0.059 ** (0.024)0.062 ** (0.023)0.057 ** (0.025)
SOE−0.087 (0.081)−0.092 (0.079)−0.083 (0.084)
Market index0.017 (0.011)0.020 * (0.010)0.015 (0.012)
Constant−0.796 *** (0.231)−0.812 *** (0.225)−0.779 *** (0.238)
Sample size389638963896
R20.4370.4410.432
Note: *** p < 0.01, ** p < 0.05, * p < 0.1.
Table 7. Results of the mechanism test model.
Variable(1)(2)(3)
Env cost0.182 ** (0.075)
Green finance 0.254 *** (0.069)
Network cen 0.167 * (0.089)
Size0.043 (0.029)0.048 (0.031)0.039 (0.027)
Lev−0.006322−0.007015−0.005555
ROA0.293 ** (0.108)0.278 ** (0.112)0.302 ** (0.104)
Tobin Q0.067 *** (0.019)0.063 *** (0.021)0.071 *** (0.018)
SOE−0.101 (0.073)−0.095 (0.076)−0.108 (0.071)
Market index0.021** (0.009)0.019 * (0.010)0.023 ** (0.008)
Constant−0.873 *** (0.207)−0.891 *** (0.215)−0.852 *** (0.201)
Sample size389638963896
R20.4560.4490.463
Note: *** p < 0.01, ** p < 0.05, * p < 0.1.
Table 8. Two-stage regression results of the mediation effect.
VariablePhase One
Coefficient (Standard Error)
Phase Two
Coefficient (Standard Error)
Instrumental variable0.218 *** (0.062)
Policy coordination index0.127 ** (0.051)0.356 *** (0.079)
Equity network centrality 0.184 ** (0.073)
Control variableYESYES
Sample size38963896
F-value in the first stage12.7
Note: **, and *** represent significance levels of 5%, and 10%, respectively; standard errors are clustered at the provincial level.
Table 9. Decomposition of causal mediation effect.
Effect TypeEstimate95% Confidence IntervalIntermediary Ratio
Total0.356[0.282, 0.430]
ADE0.272[0.198, 0.346]76.40%
ACME0.084[0.032, 0.136]23.60%
Note: The confidence interval is based on 1000 bootstrap samples.
Table 10. Decomposition of policy contribution and regional heterogeneity in emission reduction effects.
VariableAssembleRaise the StandardTranslationContribution Rate
Direct environmental tax reform0.428 *** (0.092)0.512 *** (0.105)0.327 ** (0.129)48.9
Green finance indirectly0.267 *** (0.071)0.198 ** (0.083)0.154 * (0.081)31.2
Network collaborative regulation0.185 * (0.098)0.231 ** (0.095)0.122 (0.104)19.9
Marketization index adjustment0.117 * (0.063)0.142 * (0.075)0.089 (0.068)-
Sample size389621431753-
R20.5020.5380.467-
Note: *** p < 0.01, ** p < 0.05, * p < 0.1.
Table 11. Decomposition of dynamic effects and heterogeneous emission reduction effects of enterprises.
VariablePolicy Implementation QuarterTallLowDifference
Policy accumulation0.112 → 0.429 ***0.463 ***
(0.101)
0.298 **
(0.118)
16.5
Cost push0.085 * → 0.203 ***0.237 ***
(0.087)
0.158 *
(0.092)
12.3
Financing incentives0.062 → 0.184 ***0.219 **
(0.095)
0.131
(0.107)
9.8
Network collaboration0.041 → 0.167 **0.185 *
(0.098)
0.072
(0.112)
14.7
Moderating effect−0.098
(0.081)
−0.124
(0.102)
−0.063 (0.091)
Sample size389619521944
R20.4860.5210.452
Note: *** p < 0.01, ** p < 0.05, * p < 0.1.
Table 12. Parallel trend test.
VariableCoefficientStandard ErrorPSample SizeR2
Pre30.0320.0650.62138960.489
Pre20.0570.0710.43238960.489
Pre10.0890.0730.21438960.489
Post10.112 **0.0480.0238960.489
Post20.238 ***0.0630.00138960.489
Post30.351 ***0.085038960.489
Post40.429 ***0.092038960.489
Size0.0410.0320.19838960.489
Lev−0.117 *0.0620.05838960.489
Note: *** p < 0.01, ** p < 0.05, * p < 0.1.
Table 13. Placebo test.
Statistical IndicatorsFalseReal
Mean value−0.0120.372 ***
Standard deviation0.1080.083
Median−0.0080.369
1% quantile−0.314
5% quantile−0.198
95% quantile0.185
99% quantile0.284
Skewness0.12
Kurtosis2.85
P 0.008
Note: *** p < 0.01.
Table 14. Results of the test for the replacement of the dependent variable.
Variable SymbolCoefficientStandard Errorp
Green patent0.401 ***0.088p < 0.01
Treat0.366 ***0.079p < 0.01
Post0.208 **0.085p < 0.05
Tax upgrade0.317 ***0.076p < 0.01
Network cen0.167 *0.089p < 0.10
Size0.0380.031p = 0.218
Lev−0.121 *0.064p < 0.10
ROA0.276 **0.11p < 0.05
Tobin Q0.063 ***0.02p < 0.01
Market index0.018 *0.009p < 0.10
Constant−0.804 ***0.207p < 0.01
Adj.R20.478
Note: *** p < 0.01, ** p < 0.05, * p < 0.1.
Table 15. Results of the sensitivity analysis of data processing.
Treatment MethodPolicy Coordination IndexStandard ErrorSample Sizep
1% winsorization0.3560.0793896
0.5% winsorization0.3480.07738960.75
2% winsorization0.3620.08138960.68
MICE0.3420.07938960.82
Complete case0.3410.08335210.79
Table 16. Comparison of core results.
IndexThis StudyTraditionRaise the StandardTranslationHigh-Tech Internet EnterpriseLow-Internet Enterprise
Directly related to environmental tax reform48.960–7051.232.7
Green finance indirectly31.215 October19.815.4
Network collaborative regulation19.9523.112.218.57.2
Policy peak time4immediately3.84.53.24.8
Green patent contribution72.534.575.368.981.263.4
Attenuation of financing constraints31.41528.633.925.736.1
Environmental cost elasticity threshold152013171119
Market-based regulation18.39.721.58.924.77.3
Enhancement of equity network centrality23.6825.419.827.915.2
Dynamic accumulation283100301265318241
Disclaimer/Publisher’s Note: The statements, opinions and data contained in all publications are solely those of the individual author(s) and contributor(s) and not of MDPI and/or the editor(s). MDPI and/or the editor(s) disclaim responsibility for any injury to people or property resulting from any ideas, methods, instructions or products referred to in the content.