Article

Advancing Hospital Sustainability: A Multidimensional Index Integrating ESG and Digital Transformation

1
Urban Institute & School of Engineering, Kyushu University, Fukuoka 819-0395, Japan
2
Advanced Asian Archaeology Research Center, Faculty of Social and Cultural Studies, Kyushu University, Fukuoka 819-0395, Japan
*
Author to whom correspondence should be addressed.
These authors contributed equally to this work.
Sustainability 2025, 17(19), 8787; https://doi.org/10.3390/su17198787
Submission received: 18 August 2025 / Revised: 9 September 2025 / Accepted: 28 September 2025 / Published: 30 September 2025
(This article belongs to the Section Health, Well-Being and Sustainability)

Abstract

The sustainable development of society requires the incorporation of environmental, social, and governance (ESG) principles. While ESG assessments are widely used in corporate settings, their application in healthcare settings, such as hospitals, remains underexplored. This study aimed to develop a comprehensive evaluation framework integrating ESG and digital transformation (DX) with traditional hospital efficiency and effectiveness assessments. Using open data, financial reports, and hospital website scraping, we applied a slack-based model (SBM) of data envelopment analysis (DEA) and super-efficiency SBM-DEA to calculate sustainability scores across four dimensions: overall sustainability, efficiency, effectiveness, and ESG/DX performance. Results showed that all three components—efficiency, effectiveness, and ESG/DX—were positively associated with overall sustainability. However, ESG/DX performance negatively impacted profitability in smaller hospitals, and improved effectiveness in rehabilitation hospitals was linked to higher operational costs. These findings suggest that while ESG and DX contribute to long-term sustainability, their short-term financial burden may challenge certain hospital types. The proposed index provides valuable insights for hospital management and policy development, aiming to advance ESG and DX initiatives in healthcare.

1. Introduction

Research on ESG (environmental, social, and governance) practices has gained significant attention recently. Studies have shown a positive relationship between ESG criteria and corporate financial performance (CFP), with approximately 90% of studies reporting non-negative ESG-CFP relations [1]. Institutional investors have increasingly focused on ESG factors, particularly corporate governance, in their investment decisions [2]. The ESG principle has been developed since 2004, with countries worldwide promoting coordinated environmental, social, and governance development [3]. The healthcare sector faces distinct sustainability challenges, as hospitals are major consumers of energy and water, generate significant waste and emissions, and bear critical social responsibilities for patient safety, employee well-being, and community health [4,5,6]. Given these characteristics, ESG principles are particularly relevant, linking environmental impacts with governance, transparency, and the quality and equity of healthcare services.
The Japanese healthcare system is characterized by all citizens being covered by public medical insurance, which enables them to receive high-quality medical care at a low out-of-pocket expenses [7]. However, concerns have been raised about the increasing financial burden associated with sustaining this system. Specifically, rising public healthcare expenditures place pressure on government budgets, while growing social insurance premiums impose a financial burden on individuals [7]. These financial challenges are intrinsic to the structure of Japan’s healthcare financing, where both government funding and individual contributions through insurance premiums support the public system. As a result, substantial healthcare expenses are incurred to maintain and improve the quality of services, highlighting the need for efficient resource utilization and sustainability assessment.
Accordingly, this study is undertaken in Japan, where the combination of a universal healthcare system, rapid population aging, and rising medical costs makes sustainability a highly urgent and relevant issue. Japan represents a critical case for exploring how ESG and digital transformation (DX) can be incorporated into hospital management, not only because of the mounting financial pressures but also because lessons learned here may provide implications for other countries facing similar demographic and fiscal challenges.
Integrating sustainability and efficiency in healthcare delivery is essential to address contemporary challenges related to environmental impact, economic feasibility, and social responsibility. Nevertheless, most existing literature has focused primarily on the hospital productivity or clinical quality metrics [8,9], and few studies have attempted to quantify the sustainability or ESG performance of hospital healthcare services.
To fill this void, this study aims to develop a comprehensive index of hospital sustainability that integrates ESG factors and DX into conventional hospital efficiency and effectiveness evaluations. Using the estimated hospital sustainability index, we address the following questions: what is the significance of ESG/DX issues for hospital sustainability, and how are ESG/DX practices linked to hospital operational efficiency and profitability? For this purpose, we constructed a dataset by combining disclosed ESG/DX information on hospital websites, financial data, and an open database of hospital performance. To our knowledge, this is the first attempt to empirically evaluate hospital sustainability that integrates efficiency, effectiveness, and ESG/DX. By introducing ESG/DX factors into the evaluation system, this study offers a comprehensive picture of hospital sustainability, providing practical implications for improving ESG/DX practices in hospitals.
This study makes several contributions. First, it proposes a multidimensional hospital sustainability index that integrates ESG/DX into conventional hospital performance models. The model offers a practical approach, based on accessible datasets, to quantify hospital sustainability and facilitate the integration of sustainability information. Second, it decomposes inefficiency components, demonstrating that hospitals are beginning to differentiate their sustainability strategies through ESG/DX disclosure, highlighting the necessity to evaluate and promote ESG/DX practices in the healthcare sector. Third, it provides empirical evidence on the relationship between ESG/DX disclosure and hospital performance, offering practical implications for hospital operations and policymaking, particularly with respect to sustainability disclosure and tailored guidance for different types of institutions.
The remainder of this paper is organized as follows. Section 2 reviews sustainability evaluation in the healthcare sector and develops the hypotheses on ESG/DX practices and hospital performance. Section 3 describes the sample, data collection, and model specifications. Section 4 presents the empirical results, followed by a discussion of the findings and limitations in Section 5. Section 6 concludes.

2. Literature Review

2.1. Hospital Sustainability Evaluation

Implementing ESG practices in the healthcare sector is gaining prominence as a strategy to enhance organizational sustainability [6]. Hospitals are increasingly adopting ESG practices to align with the SDGs (Sustainable Development Goals), though this may incur additional costs [5]. Hospitals have been identified as significant contributors to environmental change in the healthcare sector, such as building design, energy consumption, water use, procurement, waste management, and staff behavior [4]. From a supply chain perspective, recent life cycle assessment (LCA) studies highlight hospital environmental hotspots in energy and water consumption, anesthetic gas emissions, and the upstream production of medical products and supplies [10]. Moreover, integrated waste management strategies have been shown to effectively reduce both waste generation and GHG emissions [11].
Beyond the environmental impacts, recent studies have also emphasized the critical role of overall ESG practices and digital transformation in advancing organizational sustainability and performance, both in corporate and public sector contexts [12,13]. These findings provide further justification for extending ESG/DX evaluation frameworks into the healthcare sector. Over the past decade, sustainability evaluation has expanded rapidly, including within the healthcare sector. Existing ESG assessment frameworks—such as those provided by Bloomberg, LSEG, and MSCI—offer transparency and accountability in corporate sustainability [14]. However, these tools primarily target listed companies and, although often applied in healthcare contexts, are not specifically designed for hospitals, which are typically unlisted. At the same time, recent studies emphasize financial materiality as a critical dimension of corporate sustainability [15], a perspective also reflected in the SASB (Sustainability Accounting Standards Board) disclosure standards with specific metrics for the healthcare sector. Thus, a comprehensive hospital sustainability evaluation that integrates traditional performance metrics with ESG and DX dimensions would substantially enhance transparency and strengthen market recognition of sustainability issues in the healthcare sector.
Against this background, data envelopment analysis (DEA) has emerged as a valuable tool for assessing sustainability and efficiency in various sectors, including healthcare. DEA can be applied to evaluate corporate environmental sustainability, supporting theory development and decision-making [16]. In the context of hospitals, DEA models have been used to assess hospital performance in terms of technical efficiency and quality at the hospital level [17], the regional level [18], and the national level [19,20]. The application of DEA in sustainability research has evolved to focus on environmental sustainability, with four leading research clusters identified: corporate sustainability assessment, regional sustainability assessment, sustainability composite indicator construction, and sustainability performance analysis [21]. These studies demonstrate DEA’s versatility and potential for comprehensive sustainability assessment across various domains. While DEA itself is an established method, the significance of this study lies in applying it as a framework for hospital sustainability evaluation that explicitly integrates ESG and DX dimensions, and in demonstrating its feasibility using actual hospital data.
By situating hospitals within the broader ESG and DX discourse, this study aims to extend methodological and empirical understanding of healthcare sustainability. In doing so, it contributes to the limited but growing body of research that seeks to move beyond traditional productivity or clinical quality metrics [22] toward more comprehensive sustainability-oriented evaluations.

2.2. The Nexus of ESG and DX Practices and Hospital Performance

Grounded in stakeholder theory, which posits that organizational performance improves when the diverse interests of stakeholders are adequately addressed [23], this study argues that hospitals engaging in ESG and DX initiatives are better positioned to meet the expectations of patients, employees, regulators, and local communities. In addition, drawing on signal theory [24,25,26], the adoption and disclosure of ESG/DX practices can serve as credible signals of operational quality and long-term commitment to sustainability, thereby enhancing stakeholder trust and legitimacy in most industries [27]. By improving transparency and reducing information asymmetry, such signals can attract stakeholder support, increase access to resources, and strengthen the hospital’s strategic positioning.
Beyond financial aspects, the link between sustainability and healthcare quality also requires consideration, as recent studies emphasize that ESG and DX practices can enhance not only efficiency but also patient outcomes and institutional transparency [28,29,30]. For example, Billi and Bernardo [28] demonstrate that DX and IT innovation significantly improve organizational performance in ways that resonate with healthcare transformation. Similarly, Solimene et al. [29] highlight the role of institutional diversity and firm size in shaping ESG disclosure, while Solimene et al. [30] provide a theoretical framework on CSR disclosure relevant to hospital sustainability. By situating hospitals within this broader empirical and institutional context, our study builds on corporate and public sector literature to clarify the potential of ESG/DX integration in healthcare.
Based on these considerations, this study formulates the following hypotheses:
H1. 
ESG and DX practices are positively associated with hospital sustainability.
H2. 
ESG and DX practices are positively associated with hospital efficiency and effectiveness.
H3. 
The effects of ESG and DX differ depending on institutional characteristics.

3. Materials and Methods

3.1. Concept of the Hospital Sustainability Evaluation System

Our objective was to develop and analyze an evaluation methodology encompassing sustainability, including ESG, DX, and financials, and hospitals’ traditional functional and qualitative evaluation. Hospital sustainability, which was the objective of the evaluation in this study, was categorized into three dimensions: “Efficiency,” “Effectiveness,” and “ESG/DX” (Figure 1). The “Efficiency” dimension considers efficiency in healthcare and financial efficiency. “Effectiveness” is considered clinical effectiveness and safety in healthcare. In addition to considering environmental, social, and governance factors, “ESG/DX” considered the degree of digital transformation. The variables used for each are shown in Table 1. The model is based on the DEA model described in the next section, which scores each hospital on “hospital sustainability” and three dimensions.

3.2. DEA Model

The DEA model has been widely used for performance evaluation in the healthcare sector [31], as well as sustainability issues such as carbon emissions [32]. In this study, multiple DEA models are applied to assess hospital performance in terms of efficiency, effectiveness, ESG performance, and integrated sustainability [33]. We begin by introducing the input-oriented BCC (Banker, Charnes, and Cooper) model in Equation (1), which provides the foundational structure of DEA and has been widely applied for evaluating efficiency under variable returns to scale [34]. This basic model helps illustrate the conceptual logic of DEA, namely, benchmarking a decision-making unit (DMU) against a convex combination of peers while minimizing input excesses and output shortfalls. In Equation (1), x 0 and y 0 denote the input and output vectors of the hospital under evaluation, while X and Y are the input and output matrices of all hospitals. The vector λ forms a convex combination of peers and satisfies j = 1 n λ = 1 , enforcing variable returns to scale. The objective function maximizes the efficiency score θ while penalizing input excesses s and output shortfalls s + through a non-Archimedean constant ε . This slack-based specification allows the model to identify not only proportional inefficiencies (as in radial models) but also non-proportional slacks in input and output dimensions. A hospital is considered strongly efficient if and only if θ = 1 and both slacks are zero.
max       θ ε s + ε s Subject   to   θ x 0 = X λ + s y 0 = Y λ s + j = 1 n λ = 1 ,   λ 0 ,   s 0 ,   s + 0
However, to better capture the complex realities of hospital operations, we extend the basic framework to the slack-based DEA (SBM-DEA) model with undesirable outputs. It allows for non-radial inefficiency measurement, meaning that inputs and outputs are not required to change proportionally [35]. Furthermore, the additive DEA approach allows us to decompose the inefficiency of inputs and outputs [36]. Thus, we applied the SBM-DEA model [37,38] as our basic model to estimate hospital sustainability, which has been widely used in healthcare sector studies [18,20]. Equation (2) presents a SBM-DEA model that incorporates undesirable outputs [39,40], extending the conventional efficiency evaluation to reflect real-world complexities in hospital operations. In this model, the efficiency score ρ   is defined as the ratio of input inefficiency to output performance, where the denominator accounts for both desirable and undesirable outputs. This non-radial model does not assume proportional reduction in inputs or expansion in outputs, allowing for different slack magnitudes per variable. The numerator measures the average normalized input excess, and the denominator captures the combined shortfall in desirable outputs and the surplus in undesirable outputs. Higher levels of undesirable outputs (i.e., average days of inpatient) are penalized in the objective function, reflecting their negative implications for sustainability. The final score ρ   ranges between 0 and 1, with values closer to 1 indicating greater efficiency.
In the subjections, x 0 , y 0 g , and y 0 b denote the input, desirable output, and undesirable output vectors of the hospital under evaluation, respectively, and X , Y g , and Y b are the corresponding data matrices for all hospitals. The slack variables s , s g , and s b capture input excesses, shortfalls in desirable outputs, and surpluses in undesirable outputs, respectively. The intensity vector λ forms a convex combination of peer hospitals under variable returns to scale.
ρ = min 1 1 m i = 1 m s i x i o 1 + 1 s 1 + s 2 ( r = 1 s 1 s r g y r 0 g + r = 1 s 2 s r b y r 0 b ) Subject   to   x 0 = X λ + s y 0 g = Y g λ s g y 0 b = Y b λ + s b s 0 ,   s g 0 ,   s b 0 ,   λ 0
To further differentiate between efficient hospitals that lie on the DEA frontier (i.e., those with efficiency scores of 1), we apply the super-efficiency SBM-DEA model as shown in Equation (3) [41,42]. This model builds upon the slack-based DEA framework by excluding the evaluated DMU from the reference set, thereby enabling efficiency scores greater than 1 and allowing ranking among efficient units. For simplicity and consistency in computation, we treat undesirable outputs as additional inputs, reflecting the need to minimize them in the same manner as resource inputs. The objective function retains the slack-based structure. The resulting super-efficiency score ρ indicates the extent to which a hospital exceeds the performance frontier, thus providing greater discriminatory power in the presence of many efficient DMUs. This is particularly relevant in cross-sectional analyses where a large number of hospitals may achieve the maximum efficiency score in standard SBM-DEA. The final evaluation combines results from the SBM-DEA and super-efficiency SBM models, where higher scores reflect superior performance relative to peer hospitals.
ρ = min 1 + 1 m i = 1 m s i x i o 1 1 s r = 1 s s r + y r 0 Subject   to   x 0 = j = 1 , j 0 n x j λ j s y 0 = j = 1 , j 0 n y j λ j + s + s 0 ,   s + 0 ,   λ 0
All performance evaluations were conducted by subgrouping hospitals based on similar operational characteristics, following the classification framework of the Japan Council for Quality Health Care (JCQHC). This classification system is widely used in Japan to categorize hospitals according to their functional roles within the healthcare delivery system. Specifically, Group 1 includes small- to medium-sized hospitals that serve as community-based facilities. These hospitals provide general care and support local healthcare needs. Group 2 comprises core hospitals responsible for providing more advanced and acute-phase medical services. These hospitals often function as regional hubs with higher capacities and specialized departments. Rehabilitation hospitals focus on post-acute care and physical recovery services, often supporting patients transitioning from acute treatment to long-term care or home settings. Chronic-care hospitals provide long-term medical care primarily through medical treatment beds for patients with stable but ongoing conditions requiring continuous supervision. This functional classification allows for more nuanced performance evaluation tailored to the distinct missions and resource constraints of each hospital type.
Based on the DEA model framework described above, we separately evaluated four performance dimensions for each hospital: efficiency, effectiveness, ESG/DX transparency, and overall sustainability. To investigate how hospital performance on ESG/DX transparency and clinical effectiveness relates to operational and financial outcomes, we conducted regression analyses using the estimated DEA scores. Specifically, we modeled hospital efficiency and return on assets (ROA) as dependent variables. The first regression estimates the effects of effectiveness and ESG/DX scores on SBM-DEA efficiency, while the second examines their influence on ROA. The model is expressed in Equation (4), where E f f e c t i v e n e s s i and E S G / D X i are DEA-based scores reflecting clinical effectiveness and ESG/DX transparency. The vector of control variables X i includes hospital type (Group 1, Group 2, rehabilitation, or chronic-care) and regional location. Subgroup analyses by hospital type were also performed to capture heterogeneous effects.
O p e r a t i o n a l   o r   F i n a n c i a l   o u t c o m e i = β 0 + β 1 E S G / D X i + β 2 E f f e c t i v e n e s s i + X i β + ε i

3.3. Data and Sample

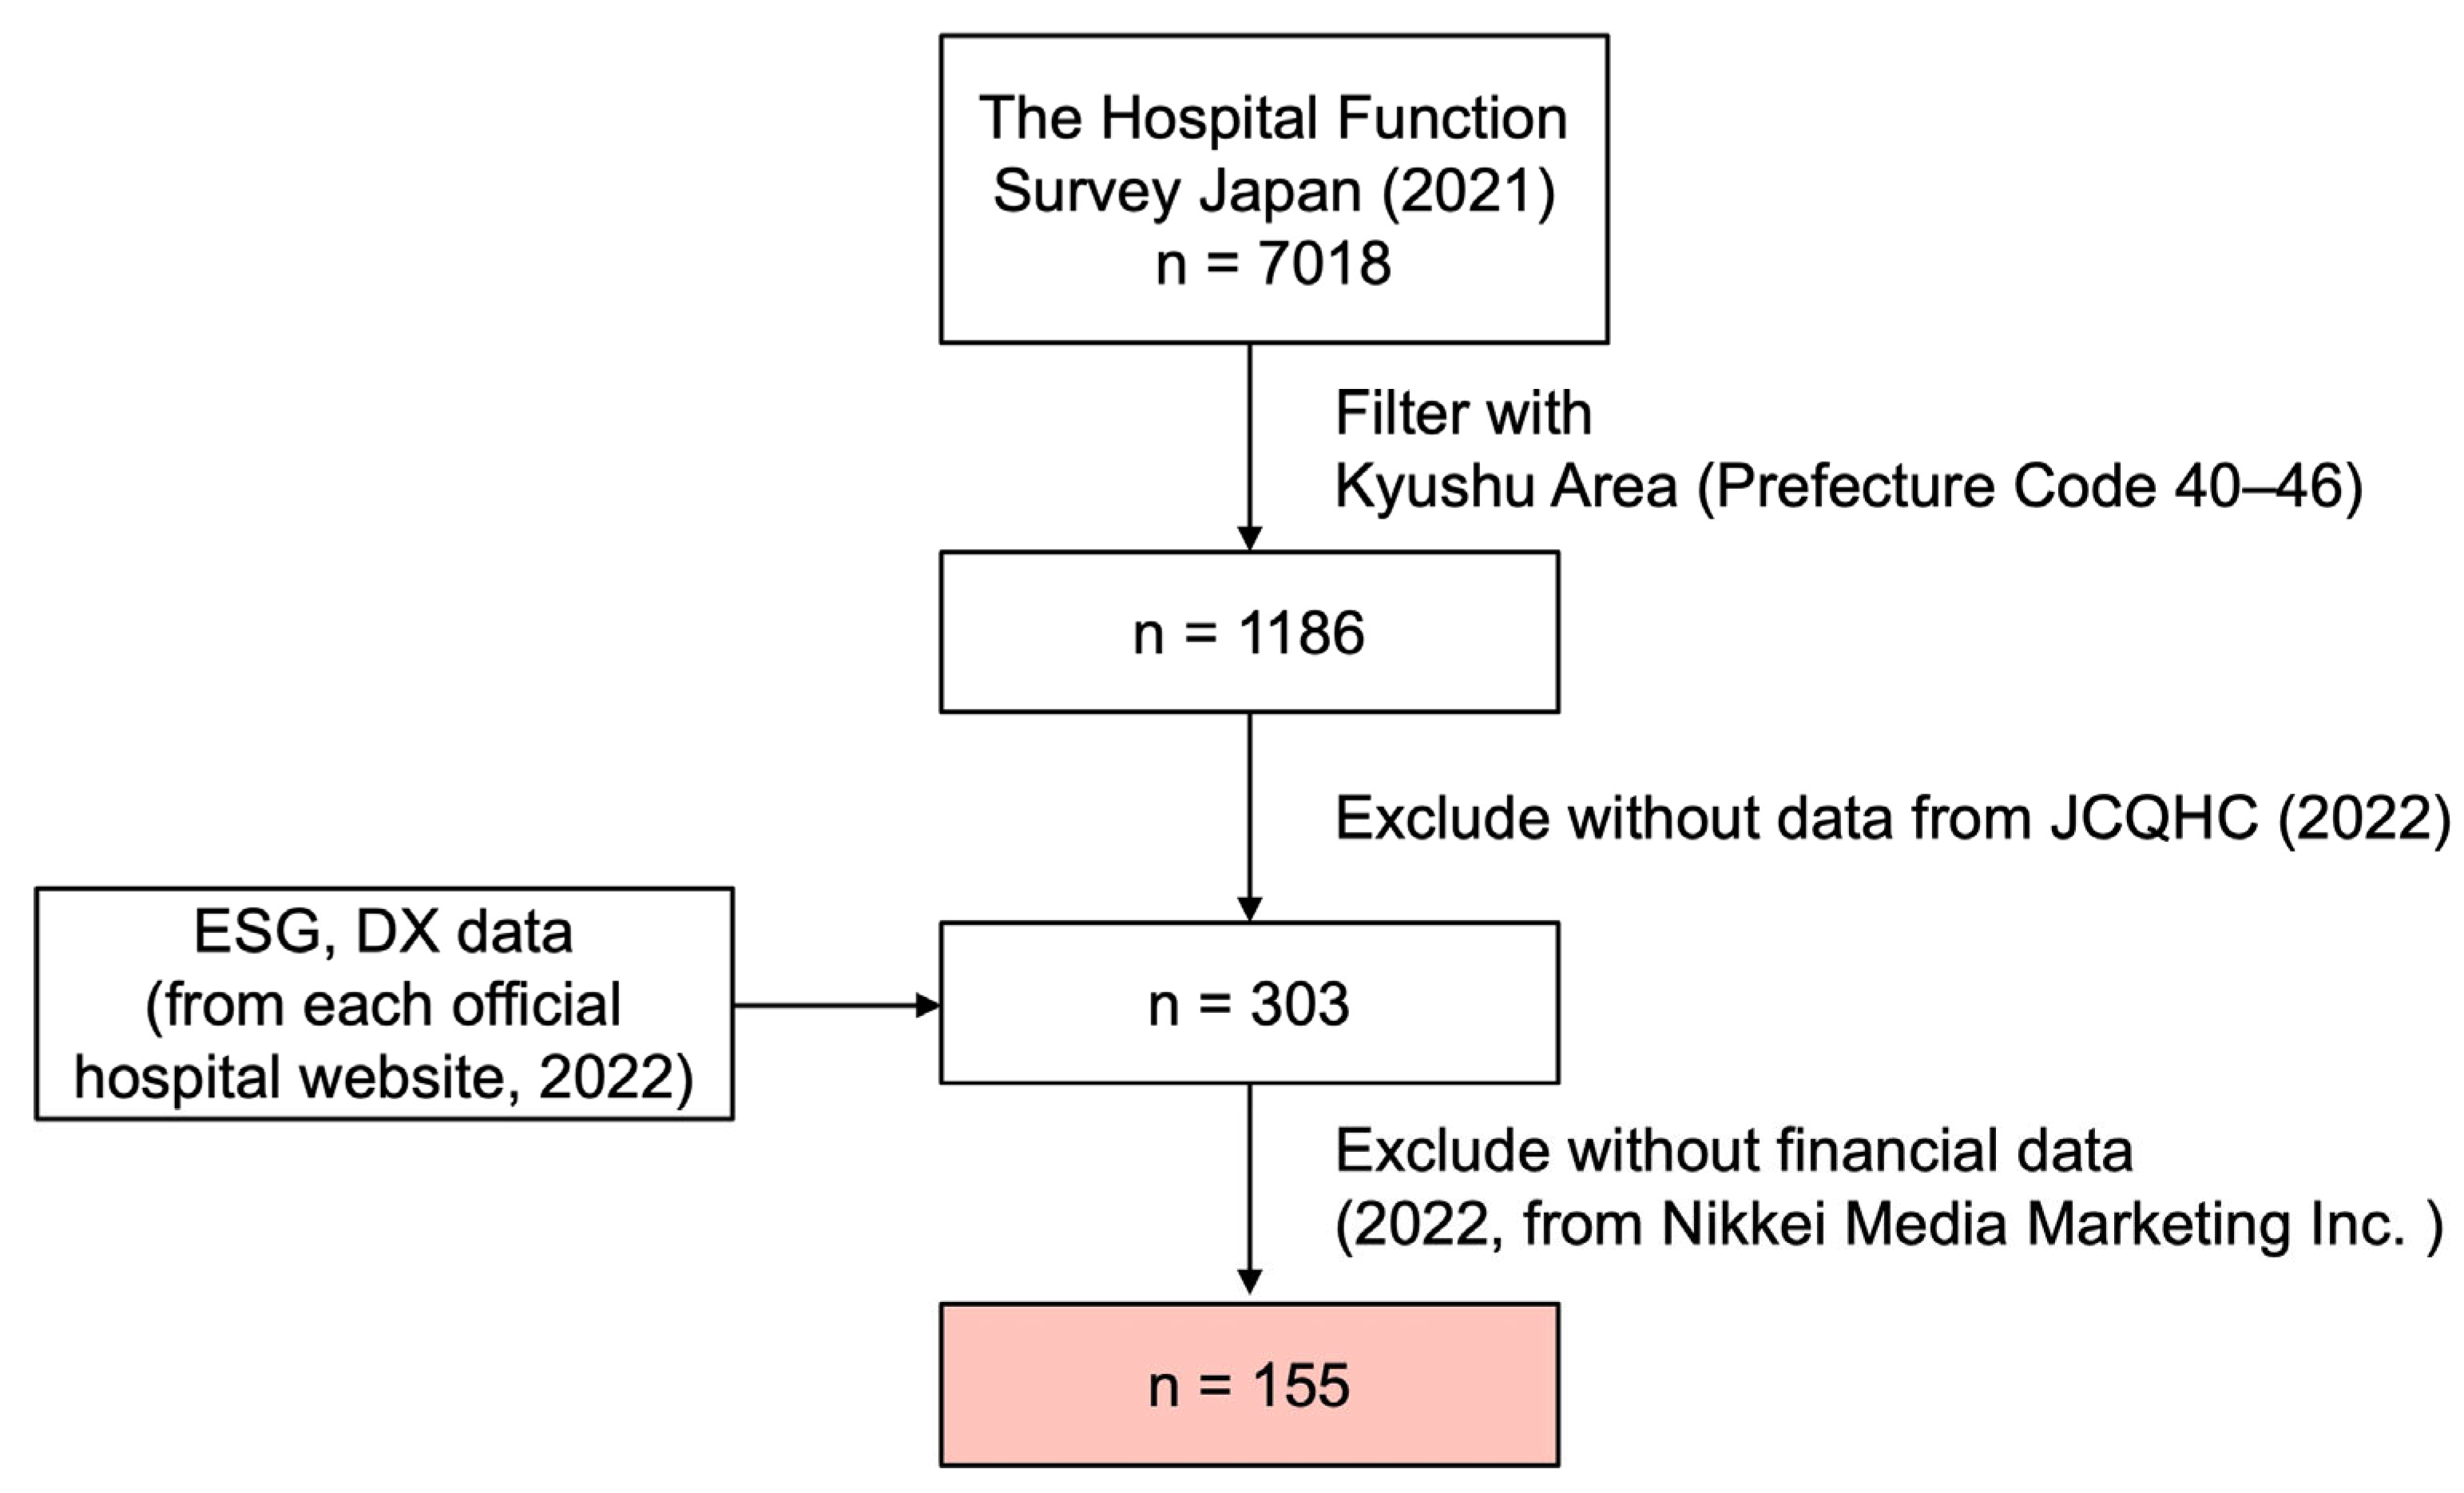
The indicators of the inputs and outputs are summarized in Table 1. We separately evaluated the efficiency, effectiveness, ESG/DX, and overall sustainability scores based on multiple DEA models. We collected all the indicators from 4 data sources, including two publicly available hospital statistical datasets, original ESG disclosure information gathered from official hospital websites, and financial data obtained from Nikkei Media Marketing Inc. (Tokyo, Japan). Efficiency and effectiveness items are from publicly available accreditation reports from the Hospital Function Survey Japan in 2021 (available from https://www.mhlw.go.jp/stf/seisakunitsuite/bunya/open_data_00008.html (accessed on 1 December 2023)) and JCQHC reports as of 2022 (available from https://www.report.jcqhc.or.jp/ (accessed on 1 December 2023)). The Hospital Function Survey reports the functional classification and operational status of their hospital beds, serving as a key dataset for regional healthcare planning and policy evaluation. The JCQHC reports provide a thorough qualitative assessment of clinical effectiveness and safety. Our models incorporate relevant assessment items in the dimensions, including quality improvement, medical treatment, clinical function, patient safety, and infection control (see sub-indicators in Table 1). All the items are evaluated on a four-point scale from best to worst (S, A, B, and C). We then quantified these grades into points ranging from 4 to 1. The sub-indicator points are the average of the corresponding items, and the indicator points are the sum of the sub-indicators. ESG data were collected from the official hospital homepage website. We used 8 items from DX, 11 items from the environmental domain, 16 items from the social domain, and 6 items from the governance domain (for details, see Table S1). The degree of transparency for each domain is determined by detecting the keywords related to each item from the contents disclosed on the hospital homepages. Each item is assigned a value of 1 if relevant keywords are identified and 0 if not. To avoid bias, we did not consider keyword frequency because it is not directly linked to effort. This study focuses solely on the transparency of ESG/DX, which is determined by summing related items. The social and governance sub-indicators collected from JCQHC reports include local collaboration, accessibility, and governance assessment. The indicator points are the sum of the sub-indicators. To incorporate them into the DEA model, we add one point to the DX and Environmental indicators to ensure that their minimum value is not zero. Similarly, 0.1 points are added to the indicator ‘Average days of inpatient.’ The hospital’s financial information (fixed assets, current assets, operating expenses, and operating revenues) was provided by Nikkei Media Marketing Inc. (https://www.nikkeimm.co.jp/ (accessed on 1 December 2023)). After excluding hospitals with missing values for variables listed in Table 1, the final analytical sample comprised 155 hospitals located in the Kyushu region of Japan (Figure 2).

4. Results

4.1. Estimated Hospital Performance

Basic statistics by hospital group are presented in Table S2. Table 2 presents the estimated results of hospital performance in terms of efficiency, effectiveness, ESG/DX, and sustainability, along with the financial indicators used in the regression analysis. Hospitals with scores less than 1 are measured by the SBM-DEA, and those with scores greater than 1 are estimated by the super-efficiency SBM to distinguish the hospitals on the efficient frontier. The results indicate that hospital efficiency was the lowest at 0.04, while it was the highest at 2.38. The ESG/DX scores exhibit the highest standard deviation among all groups, indicating significant variances in hospital ESG/DX performance. In practice, the promotion of ESG activities in hospitals is still at an early stage. Only a few hospitals are aware of sustainability issues and are improving their transparency on ESG/DX, which leads to great disparities in ESG/DX performance.
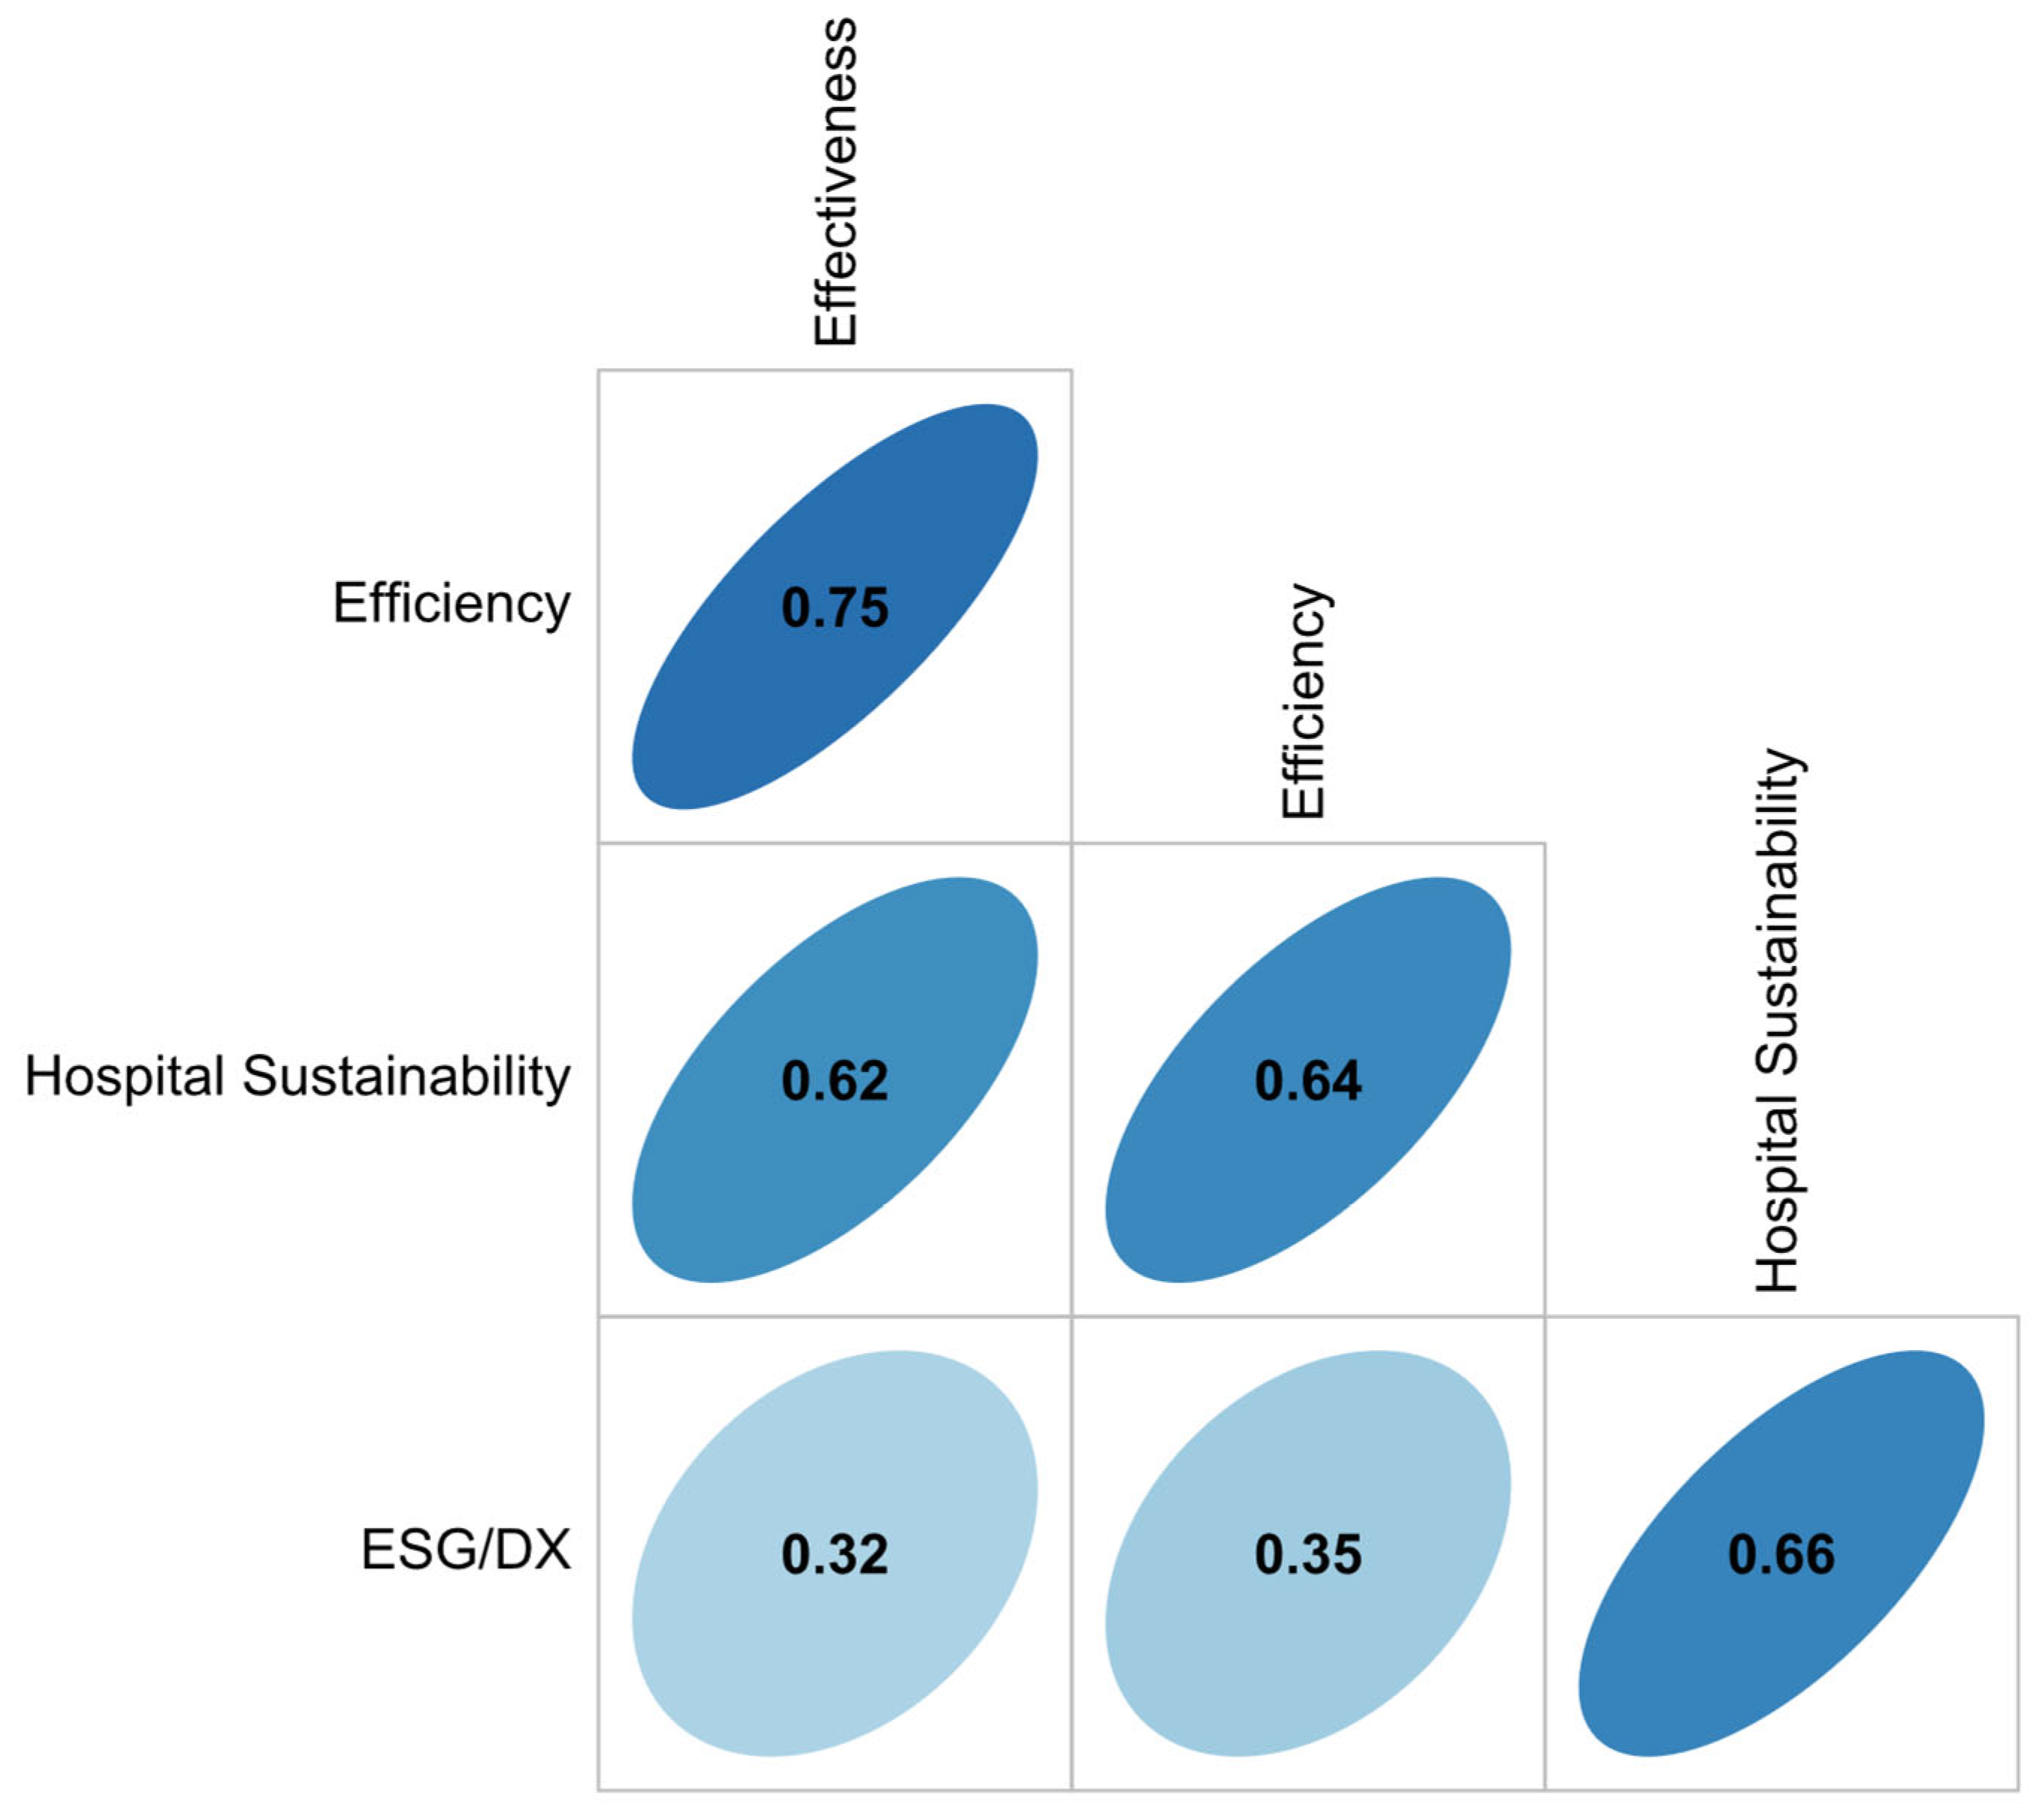
Figure 3 shows the correlation between the four hospital performance scores. There is a strong positive relationship between efficiency, effectiveness, and sustainability scores, the most important components in sustaining hospital operations. ESG/DX scores also showed positive relationships with other scores but more weakly, indicating a lack of ESG awareness in hospitals. Although some large hospitals have begun to link their operations to sustainability and disclose information to stakeholders, most hospitals are still less engaged in sustainability activities. We will further investigate the financial implications of ESG practices in the next section. By comparing hospital performance in different regions (see Figure 4), we found that the hospital with the highest score (2.04 sustainability score) was located in the developed region Fukuoka. There are fewer hospitals with high scores in Saga, Kumamoto, and Oita than in other areas (see details in Table S3).
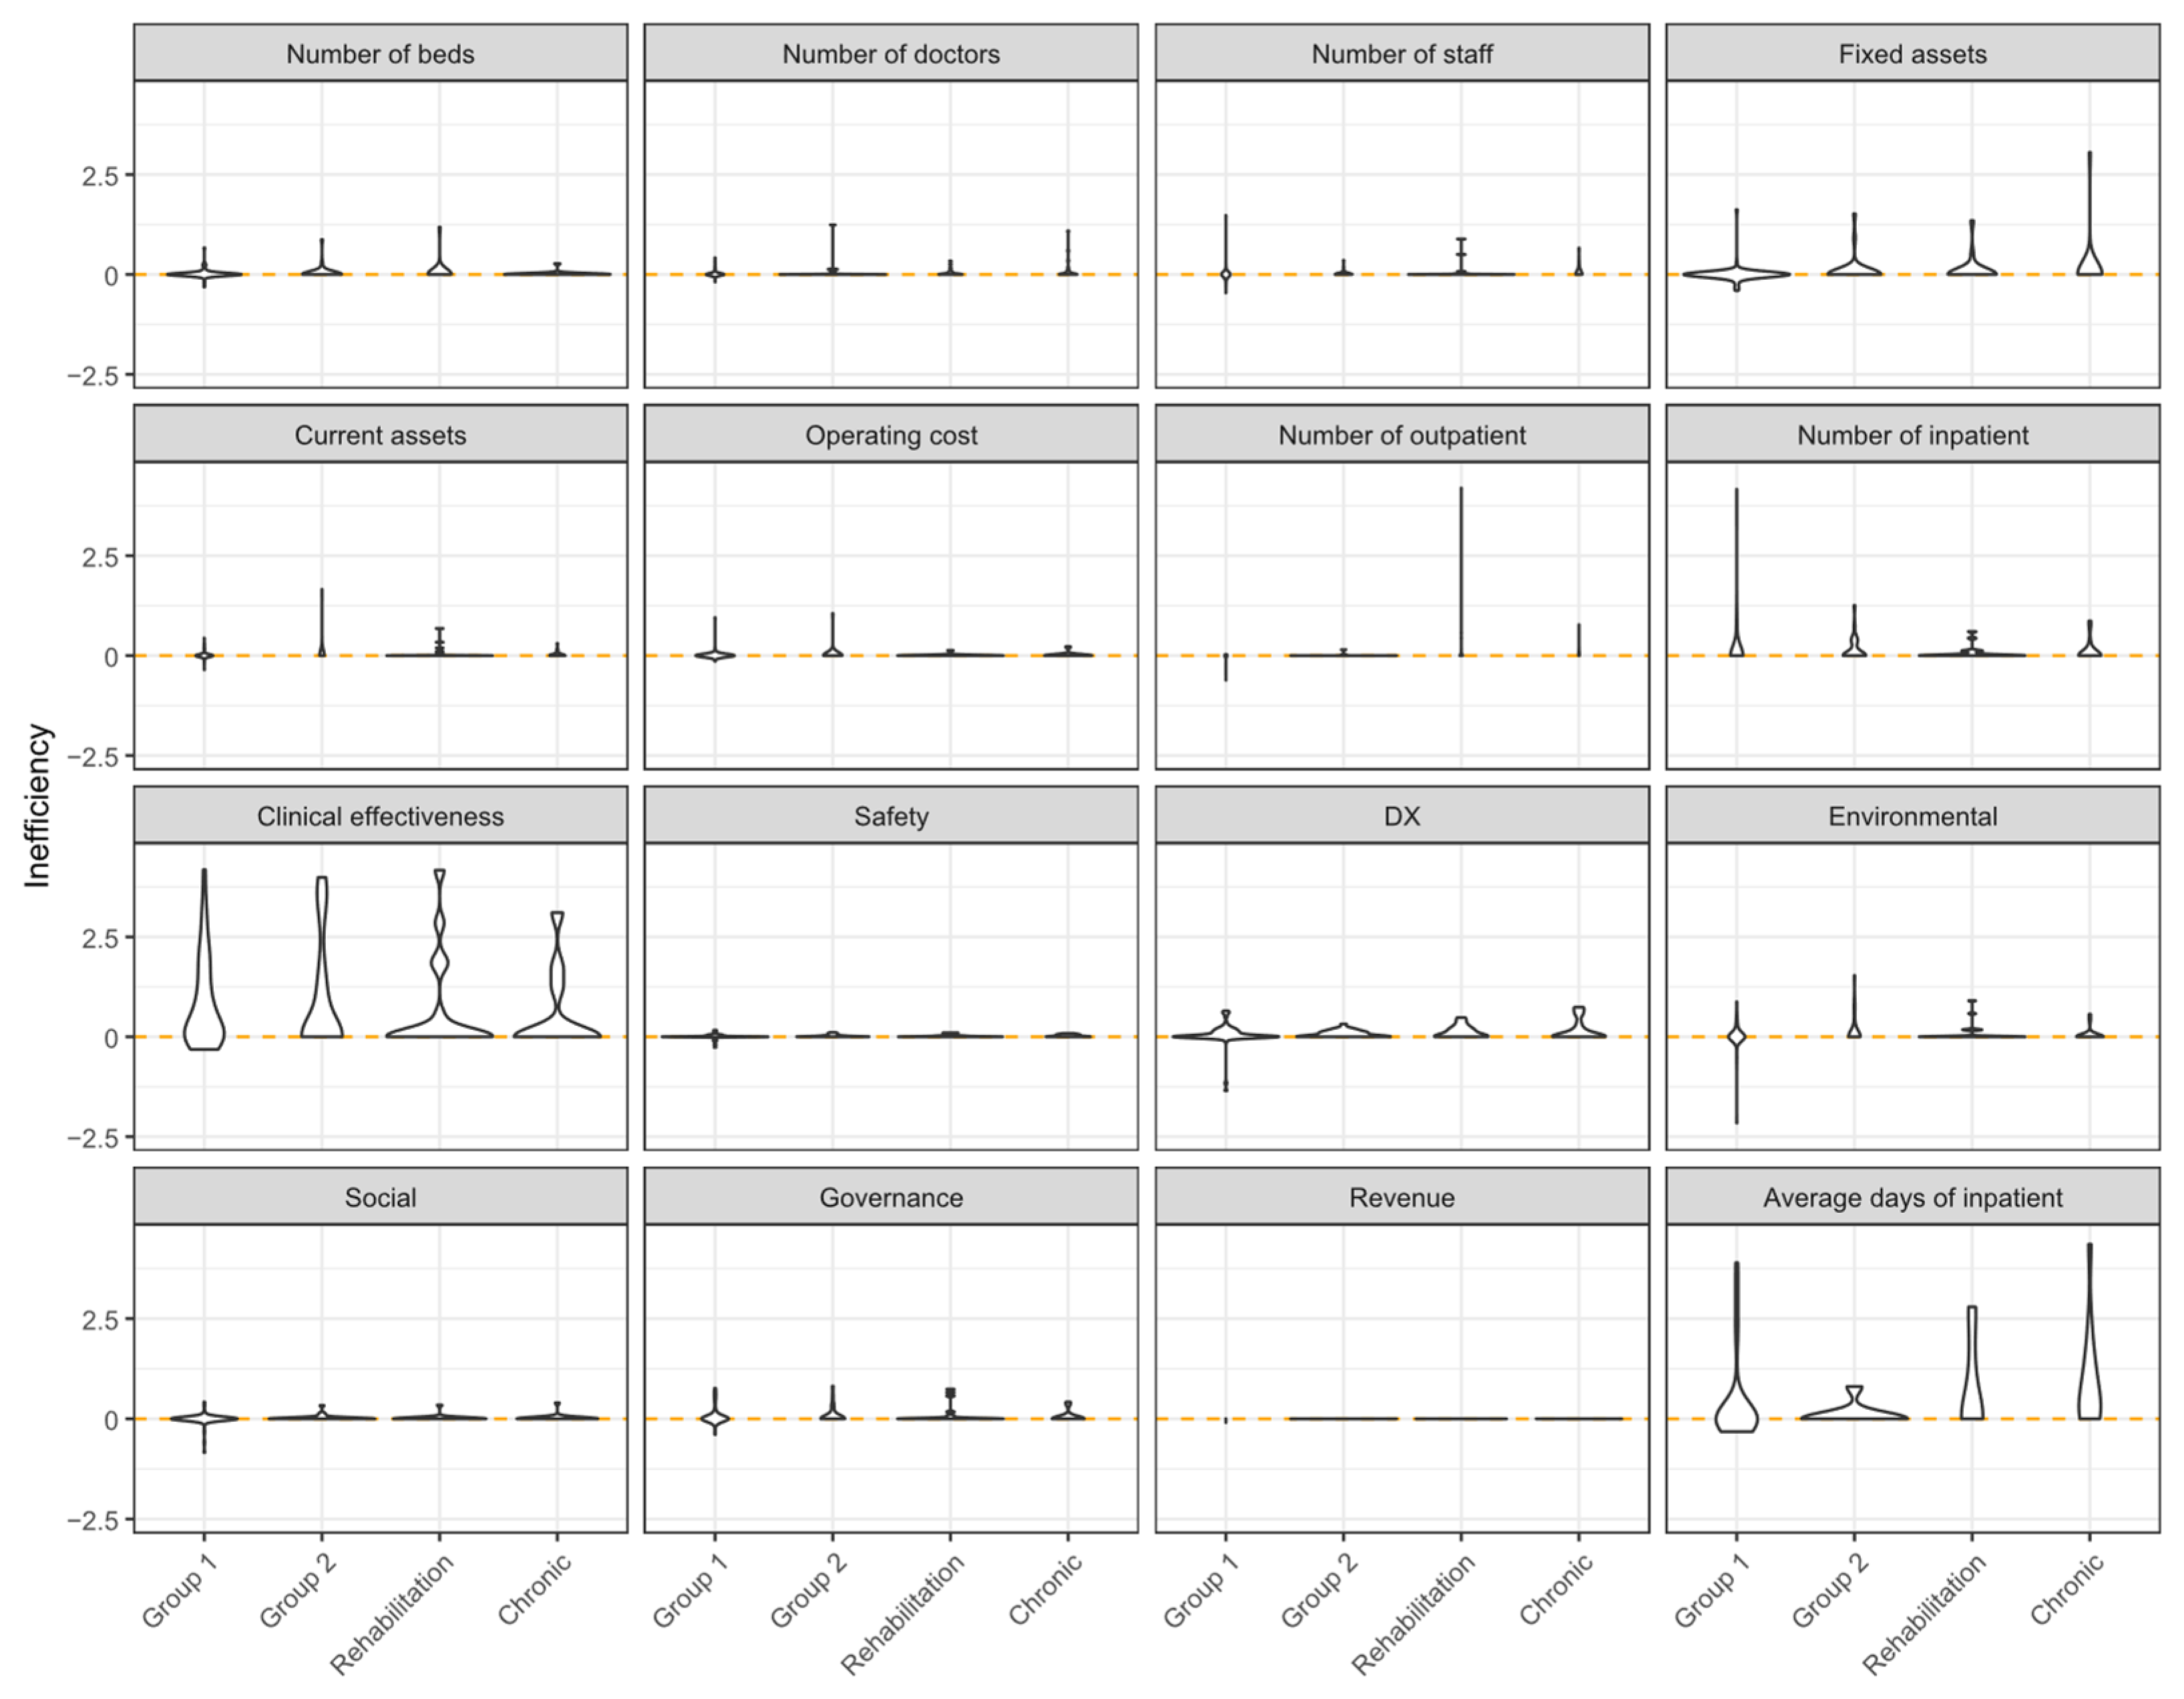
Figure 5 shows the inefficiency of each input and output by hospital group. Here, a negative value indicates the degree to which the variable needs to be improved, and a positive value is calculated based on super-efficiency SBM, indicating the degree to which it outperforms the variable. Clinical effectiveness and average inpatient days exhibit greater inefficiency variances than other assessment indicators, making them the most critical components in determining hospital sustainability [43]. The DX and ESG indices also exhibited similar variances as did the key indicators of hospital efficiency.

4.2. Financial Implications of ESG Transparency in Hospitals

Based on the estimated performance scores and financial indicators, we specified regression models to examine how ESG/DX performance and effectiveness performance are related to efficiency and ROA. As shown in Table 3, as expected, the effectiveness scores presented significant and positive effects on hospital efficiency for all hospital groups. ESG/DX performance is also found to be positively related to hospital efficiency, indicating that ESG/DX transparency could be an important factor in hospital operations. The positive effect is stronger for small- to middle-scale hospitals (Group 1). However, we did not find significant relationships for other hospital groups based on the limited sample size.
For the relationships with profitability, both effectiveness and ESG/DX performance present a negative linkage with ROA but with great heterogeneity across the types of hospitals (see Table 4). Efforts to enhance effectiveness may impose a great financial burden on rehabilitation hospitals, as the additional costs associated with improving care quality or implementing ESG/DX practices can reduce short-term profitability, thereby contributing to lower ROA. On the other hand, better ESG/DX performance comes at a cost and may have a negative impact on short-term financial performance in small- to middle-scale hospitals, which is consistent with the findings of prior studies on firms in other sectors [14]. These results suggest that hospitals, particularly smaller ones, may require not only financial strategies—such as long-term funding mechanisms or debt restructuring—but also strategic support including capacity-building, regulatory guidance, and operational planning to effectively implement ESG practices.
Table 5 provides a concise summary of the principal regression and correlation results to complement the detailed appendices. The findings show that effectiveness consistently improves efficiency but reduces ROA in rehabilitation hospitals, while ESG/DX enhances efficiency but negatively affects ROA, particularly in smaller hospitals. These results highlight both the operational benefits and short-term financial trade-offs of ESG/DX adoption in the healthcare sector.

5. Discussion

This study established a comprehensive evaluation system for hospital sustainability that includes ESG and DX, which have yet to be examined. To date, hospital evaluations have been dominated by efficiency assessments for management purposes and effectiveness and quality of care assessments for healthcare. In addition to integrating efficiency and effectiveness, this evaluation model, which integrates ESG and DX, is highly novel. Correlation analysis of the respective evaluation indicators revealed that ESG activities in hospitals were positively correlated with efficiency, effectiveness, and sustainability.
Previously, numerous companies have incorporated ESG practices into their corporate sustainability strategies [44]. Investors perceive companies with inadequate ESG performance to be at greater financial risk in the capital market [15]. However, considering ESG performance in hospitals has been rare due to the lack of financial incentives in the capital market. Our regression model and correlation analysis indicated that hospital ESG activities positively contribute to efficiency in small hospitals (Group 1) but negatively contribute to ROA. One possible reason for the improvement in efficiency is that ESG activities and DX may have improved the work environment, resulting in increased efficiency. On the other hand, more efficient hospitals may have introduced ESG activities and DX. Regarding ROA, smaller hospitals may have made a negative contribution to ROA due to an increased ratio of investment to profitability when implementing ESG activities and DX. In this case, improving the working environment through ESG and DX may lead to a positive return in the long term. However, it is also possible that hospitals with higher profit margins and more leeway are more likely to implement ESG and DX. In particular, the negative association between ESG/DX and ROA in smaller hospitals may be explained by several factors. First, the fixed costs of implementing ESG and DX can be disproportionately high relative to their limited revenue base. Second, smaller hospitals often operate with narrower margins, meaning that short-term investments in ESG/DX reduce profitability even if they bring operational or reputational benefits. Third, these hospitals may prioritize compliance or legitimacy through disclosure rather than immediate financial gain. Together, these mechanisms suggest that while short-term profitability is negatively affected, ESG/DX initiatives may foster long-term resilience and efficiency. These results resonate with prior findings that sustainability-oriented initiatives often involve an initial cost burden but can yield longer-term organizational benefits [45].
Second, for all hospital groups, high effectiveness contributed to efficiency. The correlation between efficiency and healthcare quality, such as effectiveness and safety, has varied, with the correlation varying positively or negatively depending on the hospital size or being weak [46,47]. These differences may be due to differences in the variables used and differences in the healthcare systems in different countries. The regression model also showed that effectiveness contributed to efficiency in hospitals, regardless of hospital size. In rehabilitation hospitals, greater effectiveness contributed negatively to ROA. These findings suggested that ROA could be significantly reduced to increase the effectiveness of rehabilitation hospitals. Thus, we cautiously interpret this result as a potential trade-off between financial performance and quality outcomes, which should be tested in future longitudinal or cross-country studies.
This study has several limitations. First, the analysis is based on hospitals within a single region of Japan, which constrains the generalizability of the findings. Given the specific characteristics of the Japanese healthcare system, such as universal public medical insurance and relatively standardized service provision, the results should be interpreted with caution and may only reflect the situation in the Japanese context. Future research should validate these findings in other international contexts with different healthcare systems. Second, this study relies on cross-sectional data, as healthcare sector statistics are typically published in long intervals (e.g., five years rather than annually). Moreover, the hospitals with available data are generally relatively well-performing institutions. Although the DEA model provides relative efficiency estimates and can distinguish different levels of sustainability, the findings may not fully capture the characteristics and challenges of smaller-scale hospitals. Future studies should aim to expand the temporal coverage by constructing longitudinal datasets or by collecting original survey data, including information from smaller local clinics, to provide richer historical and comparative insights. Third, the ESG and DX indicators employed in this study are disclosure-based and do not necessarily reflect actual performance. While disclosure remains an important step toward transparency, performance-based quantitative measures are required to provide more practical implications. In particular, incorporating LCA databases and developing social LCA models would allow for more rigorous evaluation of the environmental and social impacts of hospital operations. Future research should therefore integrate performance-oriented ESG/DX data with robust sustainability assessment frameworks to strengthen the empirical basis and policy relevance of hospital sustainability evaluation.

6. Conclusions

Hospital sustainability issues, including ESG concerns, are often overlooked in the public sector, particularly from an investment standpoint. Despite the prevalence of responsible investment in recent years, our findings indicate that hospitals may encounter similar ESG challenges as other businesses in the short term. However, evaluating the value of hospitals beyond the capital market presents a challenge. Given that the Japanese healthcare system is predominantly publicly funded with uniform service standards, the findings may not fully generalize to countries with more market-based or decentralized healthcare systems. However, the framework may be adaptable to other settings with appropriate contextual adjustments. This study provides initial evidence for the hypotheses proposed in the Introduction: (H1) ESG/DX are positively associated with hospital sustainability, (H2) ESG/DX are positively associated with efficiency and effectiveness, and (H3) their effects vary by institutional characteristics. While effectiveness and ESG/DX improve efficiency, they may reduce short-term profitability in smaller and rehabilitation hospitals. Future studies should address these limitations with broader data, but our multidimensional index demonstrates both theoretical and practical value for advancing hospital sustainability.

Practical and Policy Implications

Building on these findings, several policy implications emerge. First, to address the tension between short-term profitability and long-term sustainability goals, government agencies should consider introducing incentive schemes (e.g., targeted subsidies or performance-based reimbursements) that encourage hospitals—especially small-scale and rehabilitation facilities—to invest in ESG and digital transformation (DX) initiatives. Second, in light of the public nature of the Japanese healthcare system, policymakers should incorporate ESG/DX indicators into existing planning and monitoring instruments, such as the Hospital Function Survey, to facilitate more systematic assessment and benchmarking of hospital sustainability performance across regions. Third, given the heterogeneous effects of ESG/DX across institutional types, a “one-size-fits-all” approach is unlikely to be effective. Instead, policy guidelines should be tailored to the operational realities of different hospital categories (e.g., acute care vs. rehabilitation) in order to ensure both efficiency and equitable outcomes. Finally, as sustainability considerations gain increasing attention in healthcare governance, there is a growing need for integrated reporting frameworks that explicitly recognize the social value of hospitals beyond capital market performance. Establishing such frameworks would enhance transparency, facilitate stakeholder engagement, and promote more sustainable healthcare delivery systems.

Supplementary Materials

The following supporting information can be downloaded at: https://www.mdpi.com/article/10.3390/su17198787/s1, Table S1: Sustainability assessment items; Table S2: Basic statistics by hospital group; Table S3: Estimated hospital performance by region.

Author Contributions

Conceptualization, all authors; methodology, all authors; software, J.X.; validation, J.X. and K.K.; formal analysis, M.T., J.X. and K.K.; investigation, all authors; data curation, M.T. and J.X.; writing—original draft preparation, all authors; writing—review and editing, all authors; visualization, M.T. and J.X.; supervision, S.M.; project administration, M.T.; funding acquisition, J.X. and S.M. All authors have read and agreed to the published version of the manuscript.

Funding

This work was supported by JSPS KAKENHI Grant Number JP20H00648 and JP24K16420.

Institutional Review Board Statement

Not applicable.

Informed Consent Statement

Not applicable.

Data Availability Statement

The data presented in this study include datasets purchased from Nikkei Media Marketing Inc. (https://www.nikkeimm.co.jp/ (accessed on 1 December 2023)) and are therefore not publicly available due to licensing restrictions. Access to these data is subject to the terms and conditions of the data provider and cannot be shared by the authors.

Acknowledgments

We sincerely thank Yuichi Nakama, Fumiya Tanaka, Tomoki Shirakawa, Yuki Iwabuchi, and Hironobu Kitazato of Inclusive City Co. for their assistance in scraping ESG and DX information from the hospital websites. We sincerely thank Jungmi Choi for her help in organizing the literature.

Conflicts of Interest

The authors declare no conflicts of interest.

References

  1. Friede, G.; Busch, T.; Bassen, A. ESG and financial performance: Aggregated evidence from more than 2000 empirical studies. J. Sustain. Financ. Investig. 2015, 5, 210–233. [Google Scholar] [CrossRef]
  2. Matos, P. ESG and Responsible Institutional Investing Around the World: A Critical Review; CFA Institute Research Foundation: Charlottesville, VA, USA, 2020. [Google Scholar]
  3. Li, T.-T.; Wang, K.; Sueyoshi, T.; Wang, D.D. ESG: Research progress and future prospects. Sustainability 2021, 13, 11663. [Google Scholar] [CrossRef]
  4. McGain, F.; Naylor, C. Environmental sustainability in hospitals—A systematic review and research agenda. J. Health Serv. Res. Policy 2014, 19, 245–252. [Google Scholar] [CrossRef]
  5. Sepetis, A. Sustainable finance in sustainable health care system. Open J. Bus. Manag. 2020, 8, 262–281. [Google Scholar] [CrossRef]
  6. Nakielski, M.L. Moving Forward with ESG, Sustainability, and Corporate Responsibility. Front. Health Serv. Manag. 2023, 40, 33–39. [Google Scholar] [CrossRef]
  7. Ministry of Health, Labour and Welfare. Overview of the Japanese Health Care System. 2023. Available online: https://www.mhlw.go.jp/stf/seisakunitsuite/bunya/kenkou_iryou/iryouhoken/iryouhoken01/index.html (accessed on 1 December 2023).
  8. Ferreira, D.; Marques, R. Do quality and access to hospital services impact on their technical efficiency? Omega 2019, 86, 218–236. [Google Scholar] [CrossRef]
  9. Kao, C.; Pang, R.-Z.; Liu, S.-T.; Bai, X.-J. Most productive types of hospitals: An empirical analysis. Omega 2021, 99, 102310. [Google Scholar] [CrossRef]
  10. Cimprich, A.; Young, S.B. Environmental footprinting of hospitals: Organizational life cycle assessment of a Canadian hospital. J. Ind. Ecol. 2023, 27, 1335–1353. [Google Scholar] [CrossRef]
  11. Mushtaq, M.H.; Noor, F.; Mujtaba, M.A.; Asghar, S.; Yusuf, A.A.; Soudagar, M.E.M.; Hussain, A.; Badran, M.F.; Shahapurkar, K. Environmental performance of alternative hospital waste management strategies using life cycle assessment (LCA) approach. Sustainability 2022, 14, 14942. [Google Scholar] [CrossRef]
  12. Ed-Dafali, S.; Adardour, Z.; Derj, A.; Bami, A.; Hussainey, K. A PRISMA-Based Systematic Review on Economic, Social, and Governance Practices: Insights and Research Agenda. Bus. Strategy Environ. 2025, 34, 1896–1916. [Google Scholar] [CrossRef]
  13. Singhania, M.; Bhan, I.; Seth, S. Digitalisation and firm-level ESG performance and disclosures: A scientometric review and research agenda. Int. J. Financ. Econ. 2025. [Google Scholar] [CrossRef]
  14. Keeley, A.R.; Chapman, A.J.; Yoshida, K.; Xie, J.; Imbulana, J.; Takeda, S.; Manag, S. ESG metrics and social equity: Investigating commensurability. Front. Sustain. 2022, 3, 920955. [Google Scholar] [CrossRef]
  15. Xie, J.; Tanaka, Y.; Keeley, A.R.; Fujii, H.; Managi, S. Do investors incorporate financial materiality? Remapping the environmental information in corporate sustainability reporting. Corp. Soc. Responsib. Environ. Manag. 2023, 30, 2924–2952. [Google Scholar] [CrossRef]
  16. Sarkis, J. Corporate Environmental Sustainability and DEA. In Handbook of Operations Analytics Using Data Envelopment Analysis; International Series in Operations Research & Management Science; Springer: Boston, MA, USA, 2016; pp. 483–498. [Google Scholar]
  17. İlgün, G.; Konca, M. Assessment of efficiency levels of training and research hospitals in Turkey and the factors affecting their efficiencies. Health Policy Technol. 2019, 8, 343–348. [Google Scholar] [CrossRef]
  18. Zheng, D.; Gong, J. Impacts of comprehensive reform on the efficiency of Guangdong’s county public hospitals in 2014–2019, China. Health Policy Technol. 2022, 11, 100676. [Google Scholar] [CrossRef]
  19. Top, M.; Konca, M.; Sapaz, B. Technical efficiency of healthcare systems in African countries: An application based on data envelopment analysis. Health Policy Technol. 2020, 9, 62–68. [Google Scholar] [CrossRef]
  20. Yetim, B.; Sönmez, S.; Konca, M.; İlgün, G. Benchmarking countries’ technical efficiency using AHP-based weighted slack-based measurement (W-SBM): A cross-national perspective. Health Policy Technol. 2023, 12, 100782. [Google Scholar] [CrossRef]
  21. Zhou, H.; Yang, Y.; Chen, Y.; Zhu, J. Data envelopment analysis application in sustainability: The origins, development and future directions. Eur. J. Oper. Res. 2018, 264, 1–16. [Google Scholar] [CrossRef]
  22. Ferrier, G.D.; Trivitt, J.S. Incorporating quality into the measurement of hospital efficiency: A double DEA approach. J. Product. Anal. 2013, 40, 337–355. [Google Scholar] [CrossRef]
  23. Freeman, R.E. Strategic Management: A Stakeholder Approach; Cambridge University Press: Cambridge, UK, 2010. [Google Scholar]
  24. Lys, T.; Naughton, J.P.; Wang, C. Signaling through corporate accountability reporting. J. Account. Econ. 2015, 60, 56–72. [Google Scholar] [CrossRef]
  25. Spence, M. Signaling in retrospect and the informational structure of markets. Am. Econ. Rev. 2002, 92, 434–459. [Google Scholar] [CrossRef]
  26. Zerbini, F. CSR initiatives as market signals: A review and research agenda. J. Bus. Ethics 2017, 146, 1–23. [Google Scholar] [CrossRef]
  27. Xie, J.; Nozawa, W.; Yagi, M.; Fujii, H.; Managi, S. Do environmental, social, and governance activities improve corporate financial performance? Bus. Strategy Environ. 2019, 28, 286–300. [Google Scholar] [CrossRef]
  28. Billi, A.; Bernardo, A. The effects of digital transformation, IT innovation, and sustainability strategies on firms’ performances: An empirical study. Sustainability 2025, 17, 823. [Google Scholar] [CrossRef]
  29. Solimene, S.; Coluccia, D.; Fontana, S.; Bernardo, A. Formal Institutions and Voluntary CSR/ESG Disclosure: The Role of Institutional Diversity and Firm Size. Corp. Soc. Responsib. Environ. Manag. 2025, 32, 5147–5166. [Google Scholar] [CrossRef]
  30. Solimene, S.; Coluccia, D.; Fontana, S.; Gulluscio, C.; Bernardo, A.; Carnegie, G.D. Discerning the state of the art in Italy of voluntary disclosure on biodiversity and endemic species. Meditari Account. Res. 2024, 32, 2348–2395. [Google Scholar] [CrossRef]
  31. Ozcan, Y.A. Health Care Benchmarking and Performance Evaluation; Springer: Berlin, Germany, 2014. [Google Scholar]
  32. Chen, P.-C.; Yu, M.-M.; Chang, C.-C.; Hsu, S.-H.; Managi, S. The enhanced Russell-based directional distance measure with undesirable outputs: Numerical example considering CO2 emissions. Omega 2015, 53, 30–40. [Google Scholar] [CrossRef]
  33. Toloo, M.; Tone, K.; Izadikhah, M. Selecting slacks-based data envelopment analysis models. Eur. J. Oper. Res. 2023, 308, 1302–1318. [Google Scholar] [CrossRef]
  34. Banker, R.D.; Charnes, A.; Cooper, W.W. Some models for estimating technical and scale inefficiencies in data envelopment analysis. Manag. Sci. 1984, 30, 1078–1092. [Google Scholar] [CrossRef]
  35. Barros, C.P.; Managi, S.; Matousek, R. The technical efficiency of the Japanese banks: Non-radial directional performance measurement with undesirable output. Omega 2012, 40, 1–8. [Google Scholar] [CrossRef]
  36. Du, J.; Wang, J.; Chen, Y.; Chou, S.-Y.; Zhu, J. Incorporating health outcomes in Pennsylvania hospital efficiency: An additive super-efficiency DEA approach. Ann. Oper. Res. 2014, 221, 161–172. [Google Scholar] [CrossRef]
  37. Tone, K. A slacks-based measure of efficiency in data envelopment analysis. Eur. J. Oper. Res. 2001, 130, 498–509. [Google Scholar] [CrossRef]
  38. Tone, K. Variations on the theme of slacks-based measure of efficiency in DEA. Eur. J. Oper. Res. 2010, 200, 901–907. [Google Scholar] [CrossRef]
  39. Cooper, W.W.; Seiford, L.M.; Tone, K. Data Envelopment Analysis: A Comprehensive Text with Models, Applications, References and DEA-Solver Software; Springer: Berlin, Germany, 2000. [Google Scholar]
  40. Halkos, G.; Petrou, K.N. Treating undesirable outputs in DEA: A critical review. Econ. Anal. Policy 2019, 62, 97–104. [Google Scholar] [CrossRef]
  41. Tone, K. A slacks-based measure of super-efficiency in data envelopment analysis. Eur. J. Oper. Res. 2002, 143, 32–41. [Google Scholar] [CrossRef]
  42. Tone, K. On the Consistency of Slacks-based Measure-max Model and Super-slacks-based Measure Model. Univers. J. Manag. 2017, 5, 160–165. [Google Scholar] [CrossRef]
  43. Carini, E.; Gabutti, I.; Frisicale, E.M.; Di Pilla, A.; Pezzullo, A.M.; de Waure, C.; Cicchetti, A.; Boccia, S.; Specchia, M.L. Assessing hospital performance indicators. What dimensions? Evidence from an umbrella review. BMC Health Serv. Res. 2020, 20, 1038. [Google Scholar] [CrossRef]
  44. Kotsantonis, S.; Pinney, C.; Serafeim, G. ESG integration in investment management: Myths and realities. J. Appl. Corp. Financ. 2016, 28, 10–16. [Google Scholar] [CrossRef]
  45. Khanchel, I.; Lassoued, N. ESG disclosure and the cost of capital: Is there a ratcheting effect over time? Sustainability 2022, 14, 9237. [Google Scholar] [CrossRef]
  46. Davis, P.; Milne, B.; Parker, K.; Hider, P.; Lay-Yee, R.; Cumming, J.; Graham, P. Efficiency, effectiveness, equity (E3). Evaluating hospital performance in three dimensions. Health Policy 2013, 112, 19–27. [Google Scholar] [CrossRef]
  47. Gok, M.S.; Sezen, B. Analyzing the ambiguous relationship between efficiency, quality and patient satisfaction in healthcare services: The case of public hospitals in Turkey. Health Policy 2013, 111, 290–300. [Google Scholar] [CrossRef]
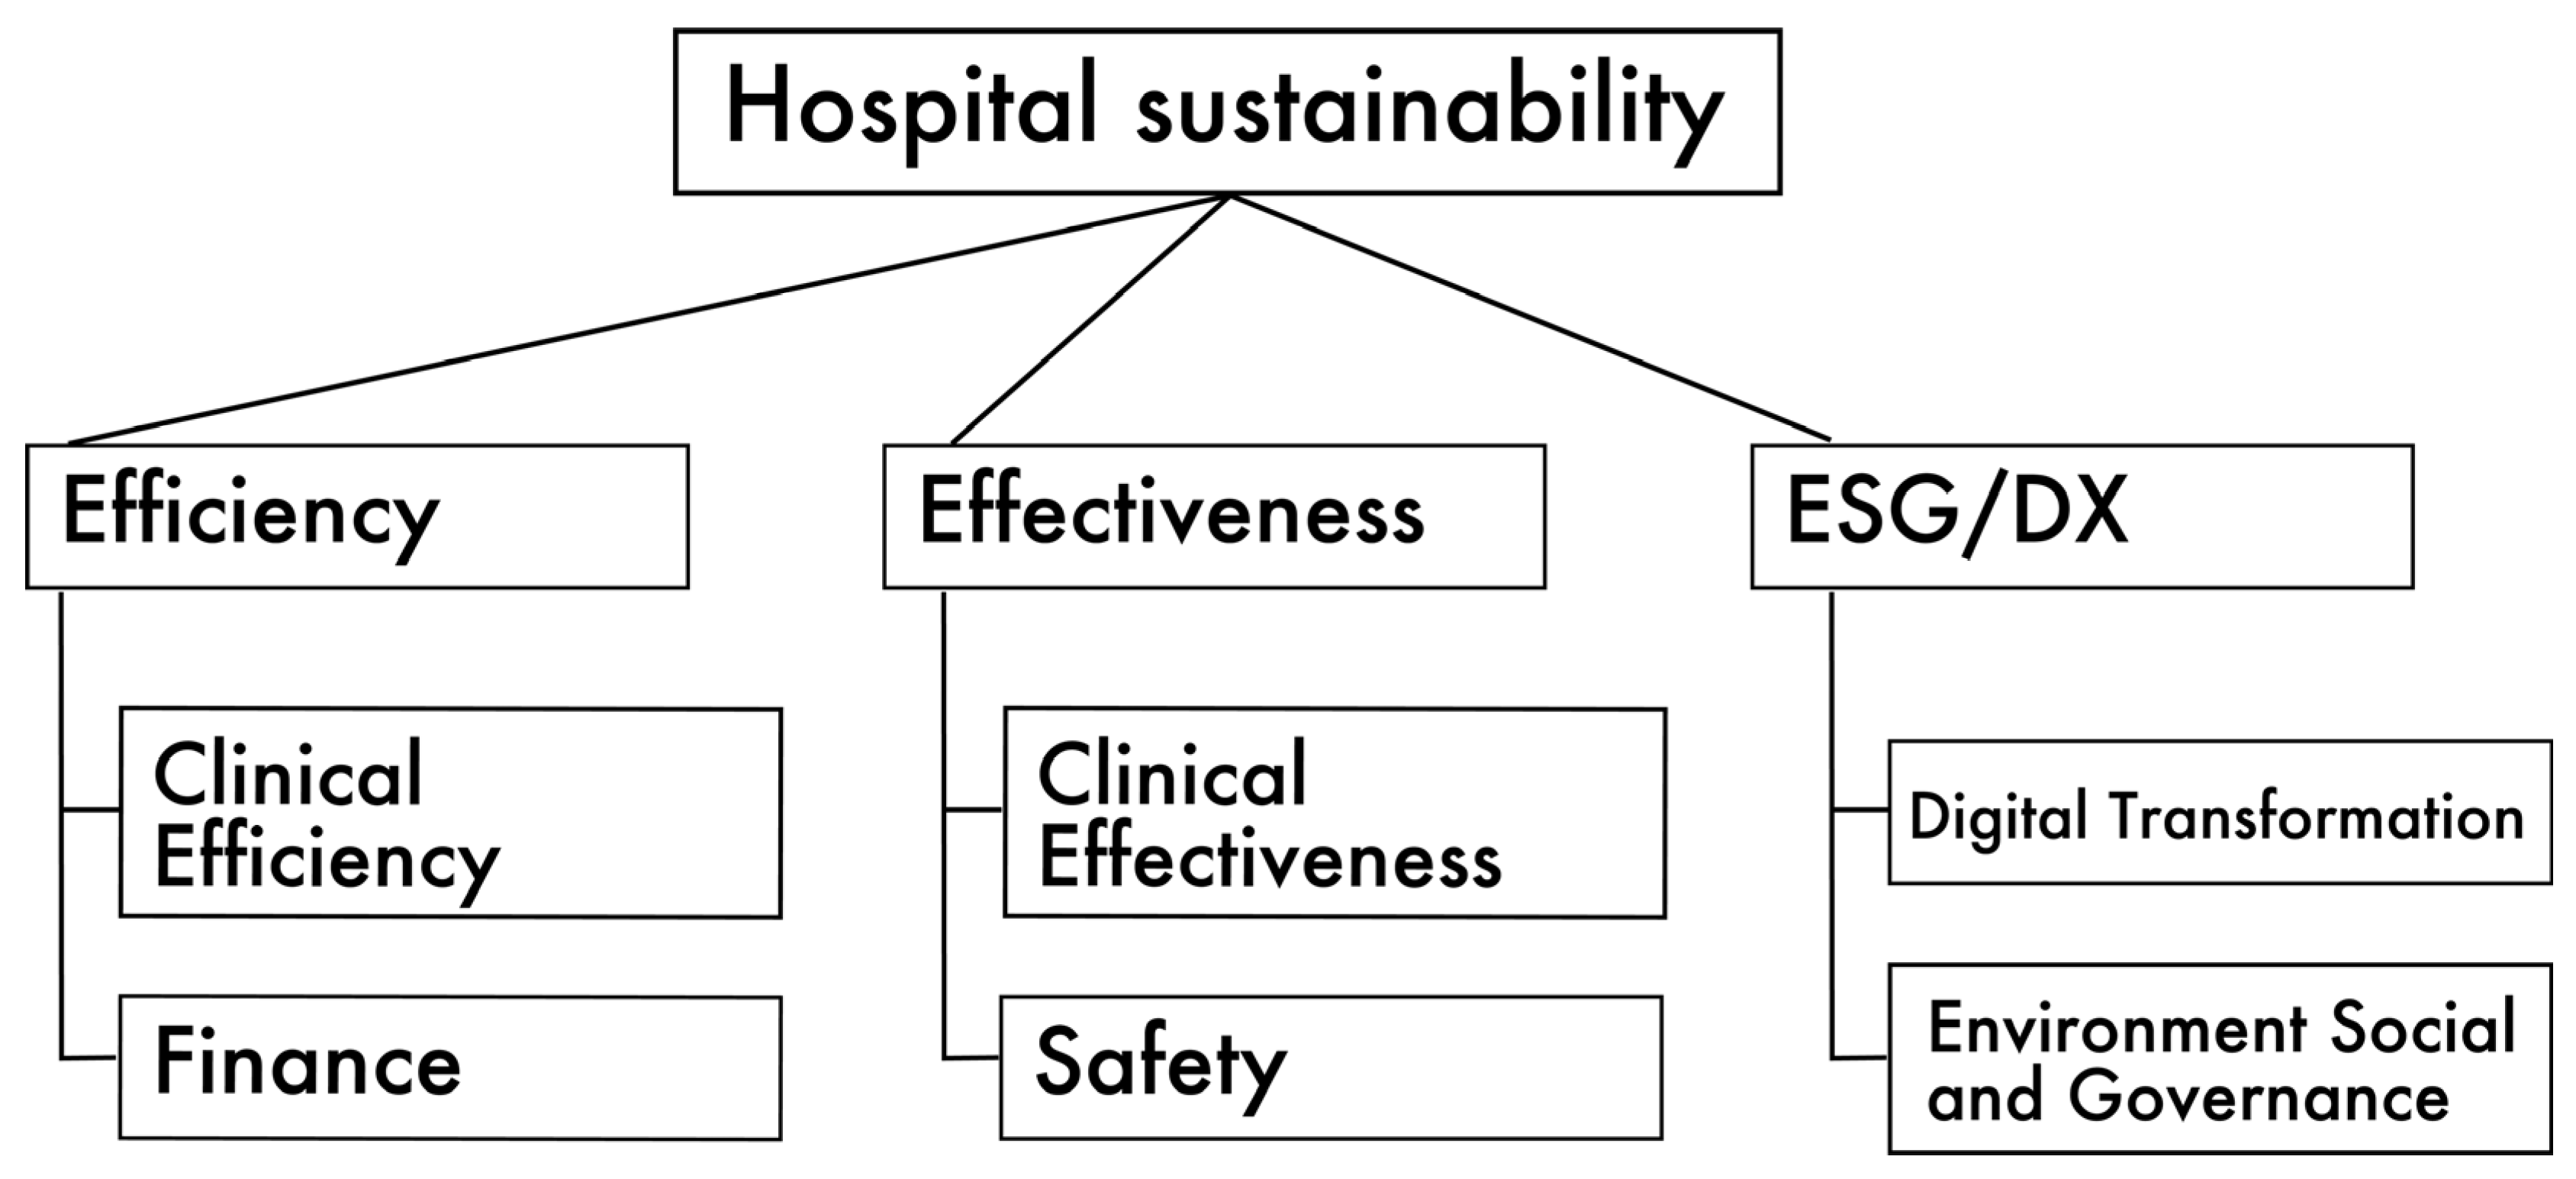
Figure 1. Conceptual image of the hospital sustainability index, dimensions, and assessment items.
Sustainability 17 08787 g001
Figure 2. The analysis was performed for 155 hospitals in the Kyushu region of Japan.
Sustainability 17 08787 g002
Figure 3. Correlations between hospital performance scores. This figure presents the correlations between hospital performance scores. The numerical values indicate the correlation coefficients, while the colored ellipses illustrate the magnitude and direction of the correlations.
Sustainability 17 08787 g003
Figure 4. Distribution of hospital performance scores by region. This figure shows the distribution of estimated hospital performance scores (efficiency, effectiveness, ESG/DX, and sustainability) across sub-regions. Most hospitals cluster around a score of 1, with relatively well-performing hospitals more frequently located in Fukuoka.
Sustainability 17 08787 g004
Figure 5. Inefficiency of inputs/outputs by hospital group. This figure illustrates the distribution of decomposed inefficiency by input and output indicators and by different types of hospital. Higher variation indicates evident difference among investigated hospitals.
Sustainability 17 08787 g005
Table 1. Basic statistics of the estimated results by hospital group and financial indicators. Descriptive statistics by hospital group can be found in Supplementary Table S2.
IndicatorsSub-IndicatorsMeanSDMinMaxVariable TypeEfficiencyEffectivenessESG/DXSustainability
Number of beds 170.71128.3227.001137.00InputYesYesYesYes
Number of doctors 22.3828.053.73270.80InputYesYesYesYes
Number of employees 254.07208.5826.001658.00InputYesYesYesYes
Number of outpatients 172.96140.051.97842.86OutputYesYes Yes
Number of inpatients 151.98107.398.65718.05OutputYesYes Yes
Average days of inpatient 54.6864.954.50556.93Undesirable outputYesYes Yes
Clinical effectiveness 8.560.526.849.61Output Yes Yes
Quality improvement2.760.292.003.40
Medical treatment2.910.132.423.09
Clinical function2.900.182.183.33
Safety 5.490.414.466.33Output Yes Yes
Patient safety2.830.152.313.23
Infection control2.660.312.003.33
Digital transformation 1.741.121.007.00Output YesYes
EnvironmentalEnvironmental disclosure2.121.221.008.00Output YesYes
Social 9.912.814.4317.00Output YesYes
Social disclosure4.082.670.0011.00
Local collaboration2.910.342.004.00
Accessibility2.920.182.433.43
Governance 5.691.302.488.23Output YesYes
Governance disclosure2.901.260.005.00
Governance assessment2.790.182.233.23
Fixed assets (million JPY) 4734.446324.3364.9634,453.41InputYes YesYes
Current assets (million JPY) 2729.273968.14226.6824,461.30Input YesYes
Operation cost (million JPY) 5363.986967.41411.4235,298.21InputYes YesYes
Revenue (million JPY) 5566.287406.41335.5037,262.28Output Yes
Table 2. Basic statistics of the estimated results by hospital group and financial indicators.
# of HospitalsMeanSDMinMax
Full sample
 Efficiency score1550.930.330.042.38
 Effectiveness score1550.970.200.071.54
 ESG/DX score1550.890.360.262.05
 Sustainability score1551.090.170.132.04
 ROA (%)1551.385.18−20.5829.54
 Leverage (%)154192.25203.113.57586.14
Group 1 hospital
 Efficiency score840.840.330.042.38
 Effectiveness score840.910.20.071.37
 ESG/DX score840.770.350.261.93
 Sustainability score841.050.180.132.04
Group 2 hospital
 Efficiency score301.080.240.741.84
 Effectiveness score301.030.160.741.52
 ESG/DX score301.070.290.312.05
 Sustainability score301.130.161.011.82
Rehabilitation hospital
 Efficiency score200.980.30.281.4
 Effectiveness score201.010.210.581.54
 ESG/DX score201.050.340.291.71
 Sustainability score201.140.111.011.39
Chronic hospital
 Efficiency score211.050.360.321.77
 Effectiveness score211.060.190.521.54
 ESG/DX score210.980.380.31.79
 Sustainability score211.170.191.021.7
Notes: The financial leverage is winsorized at the levels of 10% and 90%.
Table 3. Relationship between ESG performance, effectiveness, and efficiency scores.
Dependent Variable: Efficiency
Full SampleGroup 1
Hospital
Group 2
Hospital
Rehabilitation HospitalChronic-Care Hospital
ESG/DX0.092 *0.129 *−0.0090.196−0.245
(0.054)(0.077)(0.121)(0.182)(0.168)
Effectiveness1.184 ***1.185 ***1.354 ***1.086 ***1.155 ***
(0.094)(0.133)(0.253)(0.270)(0.363)
Hospital group fixedYes
Location fixedYesYesYesYesYes
Observations15584302021
R20.6090.5750.7130.6720.74
Adjusted R20.5790.5290.6030.4810.599
Notes: * p < 0.1; *** p < 0.01.
Table 4. Relationship between ESG performance, financial effectiveness, and ROA.
Dependent Variable: ROA
Full SampleGroup 1 HospitalGroup 2 HospitalRehabilitation HospitalChronic-Care Hospital
ESG/DX−2.208 *−4.189 **−0.793−3.802 *−1.358
(1.218)(1.863)(3.463)(1.982)(2.660)
Effectiveness−0.882−2.1312.378−7.479 **−0.277
(2.137)(3.237)(7.199)(2.952)(5.209)
Leverage−0.005 **−0.004−0.008 *−0.007 *−0.005
(0.002)(0.003)(0.005)(0.003)(0.005)
Hospital group fixedYes
Location fixedYesYesYesYesYes
Observations15484301921
R20.1820.2130.3180.6940.516
Adjusted R20.1120.1170.0110.4490.193
Notes: * p < 0.1; ** p < 0.05.
Table 5. Concise summary of main regression and correlation results.
Outcome VariableKey Explanatory FactorsMain ResultsHospital Group Differences
Correlations among scoresEfficiency, Effectiveness, SustainabilityStrong positive correlationsConsistent across groups
ESG/DXWeaker but still positive correlations with other scoresHigher variance: ESG/DX awareness still limited in most hospitals
EfficiencyEffectivenessPositive and significant for all hospital groupsConsistent across groups
ESG/DXPositive relationship with efficiencySignificant in small–middle-scale hospitals (Group 1); not significant in other hospitals
ROA
(Profitability)
EffectivenessNegative association with ROASignificant in rehabilitation hospitals; not significant in other hospitals
ESG/DXNegative association with ROAStronger in small–middle-scale (Group 1) and rehabilitation hospitals; not significant in other hospitals
Disclaimer/Publisher’s Note: The statements, opinions and data contained in all publications are solely those of the individual author(s) and contributor(s) and not of MDPI and/or the editor(s). MDPI and/or the editor(s) disclaim responsibility for any injury to people or property resulting from any ideas, methods, instructions or products referred to in the content.