Abstract
Whether voluntary carbon markets can effectively contribute to climate mitigation remains a debated issue. Taking Chinese Certified Emission Reduction (CCER) projects as a quasi-natural experiment, this study employed a difference-in-difference approach calibrated with a county-level panel dataset spanning 2008–2021 to examine the carbon abatement effect of CCER projects. The results show that CCER projects reduced county-level emissions by 2.8%, though this reduction falls short of the levels self-declared by project developers, implying the possibility of overstating emission reductions. The carbon abatement effect is more pronounced in biogas projects and projects verified by large agencies, underscoring the mitigation potential of biogas deployment as well as the importance of professional expertise in enhancing project quality. In addition, CCER projects generate a range of socio-economic benefits, including raising income, creating employment opportunities, and preserving farmland. Overall, this study identified the effectiveness of voluntary carbon markets, providing valuable insights for fostering their further sustainable development.
1. Introduction
Agriculture and forestry account for approximately 20–25% of net global greenhouse gas emissions and face urgent mitigation demands in alignment with carbon neutrality goals [1]. Achieving the mitigation potentials in agriculture and forestry necessitates ambitious and practical environmental policies on carbon abatement [2]. Among various policy instruments, market-based mechanisms such as carbon markets have received considerable attention due to their cost-effectiveness, design flexibility, and dynamic incentives [3]. Carbon markets are generally categorized into mandatory and voluntary markets. Mandatory carbon markets, also known as the emissions trading systems (ETSs), primarily target energy-intensive industries and generally exclude agriculture or forestry. Voluntary carbon markets operate as offset projects that reduce emissions and generate carbon credits, which can be voluntarily purchased by other entities to offset their own emissions. Project developers can sell credits to obtain financial returns. Voluntary carbon markets cover a wide range of sectors, with agriculture and forestry being particularly important domains. Most voluntary carbon markets, such as the Clean Development Mechanism (CDM), the Verified Carbon Standard, and the Reducing Emissions from Deforestation and Degradation (REDD+), all include various agricultural or afforestation activities [4].
In China, the primary form of the voluntary carbon market is the Chinese Certified Emission Reduction (CCER) programme, which began registering projects in 2014, was suspended in 2017, and was relaunched in 2024. China has developed 143 CCER projects in the agriculture and forestry sectors. This large-scale practice makes China’s experience highly representative in the global voluntary carbon market landscape [5].
While all voluntary offset projects pledge to achieve carbon abatement, their actual effectiveness is a matter of debate. Theoretically, insufficient farmer engagement, methodological flaws, and regulatory gaps could compromise the intended outcomes [5]. In practice, the performance of voluntary carbon markets varies considerably. The CDM significantly reduced both greenhouse gas emissions and local air pollution [6]. In contrast, voluntary REDD+ projects fell short of their stated carbon reduction ambitions [7]. With many CCER projects already registered in China and the programme set to scale up after its relaunch in 2024, assessing whether these projects deliver their claimed emission reductions is crucial for safeguarding the effectiveness of voluntary carbon markets and ensuring the credibility of climate mitigation.
A growing body of literature has qualitatively discussed the effectiveness of CCER projects. The adoption of established CDM methodologies and the demand generated by mandatory carbon markets have facilitated the implementation of CCER projects [5]. However, limited farmer participation, a lack of risk prevention mechanisms, and difficulty in verifying additionality pose significant challenges to their sustained operation [8]. Compared to qualitative insight, quantitative evidence remains scarce. Zhang and Zheng [9] found that CCER adoption was associated with improvements in urban greening, as indicated by city-level panel data. Yu et al. [10] used remote sensing data to evaluate afforestation projects and reported significant forest gains in CCER areas. As direct measurement of carbon emissions is challenging, these studies relied on proxies such as the Normalized Difference Vegetation Index (NDVI), which fell short of providing overwhelming evidence of carbon abatement. More importantly, even if CCER projects substantially increase vegetation cover, such proxies cannot be directly compared with the emission reductions claimed by project developers, leaving the actual mitigation effectiveness of CCER projects largely unknown.
Therefore, the objective of this study is to assess whether CCER projects have achieved their intended mitigation outcomes. This study initially hand-collected a dataset of all registered CCER projects in these sectors as well as their key indicators. The packaged dataset provides a foundation to analyze the characteristics of CCER projects. We then employed satellite-based raster emissions data to identify the carbon abatement effect of CCER projects, with detailed analyses of heterogeneity across project types and verification agencies. Finally, in light of project developers’ frequent claims that CCER projects can generate multiple co-benefits, we also examined several key socio-economic benefits, including income increase, employment creation, and farmland preservation.
Our study presented three main contributions. First, we examined whether voluntary carbon markets can achieve substantial carbon abatement from the perspective of CCER projects. Voluntary carbon markets are essentially designed as climate mitigation instruments, yet their actual effectiveness remains contested. Existing research has primarily focused on certain voluntary mechanisms such as the CDM, while paying less attention to the CCER, which has issued a larger number of projects in agriculture and forestry. However, as emission reductions are often unaccountable and unverifiable, some studies have tended to focus solely on the policy impacts on vegetation cover, without providing decisive evidence on actual emission reductions. By integrating satellite-based emissions data and using econometric models, we offered robust ex-post evidence of the carbon abatement effect of CCER projects.
Second, our comparison between self-declarations and ex-post evaluations reveals the possibility of overstated emission reductions in voluntary carbon markets. Through the manual collection of information from Project Design Documents (PDDs), we compared project developers’ ex ante claims with ex-post evaluations. This comparison reveals potential overstatements of emission reductions, particularly in biogas projects. These findings contribute to strengthening the oversight of biogas methodologies and to ensuring stricter management of voluntary carbon markets.
Finally, we highlighted the socio-economic benefits of voluntary carbon markets, which have received anecdotal recognition but lack empirical evidence. Since agriculture and forestry projects are often implemented in rural areas, their impacts on local households are critical for securing stakeholder support. Despite this importance, the existing literature has devoted limited attention to these co-benefits, thereby constraining a comprehensive understanding of voluntary carbon markets. Drawing on authoritative county-level data, we found that CCER projects generate significant socio-economic benefits. This underscores their broader value and supports the case for expanding such initiatives to achieve rural sustainable development.
In the context of China’s relaunch of the CCER programme in 2024, our findings highlighted the potential co-benefits of implementing CCER projects in achieving both carbon abatement and rural development. This study illustrated how market-based policies can effectively mobilize farmers and enterprises to actively engage in emission reduction efforts, offering lessons for countries transitioning away from traditional subsidy-driven policies.
The remainder of the paper is organized as follows. Section 2 introduces the policy background of the CCER programme. Section 3 reviews the relevant literature and develops the research hypothesis. Section 4 describes the empirical methodology and data sources. Section 5 presents the regression results on the carbon abatement effects of CCER projects, while Section 6 further examines their socio-economic benefits. Section 7 provides additional validation using high-resolution gridded emission data. Section 8 concludes the main results, discusses policy implications, and outlines directions for future research.
2. Policy Background
Achieving carbon abatement is the central objective of all greenhouse gas mitigation policies, which generally fall into two categories in terms of how they promote emission reductions: command-and-control regulations and market-based instruments. Unlike command-and-control approaches that rely on governmental authority and regulatory mandates, market-based instruments offer greater flexibility and economic incentives, thereby reducing the compliance burden for regulated entities [11]. The voluntary market is a kind of market-based instrument. Under the voluntary market, firms can develop mitigation projects such as afforestation or household biogas systems and obtain credits for the verified volume of emission reductions. These credits can be traded in carbon markets and purchased by other firms to partly offset emissions that exceed their allowance. This mechanism enables direct economic returns from mitigation activities, encouraging firms to actively invest in developing projects to achieve carbon abatement [12].
China has accumulated extensive experience in operating voluntary carbon markets. Since 2006, China has incorporated agriculture into the voluntary carbon market through the CDM. Between 2006 and 2013, China hosted a total of 40 projects in agriculture and forestry, including 35 agricultural projects and 5 afforestation projects. In October 2011, when China announced the establishment of pilot domestic emissions trading systems, the government began actively exploring the development of a domestic voluntary carbon market beyond the CDM. In December 2011, the central government proposed to launch a voluntary carbon market to achieve the emission control goal in the Twelfth Five-Year Plan, and officially introduced the CCER programme in 2012. From 2014 to 2016, 143 agricultural and forestry projects were registered under CCER, which was 3.6 times the number of CDM projects.
Following the establishment of the CCER programme, China’s mandatory and voluntary carbon markets became closely interlinked [13], and jointly contributed to the broader goal of urban sustainable development [14]. Each regulated firm under China’s national ETS was allowed to use CCERs to offset up to 5% of its annual compliance obligations, thereby creating incentives for the development of CCER projects. However, due to methodological irregularities, the issuance of CCERs was suspended in 2017. After the suspension, registered CCER projects continued operating and could be traded on a voluntary basis. On 22 January 2024, the CCER programme was officially relaunched with the establishment of a national voluntary credit trading system and the release of updated methodologies. With the expansion of China’s national ETS to more sectors and rising carbon prices, CCER projects are expected to deliver higher economic returns and an increase in number.
3. Literature Review and Hypothesis Development
Voluntary carbon markets are designed to incentivize emission reductions by allowing project developers to generate tradable credits [15]. These credits can be sold at a specified carbon price to firms regulated by mandatory carbon markets or to organizations seeking to claim emission reductions, which provides financial returns for project developers. According to the theory of marginal abatement cost, given a carbon price, firms with the lowest abatement costs will be most willing to develop projects to earn profits, ensuring that emission reductions are achieved in a cost-effective manner [16]. However, if emission reductions are overstated, project developers can extract excessive profits, making the credibility of carbon abatement a critical concern. To address this issue, voluntary carbon markets typically develop rigorous ex-ante project validation procedures, adopt standardized methodologies to ensure additionality, and mandate third-party verification to safeguard the authenticity of emission reductions. Only verified and approved emission reductions can be issued as tradable credits, thereby underpinning the carbon abatement effect of voluntary carbon markets [17].
Although voluntary carbon markets are designed with rigorous application procedures, methodological standards, and verification systems, their actual effectiveness varies considerably. Ex-post evaluations of mechanisms such as CDM and REDD+ have yielded mixed results, with some significant and others negligible [6,7]. In the agriculture and forestry sectors, existing research has largely concentrated on forestry activities [2], while paying limited attention to the much larger number of agricultural mitigation practices, such as biogas utilization. As a result, the overall effectiveness of voluntary carbon markets in agriculture and forestry necessitates more precise examination and conclusive evidence.
Compared to other voluntary carbon markets, CCER projects in China are more likely to generate reliable emission reductions for the following three reasons. First, China has been one of the largest producers of voluntary emission reduction projects in the world [18]. Prior to implementing the CCER programme, the Chinese government had already developed a large number of CDM projects. The methodologies used in CCER were largely inherited from CDM, providing a solid methodological and operational foundation for CCER implementation [19]. Second, although the CDM framework includes a wide range of methodologies for agricultural and forestry projects, China’s CCER projects in these sectors are relatively specialized, focusing on biogas and afforestation activities. This specialization enhances project quality and strengthens mitigation effectiveness [5]. Third, China has established a national and eight regional emissions trading systems (ETSs), generating strong demand for CCER credits. China’s national ETS allows regulated entities to offset up to 5% of their compliance obligations using CCER credits, without restrictions on the type or origin of CCER projects. Some regional ETSs provide extra preferential policies to encourage ETS entities to purchase local CCER credits [20], which further promotes local project development and facilitates regional emission reductions. Therefore, we proposed the following hypothesis:
Hypothesis 1.
CCER projects contribute to carbon abatement.
4. Methods and Data
4.1. CCER Projects Dataset Development
This study developed a dataset of CCER projects in agriculture and forestry through the following steps. First, we downloaded all available CCER project information from the official website and screened for projects related to agriculture and forestry based on project type. In total, we identified 143 relevant projects and acquired their corresponding PDDs. Second, we extracted key project-level indicators from the PDDs, including project names, developers, types, methodology, crediting periods, verification agencies, registration dates, committed annual emission reductions, provinces, and counties. Finally, given the multiple adjustments to county-level administrative divisions in China, we manually reviewed and updated all project location data to ensure consistency with current official administrative classifications.
4.2. Empirical Strategies
This study combined the CCER projects dataset with other social, economic, and emissions data to construct a county-level panel dataset. Following Zheng and Zhang [9], we adopted a staggered difference-in-difference (DID) strategy to estimate the carbon abatement effect of the CCER policy by Equation (1).
EMISSit denotes the logarithm of greenhouse gas emissions of county i in year t. CCERit is a policy indicator that takes the value of 1 for county-year observations where CCER projects had been implemented after the crediting period, and 0 otherwise. Controlsit represent a set of control variables, including gross domestic product (GDP), the share of first and secondary industry in GDP, population, fiscal stress, the share of tax revenue, county territorial area, education level, grain output, and oilseed output. ui and vt denote the county and year fixed effects, respectively, and εit is the error term.
Notably, counties implementing CCER projects may differ from those that do not in terms of economic conditions and agricultural development. Therefore, we applied a propensity score matching (PSM) method prior to each regression. Following Lu et al. [21], for each treated county, we selected the four most similar counties as the control group. Since CCER projects were preferentially implemented in counties with favourable socio-economic conditions and higher levels of agricultural development, we employed the same set of control variables from our baseline regression as covariates to match counties with the closest characteristics [22]. Among the 2019 counties in the original sample, 143 CCER projects were located in 208 counties that received treatment. We correspondingly selected 951 comparable counties as the control group, resulting in a total final sample of 4128 observations. The matched sample, providing a closer approximation of the true impact, was subsequently employed in the regression.
4.3. Variable Definitions
4.3.1. Dependent Variables
The main dependent variable regarding emissions is EMISS. EMISS denotes county-level greenhouse gas emissions, obtained from the gridded dataset provided by the Emissions Database for Global Atmospheric Research (EDGAR) and aggregated to the county level according to administrative boundaries. A logarithmic transformation was then applied to reduce skewness. This procedure confers several notable advantages. First, EDGAR is a comprehensive database that integrates satellite data with bottom-up, technology-based compilations of country- and sector-specific emission time series, thereby providing reliable emission estimates that are entirely independent of the CCER programme. Second, EDGAR covers the major greenhouse gases, including carbon dioxide, methane, and nitrous oxide, thus fully encompassing the principal sources of agricultural and forestry emissions and offering an objective benchmark to assess carbon abatement effects. Third, CCER projects generate observable emission reductions, and their large scale makes these effects detectable at the county level. Biogas projects are often implemented by thousands of farmers across multiple villages within a county. Aggregating emissions to the county level, therefore, enables us to comprehensively capture these spatially dispersed effects. Finally, compared to existing empirical studies on voluntary carbon markets, which typically rely on city-level panel datasets [23], our county-level dataset offers substantially higher precision and granularity, thereby outperforming prior approaches in data accuracy.
4.3.2. Independent Variables
The core independent variable is CCER. Specifically, CCERit equals 1 if county i has established a CCER project in year t or any subsequent year, and 0 otherwise.
4.3.3. Control Variables
To account for potential confounding effects arising from differences in socio-economic conditions and agricultural development levels across counties, we incorporated a set of control variables. Specifically, we included (1) GDP, since counties with larger GDPs generally exhibit higher emissions as economic growth in China has not yet decoupled from carbon emissions [24]; (2) the share of first and secondary industry in GDP, as agriculture and industry are major sources of greenhouse gas emissions, so a higher share of these sectors is expected to increase emissions [25]; (3) population, as larger populations usually lead to greater emissions; (4) fiscal stress, as counties under higher fiscal stress may have fewer resources for environmental governance, thereby increasing emissions [26]; (5) the share of tax revenue in fiscal income, since a higher tax share indicates more stable local fiscal sources, which may enable greater environmental governance efforts and thus reduce emissions; (6) county territorial area, since larger areas tend to accommodate more economic activities, leading to higher emissions; (7) education level, proxied by secondary school enrollment rates, as better-educated populations are more likely to adopt cleaner technologies and practices, thus expected to reduce emissions [27]; (8) grain and oilseed output, given that larger crop production entails greater fertilizer use and paddy methane emissions, thereby increasing greenhouse gases [28].
Detailed definitions, summary statistics, and expected directions of these variables are presented in Table 1.

Table 1.
Variable definitions, summary statistics, and expected directions.
4.4. Data Sources and Cleaning
The data used in this study are drawn from multiple sources. Project-level information was obtained from the PDDs of CCER projects, which were downloaded from the official website (http://cdm.ccchina.org.cn/, accessed on 15 January 2025) and manually extracted. Grid-level emission data were derived from the EDGAR database (https://edgar.jrc.ec.europa.eu/, accessed on 15 January 2025). County-level socio-economic data were obtained from the Statistical Yearbook of each county.
After obtaining various data, we aggregated the EDGAR gridded greenhouse gas emissions to the county level by averaging emissions per unit of land area on an annual basis and then matched this variable with county-level socio-economic indicators from statistical yearbooks to construct a county–year panel dataset. We further linked CCER project indicators from PDDs to the corresponding counties, enabling us to identify the CCER implementation status and project characteristics at the county level. After integrating the datasets, we applied several data-processing procedures. First, we excluded samples with missing values or outliers in key variables. Second, we employed propensity score matching to select a control group with characteristics similar to those of the treatment group. Finally, we constructed a panel dataset comprising 4128 county–year observations from 2008 to 2021.
5. Results and Discussion
5.1. Features of CCER Projects in Agriculture and Forestry
Figure 1 presents the geographic distribution of 143 CCER projects in agriculture and forestry, overlaid on a map of greenhouse gas emissions in 2022. CCER projects were predominantly concentrated in southern and eastern China with relatively high emission levels. This pattern suggests that regions with greater emissions are more likely to adopt voluntary carbon markets as mitigation policies [29]. Among all provinces, Hubei, Guangxi, and Guizhou stood out as the most active regions in the implementation of the CCER policy, registering 49, 37, and 16 projects, respectively (Figure 2a). The majority of projects (69.2%) had crediting periods of 5 to 7 years, followed by those with a duration of 8 to 19 years (13.3%) (Figure 2b). Projects with a 4-year crediting period accounted for 8.4% and were primarily household biogas projects initiated in 2009 as part of early pilot efforts. A small share of projects (9.1%) had crediting periods exceeding 20 years, most of which are afforestation projects that continuously produce carbon credits after forest planting.
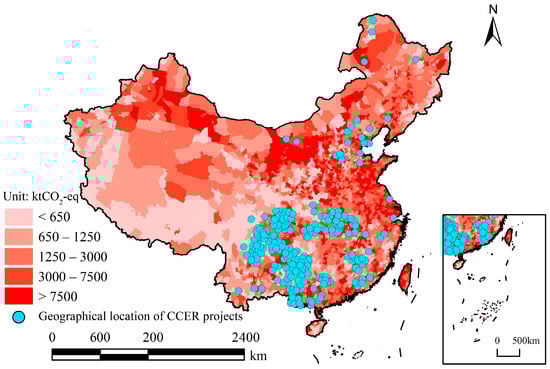
Figure 1.
Geographical location of CCER projects.
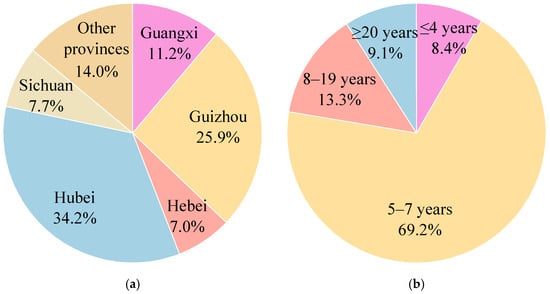
Figure 2.
Distribution of provinces and project types of CCER projects in agriculture and forestry. (a) Distribution of provinces; (b) distribution of project types.
In total, all CCER projects in agriculture and forestry collectively committed to reducing 68.34 MtCO2-eq, which fell into two main categories: biogas and afforestation projects. Although biogas projects were assigned relatively shorter crediting periods, they achieved six times the emission reductions compared to afforestation projects (Figure 3). However, whether these commitments have been realized in practice remains a topic for further investigation. Therefore, in the following sections, we employed econometric models to examine whether CCER projects have indeed delivered measurable emission reductions and contrasted these outcomes with the commitments self-declared by project developers.
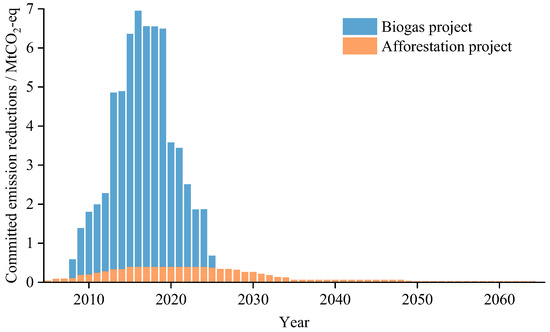
Figure 3.
Annual trend of committed emission reductions in CCER projects in agriculture and forestry.
5.2. Carbon Abatement Effect
To verify Hypothesis 1, we estimated Equation (1), with the results reported in Table 2. Columns (1) and (2) present the baseline regression results without and with control variables, respectively. As shown in the preferred estimates in column 2, CCER projects presented a substantial carbon abatement effect, leading to a 2.8% emission reduction in participating counties, with the coefficient being statistically significant at the 1% level. We further conducted a specification curve analysis by iterating over all possible combinations of the ten control variables (resulting in a total of 1024 regressions) to examine Hypothesis 1 [30]. The estimated coefficients of CCER consistently ranged between –0.032 and –0.026, remaining statistically significant at the 1% level, suggesting that the result is not sensitive to the selection of control variables and thus is highly robust.
Table 2.
Carbon abatement effect of CCER projects on agriculture and forestry.
The DID approach is established under the parallel trends assumption, namely that greenhouse gas emissions between CCER and non-CCER counties do not differ significantly prior to the implementation of CCER projects. We constructed a time-varying version of Equation (1), which allows us to simultaneously test the parallel trends assumption and observe the dynamics of the carbon abatement effect, as shown in Equation (2):
If there are CCER projects implemented in county i within m years before (m < 0) or after (m > 0) its crediting year, then CCERit+m equals 1; otherwise, 0. As shown in Figure 4, prior to the implementation of CCER, there was no significant difference in the greenhouse gas emission trends between the treatment and control groups. The joint test of the coefficients for periods −5 to −2 yields a p-value of 0.217, indicating that the parallel trends assumption cannot be rejected at conventional significance levels. In addition, the dynamic analysis revealed that the carbon abatement effect of CCER was persistent over time, underscoring the long-term effectiveness of CCER as a mitigation policy. This finding suggests that the emission reductions claimed by many projects indeed contributed to sustained local carbon abatement.
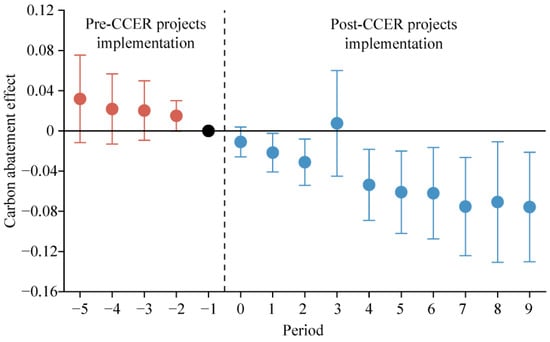
Figure 4.
Parallel trend test and dynamic effect on carbon abatement. Note: The dots represent best estimates, and the error bars denote the 95% confidence intervals.
The carbon abatement effect of the CCER policy varies across project types and verification agencies. Biogas projects significantly reduced greenhouse gas emissions, while afforestation projects showed no significant impact (Columns (1) and (2) of Table 3). This can be attributed to larger uncertainties of emission reductions generated by afforestation projects, as well as the difficulty of capturing carbon sinks from the forestry sector using the EDGAR gridded emission data [31]. To further test the effectiveness of forestry projects, following Zheng and Zhang [1], we employed the logarithm of NDVI as the dependent variable to examine the effect of CCER afforestation projects on county-level average NDVI. As shown in Column (3) of Table 3, CCER projects promoted greening, but the effect was not statistically significant at any conventional level. This finding contrasts with previous estimates at the city level [1]. Given that city administrative areas are considerably larger than project sites and may encompass greening from non-project sources, we suspected that earlier results may have been confounded. Our more precise estimates indicate that the effectiveness of CCER forestry projects cannot be statistically confirmed. In contrast, biogas projects were expected to deliver notable emission reductions between 2008 and 2025, totaling approximately 58.58 MtCO2-eq, with an average annual reduction of 3.25 MtCO2-eq (Figure 3). Biogas utilization has also been demonstrated as an effective approach to resource recycling and emission reductions. It can be widely adopted by large numbers of farmers, offering both strong cost-effectiveness and considerable mitigation potential [32].
Table 3.
Heterogeneity analysis on project types and verification agencies.
Despite both commitment and estimation results supporting the effectiveness of CCER policies, whether self-declared emission reductions exceed actual abatement remains unclear. In REDD+ projects, eligible projects overstated the avoided deforestation and inflated reported emission reductions [7]. Motivated by this concern, we further examined whether the self-declared results of CCER projects are consistent with empirical estimates. Similarly to Luo et al. [33], we calculated the estimated emission reductions for biogas, afforestation, and all CCER projects based on project type, average implementation year, and annual emission reduction rates (Table 4). The results indicate that the total estimated emission reduction in CCER projects was 45.52 MtCO2-eq, which is lower than the self-declared values of 68.34 MtCO2-eq. Specifically, for afforestation projects, the estimated and self-declared reductions were 7.74 and 9.76 MtCO2-eq, respectively, indicating that the self-declared figure is overstated but still within the 95% confidence interval. In contrast, for biogas projects, the estimated and self-declared reductions were 30.27 and 58.58 MtCO2-eq, respectively, with the self-declared value being overstated and falling beyond the 95% confidence interval. This significant overstatement underscores the over-crediting possibility associated with biogas projects, which can be attributed to several practical barriers. First, market surveys indicate that the construction of a digester requires an upfront investment of more than 4000 RMB, while government subsidies cover only about 1500 RMB. Households can only recover their costs after several years of continuous operation, discouraging many farmers from sustained participation [34]. Second, the collection of livestock manure is highly labour-intensive. In CCER projects in Hubei province, with ongoing rural depopulation, some households struggled to secure sufficient feedstock for biogas production. Third, as Chinese regulations mandate composting as the minimum standard for manure management [35], the additionality of diverting manure into biogas production was substantially diminished, which in turn reduced the expected economic returns. Therefore, farmers’ willingness to remain engaged in biogas projects was undermined by insufficient funding, labour, and incentives, thereby reducing the actual effectiveness of biogas projects.
Table 4.
Comparison of self-declaration and ex-post estimation results.
Moreover, project quality is closely linked to the verification agency. Under the CCER framework, project developers are required to estimate expected emission reductions and document them in the PDDs. PDDs, along with emission data, must be reviewed and verified by third-party agencies [36]. In our sample, the two primary agencies responsible for verifying agriculture and forestry projects were the China Quality Certification Centre (CQC) and the China Electronic Product Reliability and Environment Testing Institute (CEPREI). We found that projects verified by these leading agencies exhibited significant emission reductions, whereas projects verified by less prominent agencies led to unapparent carbon abatement (Columns (4)–(6) of Table 3). This suggests that the specialized knowledge of verification agencies plays an important role in ensuring the effective implementation of environmental policies, as emphasized by Yu et al. [37].
5.3. Robustness Checks
5.3.1. Preliminary Tests for Propensity Score Matching
In order to ensure the validity of PSM, it is necessary to conduct pre-matching diagnostics. Two commonly employed diagnostic steps are balance tests of covariates and common support checks. On one hand, we performed covariate balance tests to examine whether the observed characteristics of CCER and non-CCER counties were sufficiently comparable. As shown in Figure 5, before matching, substantial covariate differences existed between the two groups, indicating that simple comparisons would confound the treatment effect. After implementing PSM, the standardized biases of all covariates were reduced to below 10%, suggesting that the matched sample more closely approximates a randomized experiment. On the other hand, we conducted a common support check by comparing the distributions of propensity scores between CCER and non-CCER counties. The distributions of propensity scores became much more similar between the treated and control groups after matching (Figure 6). By removing unmatched observations, we ensured that the matched groups had greater similarity in their covariate profiles, thereby proving the reliability of PSM methods and enhancing the credibility of causal inference [38].
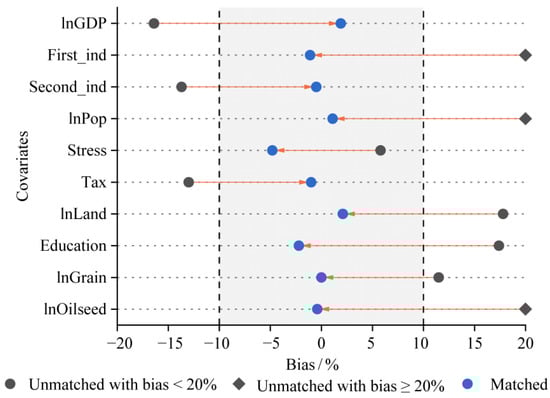
Figure 5.
Covariate balance test for propensity score matching.
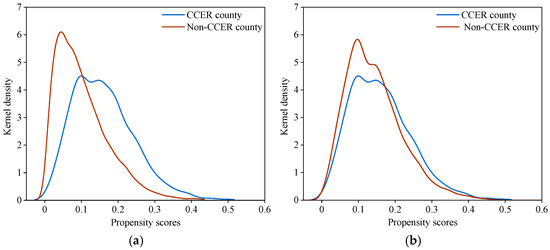
Figure 6.
Common support region for propensity score matching. (a) Before matching; (b) after matching.
5.3.2. Placebo Test
To further validate the reliability of our findings, we conducted a placebo test by randomly assigning CCER treatment status to counties. We randomly selected treated and control counties as pseudo-CCER counties and re-estimated Equation (1) based on this artificial assignment. This procedure was repeated 500 times to generate a distribution of placebo coefficients under the null hypothesis of no policy effect. If the estimated coefficients lie far outside the distribution of these placebo estimates, the observed effects are unlikely to result from random factors. As shown in Figure 7, the estimated CCER coefficient deviates substantially from the distribution of randomly generated coefficients, suggesting that the observed effects are unlikely to be driven by random factors and instead reflect genuine policy intervention.
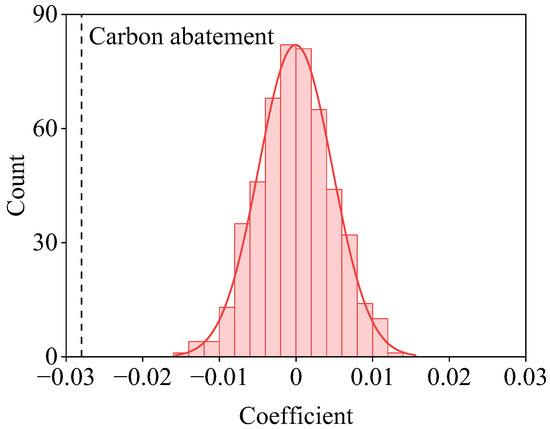
Figure 7.
Placebo test.
5.3.3. Examination of Short-Term Effects
Acknowledging that some projects may have ceased operation due to funding shortages, technical barriers, or a limited willingness to participate among farmers [5], we examined the short-term effects of CCER projects in the first and third years after implementation. Specifically, we separately restricted the sample to include only observations from the year of CCER implementation and within three years thereafter, and re-estimated Equation (1). The results in Table 5 showed that all coefficients remained statistically significant and consistent with our main findings, supporting the short-term effectiveness of CCER policies.
Table 5.
Short-term effects of CCER projects on carbon abatement.
6. Further Discussion on Socio-Economic Benefits
Voluntary carbon markets are widely supported not only for promoting emission reductions, but also for delivering socio-economic benefits, such as higher household income and more job opportunities. In the context of the CCER programme, revenues generated from credit sales are largely redistributed to rural households. For example, in household biogas projects in Hubei Province, local families received half the revenue share as an incentive to adopt and operate biogas digesters [34]. Moreover, households located within project areas can derive economic returns from project-related activities such as the collection of timber and other forest by-products [39]. According to the theory of sustainable livelihoods, changes in livelihood capital can induce shifts in livelihood strategies [40]. The economic incentives provided by CCER projects can encourage farmers to engage more actively in agriculture and livestock rearing, as crop residues and animal manure are essential inputs for biogas production. CCER projects also create a variety of non-agricultural employment opportunities [41], such as forest patrolling and fire prevention, installation and maintenance of household biogas systems, and ecotourism services. These activities provide more diversified employment options for local labour forces, especially in rural areas where formal job opportunities are often limited.
In addition, the impact of CCER projects on land use is also debated. A common concern is that afforestation activities may encroach upon arable land [41]. However, Chinese government enforces strict regulations on farmland protection. Many areas of arable farmland are designated as controlled zones, where afforestation projects are not permitted to overlap [42]. This regulatory framework helps mitigate the risk of farmland loss due to forest expansion. In addition, given that the majority of CCER programme in China are biogas projects, these projects can encourage land cultivation. By providing economic incentives to rural households, biogas projects can motivate farmers to cultivate their land, thereby reducing the risk of farmland abandonment.
Therefore, we examined the socio-economic benefits of CCER projects by identifying whether they increased income, created employment, and helped preserve farmland, as shown in Equations (3)–(5):
where INCit, EMPit, and LANDit represent the logarithm of rural per capita disposable income, the rural employment rate, and the logarithm of farmland area, respectively, reflecting county-level income, employment, and farmland area. Other specifications remain consistent with Equation (1).
Specifically, CCER projects led to a 5.6% increase in rural per capita income and a 1.2% rise in the rural employment rate, with coefficients statistically significant at the 1% and 5% levels, respectively (Columns (1) and (2) of Table 6). These findings lend strong support to the above analyses and are consistent with the commitments of CCER projects. Prior to project registration, developers were mandated to solicit feedback from stakeholders (e.g., local farmers) through in-person meetings or questionnaire surveys. These stakeholders typically expected projects to deliver positive economic and social outcomes. For instance, in the rural biogas project in Renhuai City, Guizhou Province, 98% of surveyed residents believed the project would benefit the local economy, and 96% agreed it would create employment opportunities. The afforestation project initiated by the Daxing’anling Tuqiang Forestry Bureau was fully supported by stakeholders, as it was anticipated to raise the income of workers and create jobs for forest management. Furthermore, while these findings are novel in the context of CCER projects, they have been discussed in relation to other voluntary carbon market mechanisms. Du and Takeuchi [43] found that CDM projects in rural China contributed to income improvement and employment generation. Ottonelli et al. [44] reported similar results in their study of solar photovoltaic CDM projects in Latin America. Our results supplement this important stream of literature by providing new evidence from the CCER policy.
Table 6.
Socio-economic benefits of CCER projects in agriculture and forestry.
We found no evidence that CCER forestry projects displaced farmland. On the contrary, CCER projects significantly increased arable farmland by 22.4% (Column (3) of Table 6). This finding can be attributed to the widespread implementation of biogas projects under CCER, which utilizes agricultural by-products such as manure and crop residues. By generating income for participating households, these projects likely incentivize continued engagement in farming rather than a transition to off-farm employment, thereby promoting farmland preservation [45].
7. Validation on Grid-Level Data
7.1. Validation of Carbon Abatement Effect on Grid-Level Data
When analyzing the carbon abatement effect of CCER projects, we first aggregated the gridded EDGAR emission data to the county level, designating counties with CCER projects as the treatment group and those without projects as the control group. This design ensures comparability with the data structure used in prior studies and allows us to capture the spatial coverage of CCER projects. However, it inevitably enlarges the actual area of CCER projects and yields a relatively coarse characterization of the control group.
As an alternative approach, we employed the original gridded data and constructed a grid-level difference-in-differences strategy [46].
where Gridded_EMISSqt denotes the logarithm of greenhouse gas emissions of grid q in year t, with the treatment group defined as the grid cells containing CCER projects and the control group as the surrounding grid cells away from project sites. Considering that EDGAR data are reported at a resolution of 0.1° × 0.1° (roughly 10 km × 10 km), emissions of the control group were averaged from grid cells within a 10–30 km buffer around CCER projects. Gridded_CCERqt is an indicator that equals 1 for treatment grids after CCER implementation and 0 otherwise. All other model settings remain the same as in the county-level analyses.
In Table 7, the coefficient of CCER on grid-level emissions was estimated at –0.036, indicating that the implementation of CCER projects was associated with an extra 3.6% reduction in greenhouse gas emissions within treated grids relative to neighbouring control grids. This negative and statistically significant effect provides robust evidence that CCER projects effectively promote local carbon abatement, thereby validating Hypothesis 1.
Table 7.
Carbon abatement effect of CCER projects under gridded data.
We further examined the effectiveness of each CCER project by separately estimating Equation (6) in order to test whether the EDGAR emissions data capture actual emission reductions. The results are encouraging, as the ex-post evaluated abatement and the self-declared abatement levels exhibit a clear positive linear relationship, significant at the 5% level (Figure 8). This finding suggests that projects claiming higher emission reductions also achieved more emission reductions in the ex-post evaluation, thereby providing evidence for the validity of both our dataset and empirical strategy.
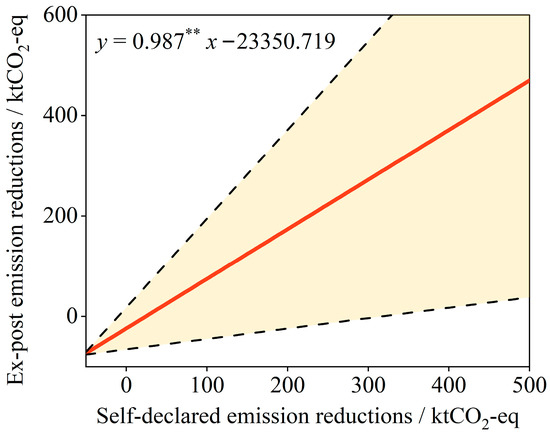
Figure 8.
Relationship between project-level self-declared and ex-post emission reductions. Note: The self-declared emission reductions are derived from PDDs, while the ex-post emission reductions are estimated using DID models for each project. The red solid line represents the best-fit curve between these two variables, and the dashed lines denote the 95% confidence intervals. ** p < 0.05.
7.2. Validation of Socio-Economic Benefits on Grid-Level Data
In examining the socio-economic benefits, we relied on county-level data obtained from official statistical yearbooks. The advantage of using such data lies in its high credibility, as it has been carefully calibrated by the government and widely adopted in empirical research. However, this approach may mask project-specific effects due to spatial aggregation. To improve analytical precision, we followed the approach of Yu et al. [1] and incorporated more gridded data into our analysis. Specifically, we obtained gridded GDP and population datasets from Kummu et al. [47] and Lebakula et al. [48], respectively. We then extracted the accurate geographic coordinates of CCER projects from their PDDs and matched these coordinates to the corresponding grid cells. Then, we constructed a regression model to estimate the impact of CCER projects on GDP and population at the grid-level, as shown in Equations (7) and (8):
where Gridded_GDPit and Gridded_POPit represent the logarithm of GDP and the population within the grid cell where each project is located. We employed panel Ordinary Least Squares and panel Poisson regression models to estimate Equations (7) and (8), respectively. The results are reported in Table 8. The CCER policy significantly increased GDP and promote population agglomeration in project areas. These findings further support the conclusion that CCER projects improved the livelihoods of local residents.
Table 8.
Socioeconomic benefits of CCER projects under gridded data.
In addition, we examined whether the projects occupied arable land by analyzing land types before and after the implementation of CCER projects. The land use dataset was sourced from a multi-period land use remote sensing monitoring dataset of China [49]. As shown in Figure 9, the share of arable farmland increased from 32.6% before the CCER projects to 35.1% after their implementation. This indicates that CCER projects did not crowd out arable land; on the contrary, many biogas projects even contributed to an increase in the share of farmland, which is consistent with our empirical findings.
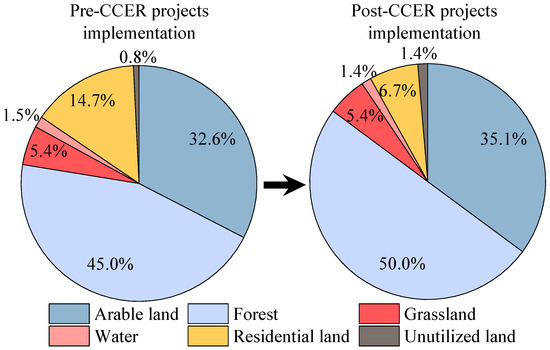
Figure 9.
Land types of CCER projects before and after CCER project implementation.
8. Conclusions
The voluntary carbon market offers an important market-based tool for incentivizing farmers and land managers to reduce emissions [50]. However, limited evidence exists on the policy effectiveness of voluntary carbon markets. This study collected a comprehensive dataset covering all registered CCER projects in agriculture and forestry, and analyzed the key characteristics of these projects. By integrating the emissions data, we treated China’s CCER policy as a quasi-natural experiment and constructed a county-level panel dataset to evaluate the carbon abatement effect of CCER projects. Given that many CCER projects claim to deliver socio-economic benefits that have been endorsed by stakeholders, we also examined their broader socio-economic impacts.
Our results include threefold. First, CCER projects in agricultural and forestry collectively committed to reducing 68.34 MtCO2-eq emissions, with heterogeneity existing across regions, project types, and crediting periods. Second, the CCER policy led to a 2.8% reduction in county-level emissions, with more pronounced effects in biogas projects and in projects audited by leading verification agencies. The best ex-post estimate of emission reductions was 45.52 MtCO2-eq, which fell short of the ex-ante declared figure, implying overstatement in the reported mitigation outcomes of CCER projects. Third, beyond the mitigation effectiveness, the CCER policy also demonstrated notable socio-economic benefits, including increasing rural per capita income, improving rural employment rates, and promoting farmland preservation. Further analyses corroborated these findings based on higher-resolution grid-level data.
The CCER programme was officially relaunched in 2024, and our study provides important implications for the further development of CCER programme. First, while CCER projects have demonstrated measurable emission reductions and served as an important policy instrument to support China’s climate mitigation targets, the current CCER credit supply remains far below potential demand. Since the relaunch of the CCER programme in 2024, 102 projects have been submitted, and 9 projects have issued credits totaling 21.8 MtCO2. In contrast, the annual demand from the national ETS is estimated at about 255 MtCO2, calculated by multiplying its coverage of 5.1 GtCO2 by the 5 percent CCER offset limit. This comparison highlights a substantial supply-demand gap, underscoring the need to further scale up high-quality projects such as afforestation. Second, while methodologies for afforestation carbon sink projects have already been revised and issued, those for household biogas utilization projects are still under development. Given the potential of overstatement in biogas project emission reductions, we emphasized the need for cautious methodology design. This includes standardizing the monitoring of household biogas digester usage, improving the accuracy of emissions accounting, and implementing safeguards to prevent premature project termination. Third, project quality depends heavily on verification agencies, yet their capacity varies substantially. Strengthening the oversight of verification agencies, enhancing capacity training, and encouraging knowledge exchange across agencies are essential steps to ensure more rigorous and consistent accounting practices. Fourth, compared to projects in other sectors, those in agriculture and forestry often face additional challenges, including limited farmer participation, land use conflicts, and uncertainties in emission reductions (e.g., carbon reversal caused by wildfires). In India, these issues have resulted in an average crediting period of 4.6 years for projects in agriculture and forestry, significantly longer than in other sectors [51]. The government should play a crucial role in coordinating farmer participation and ensuring stable land tenure, thereby facilitating the implementation of CCER projects in agriculture and forestry.
Moreover, our findings demonstrate that CCER project implementation can simultaneously achieve both carbon abatement and rural revitalization. Together with evidence from other countries [52,53], our insights are valuable for promoting the development of voluntary carbon markets to advance sustainable outcomes across social, economic, and environmental dimensions.
Several limitations of this study highlight avenues for future research. On one hand, due to data constraints, our analysis has not extended to recent progress since the relaunch of the CCER programme. The relaunched CCER policy features fewer project types and stricter approval standards. Future studies can examine the policy effectiveness of this new phase. On the other hand, we primarily focused on the impacts of agriculture and forestry projects on rural mitigation and socio-economic development. Future research could incorporate other types of CCER projects to develop a more comprehensive understanding of their overall impacts.
Author Contributions
Conceptualization, C.L.; methodology, C.L.; software, C.L.; validation, C.L., and X.Z.; formal analysis, C.L., and X.Z.; investigation, C.L., and X.Z.; data curation, C.L., and X.Z.; writing—original draft preparation, C.L., and X.Z.; writing—review and editing, C.L., and X.Z.; supervision, X.Z.; funding acquisition, X.Z., C.L., and X.Z. contributed equally to this paper. All authors have read and agreed to the published version of the manuscript.
Funding
This research was funded by the National Social Science Fund of China, grant number 21BGJ057, the Youth Development Program (YDP), grant number 2025QQJH82.
Institutional Review Board Statement
Not applicable.
Informed Consent Statement
Not applicable.
Data Availability Statement
The original data presented in the study are openly available in Zenodo at https://doi.org/10.5281/zenodo.15318770, accessed on 1 May 2025.
Conflicts of Interest
The authors declare no conflicts of interest.
Abbreviations
The following abbreviations are used in this manuscript:
| CCER | Chinese Certified Emission Reduction |
| CDM | Clean Development Mechanism |
| REDD+ | Reducing Emissions from Deforestation and Degradation |
| ETSs | Emissions trading systems |
| GDP | Gross domestic product |
| PSM | Propensity Score Matching |
| PDDs | Project Design Documents |
| EDGAR | Emissions Database for Global Atmospheric Research |
| DID | Difference-in-difference |
| CQC | China Quality Certification Centre China Electronic Product Reliability and Environment Testing Institute |
| CEPREI | |
| NDVI | Normalized Difference Vegetation Index |
References
- Chen, M.; Cui, Y.; Jiang, S.; Forsell, N. Toward carbon neutrality before 2060: Trajectory and technical mitigation potential of non-CO2 greenhouse gas emissions from Chinese agriculture. J. Clean. Prod. 2022, 368, 133186. [Google Scholar] [CrossRef]
- Luo, C.; Li, S.; Hua, E.; Forsell, N.; Chen, M. Synthesizing mitigation ambitions and implementation of the agriculture, forestry, and other land use (AFOLU) sector. Ecosyst. Health Sustain. 2024, 10, 0217. [Google Scholar] [CrossRef]
- Toyama, Y. Dynamic incentives and permit market equilibrium in cap-and-trade regulation. Am. Econ. J. Microecon. 2024, 16, 374–423. [Google Scholar] [CrossRef]
- Wongpiyabovorn, O.; Plastina, A.; Crespi, J.M. Challenges to voluntary Ag carbon markets. Appl. Econ. Perspect. Policy 2023, 45, 1154–1167. [Google Scholar] [CrossRef]
- Luo, C.; Chen, M. Theoretical and pathway analysis of utilizing carbon trading to promote agricultural emission reductions: International experience and its implications for China. Clim. Change Res. 2023, 19, 761–770. [Google Scholar]
- Xu, Y.; Peng, J.; Tian, J.; Fu, S.; Hu, C.; Fu, S.; Feng, Y. The impact and mechanism analysis of Clean Development Mechanism on the synergistic effects of pollution mitigation and carbon reduction. Environ. Res. 2024, 260, 119659. [Google Scholar] [CrossRef]
- West, T.A.; Börner, J.; Sills, E.O.; Kontoleon, A. Overstated carbon emission reductions from voluntary REDD+ projects in the Brazilian Amazon. Proc. Natl. Acad. Sci. USA 2020, 117, 24188–24194. [Google Scholar] [CrossRef] [PubMed]
- Xu, S. Forestry Offsets Under China’s Certificated Emission Reduction (CCER) for Carbon Neutrality: Regulatory Gaps and the Ways Forward. Int. J. Clim. Change Strateg. Manag. 2024, 16, 140–156. [Google Scholar] [CrossRef]
- Zheng, Y.; Zhang, B. The impact of carbon market on city greening: Quasi-experimental evidence from China. Resour. Conserv. Recycl. 2023, 193, 106960. [Google Scholar] [CrossRef]
- Yu, R.; Ma, S.; Zhang, D.; Zhang, X. Forest vegetation increased across China’s carbon offset projects and positively impacted neighboring areas. Commun. Earth Environ. 2024, 5, 767. [Google Scholar] [CrossRef]
- Beiser-McGrath, L.F.; Bernauer, T.; Prakash, A. Command and control or market-based instruments? Public support for policies to address vehicular pollution in Beijing and New Delhi. Environ. Polit. 2023, 32, 586–618. [Google Scholar] [CrossRef]
- Streck, C. How voluntary carbon markets can drive climate ambition. J. Energy Nat. Resour. Law 2021, 39, 367–374. [Google Scholar] [CrossRef]
- Zhang, X.; Guo, X.; Zhang, X. Collaborative Strategy Within China’s Emission Trading Scheme: Evidence from a Tripartite Evolutionary Game Model. J. Clean. Prod. 2023, 382, 135255. [Google Scholar] [CrossRef]
- Zeng, M.; Zhang, W. Green Finance: The Catalyst for Artificial Intelligence and Energy Efficiency in Chinese Urban Sustainable Development. Energy Econ. 2024, 139, 107883. [Google Scholar] [CrossRef]
- Kreibich, N. Toward Global Net Zero: The Voluntary Carbon Market on Its Quest to Find Its Place in the Post-Paris Climate Regime. Wiley Interdiscip. Rev. Clim. Change 2024, 15, e892. [Google Scholar] [CrossRef]
- Wu, F.; Wang, S.Y.; Zhou, P. Marginal Abatement Cost of Carbon Dioxide Emissions: The Role of Abatement Options. Eur. J. Oper. Res. 2023, 310, 891–901. [Google Scholar] [CrossRef]
- Spilker, G.; Nugent, N. Voluntary Carbon Market Derivatives: Growth, Innovation & Usage. Borsa Istanb. Rev. 2022, 22, S109–S118. [Google Scholar] [CrossRef]
- Bayer, P.; Urpelainen, J.; Wallace, J. Who uses the Clean Development Mechanism? An empirical analysis of projects in Chinese provinces. Glob. Environ. Change 2013, 23, 512–521. [Google Scholar] [CrossRef]
- Lo, A.Y.; Cong, R. After CDM: Domestic carbon offsetting in China. J. Clean. Prod. 2017, 141, 1391–1399. [Google Scholar] [CrossRef]
- Zhou, Y.; Gu, A.; Deng, M. Voluntary emission reduction market in China: Development, management status and future supply. Chin. J. Popul. Resour. Environ. 2019, 17, 1–11. [Google Scholar] [CrossRef]
- Lu, Y.; Guo, J.; Ahmad, M.; Zhang, H. Can sci-tech finance pilot policies reduce carbon emissions? Evidence from 252 cities in China. Front. Environ. Sci. 2022, 10, 933162. [Google Scholar] [CrossRef]
- Tang, D.Y.; Yan, J.; Yao, Y. The Determinants of ESG Ratings: Rater Ownership Matters. J. Account. Res. 2025. [Google Scholar] [CrossRef]
- Zhang, J.; Wang, C. Co-benefits and additionality of the clean development mechanism: An empirical analysis. J. Environ. Econ. Manag. 2011, 62, 140–154. [Google Scholar] [CrossRef]
- Kilinc-Ata, N.; Camkaya, S.; Topal, S. What Role Do Foreign Direct Investment and Technology Play in Shaping the Impact on Environmental Sustainability in Newly Industrialized Countries (NIC)?: New Evidence from Wavelet Quantile Regression. Sustainability 2025, 17, 4966. [Google Scholar] [CrossRef]
- Murawska, A.; Goryńska-Goldmann, E. Greenhouse Gas Emissions in the Agricultural and Industrial Sectors—Change Trends, Economic Conditions, and Country Classification: Evidence from the European Union. Agriculture 2023, 13, 1354. [Google Scholar] [CrossRef]
- Kong, D.; Zhu, L. Governments’ Fiscal Squeeze and Firms’ Pollution Emissions: Evidence from a Natural Experiment in China. Environ. Resour. Econ. 2022, 81, 833–866. [Google Scholar] [CrossRef]
- Sarwar, S.; Streimikiene, D.; Waheed, R.; Mighri, Z. Revisiting the Empirical Relationship Among the Main Targets of Sustainable Development: Growth, Education, Health and Carbon Emissions. Sustain. Dev. 2021, 29, 419–440. [Google Scholar] [CrossRef]
- Khatri-Chhetri, A.; Sapkota, T.B.; Maharjan, S.; Konath, N.C.; Shirsath, P. Agricultural Emissions Reduction Potential by Improving Technical Efficiency in Crop Production. Agric. Syst. 2023, 207, 103620. [Google Scholar] [CrossRef]
- Cong, R.; Lo, A.Y.; Yu, W. The distribution and regional determinants of nationally financed emissions-reduction projects in China. Energy Policy 2021, 152, 112215. [Google Scholar] [CrossRef]
- Simonsohn, U.; Simmons, J.P.; Nelson, L.D. Specification Curve Analysis. Nat. Hum. Behav. 2020, 4, 1208–1214. [Google Scholar] [CrossRef] [PubMed]
- Janssens-Maenhout, G.; Crippa, M.; Guizzardi, D.; Muntean, M.; Schaaf, E.; Dentener, F.; Bergamaschi, P.; Pagliari, V.; Olivier, J.G.J.; Peters, J.A.H.W.; et al. EDGAR v4.3.2 Global Atlas of the three major greenhouse gas emissions for the period 1970–2012. Earth Syst. Sci. Data 2019, 11, 959–1002. [Google Scholar] [CrossRef]
- Ni, Y.; Zhang, M.; Qian, X.; Shen, G.; Mwabonje, O. Anaerobic digestion of rice straw as profitable climate solution reduces paddy field greenhousegas emissions and produces climate-smart fertilizer under carbon trading mechanisms. Sustainability 2025, 17, 2439. [Google Scholar] [CrossRef]
- Luo, C.; Yan, X.; Wang, B.; Ali, A. Long-term adaptation mitigates the promotion effect of air pollution on short-term population movements. Front. Environ. Sci. 2025, 13, 1620499. [Google Scholar] [CrossRef]
- Liu, Y.; Mabee, W.; Zhang, H. Upgrading the development of Hubei biogas with ETS in China. J. Clean. Prod. 2019, 213, 745–752. [Google Scholar] [CrossRef]
- Li, Z.; Yu, Z.; Zhang, P.; Wang, S.; Tan, R.R.; Jia, X.; Pang, X. Comparative Analysis of Certified Emission Reduction Methodologies for Methane Emission Reduction in China. J. Environ. Manag. 2025, 375, 124242. [Google Scholar] [CrossRef]
- Pan, C.; Shrestha, A.; Innes, J.L.; Zhou, G.; Li, N.; Li, J.; He, Y.; Sheng, C.; Niles, J.O.; Wang, G. Key challenges and approaches to addressing barriers in forest carbon offset projects. J. For. Res. 2022, 33, 1109–1122. [Google Scholar] [CrossRef]
- Yu, R.; Zhang, D.; Zhang, X.; Huang, X. Machine learning for data verification in emissions trading system. Resour. Conserv. Recycl. 2023, 199, 107239. [Google Scholar] [CrossRef]
- Kurz, C.F.; Krzywinski, M.; Altman, N. Propensity score matching. Nat. Methods 2024, 21, 1770–1772. [Google Scholar] [CrossRef] [PubMed]
- Hu, Y.; Zheng, W.; Zeng, W.; Lan, H. The economic effects of clean development mechanism afforestation and reforestation project: Evidence from China. Int. J. Clim. Change Strateg. Manag. 2021, 13, 142–161. [Google Scholar] [CrossRef]
- Natarajan, N.; Newsham, A.; Rigg, J.; Suhardiman, D. A Sustainable Livelihoods Framework for the 21st Century. World Dev. 2022, 155, 105898. [Google Scholar] [CrossRef]
- Paul, K.I.; Reeson, A.; Polglase, P.J.; Ritson, P. Economic and employment implications of a carbon market for industrial plantation forestry. Land Use Policy 2013, 30, 528–540. [Google Scholar] [CrossRef]
- Li, J.; Zhang, Z.; Ma, L.; Gu, Q.; Wang, K.; Xu, Z. Assessment on the impact of arable land protection policies in a rapidly developing region. ISPRS Int. J. Geo-Inf. 2016, 5, 69. [Google Scholar] [CrossRef]
- Du, Y.; Takeuchi, K. Can climate mitigation help the poor? Measuring impacts of the CDM in rural China. J. Environ. Econ. Manag. 2019, 95, 178–197. [Google Scholar] [CrossRef]
- Ottonelli, J.; Lazaro, L.L.B.; Andrade, J.C.S.; Abram, S. Do solar photovoltaic clean development mechanism projects contribute to sustainable development in Latin America? Prospects for the Paris Agreement. Energy Policy 2023, 174, 113428. [Google Scholar] [CrossRef]
- Zheng, L. Does off-farm work induce farmland abandonment? Evidence from China. China Agric. Econ. Rev. 2024, 16, 664–682. [Google Scholar] [CrossRef]
- Aaronson, D.; Faber, J.; Hartley, D.; Mazumder, B.; Sharkey, P. The long-run effects of the 1930s HOLC “redlining” maps on place-based measures of economic opportunity and socioeconomic success. Reg. Sci. Urban Econ. 2021, 86, 103622. [Google Scholar] [CrossRef]
- Kummu, M.; Kosonen, M.; Masoumzadeh Sayyar, S. Downscaled gridded global dataset for gross domestic product (GDP) per capita PPP over 1990–2022. Sci. Data 2025, 12, 178. [Google Scholar] [CrossRef]
- Lebakula, V.; Sims, K.; Reith, A.; Rose, A.; McKee, J.; Coleman, P.; Kaufman, J.; Urban, M.; Jochem, C.; Whitlock, C.; et al. LandScan Global 30 arcsecond annual global gridded population datasets from 2000 to 2022. Sci. Data 2025, 12, 495. [Google Scholar] [CrossRef] [PubMed]
- Multi-Period Land Use Remote Sensing Monitoring Dataset of China. Available online: https://www.resdc.cn/DOI/DOI.aspx?DOIID=54 (accessed on 3 May 2025).
- Liang, Z.; Wu, S.; He, Y.; Zhou, C.; Yu, J.; Nie, X.; Luo, J.; Hao, Y.; Wang, J.; Zhao, W.; et al. China Certified Emission Reduction projects: Historical and current status, development, and future prospects—Taking forestry projects as an example. Sustainability 2025, 17, 3284. [Google Scholar] [CrossRef]
- Unlocking India’s Voluntary Carbon Market: Challenges and the Path Forward. Available online: https://www.ceew.in/publications/voluntary-carbon-offset-mechanism-and-challenges-in-carbon-credit-trading-scheme-market-for-india (accessed on 20 September 2025).
- Mori-Clement, Y. Impacts of CDM projects on sustainable development: Improving living standards across Brazilian municipalities. World Dev. 2019, 113, 222–236. [Google Scholar] [CrossRef]
- Cui, J.; Wang, Z.; Yu, H. Can international climate cooperation induce knowledge spillover to developing countries? Evidence from CDM. Environ. Resour. Econ. 2022, 82, 923–951. [Google Scholar] [CrossRef]
Disclaimer/Publisher’s Note: The statements, opinions and data contained in all publications are solely those of the individual author(s) and contributor(s) and not of MDPI and/or the editor(s). MDPI and/or the editor(s) disclaim responsibility for any injury to people or property resulting from any ideas, methods, instructions or products referred to in the content. |
© 2025 by the authors. Licensee MDPI, Basel, Switzerland. This article is an open access article distributed under the terms and conditions of the Creative Commons Attribution (CC BY) license (https://creativecommons.org/licenses/by/4.0/).