Article

Effects of Sodium Chloride in Soil Stabilization: Improving the Behavior of Clay Deposits in Northern Cartagena, Colombia

by
Jair Arrieta Baldovino
1,*,
Jesús David Torres Parra
1 and
Yamid E. Nuñez de la Rosa
2,*
1
GIGA Geotechnical Research Group, Civil Engineering Program, Universidad de Cartagena, Cartagena de Indias 130015, Colombia
2
Faculty of Engineering and Basic Sciences, Fundación Universitaria Los Libertadores, Bogota 110231, Colombia
*
Authors to whom correspondence should be addressed.
Sustainability 2025, 17(19), 8715; https://doi.org/10.3390/su17198715
Submission received: 26 August 2025 / Revised: 23 September 2025 / Accepted: 24 September 2025 / Published: 28 September 2025

Abstract

This research evaluates the stabilization of a clay collected from the northern expansion zone of Cartagena de Indias, Colombia. Laboratory analyses, including particle size distribution, Atterberg limits, compaction, specific gravity, and XRF/XRD, classified the soil as a highly plastic clay (CH) with moderate dispersivity, as confirmed by pinhole and crumb tests. The soil was treated with 3–9% lime, with and without the addition of NaCl (0% and 2%), and tested for unconfined compressive strength (qu), small-strain stiffness (Go), and microstructural properties under curing periods of 14 and 28 days at two compaction densities. Results showed that lime significantly improved mechanical behavior, while the inclusion of NaCl further enhanced qu (up to 185%) and Go (up to 3-fold), particularly at higher lime contents and curing times. Regression models demonstrated that both qu and Go follow power-type relationships with the porosity-to-lime index, with consistent exponents (−4.75 and −5.23, respectively) and high coefficients of determination (R2 > 0.79). Normalization of the data yielded master curves with R2 values above 0.90, confirming the robustness of the porosity-to-lime framework as a predictive tool. The Go/qu ratio obtained (3737.4) falls within the range reported for cemented geomaterials, reinforcing its relevance for comparative analysis. SEM observations revealed the transition from a porous, weakly aggregated structure to a dense matrix filled with C–S–H and C–A–H gels, corroborating the macro–micro correlation. Overall, the combined use of lime and NaCl effectively converts dispersive clays into non-dispersive, mechanically improved geomaterials, providing a practical and sustainable approach for stabilizing problematic coastal soils in tropical environments.

1. Introduction

Stabilizing dispersive clays using lime has been widely studied to mitigate erosion, piping, and strength deficiencies associated with such problematic soils [1]. Dispersive clays, characterized by a high proportion of exchangeable sodium ions and a strong tendency to deflocculate in the presence of water, pose severe challenges to geotechnical structures [2]. Lime treatment has emerged as a primary chemical stabilization technique to reduce dispersivity, increase strength, and improve the overall engineering behavior of these soils. Incorporating sodium chloride (NaCl) into lime-stabilized clay soils has been shown to enhance the effectiveness of the stabilization process by accelerating early-stage physicochemical and pozzolanic reactions [3].
Numerous studies have investigated the influence of sodium chloride (NaCl) on the geotechnical and chemical behavior of stabilized soils, particularly in combination with lime, cement, fly ash, and alkali-activated materials, as presented in Table 1. Incorporating NaCl has shown both beneficial and adverse effects, depending on concentration, curing period, and the type of soil or binder used. Mohd Yunus et al. [4] explored the enhancement of lime-treated clay with sodium chloride. Their results revealed that small additions of NaCl (2% and 4%) significantly improved the unconfined compressive strength (UCS) while slightly reducing the optimum moisture content. The strength enhancement was attributed to accelerated flocculation, agglomeration, and early pozzolanic reactions promoted by sodium ions. In addition to increased UCS, the treatment improved workability and reduced plasticity. Similarly, Saldanha et al. [5] evaluated the effect of various chemical additives, including NaCl, on fly ash-lime blends. NaCl, particularly at a 5% dosage, produced the most significant increase in early UCS among the tested additives, due to enhanced pozzolanic reactivity driven by ionic mobility and high pH conditions. These results demonstrate NaCl’s potential to optimize early strength development in lime-pozzolan systems. In a related study, Razeghi et al. [6] examined the stabilization of saline sandy soils using alkali-activated cements derived from volcanic ash and slag. Including 1% NaCl enhanced UCS by up to 244%, owing to the facilitated formation of C-A-S-H and N-A-S-H gels, as verified through XRD and SEM-EDS analyses. The microstructure of stabilized soils showed reduced porosity and improved encapsulation of particles.
Nevertheless, higher NaCl concentrations did not yield additional benefits, indicating a dosage threshold for optimal performance. Ramesh et al. [9] also reported that NaCl improved the UCS of lime-treated clayey silt, particularly during early curing stages (7 to 14 days). NaCl outperformed other salts such as CaCl2 and KCl, but excessive concentrations caused shrinkage cracks and marginal reductions in strength. The improvements observed were linked to enhanced cation exchange capacity and electrical double-layer compression.
Soil stabilization is increasingly recognized as a technical solution and a strategy for sustainable construction. Recent studies demonstrate that optimized dosages of lime and alternative binders can minimize costs and environmental impacts by reducing binder consumption and maximizing dry density [11]. Life Cycle Assessment (LCA) approaches show that incorporating environmental costs into binder selection leads to more transparent and sustainable decision-making in geotechnical projects [12]. Furthermore, sustainability assessments of soil stabilization must extend beyond the environmental and economic pillars to explicitly include social impacts, such as worker safety, community well-being, and contribution to local economic development, as illustrated by the Geotech Social Impacts tool applied to pavement base stabilization [13]. These actions directly support the United Nations Sustainable Development Goals (SDGs), particularly SDG 9 (Industry, Innovation and Infrastructure), SDG 11 (Sustainable Cities and Communities), and SDG 13 (Climate Action), by promoting resilient infrastructure, reducing environmental footprints, and enhancing the social benefits of construction activities.
Recent research efforts in Cartagena have focused on the sustainable stabilization of clayey soils using innovative geomaterials and polymeric additives, aiming to enhance geomechanical performance while reducing environmental impact. Román Martínez et al. [14] evaluated the behavior of marine clay treated with crushed limestone waste (CLW) and Portland cement, introducing the porosity-to-cement index (η/Civ) as a predictive tool for strength and stiffness evolution. This index strongly correlated with unconfined compressive strength (qu) and small-strain stiffness (Go), supported by SEM observations revealing enhanced interfacial bonding and reduced porosity in CLW-based mixtures. Baldovino et al. [15] investigated incorporating natural rubber latex (NRL) into cement–CLW mixtures, demonstrating that optimized NRL dosages significantly improved UCS and ductility by forming polymeric films that enhanced particle cohesion. Nonetheless, high NRL contents inhibited cement hydration and reduced performance, underscoring the importance of dosage optimization.
Recent studies have highlighted the growing interest in sustainable chemical stabilization approaches to address erosion, piping, and strength deficiencies in problematic soils. For example, micaceous residual soils—widespread in tropical regions—have been stabilized using industrial and agricultural byproducts such as fly ash and coir fiber, significantly improving hydrophobicity, durability, and water stability under flood-prone conditions [16]. This innovative approach, which reported contact angles increasing from 16.7° to over 100° and residual strength ratios above 90% after immersion, demonstrates the potential of waste-derived materials to provide low-cost and durable alternatives to traditional stabilizers for earthworks in rain-soaked or flood-prone areas.
In another study, Baldovino et al. [17] examined the use of xanthan gum (XG), a biodegradable biopolymer, in stabilizing soil–reclaimed asphalt pavement (RAP) blends. Their results revealed that 1% XG and 10% RAP yielded the highest strength and stiffness, while excessive XG or RAP led to performance decline due to void formation and weaker bonding. SEM-EDS analyses confirmed the development of a cohesive microstructure at optimal dosages and indicated that the Go/qu ratio is influenced by XG content but remains independent of curing time—a novel insight for biopolymer-treated soils. Meanwhile, López et al. [18] evaluated using alkali-activated lime derived from calcined snail and mussel shells (waste seashell lime, WSL) as an alternative binder. When activated with 1.0 mol/L NaOH and applied at 11% content, WSL-treated specimens achieved UCS values up to 4605 kPa after 28 days, outperforming conventional Portland cement at lower contents. Microstructural analysis revealed the formation of C–S–H and C–A–S–H phases, confirming the binder’s efficacy and alignment with circular economy principles.
Although several recent studies have investigated the stabilization of problematic soils from Cartagena using alternative binders such as waste-derived lime, natural polymers, and biopolymers—including xanthan gum and natural rubber latex—none have addressed the specific case of dispersive clays and the catalytic role of sodium chloride (NaCl) in lime-based stabilization systems. The existing literature primarily focuses on improving strength and stiffness or enhancing sustainability through waste valorization; however, the physicochemical mechanisms underlying the mitigation of clay dispersity remain unexplored in this regional context. No studies have evaluated the influence of NaCl on the flocculation, cementation, or microstructural evolution of dispersive clays from northern Cartagena. Given the prevalence of such soils in the region and their known susceptibility to erosion and piping, this research aims to fill a critical gap by analyzing whether the addition of NaCl can enhance lime stabilization effectiveness, not only in terms of mechanical improvement but also in reducing soil dispersity and promoting microstructural cohesion.
In addition, soil stabilization is a cornerstone of sustainable infrastructure development because it enables the reuse of in situ materials, reducing the need for quarrying, hauling, and high-carbon-footprint binders. In coastal areas like Cartagena, stabilization improves resilience to flooding and erosion linked to climate change. By optimizing lime and sodium chloride contents, this study aims to reduce binder consumption and improve long-term performance, thus contributing to more sustainable foundations and embankments.

2. Materials and Methods

2.1. Clayey Soil Characteristics

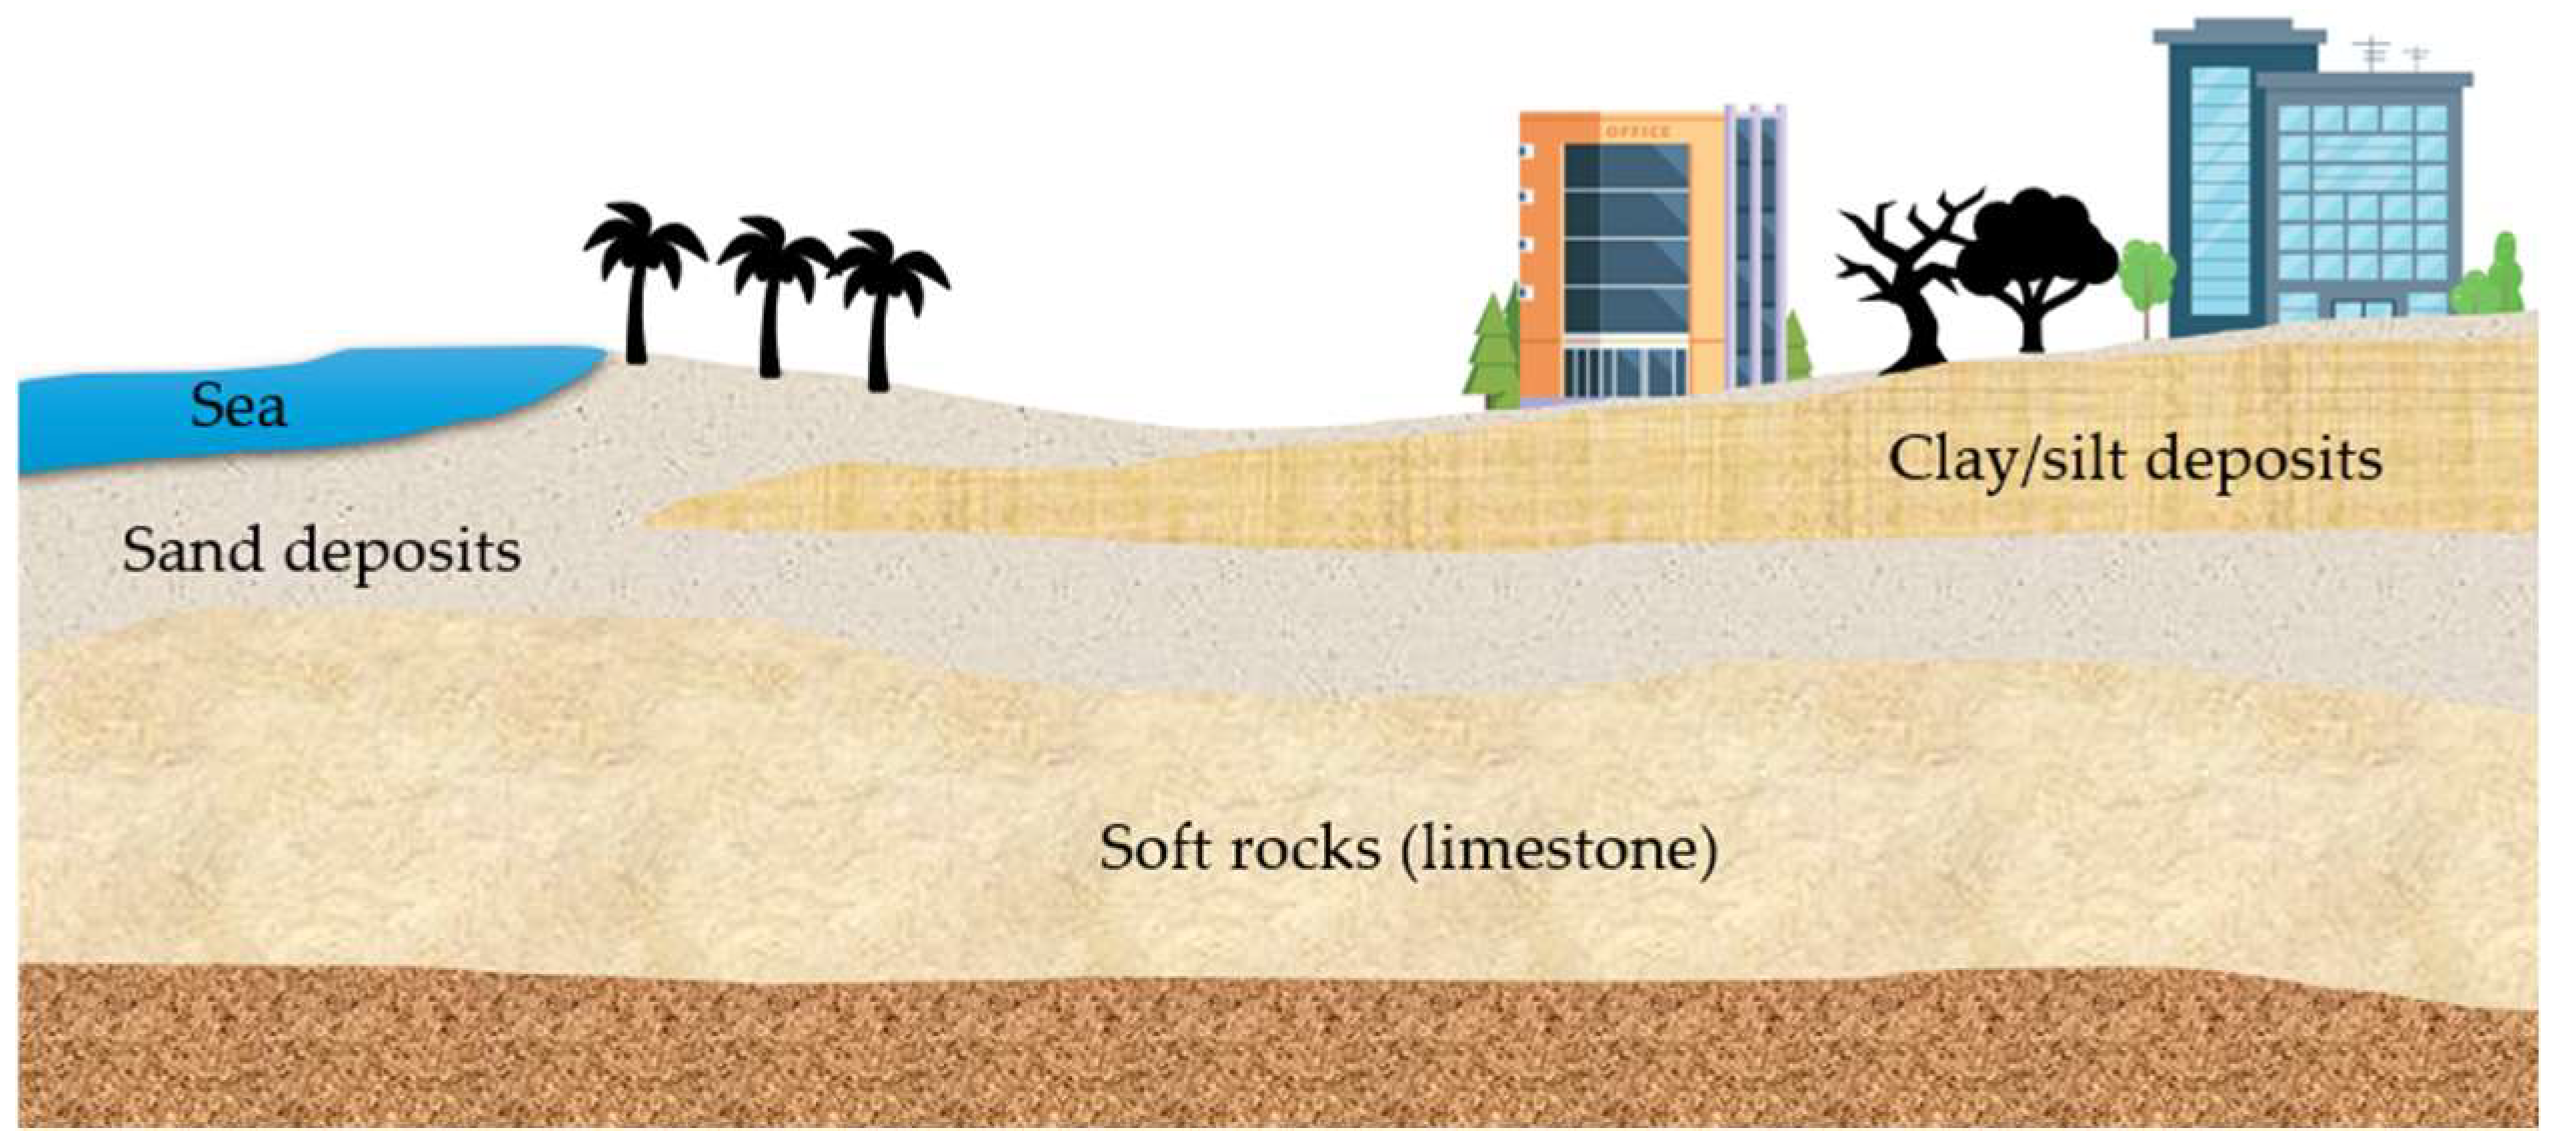
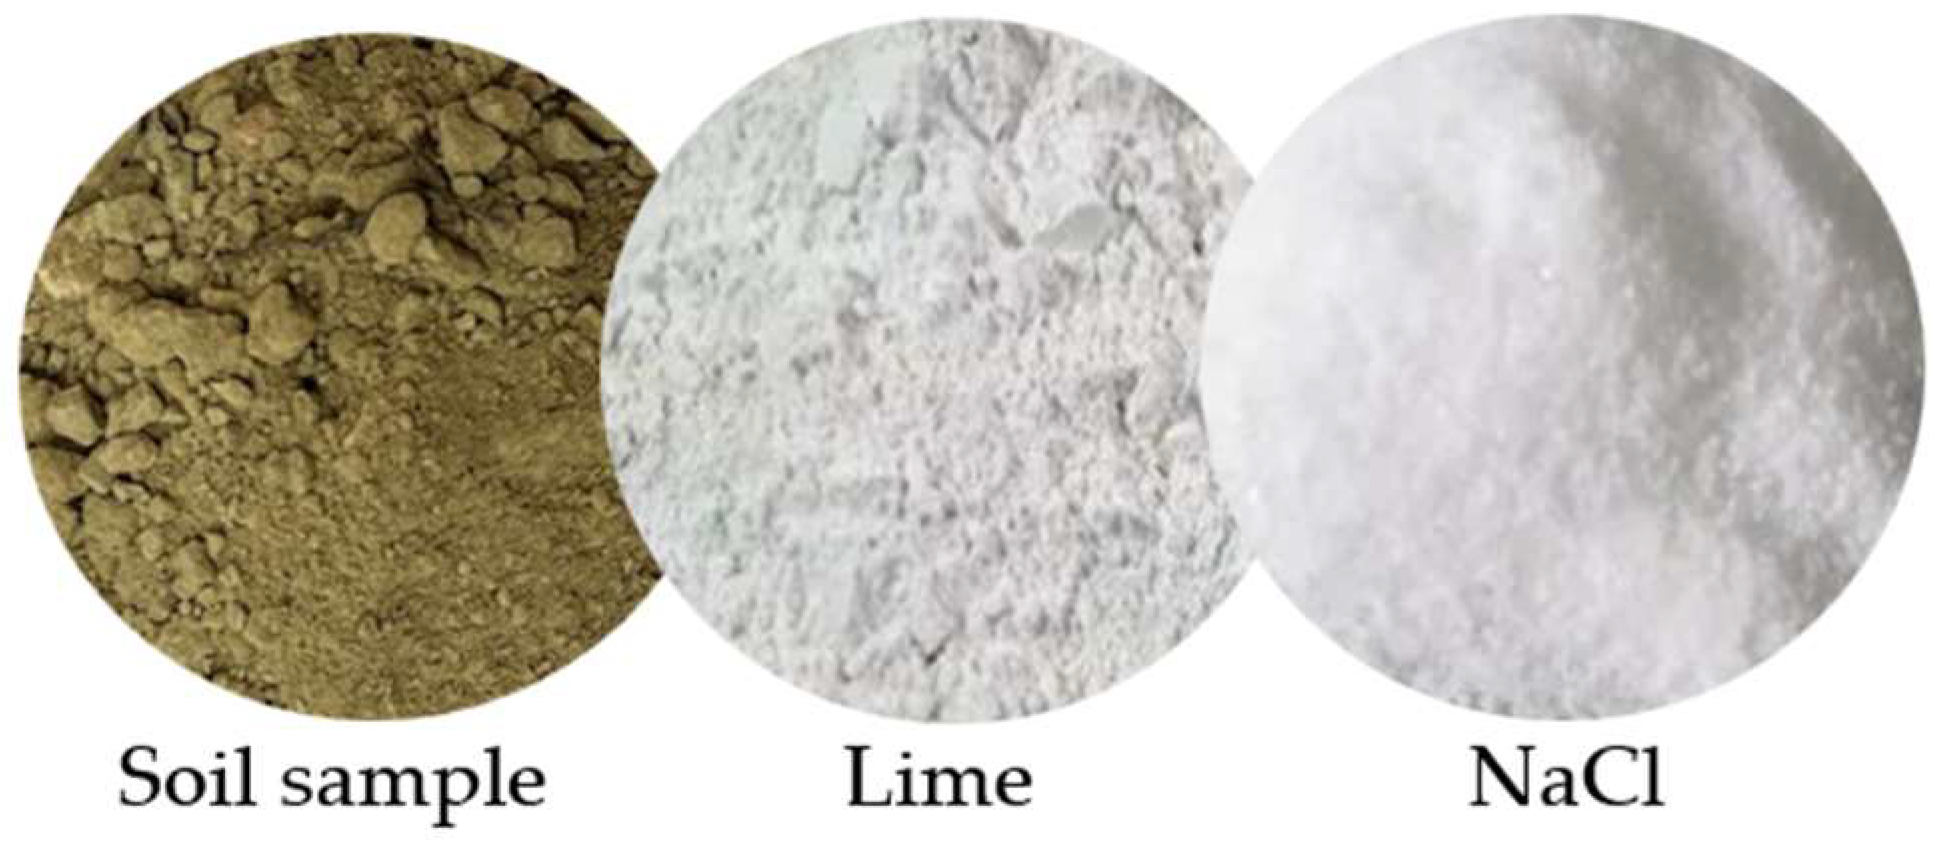
The soil samples were collected from an urban expansion area in Cartagena de Indias’ northern sector (named ‘Serena del Mar’ project). Figure 1 illustrates the sampling location for both disturbed and undisturbed specimens. The stratigraphy of this region is characterized by beach deposits composed predominantly of sands, silts, and marine clays (Figure 2). Sampling was conducted at a depth of 2.5 m. Hygroscopic moisture content was measured and found to be 39%. Subsequent geotechnical and physicochemical characterizations were performed on the remaining specimens. Particle size distribution was obtained via laser diffraction using sodium hexametaphosphate as a dispersing agent. Specific gravity was determined according to ASTM D854 [19], and Atterberg limits were evaluated following ASTM D4318 [20]. X-ray fluorescence (XRF) and X-ray diffraction (XRD) analyses were carried out to assess the chemical and mineralogical composition of the soil. Figure 3 presents a photograph of raw materials, including the soil.

2.2. Dispersity Tests

Two tests were performed to evaluate the dispersity potential of soil: the pinhole and crumb. The pinhole tests were conducted in accordance with ASTM D4647 [21] using undisturbed and disturbed soil. The disturbed sample was previously air-dried and sieved through a No. 10 mesh. Disturbed specimens were molded at 22%, 26%, and 30% moisture content, correlating with corresponding compaction levels from the standard Proctor test. Each sample was manually compacted in a 33 × 38 mm cylindrical mold using pre-divided moist soil and immediately sealed in labeled plastic bags to preserve moisture. Filter materials and assembly procedures conformed to ASTM specifications.
Following ASTM D6572 [15], the crumb test was performed to assess soil dispersity qualitatively. Approximately cubic or irregular clods (10–15 mm) were prepared from both disturbed and undisturbed samples, then submerged in 250 mL of distilled water (or 1 meq/L NaOH solution) for observation at 2 min and 1 h. Dispersion grades were assigned based on turbidity and disintegration of the clouds, ranging from Grade 1 (non-dispersive) to Grade 4 (highly dispersive). This test served as a complementary evaluation to validate the pinhole test results.

2.3. Fixation of Lime and NaCl Contents

The lime content for the present study was established through preliminary testing to identify the dosage that maximized the treated soil’s unconfined compressive strength (UCS). The lime dosages of 3%, 6%, and 9% by dry soil weight were selected following the methods of previous studies on tropical clayey soils with comparable mineralogy and index properties [22,23]. Although these studies were not conducted on the same clay investigated here, adopting the same dosage range allows direct comparison with established stabilization behavior and facilitates the identification of the lime content for this material. A photo of the lime used is presented in Figure 3.
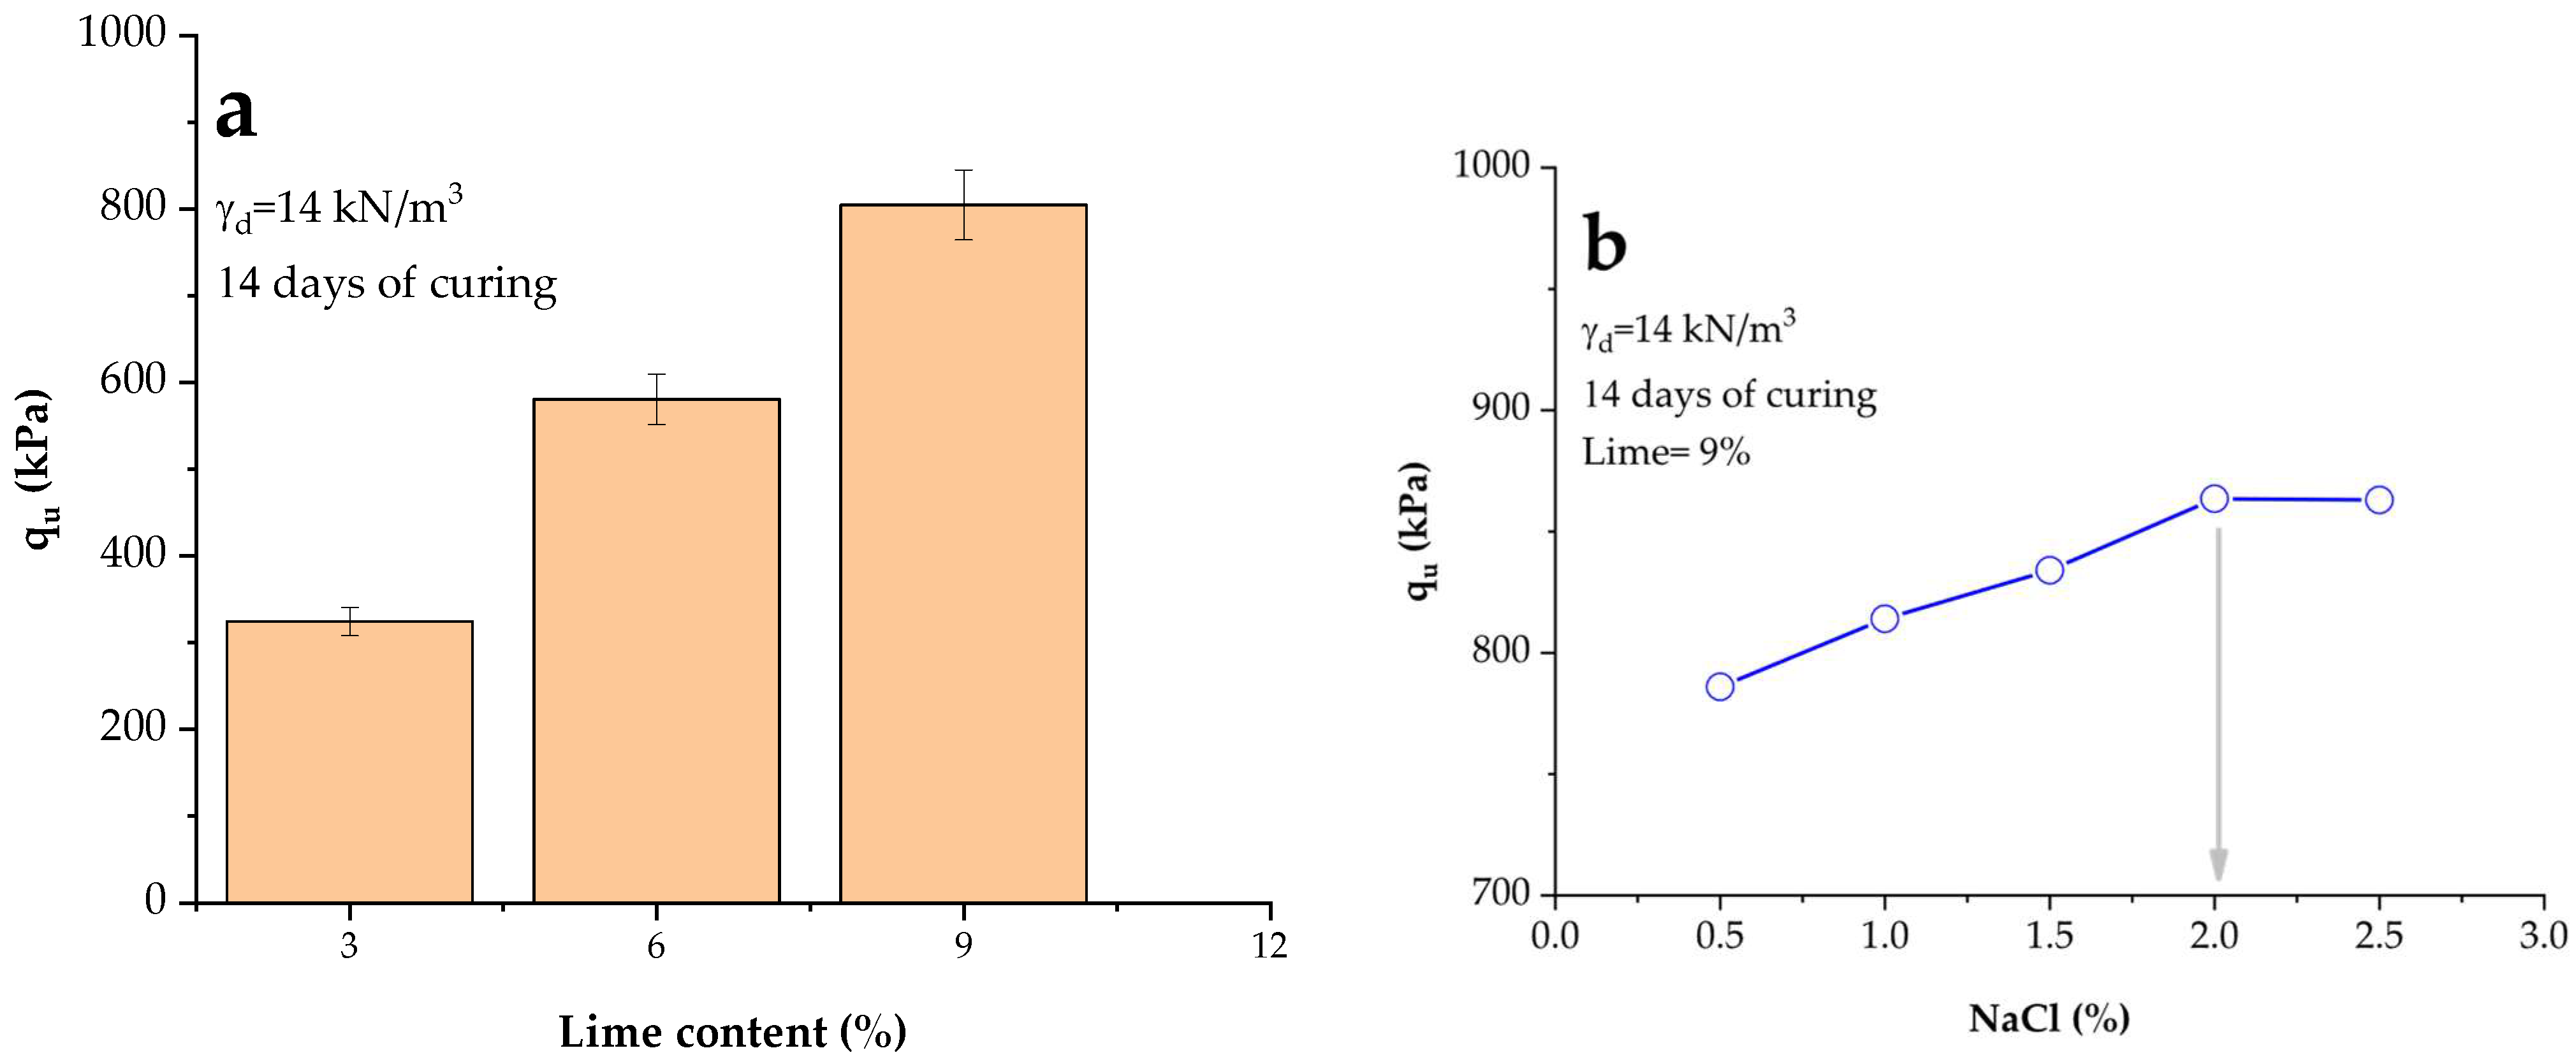
The effect of sodium chloride (NaCl) content on the unconfined compressive strength (qu) of lime-treated clayey-silty soil was evaluated in a pilot study by fixing the lime content at its previously identified maximum of 9%. A selected mix design compacted at a dry unit weight of 14 kN/m3 and cured for 14 days was tested with varying lime dosage of 3%, 6% and 9%, as a presented in Figure 4a. When 9% was added, a maximum value (in average qu = 804 kPa) of unconfined compressive strength was obtained in the tested mix. Then, the selected mix design (i.e., γd = 14 kN/m3 cured 14 days) involved varying NaCl concentrations from 0.5% to 2.5% in 0.5%. The results of mixes tested are plotted in Figure 4b. The qu increased progressively from 801 kPa at 0.5% NaCl to 829 kPa at 1.0% and 850 kPa at 1.5%, reaching a peak of 880 kPa at 2.0%. Beyond this point, no further improvement was observed, with a qu of 879 kPa at 2.5%. This behavior indicates that NaCl enhances the stabilization process up to a threshold of 2%, beyond which the mechanical benefit plateaus. The increase in strength is attributed to NaCl’s role in accelerating lime dissolution and promoting early pozzolanic reactions; however, higher NaCl levels may also increase clay plasticity, which can limit additional strength gains and reduce stiffness. Therefore, 2% NaCl was selected as the percentage dosage for combination with 3, 6, and 9% lime, providing the best balance between compressive strength and overall material performance.

2.4. Experimental Program

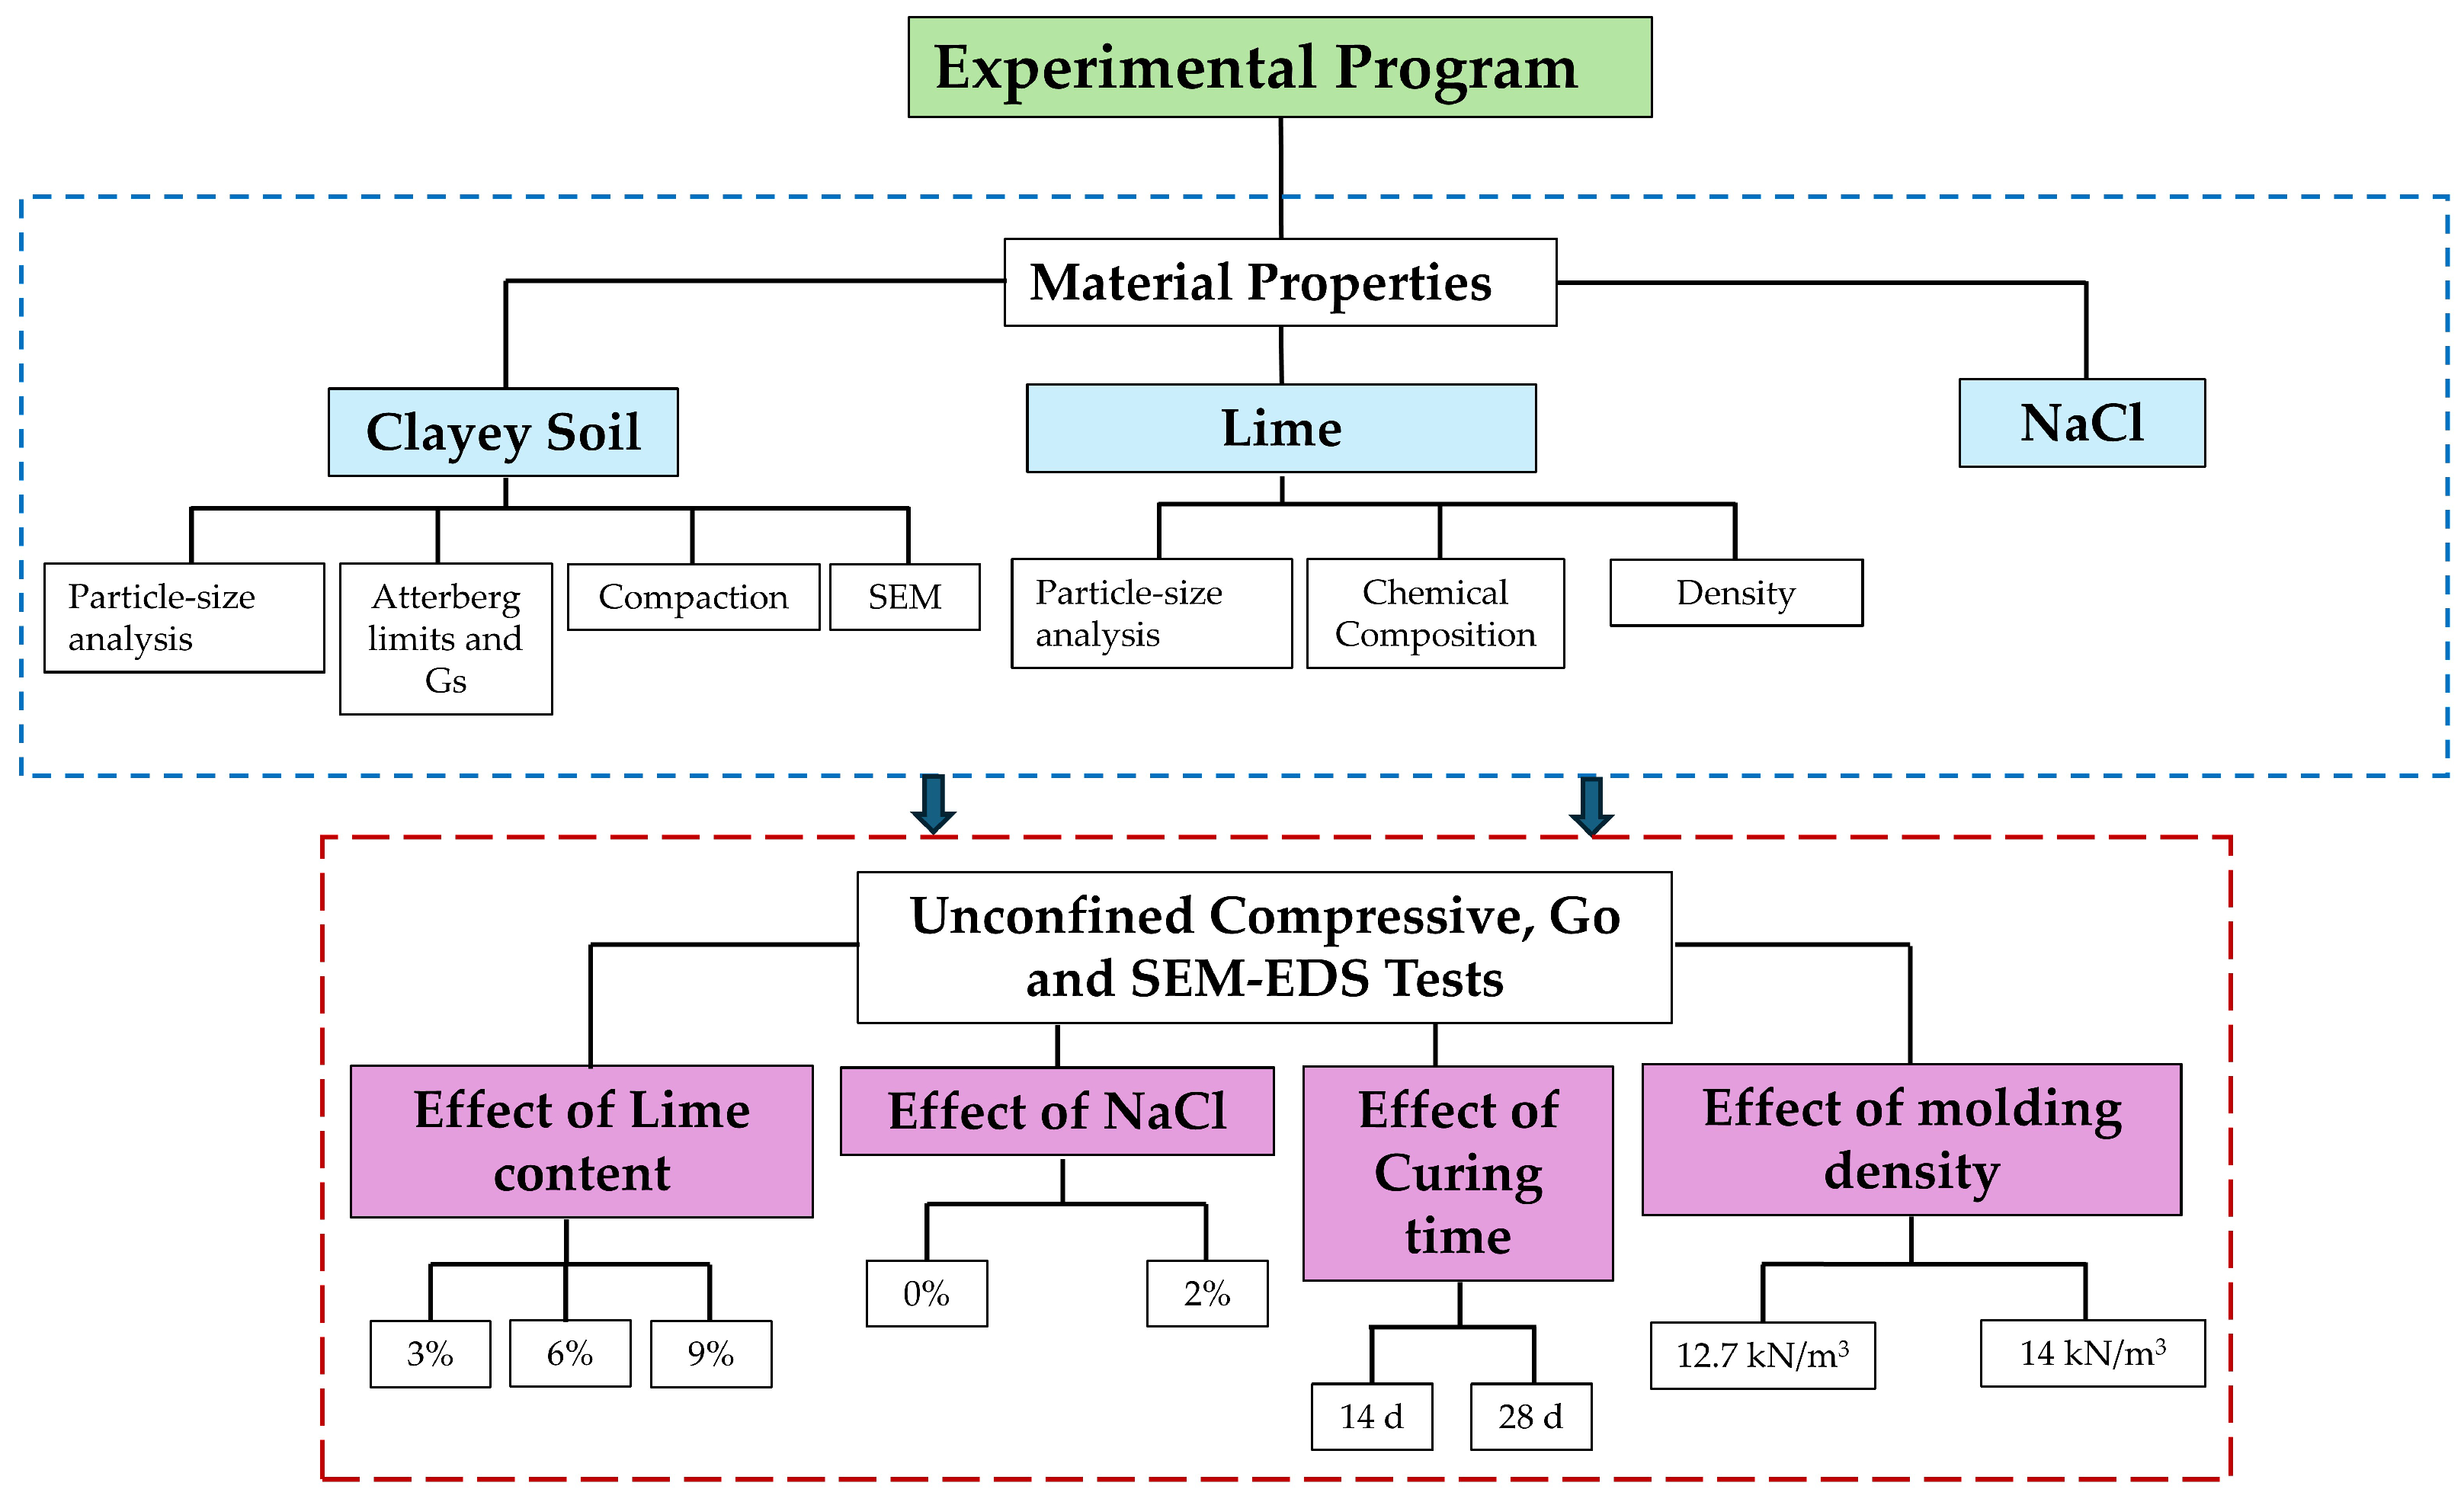
Two curing periods, 14 and 28 days, were selected to evaluate both early and longer-term strength development of the lime–NaCl-treated clayey-silty soil, as presented in the flowchart of Figure 5. To expand on the experimental program shown in the flowchart, the number of specimens for each condition is provided in Table 2. The shorter period (14 days) allowed the assessment of the accelerated pozzolanic reactions promoted by the combined action of lime and NaCl, while the more extended period (28 days) provided insight into the stabilization performance once the reactions approached completion. In addition, two molding densities were adopted—12.7 kN/m3 and 14 kN/m3—to investigate the influence of compaction density on the mechanical and microstructural behavior of the stabilized soil. The lower density represented standard compaction effort. The higher density simulated enhanced field compaction conditions, enabling a comparative evaluation of the effects of density on strength, stiffness, and microstructure. All unconfined compressive strength (qu), small-strain shear modulus (Go), and SEM analyses were performed in triplicate to ensure reproducibility and statistical reliability of the results.

2.5. Preparing Specimens for qu and Go Tests

The preparation of specimens for unconfined compressive strength (qu) and small-strain shear modulus (Go) testing followed a standardized procedure to ensure reproducibility and consistency across all mixtures. The required quantities of air-dried clayey-silty soil, lime, and sodium chloride (NaCl) were weighed according to the target mix design. The dry constituents were initially blended until a homogeneous distribution was achieved, after which the predetermined amount of water was gradually added to reach the specified optimum moisture content. Mixing continued for several minutes to promote uniform hydration of the stabilizing agents and to initiate the early stages of reaction.
The fresh mixtures were compacted into cylindrical molds in three layers; each layer being lightly scarified before the subsequent layer was placed to ensure interlayer bonding. Compaction was performed to achieve the target molding densities of 12.7 kN/m3 or 14 kN/m3, depending on the experimental group. After molding, specimens were carefully extruded, sealed in plastic film to prevent moisture loss, and stored under controlled laboratory conditions (20 ± 2 °C, relative humidity above 95%) for curing periods of 14 or 28 days, according to the experimental program shown in Figure 5.
Before testing, each specimen was measured for exact dimensions and weighed to determine bulk density. The qu tests were conducted at a constant displacement rate of 1 mm/min to obtain peak strength, while Go was determined using bender element measurements performed on identical specimens to capture the initial stiffness at minimal strain levels. All tests were performed in triplicate for each mixture and curing condition to provide statistically reliable results and to minimize experimental variability.

2.6. Unconfined Compressive and Stiffness

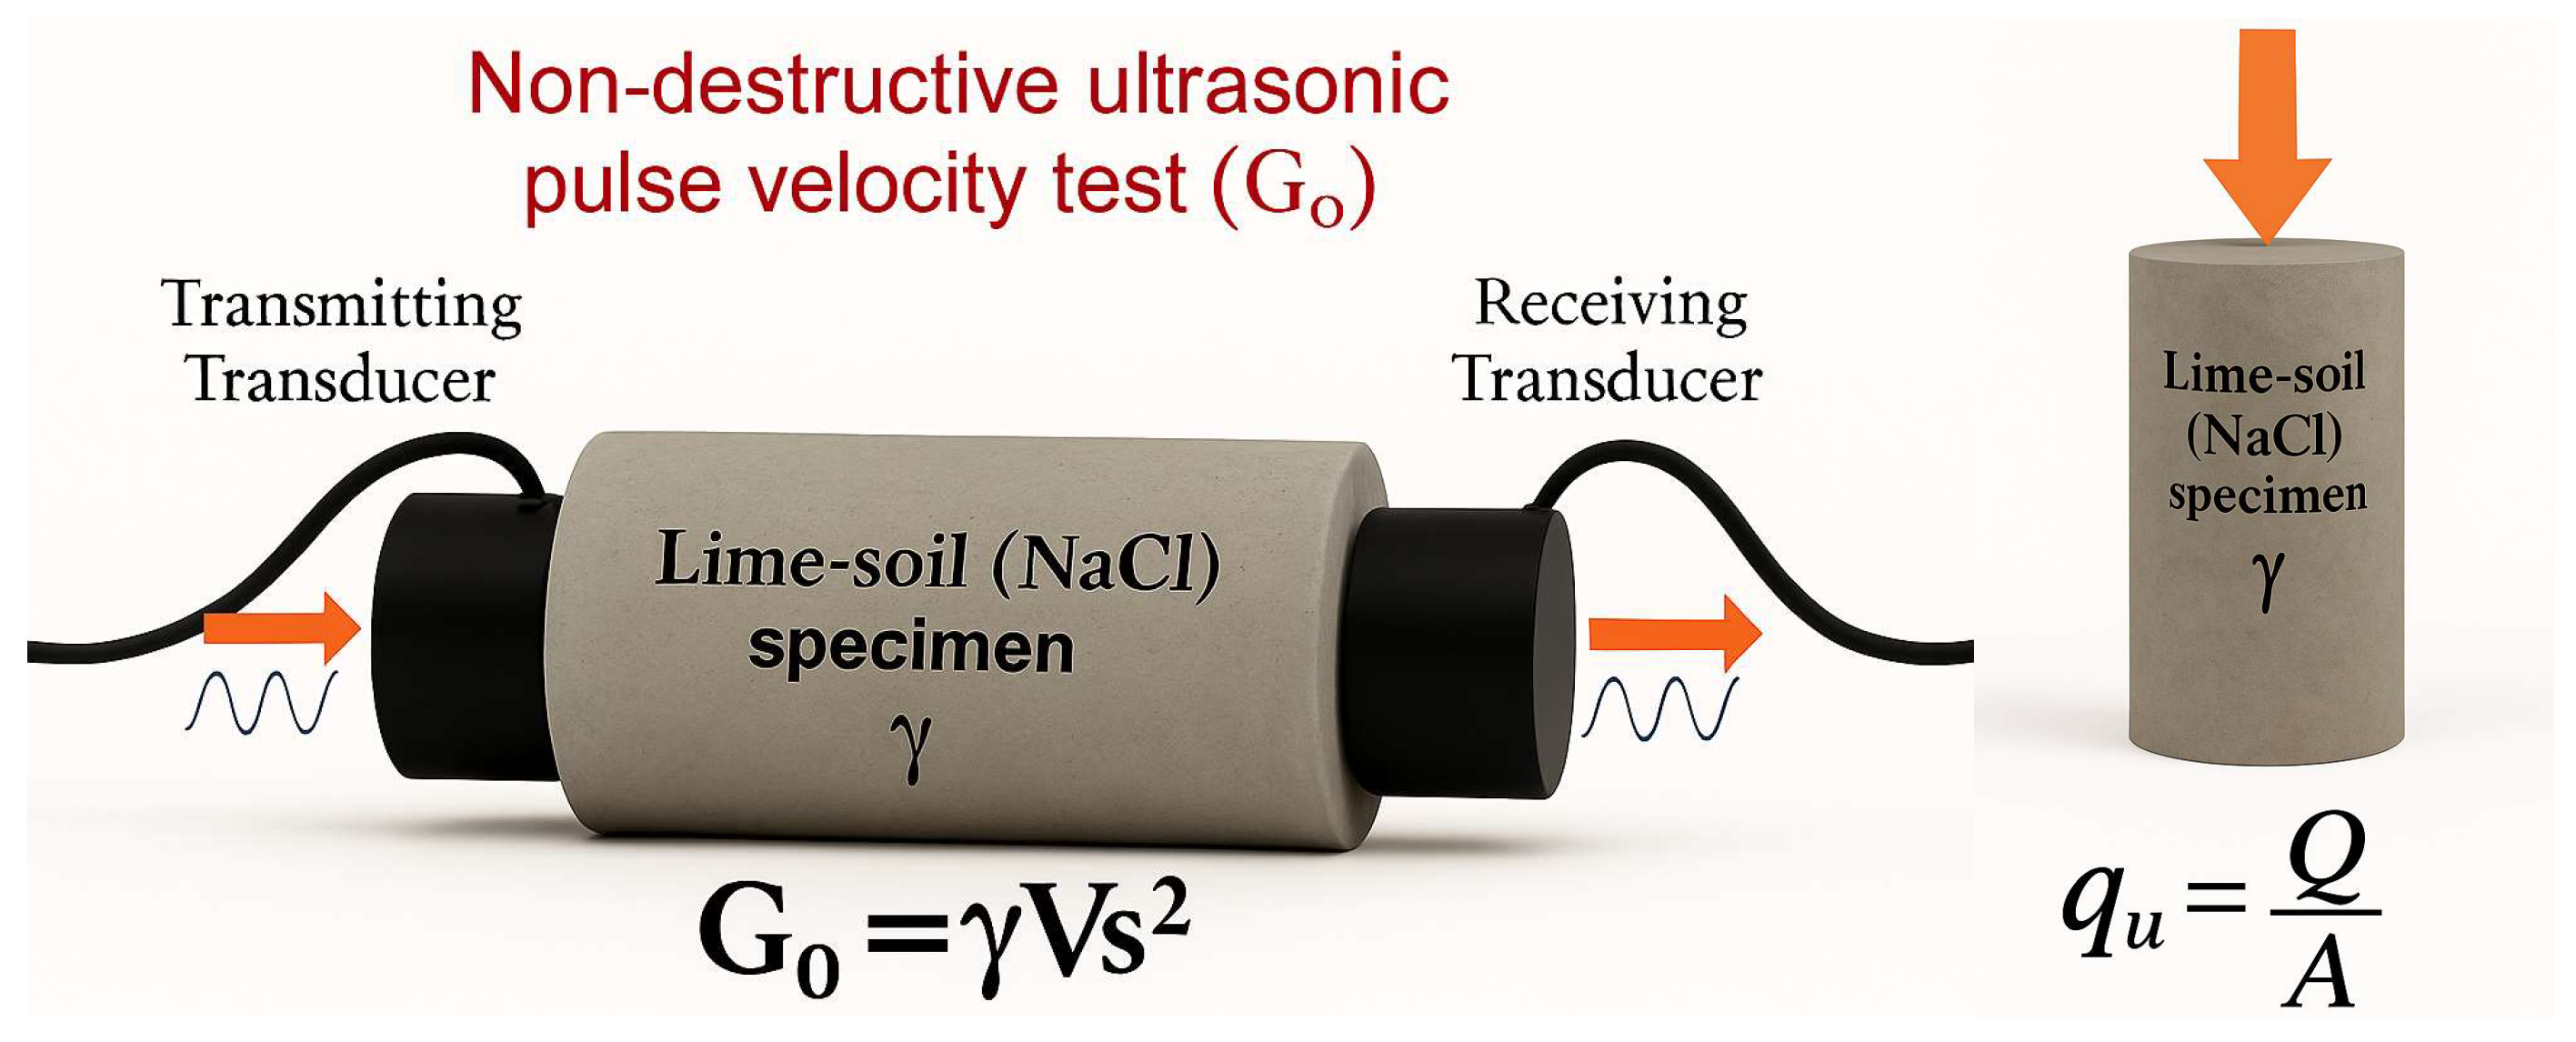
The unconfined compressive strength (qu) of the treated and untreated clayey-silty soil specimens was determined in accordance with ASTM D2166/D2166M-16 [24]. Cylindrical specimens (50 mm diameter × 100 mm height) were prepared at the target molding densities (12.7 kN/m3 and 14.0 kN/m3) and cured for 14 or 28 days under controlled laboratory conditions (20 ± 2 °C, relative humidity > 95%). Each specimen’s dimensions and mass were recorded to determine bulk density before testing. The qu tests were performed using a strain-controlled loading frame at a constant deformation rate of 1.0 mm/min until failure. Peak load (i.e., Q) values were recorded (divided by transversal area of specimen A) and converted to compressive strength (qu).
The small-strain shear modulus (Go) was evaluated through bender element (BE) testing, following the recommendations of ASTM D4015-15 for resonant column and torsional shear devices and adapted BE procedures for static triaxial frames. Identical specimens used in qu tests were instrumented with piezoelectric bender elements positioned at the top and bottom platens. A sinusoidal input signal was applied to the transmitting element, and the receiving element recorded the corresponding output. Shear wave velocity (Vs) was determined from the first-arrival travel time, and Go was calculated using Equation (1):
G o =   ρ × V s 2
where ρ and v s are the bulk density of the specimen and shear wave velocity, respectively. Each qu and Go test was performed in triplicate for every mixture and curing condition to ensure statistical reliability. Combining qu and Go measurements provided complementary information on the stabilized soil’s peak strength and initial stiffness. Figure 6 summarizes the experimental setup for stiffness and unconfined compressive strength measurements using the soil–lime–NaCl compacted and cured specimens.
The unconfined compressive strength (qu) test quantifies the material’s ability to resist loads without lateral confinement, directly linked to the durability and serviceability of stabilized soils. The small-strain stiffness (Go) obtained via bender elements reflects the soil’s elastic response under operational loads, a key parameter for sustainable, long-life infrastructure.

2.7. Microstructure Analysis

The microstructural analysis of the lime–NaCl-treated clayey-silty soil was carried out using scanning electron microscopy (SEM) to evaluate the morphology and distribution of cementitious reaction products. Samples were taken from the core of each specimen after the designated curing periods, carefully trimmed to preserve their natural arrangement. Small fragments were oven-dried at 40 °C to prevent alteration of hydration products, mounted on aluminum stubs with carbon adhesive tabs, and coated with a thin layer of gold using a sputter coater to ensure surface conductivity. SEM imaging was performed with a LYRA 3-TESCAN microscope (Universidad de los Andes, Bogotá D.C., Colombia), operated in low-vacuum mode to minimize dehydration effects. The accelerating voltage was set between 15 and 20 kV, with a working distance of 10–15 mm, depending on the magnification required. A range of magnifications (low to high) was used to examine the general particle packing and the fine morphology of hydration products. This methodology enabled a qualitative evaluation of particle bonding, pore structure evolution, and the influence of NaCl on the morphology and spatial distribution of cementitious compounds, complementing the mechanical and stiffness results obtained from qu and Go tests.

3. Results and Discussions

3.1. Chemical, Geotechnical, Mineralogy, and Microstructure Properties of Clay

The soil’s chemical composition results obtained by the X-ray fluorescence (XRF) method are shown below in Table 3. The XRF analysis delineates a predominantly aluminosilicate matrix, with silicon dioxide (62.6%) and aluminum oxide (24.1%) comprising nearly 87% of the total composition. The moderate concentrations of sulfur trioxide (5.6%) and potassium oxide (4.4%) indicate the presence of sulfate and potassic minerals. In comparison, the relatively low amounts of calcium oxide (1.7%), iron (III) oxide (1.2%), and titanium dioxide (0.5%) suggest a minimal contribution from carbonate and iron-bearing phases. This chemical profile is typical of clays and reinforces the imperative for stabilization strategies—such as lime treatment—to promote pozzolanic reactions and enhance the soil’s geomechanical performance.
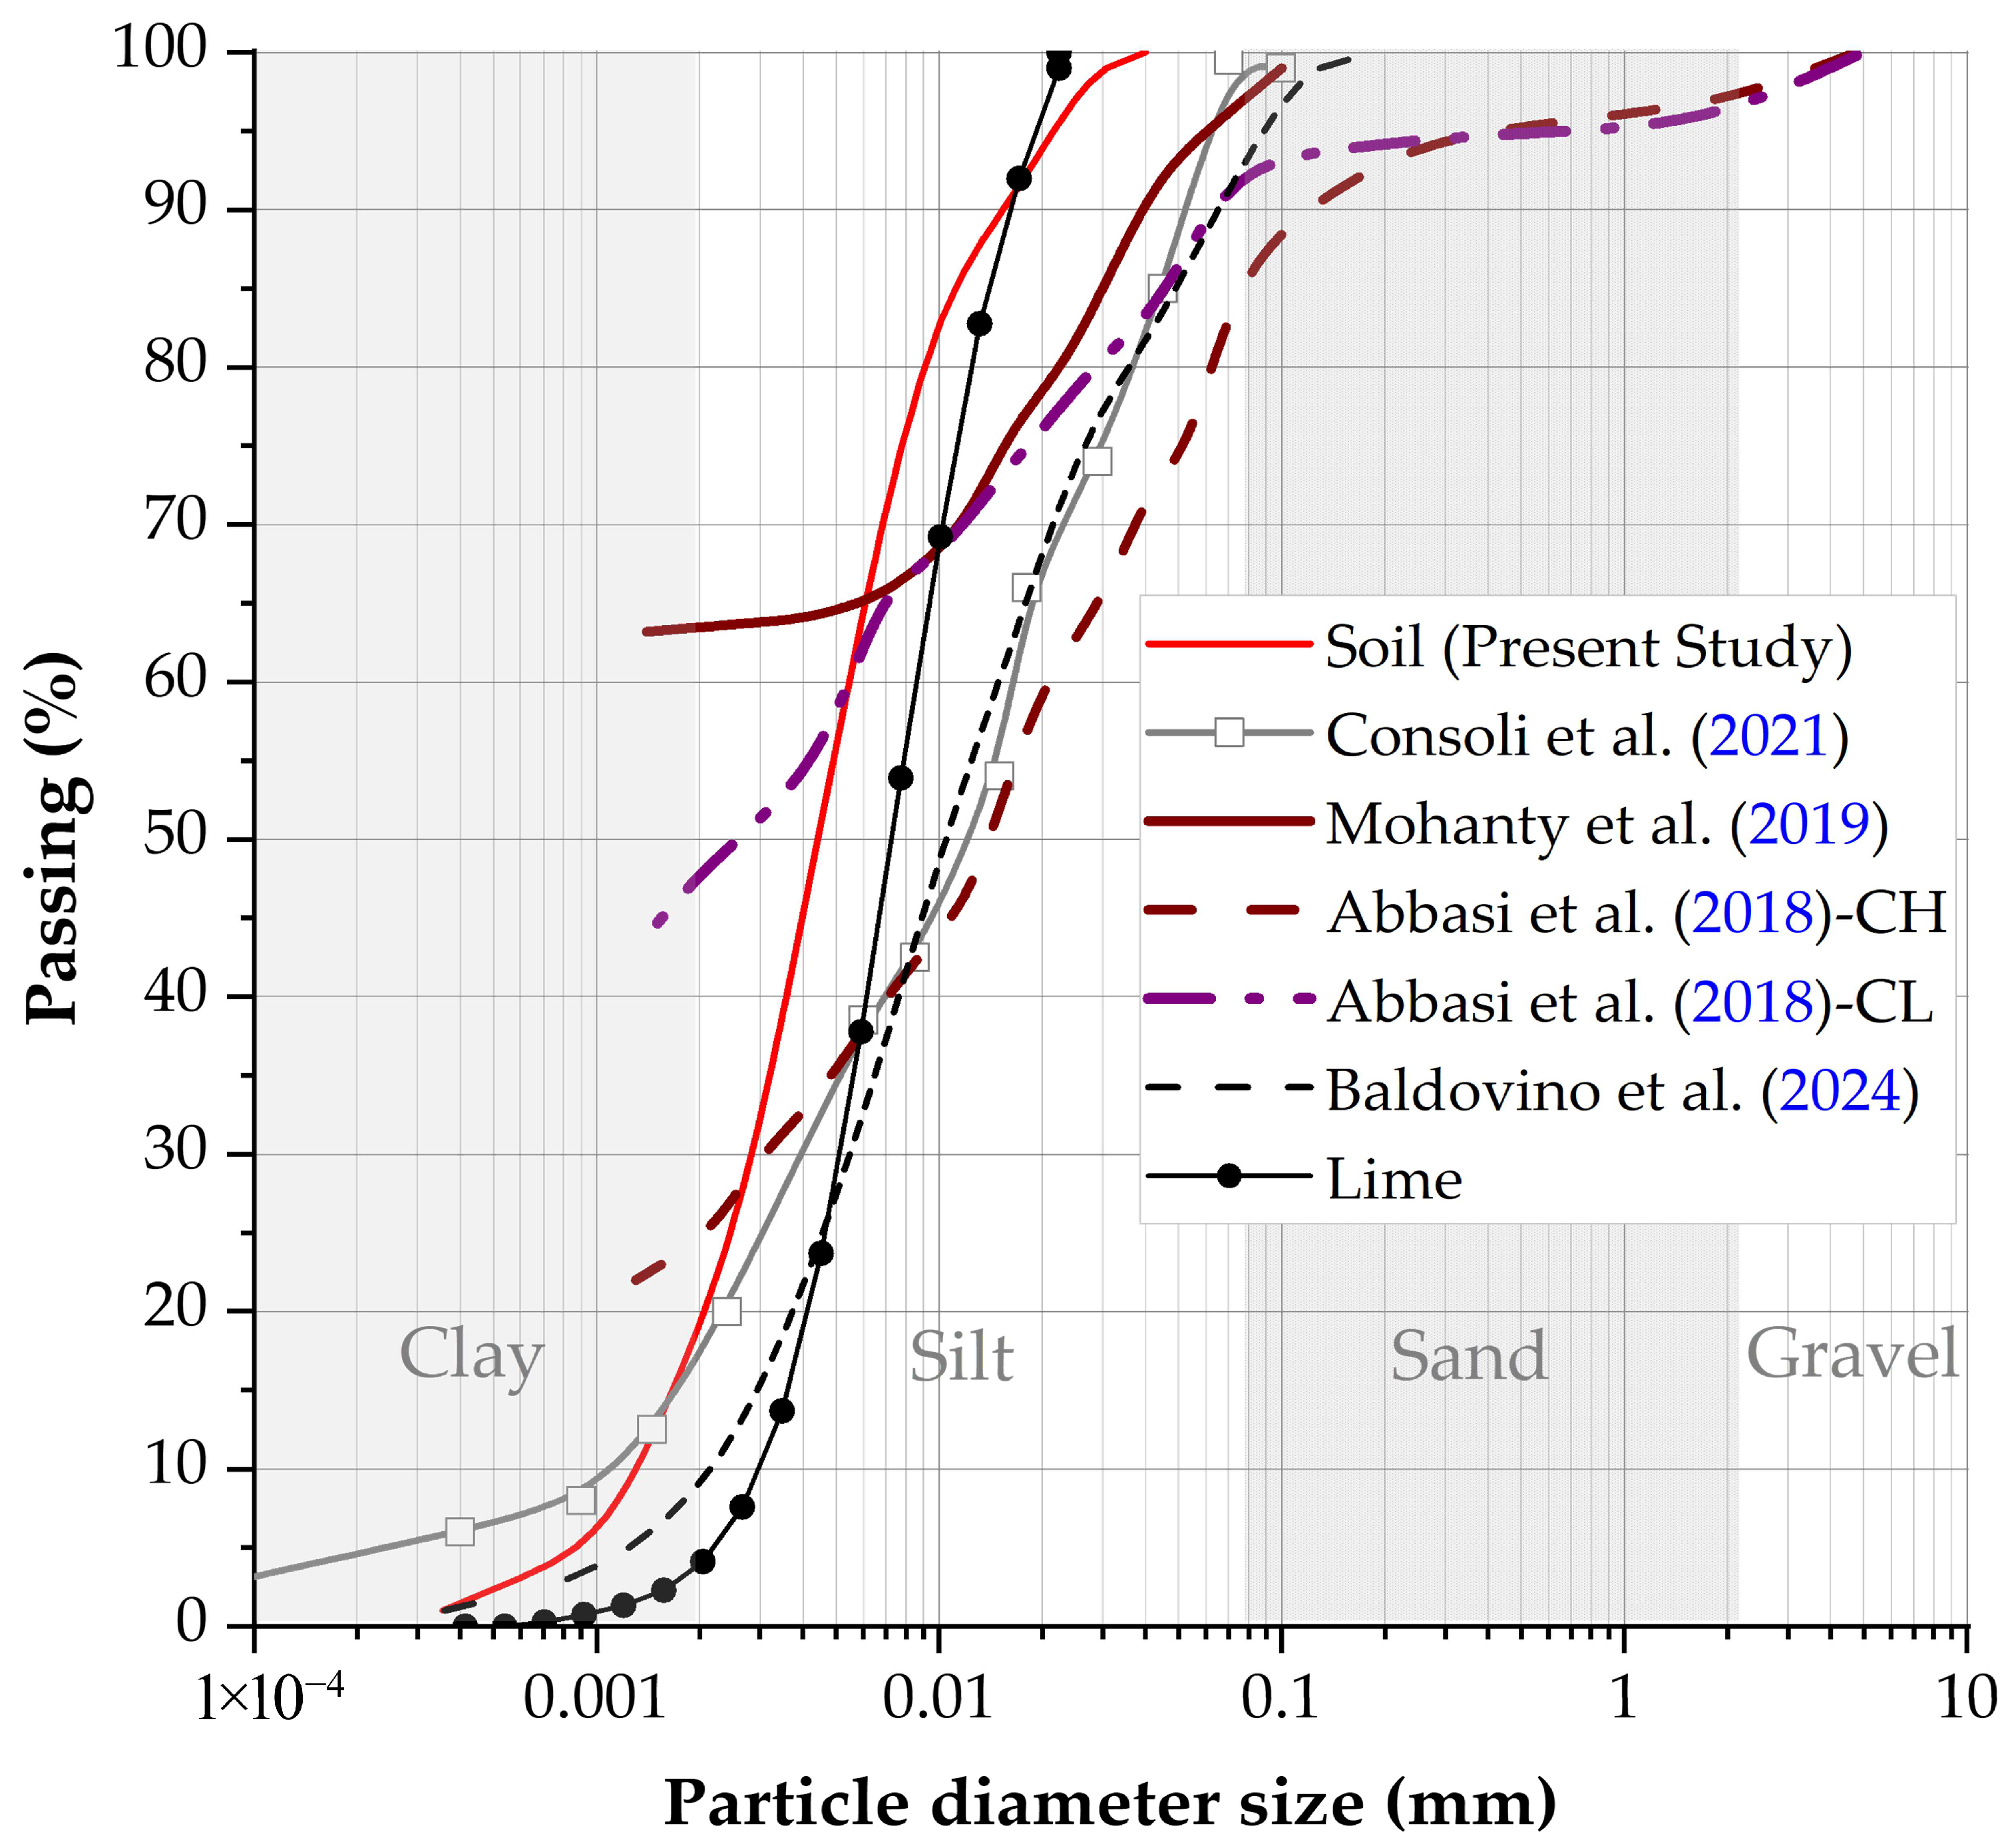
Table 4 displays the physical properties of soil. Limit liquid LL was measured as 53.1%, plastic limit PL as 29.0%, and plastic index (LL-PL) as 24.1%. The specific gravity was calculated to be 2.73 using the pycnometer method. The granulometric fractions were 7.5% medium sand, 25.9% fine sand, 57.6% silt, and 9% clay. In concordance with ASTM D2487 [25] to classify the soil, the sample was characterized as high-plasticity clay CH (i.e., high-plasticity clay) but plots close to the MH boundary. Finally, the proctor properties of soil result in 13.87 kN/m3 maximum dry unit weight and 26% optimum water content. The soil sample’s X-ray diffraction (XRD) detected kaolinite, quartz, and muscovite phases.
Figure 7 presents the granulometric curve of soil samples. Figure 7 also presents the granulometric curves of another soil with dispersivity related to the literature, such as studied by Consoli et al. [28], Mohanty et al. [29], Abbasi et al. [30], and Baldovino et al. [31].

3.2. Pinhole and Crumb Test Results of the Soil Sample

The pinhole test consistently classified disturbed and undisturbed clay specimens as slightly to moderately dispersive (i.e., ND3), with volumetric flows and turbidity levels that increased under higher hydraulic heads and at lower moisture contents. Compacted specimens, tested at moisture contents of 22%, 26%, and 30%, demonstrated flow rates and turbidity indicative of ND3 classification, while undisturbed samples—even with naturally higher moisture levels (34–39%)—exhibited comparable dispersity features, albeit with slightly reduced turbidity. In contrast, the crumb test highlighted a significant sensitivity to sample disturbance and moisture content; disturbed clouds with lower moisture levels manifested moderate dispersion (i.e., Grade 3) after 1 h of immersion, whereas undisturbed samples, with their higher inherent moisture, showed minimal dispersion (i.e., Grade 1). Together, these results underscore the critical influence of moisture content and structural integrity on the dispersive behavior of the clay.

3.3. Influence of NaCl and Lime Content on Unconfined Compressive Strength

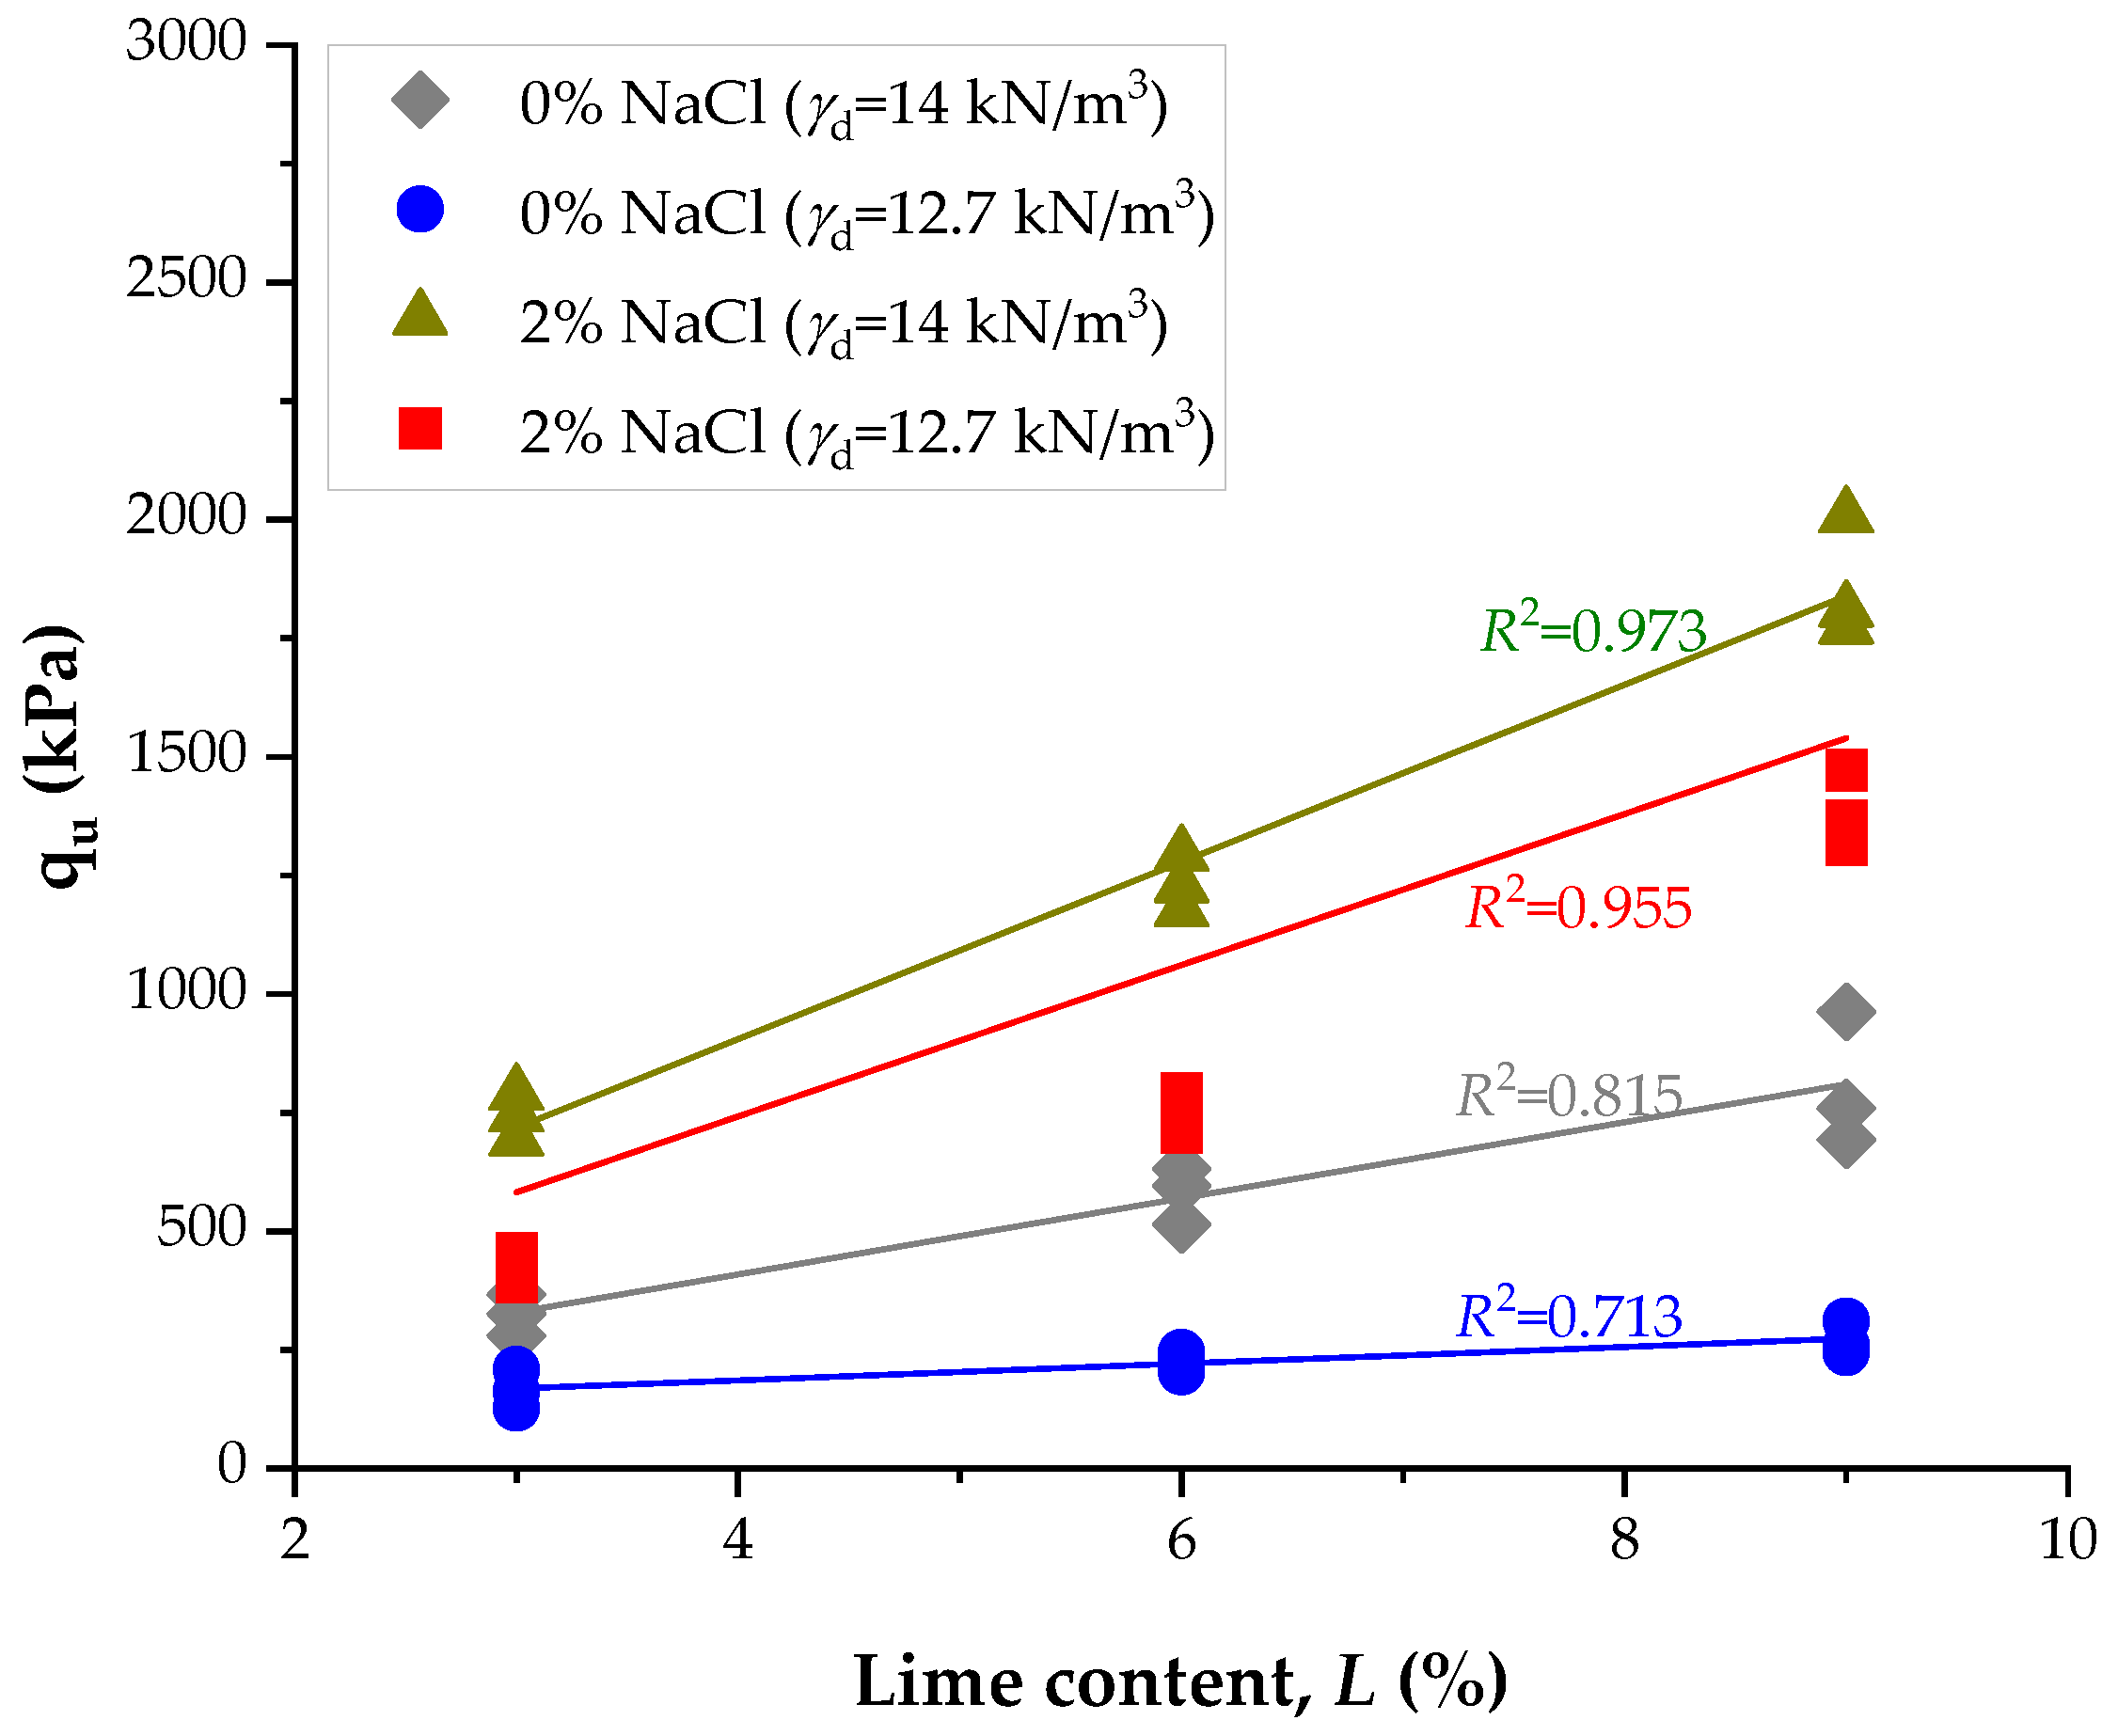
Figure 8 presents the impact of lime content and NaCl on the unconfined compressive strength of compacted clay under 14 days of curing. The results show that unconfined compressive strength (qu) increases consistently with lime content, particularly when comparing 3%, 6%, and 9% additions. For specimens compacted at a higher dry unit weight (14 kN/m3), the qu increased from an average of approximately 324 kPa at 3% lime to 805 kPa at 9%, representing a strength gain of nearly 150%. In contrast, for specimens compacted at a lower dry unit weight (12.7 kN/m3), the qu increased from roughly 166 kPa at 3% lime to 271 kPa at 9%, equivalent to a gain of approximately 63%. These results highlight the effectiveness of lime as a stabilizer and the significant influence of dry density in enhancing the mechanical response. The improvement due to densification alone, at 9% lime, led to strength increases of around 197% when comparing low and high-density specimens, confirming that higher compaction enhances the pozzolanic reaction and strength development.
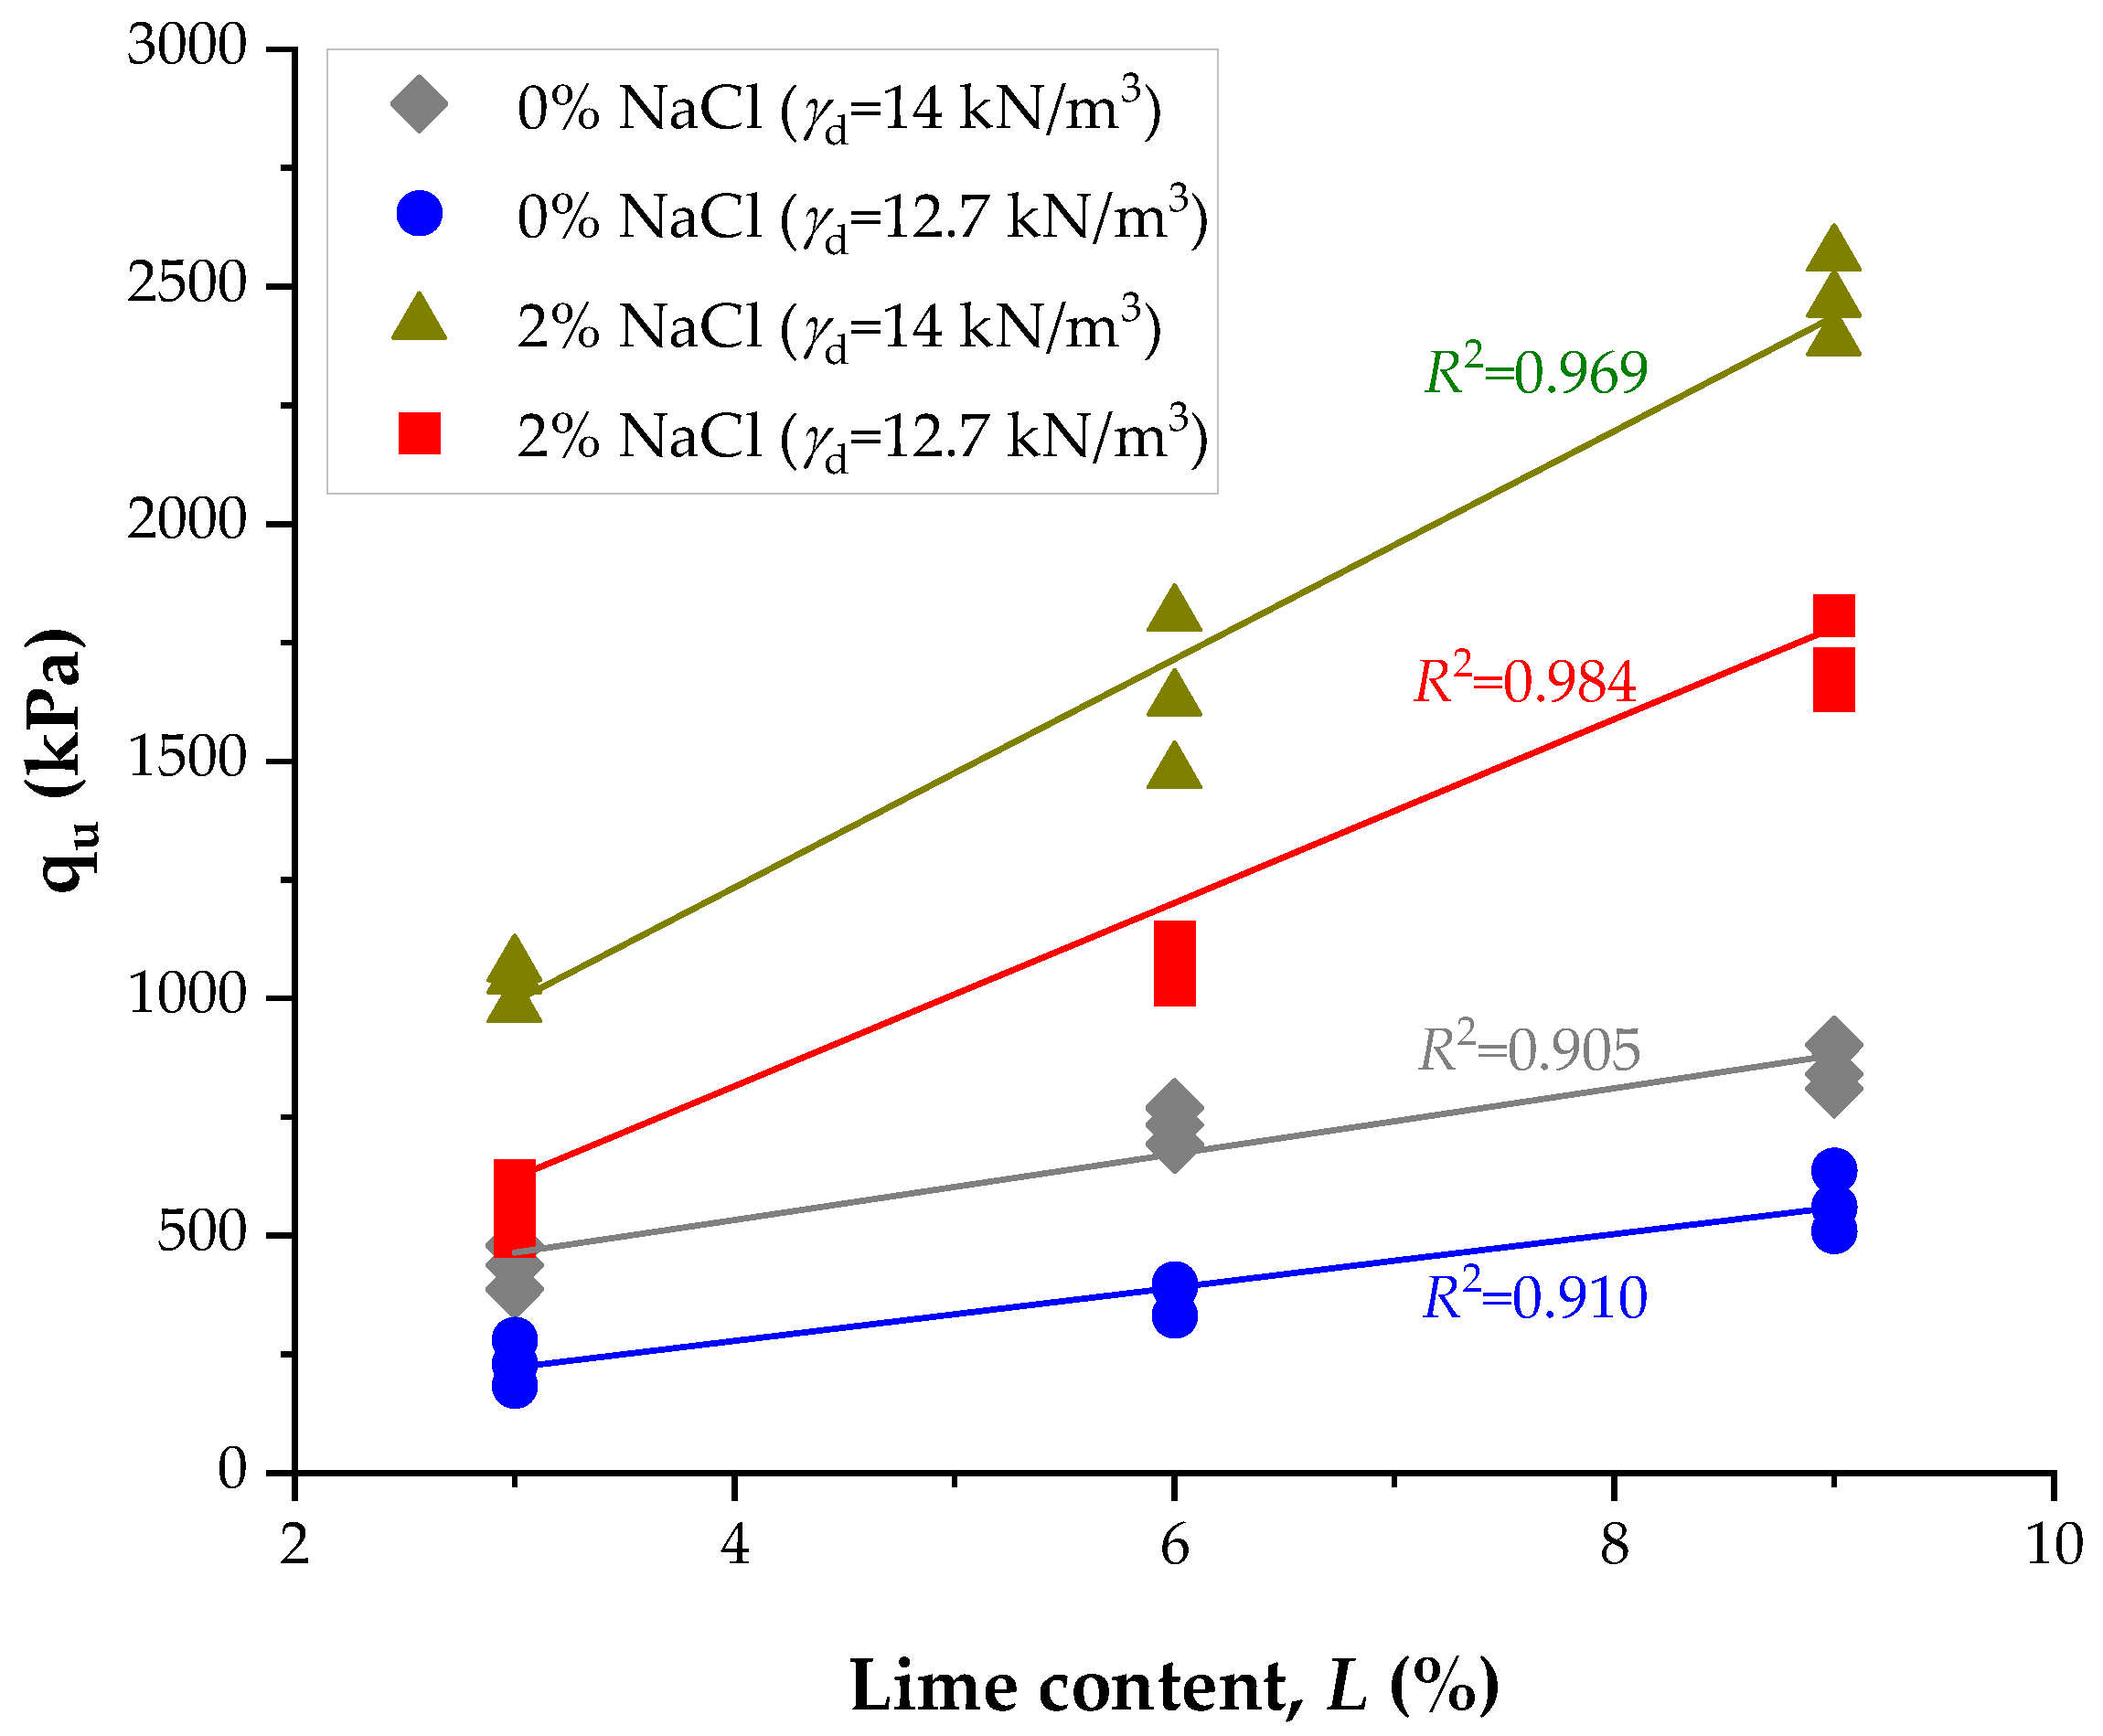
After 28 days of curing, the compressive strength behavior shows a marked increase in all mixtures compared to the 14-day results, as presented in Figure 9. For samples stabilized with lime only (0% salt), strength continued to rise with increasing lime content. In specimens compacted to a higher dry unit weight (14 kN/m3), the qu increased from approximately 435 kPa at 3% lime to over 900 kPa at 9%, representing a gain of more than 100%. In low-density samples (12.7 kN/m3), qu values ranged from about 229 kPa at 3% lime to 637 kPa at 9%, showing a similar but more modest growth trend.
Incorporating 2% NaCl significantly enhanced the strength gain at 28 days. For high-density mixtures with salt, qu increased dramatically, reaching up to 2567 kPa at 9% lime, compared to 901 kPa without salt—an increase of approximately 185%. At low dry densities, the same combination achieved values around 1808 kPa, indicating that even under suboptimal compaction, NaCl catalyzes lime–soil reactions effectively. Strength improvements due to salt were more pronounced at higher lime contents, suggesting a synergistic effect between lime and NaCl, which strengthens over time. Higher bulk density and lower porosity reduce the potential for water ingress and long-term degradation, lowering maintenance requirements and extending the service life of stabilized layers. This leads to fewer repairs, reduced consumption of new materials, and lower life-cycle emissions.

3.4. Influence of NaCl and Lime Content on Stiffness

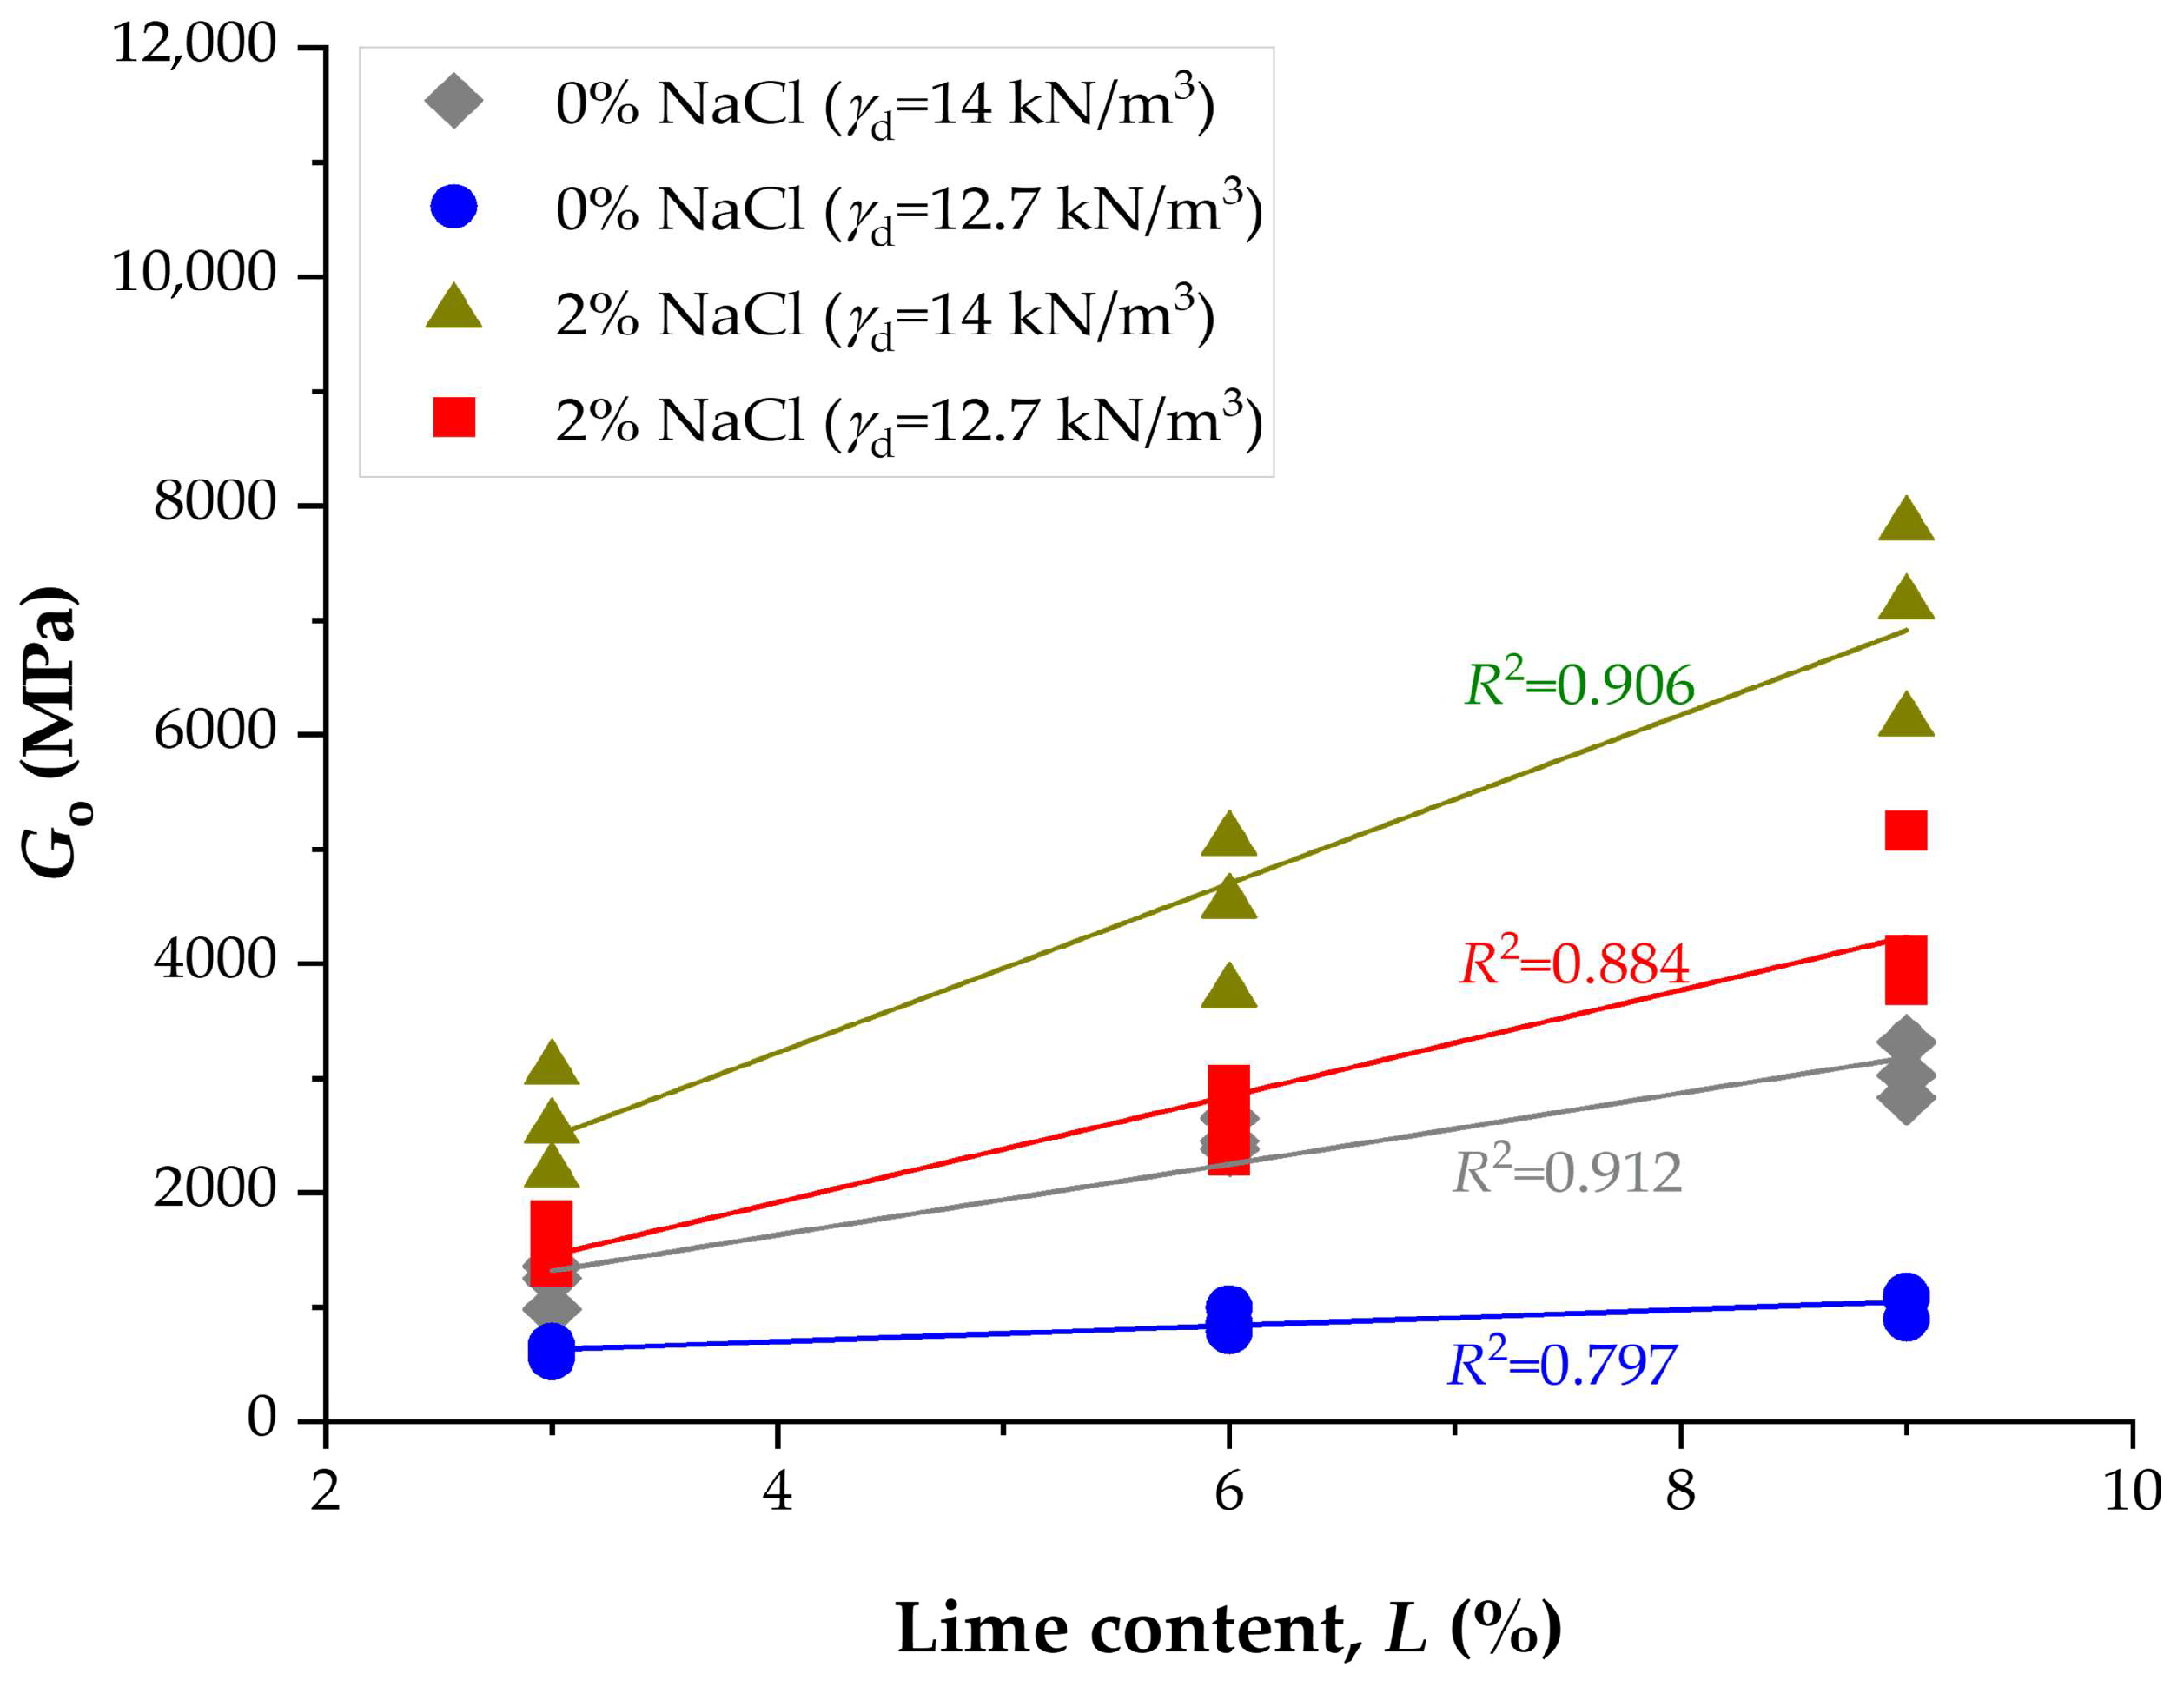
Figure 10 shows the results of Go influenced by lime content, NaCl, and dry unit weight over 14 days. During 14 days of curing, the small-strain shear modulus (Go) increased progressively with lime content and dry unit weight. In mixtures without NaCl, specimens compacted to high dry densities (14 kN/m3) exhibited Go values ranging from approximately 1250 MPa at 3% lime to 3315 MPa at 9% lime. At lower compaction levels, Go values were markedly reduced, with values between 555 MPa and 1103 MPa, depending on the lime content. Adding 2% NaCl produced a pronounced enhancement in stiffness; Go values rose to over 7000 MPa at 9% lime and high density, nearly tripling the values of the corresponding mixtures without salt. Even in less-compacted specimens, the presence of NaCl led to Go values as high as 5160 MPa at 9% lime, highlighting the significant catalytic effect of NaCl on early-stage cementation.
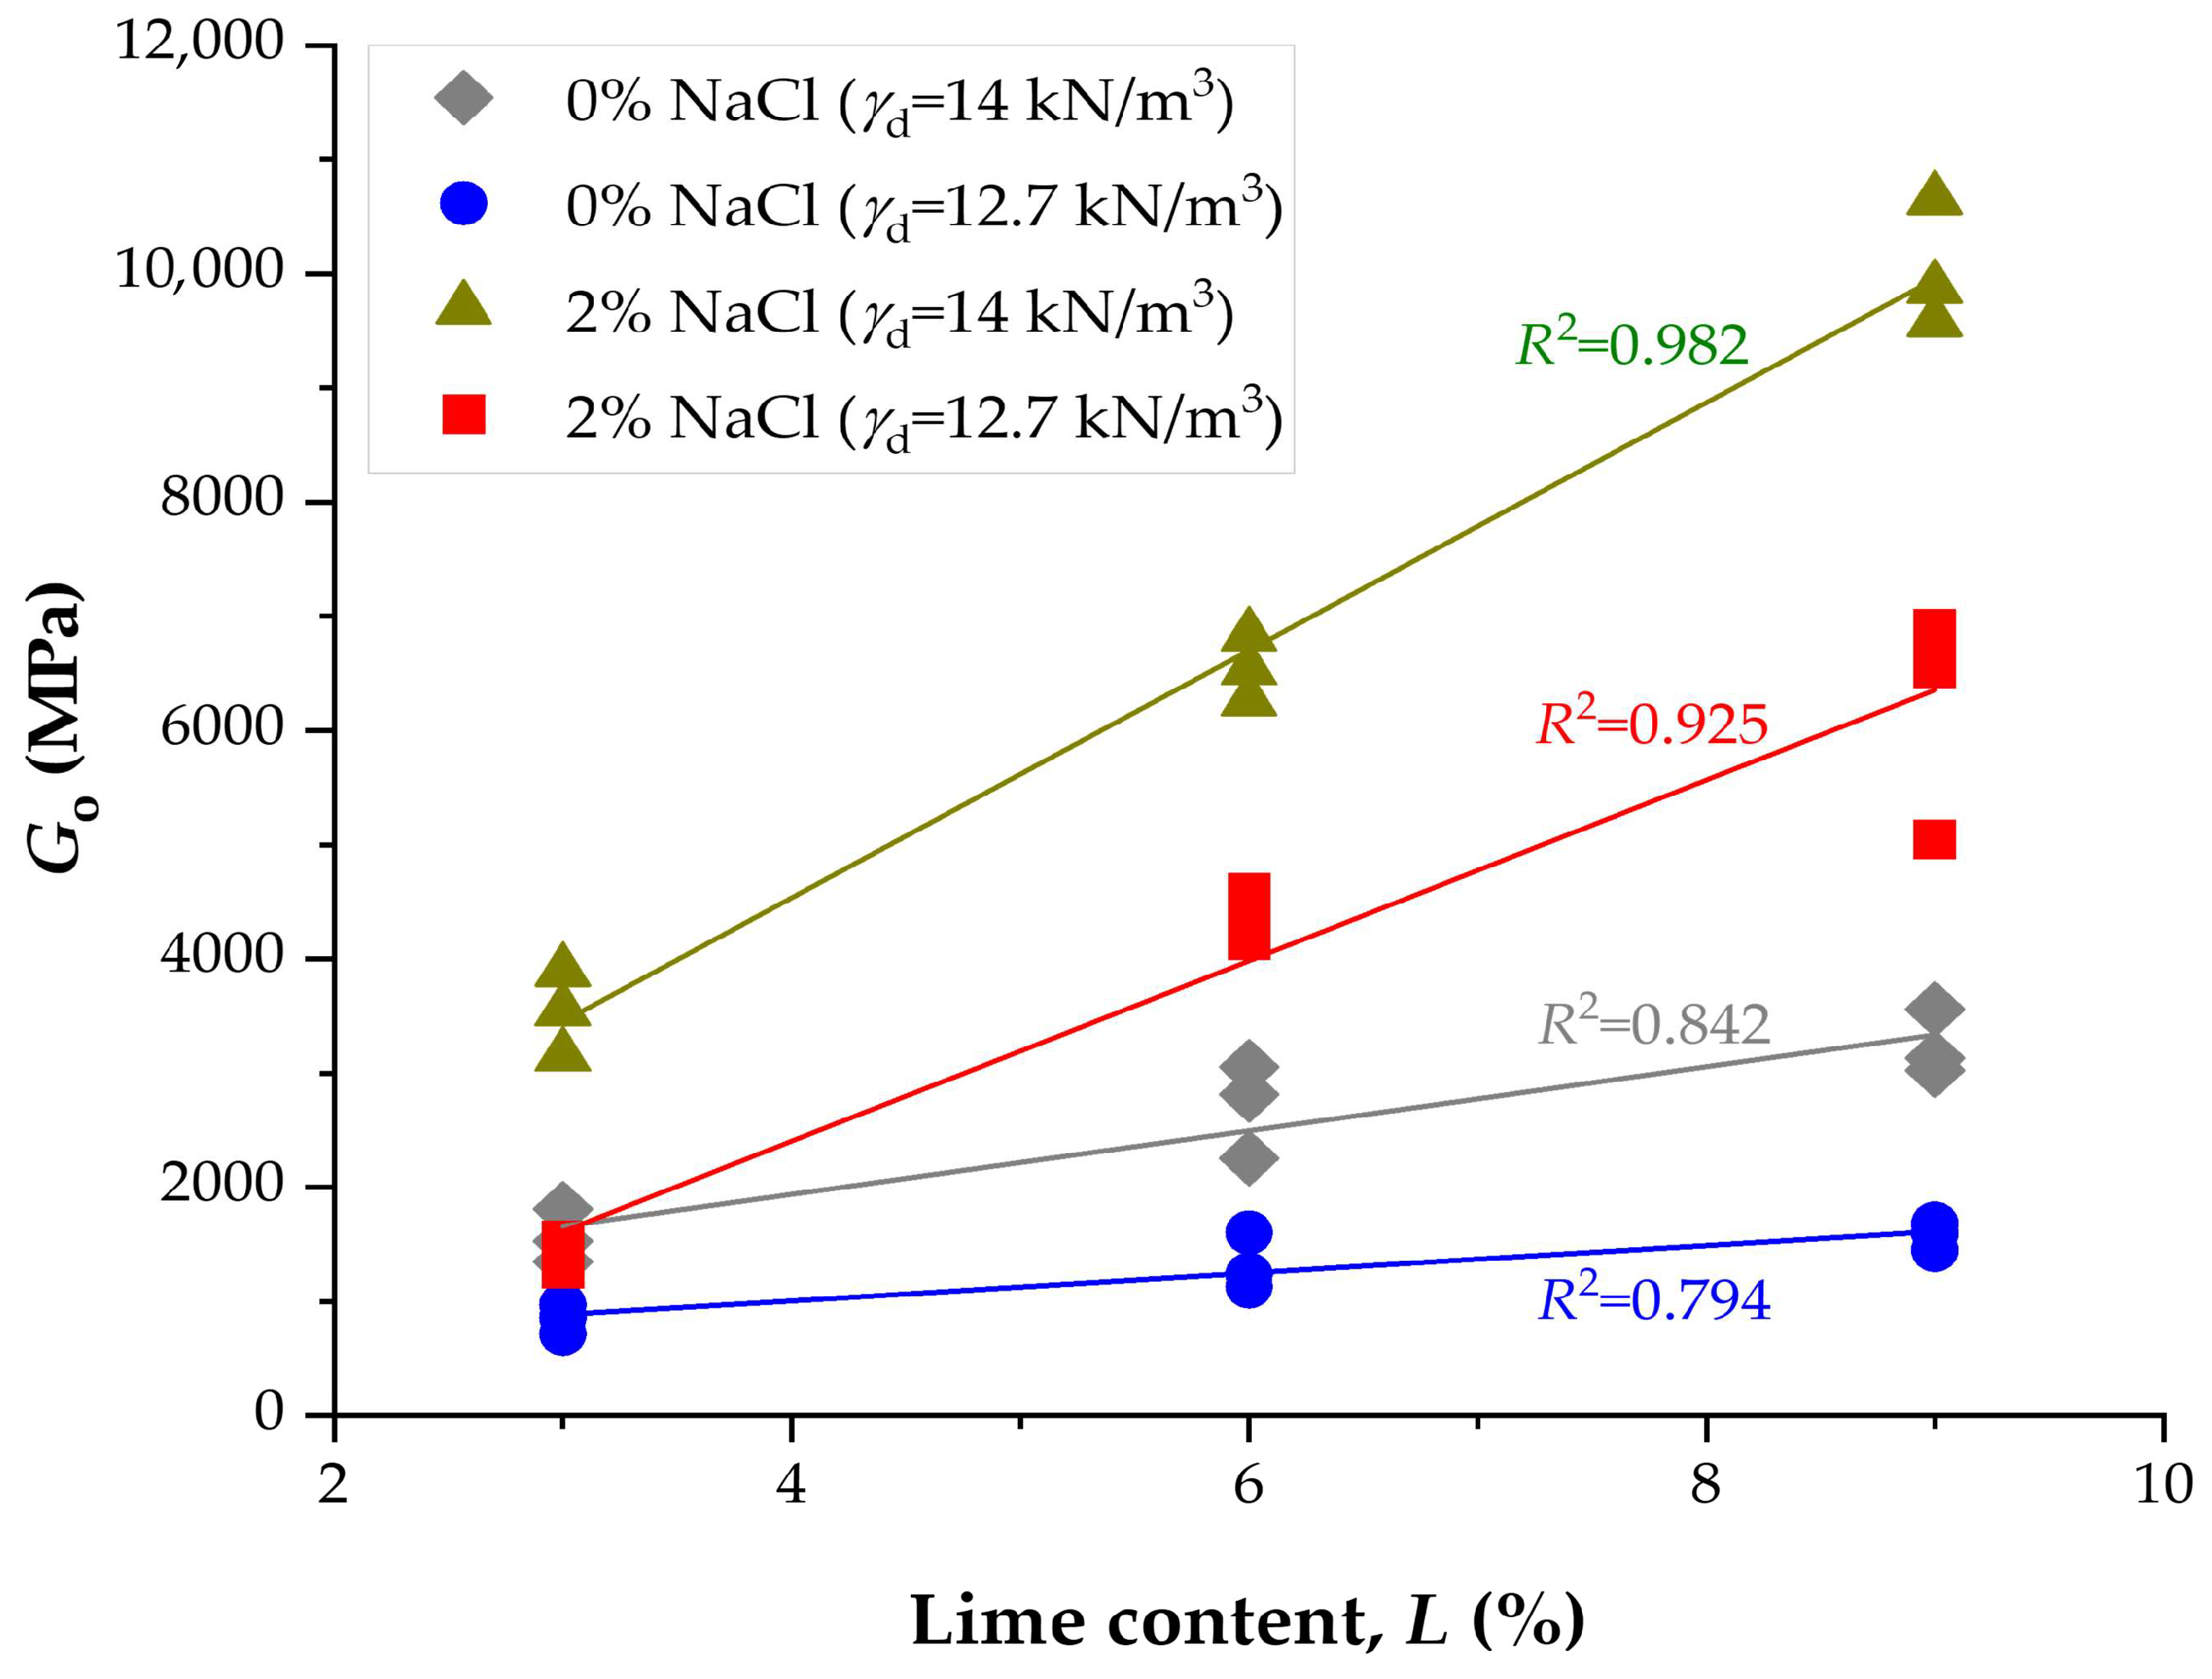
After 28 days of curing, Go values continued to increase, reflecting the ongoing development of the soil–lime matrix and long-term pozzolanic reactions, as presented in Figure 11. For lime-only mixtures at high dry densities, Go values ranged from 1350 MPa (3% lime) to 3560 MPa (9% lime), indicating modest but consistent gains relative to the 14-day values. In contrast, NaCl-stabilized specimens exhibited much higher stiffness, with Go values reaching 10,652 MPa at 9% lime and high density. These values were also significantly elevated at lower densities, with Go ranging between 5047 MPa and 6891 MPa for 9% lime. These results suggest that the combined effect of NaCl and lime continues to strengthen the soil matrix beyond the initial curing period, with particularly high gains at higher lime contents.
The comparison between 14-day and 28-day curing periods confirms the time-dependent enhancement of stiffness, especially in mixtures treated with lime and NaCl. While lime-only specimens showed gradual increases in Go with time (typically between 10% and 25% for each lime level), the increase in NaCl-treated samples was more pronounced. For example, at 9% lime and high density, Go increased from approximately 7800 MPa at 14 days to over 10,000 MPa at 28 days, representing an improvement of more than 30%. These findings demonstrate that NaCl accelerates early-stage reactions and contributes to the sustained development of a denser and stiffer soil skeleton over time.

3.5. Influence of Porosity-to-Lime Index on Unconfined Compressive Strength and Stiffness of Compacted Blends

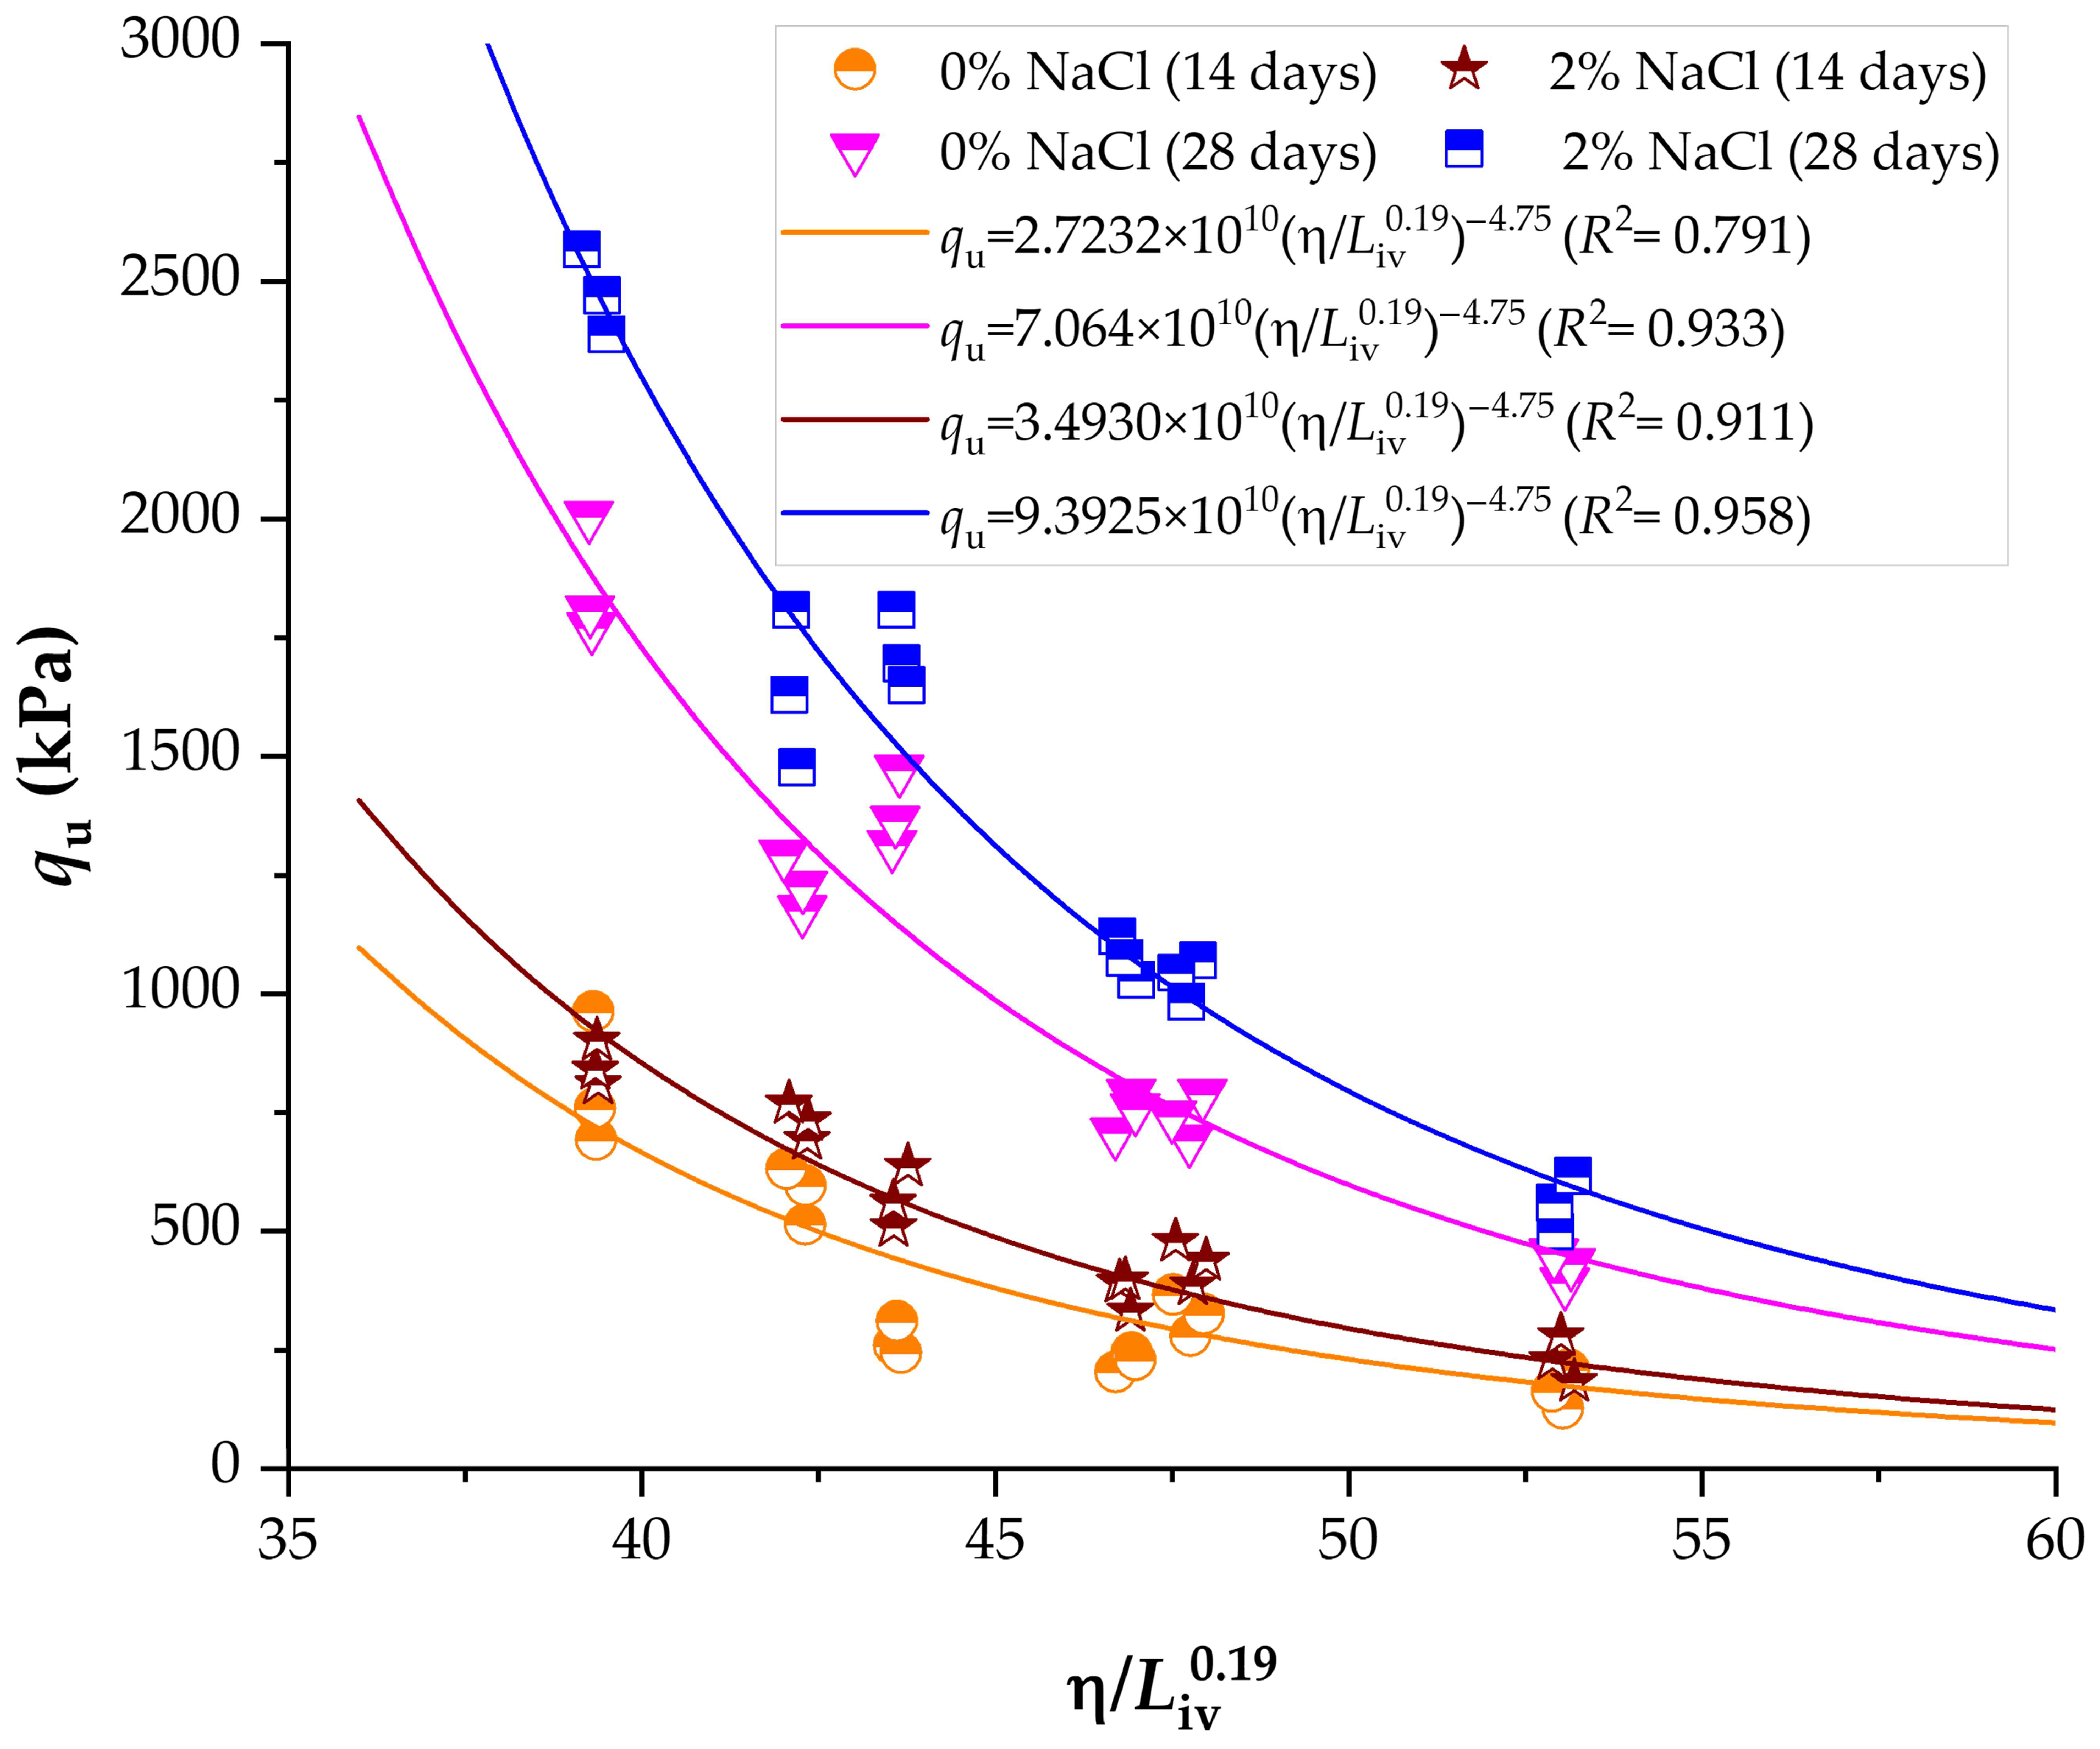
Several studies [22,32] have demonstrated that the porosity-to-lime index governs soil compacted blends’ strength, stiffness, and durability. Figure 12 illustrates the correlation between the porosity-to-lime index (adjusted to 0.19) and the unconfined compressive strength (qu) of lime–clay mixtures with 0% and 2% NaCl after 14 and 28 days of curing. The exponent x = 0.19 used in the porosity-to-lime index was obtained through non-linear regression of the experimental data, minimizing the residuals between measured and predicted values of both unconfined compressive strength and small-strain shear modulus. This exponent represents the best-fit adjustment for our data and is consistent with the range reported in previous studies on cemented and lime-treated soils [14,33]. Four regression equations were derived for each type of mixture depending on NaCl content and curing period, all showing high coefficients of determination (R2 > 0.791). These equations confirm that qu increases with curing time and NaCl addition. For instance, previous research has also related qu to the porosity-to-lime index when using supplementary binders such as fly ash or industrial byproducts. In these cases, qu is expressed as a power function of the porosity-to-lime ratio, where a constant A (in kPa) is multiplied by the porosity-to-lime ratio raised to an exponent x, as shown in Equation (2).
q u = A η L i v x B
A, x, and B values depend on the soil and lime properties and their interaction. Constant A is expressed in kPa. For lime–soil mixtures, the exponent x typically ranges between 0.11 and 0.12, although several studies have reported higher values of 0.88 and 0.92 (references). For clean, uniformly graded sands, x is usually close to 1.0, while for other types of sand, it tends to be around 0.28. This implies that when the influence of porosity and lime content on qu is equivalent, the exponent x should be equal to 1. Conversely, when the effects of porosity ( η ) and lime content (Liv) differ, x takes lower values than 1. Recent studies by Diambra et al. [34,35] suggest that x is a key parameter linking peak strength to the soil state parameter.
The regression models obtained for the lime–soil–NaCl mixtures exhibit a consistent functional form, expressed as a power relationship between the unconfined compressive strength (qu) and the porosity-to-lime index ( η / L i v 0.19 ). All four equations share the same exponent (−4.75), while the prefactor A varies depending on the curing period and NaCl content. This invariance in slope suggests that the porosity-to-lime index intrinsically governs the controlling mechanism of strength development, whereas curing time and salt addition merely shift the strength envelope upward by increasing the constant A. A quantitative comparison of the A values highlights the relative contribution of curing and NaCl. Extending the curing period from 14 to 28 days increases A by approximately 3.1 in lime-only mixtures and 2.7 in those containing NaCl. Likewise, 2% NaCl enhances A by 54% at 14 days and 33% at 28 days. These results confirm that curing time exerts the dominant effect on strength gain, while NaCl provides an additional catalytic effect that accelerates early pozzolanic reactions. The exponent of −4.75 indicates a pronounced sensitivity of qu to the porosity-to-lime index. A 10% increase in the index results in a reduction in strength of nearly 36%, while a 10% reduction in the index produces an increase of about 65%. Consequently, modest improvements in compaction (reducing porosity) or the effective lime content yield disproportionately large gains in strength. This finding reinforces the central role of physical densification and binder dosage in achieving target performance.
Inverting the regression equations, threshold values of the porosity-to-lime index can be established for a given strength requirement. For example, adopting the ASTM D4609 [36] field criterion of 345 kPa, the maximum permissible index ranges from 44.3 (0% NaCl, 14 days) to 59.7 (2% NaCl, 28 days). Thus, adding NaCl and extended curing raises absolute strength and relaxes the compaction and lime requirements necessary to satisfy engineering criteria.
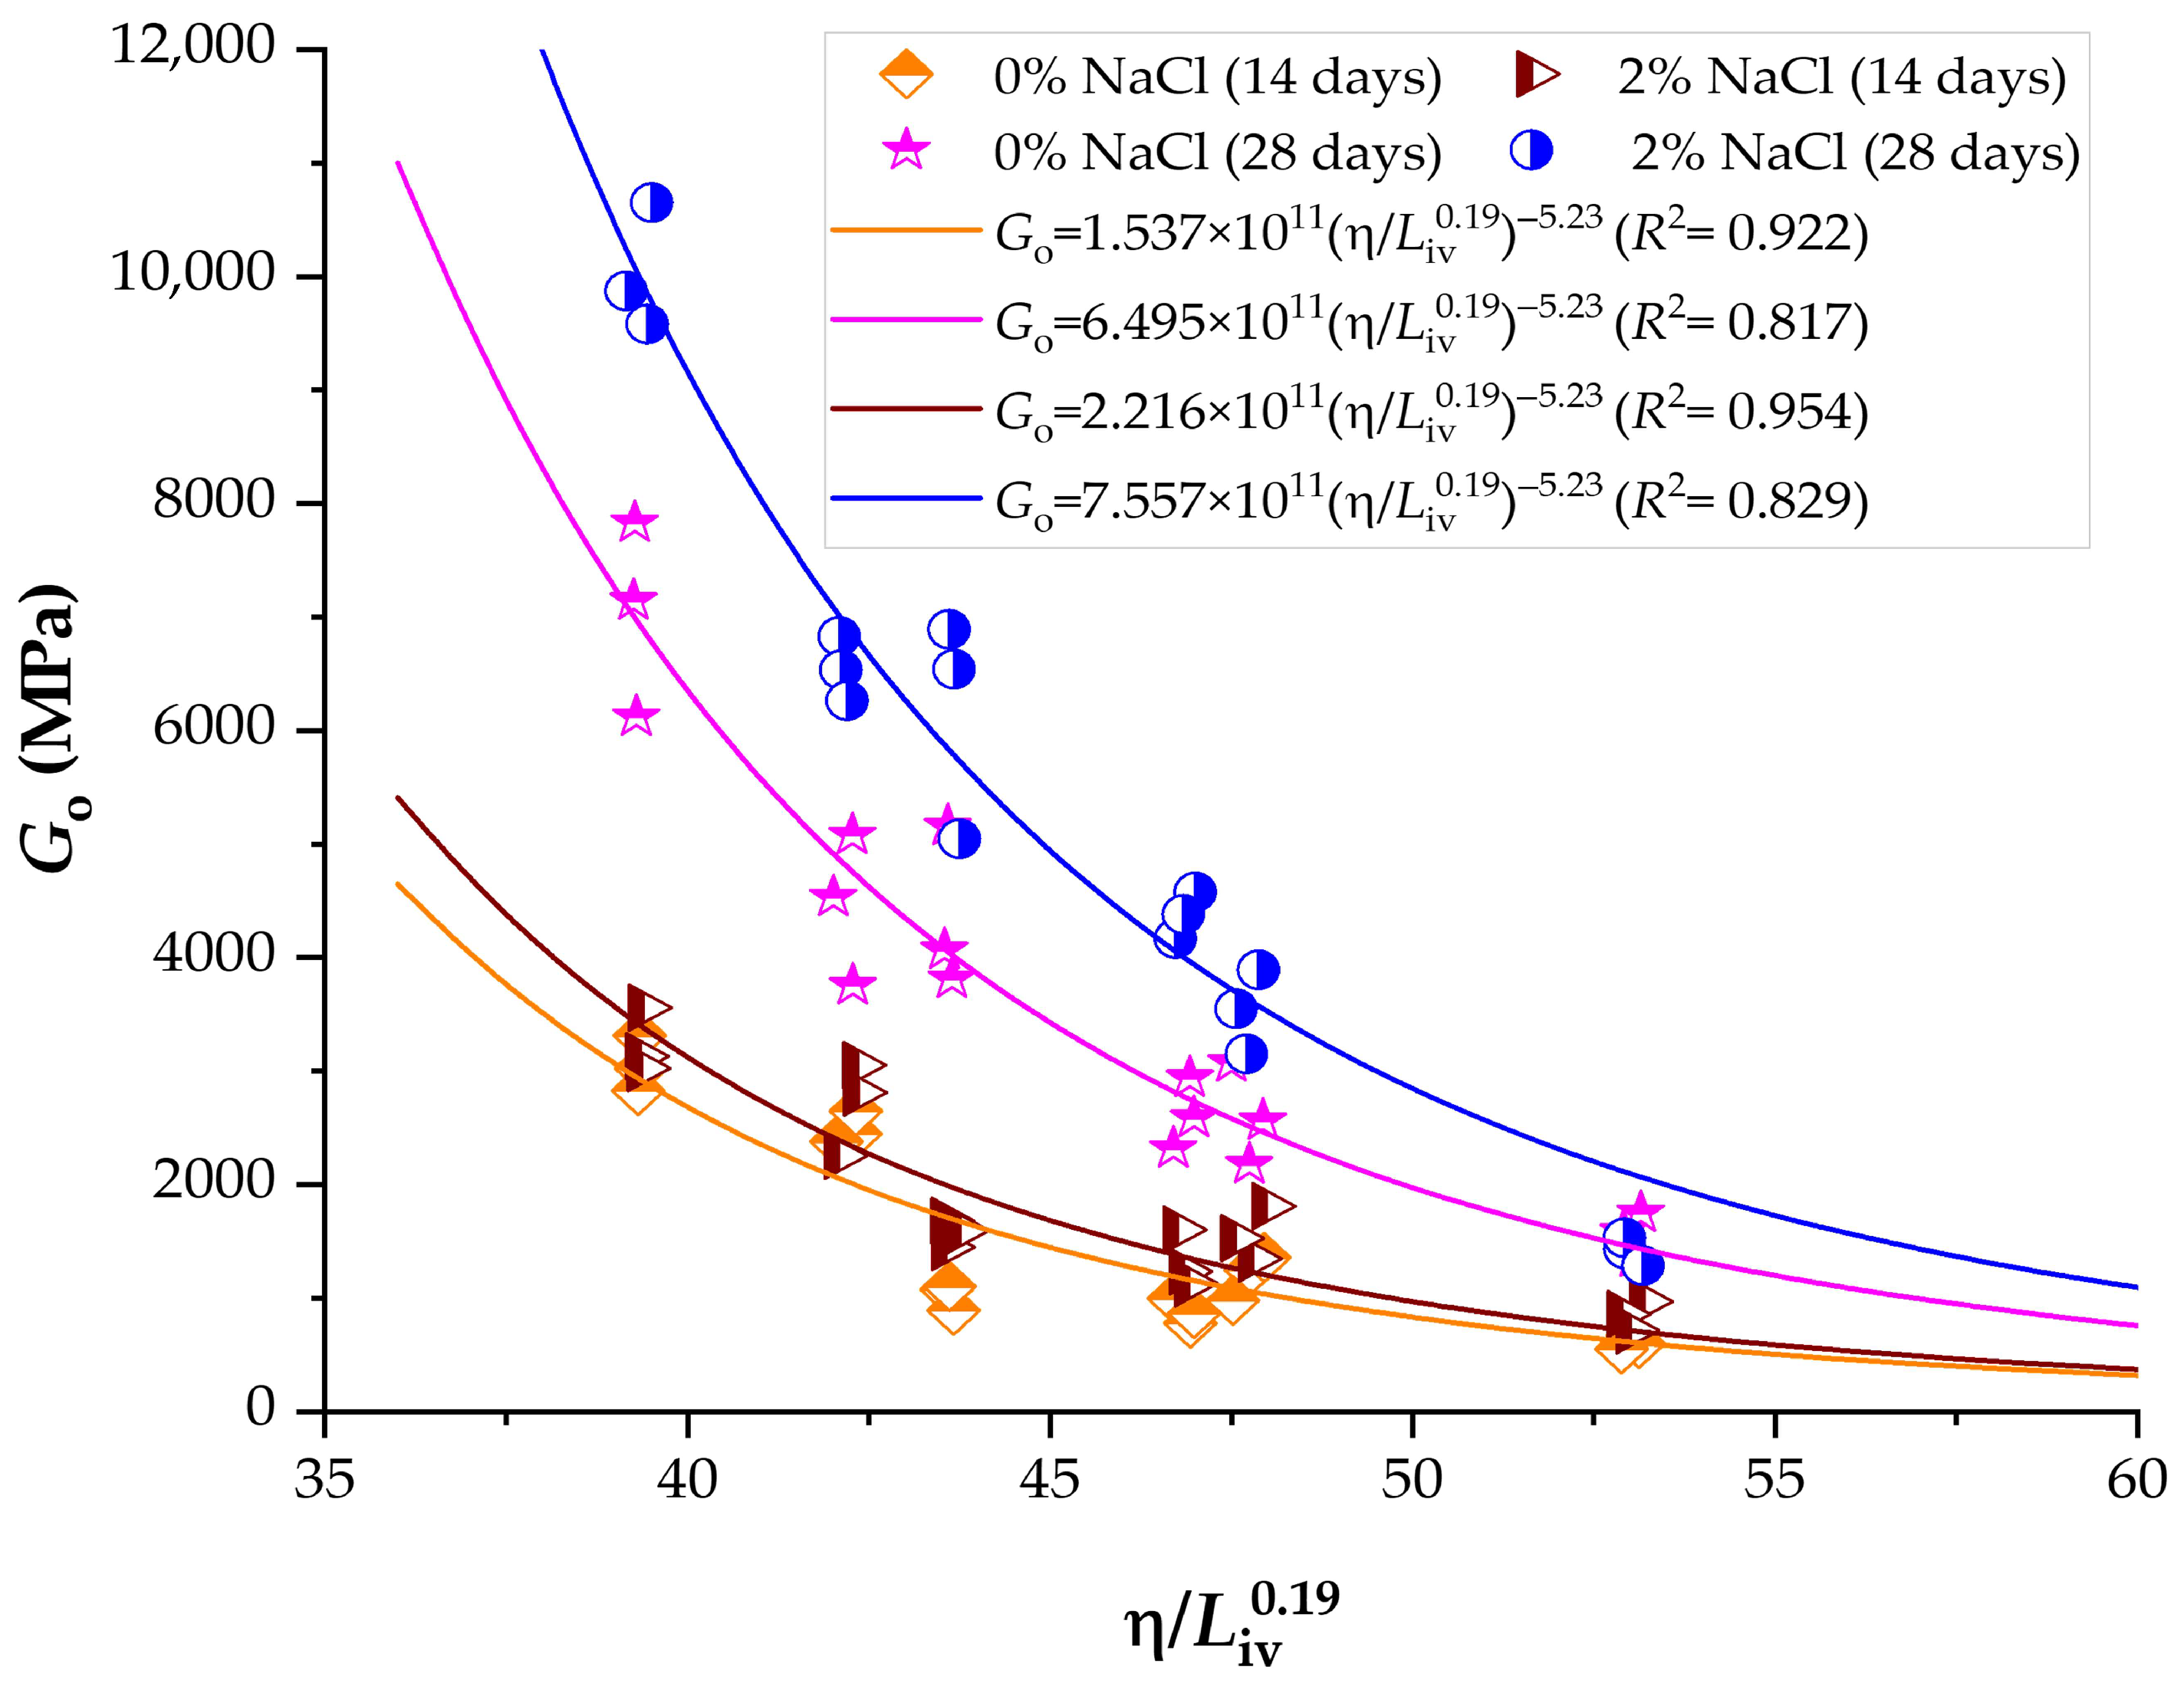
Figure 13 illustrates the correlation between the porosity-to-lime index (adjusted to 0.19) and the stiffness Go of lime–clay mixtures with 0% and 2% NaCl after 14 and 28 days of curing. Similarly to unconfined compressive strength, several studies have shown that the initial stiffness (Go) of lime–soil mixtures is also controlled by the porosity-to-lime index, following a power-type relationship as expressed in Equation (3).
G O = A η L i v x B
The constants A, x, and B depend on the soil and lime properties and their interaction. All four Equations in Figure 13 exhibit the same exponent (−5.23), indicating that the stiffening mechanism is consistently governed by the porosity-to-lime index, irrespective of curing period or NaCl content. The influence of curing and NaCl is reflected in the prefactor A, which increases substantially with curing time and salt addition. Quantitatively, the prefactor rises by a factor of 4.2 when extending curing from 14 to 28 days without NaCl, and 3.4 with 2% NaCl. Likewise, including NaCl increases A by 44% at 14 days and 16% at 28 days. These results confirm that curing time is the dominant factor controlling stiffness gain, while NaCl enhances early-age development, accelerating the formation of cementitious bonds. The steep exponent (−5.23) highlights the high sensitivity of Go to the porosity-to-lime index. Even modest improvements in compaction or lime content translate into disproportionately large increases in stiffness.

3.6. Normalization of Strength and Stiffness Using the Porosity-to-Lime Index

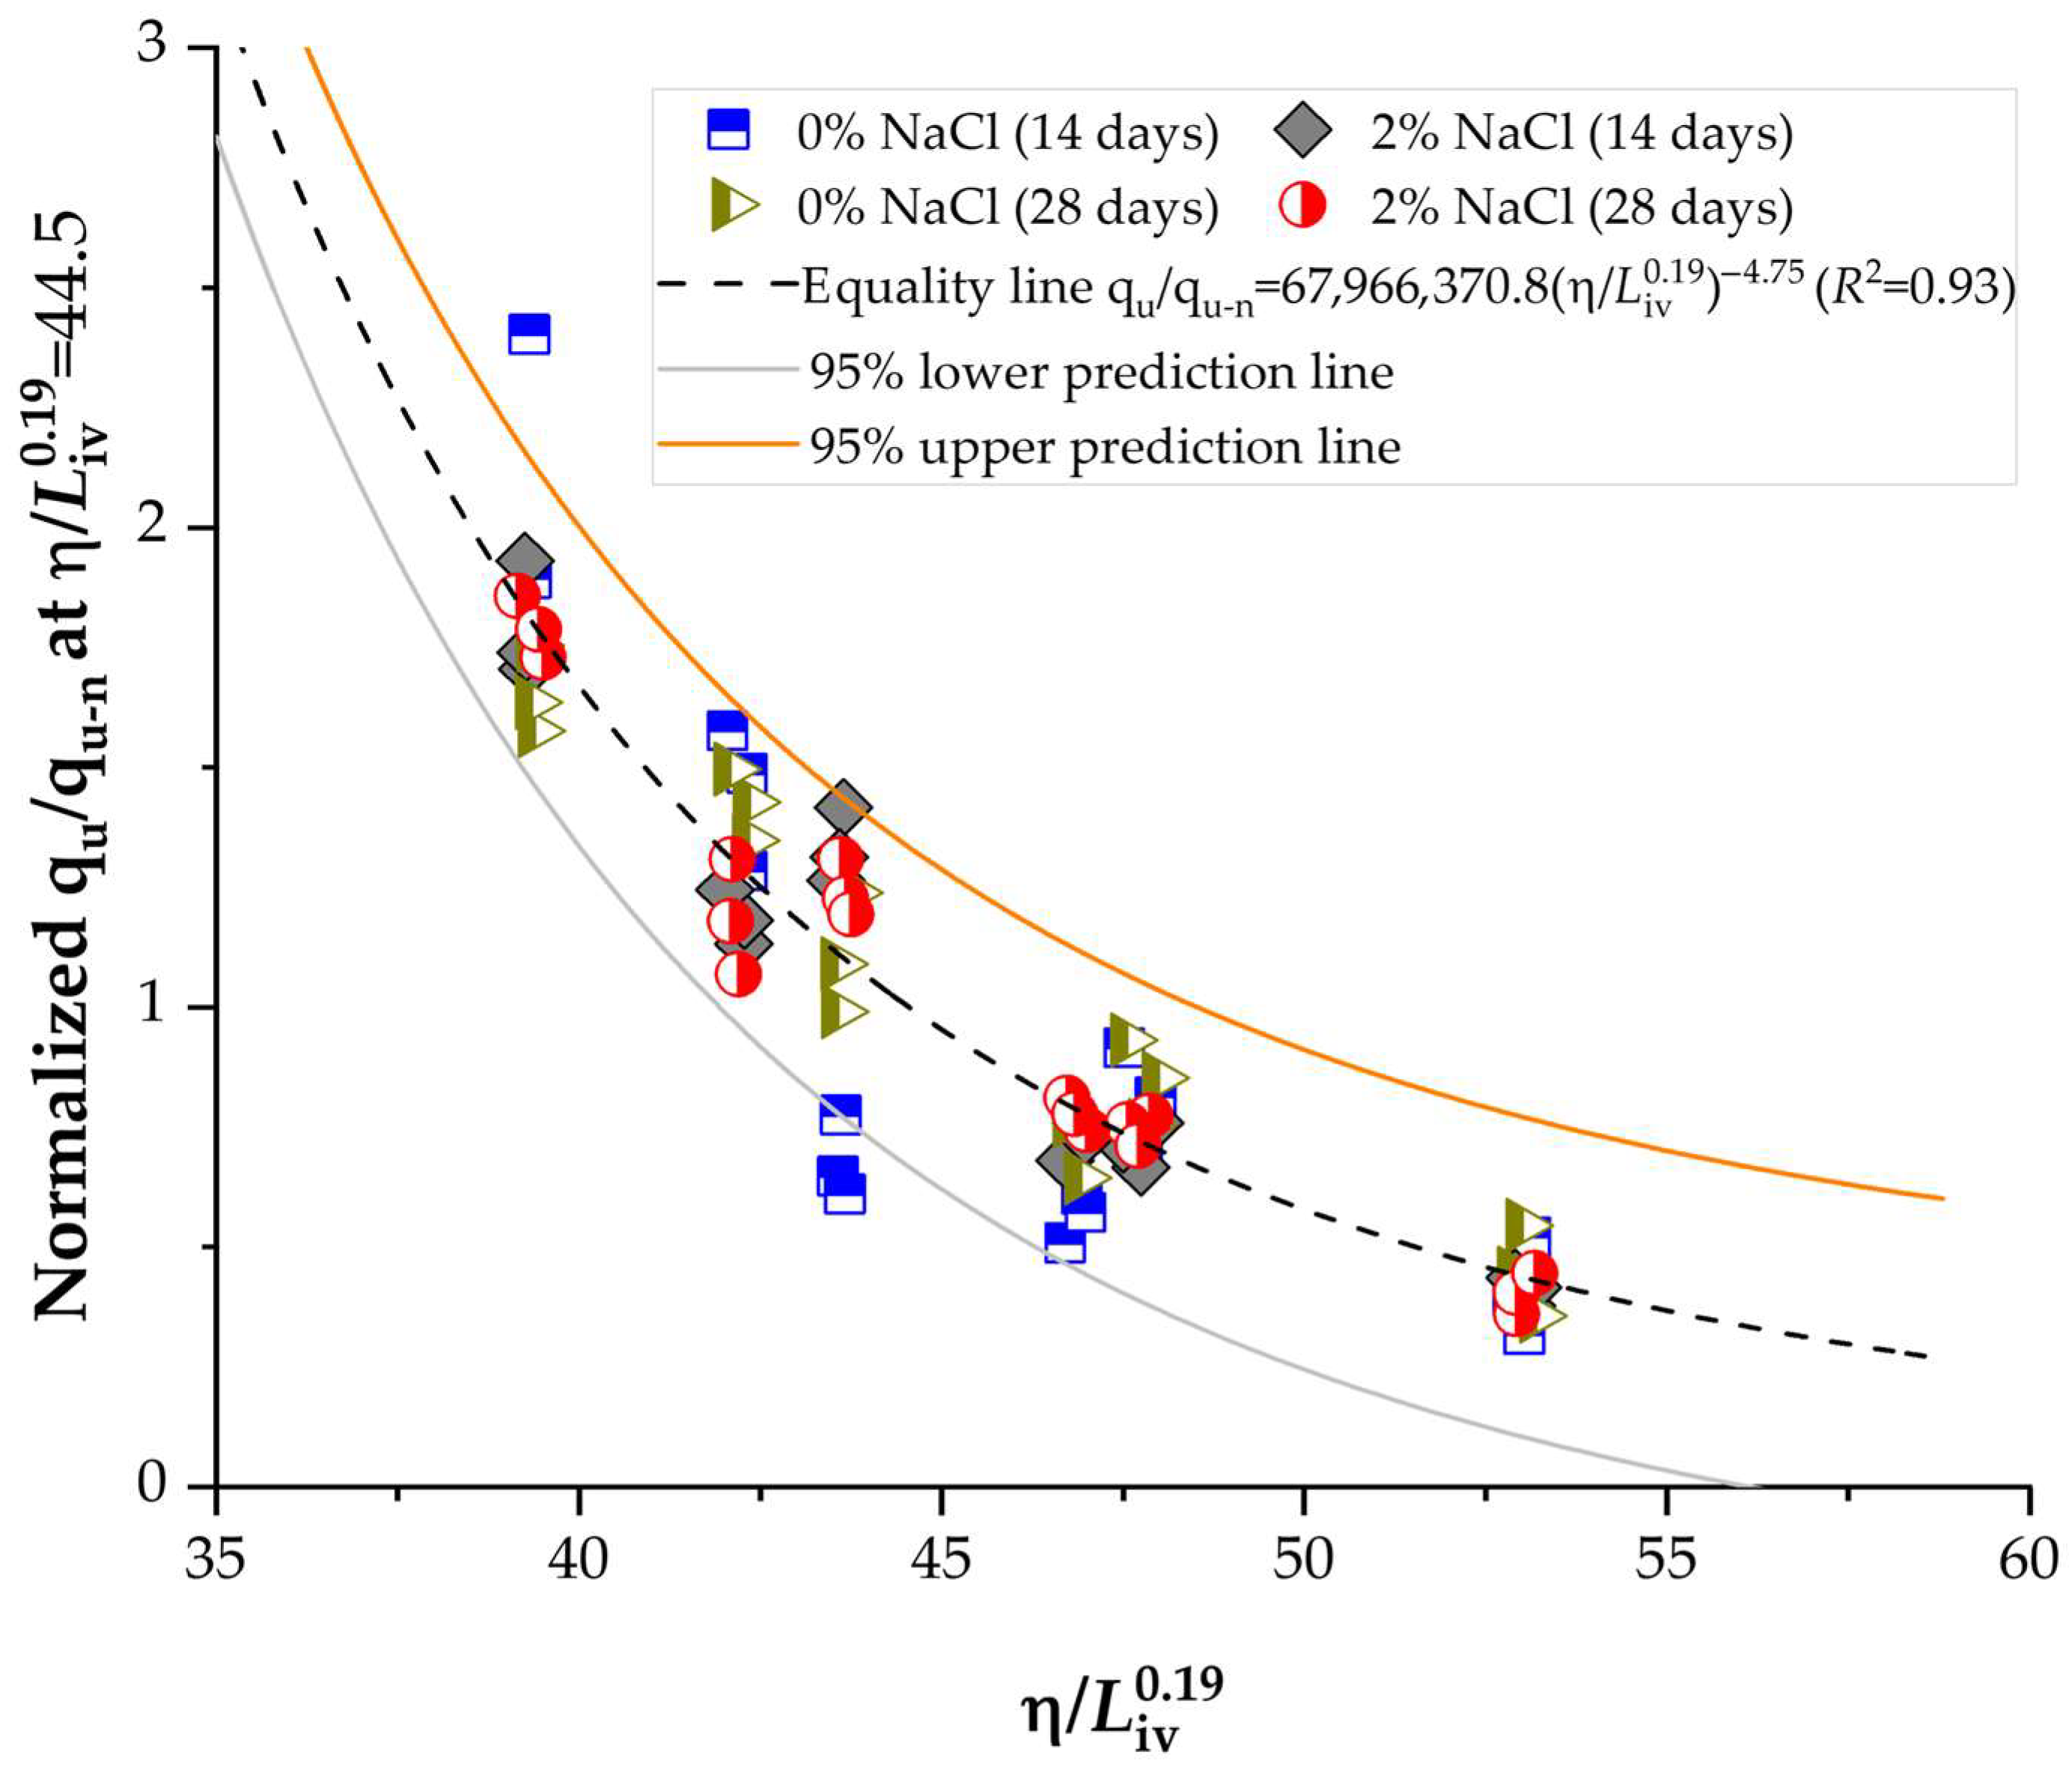
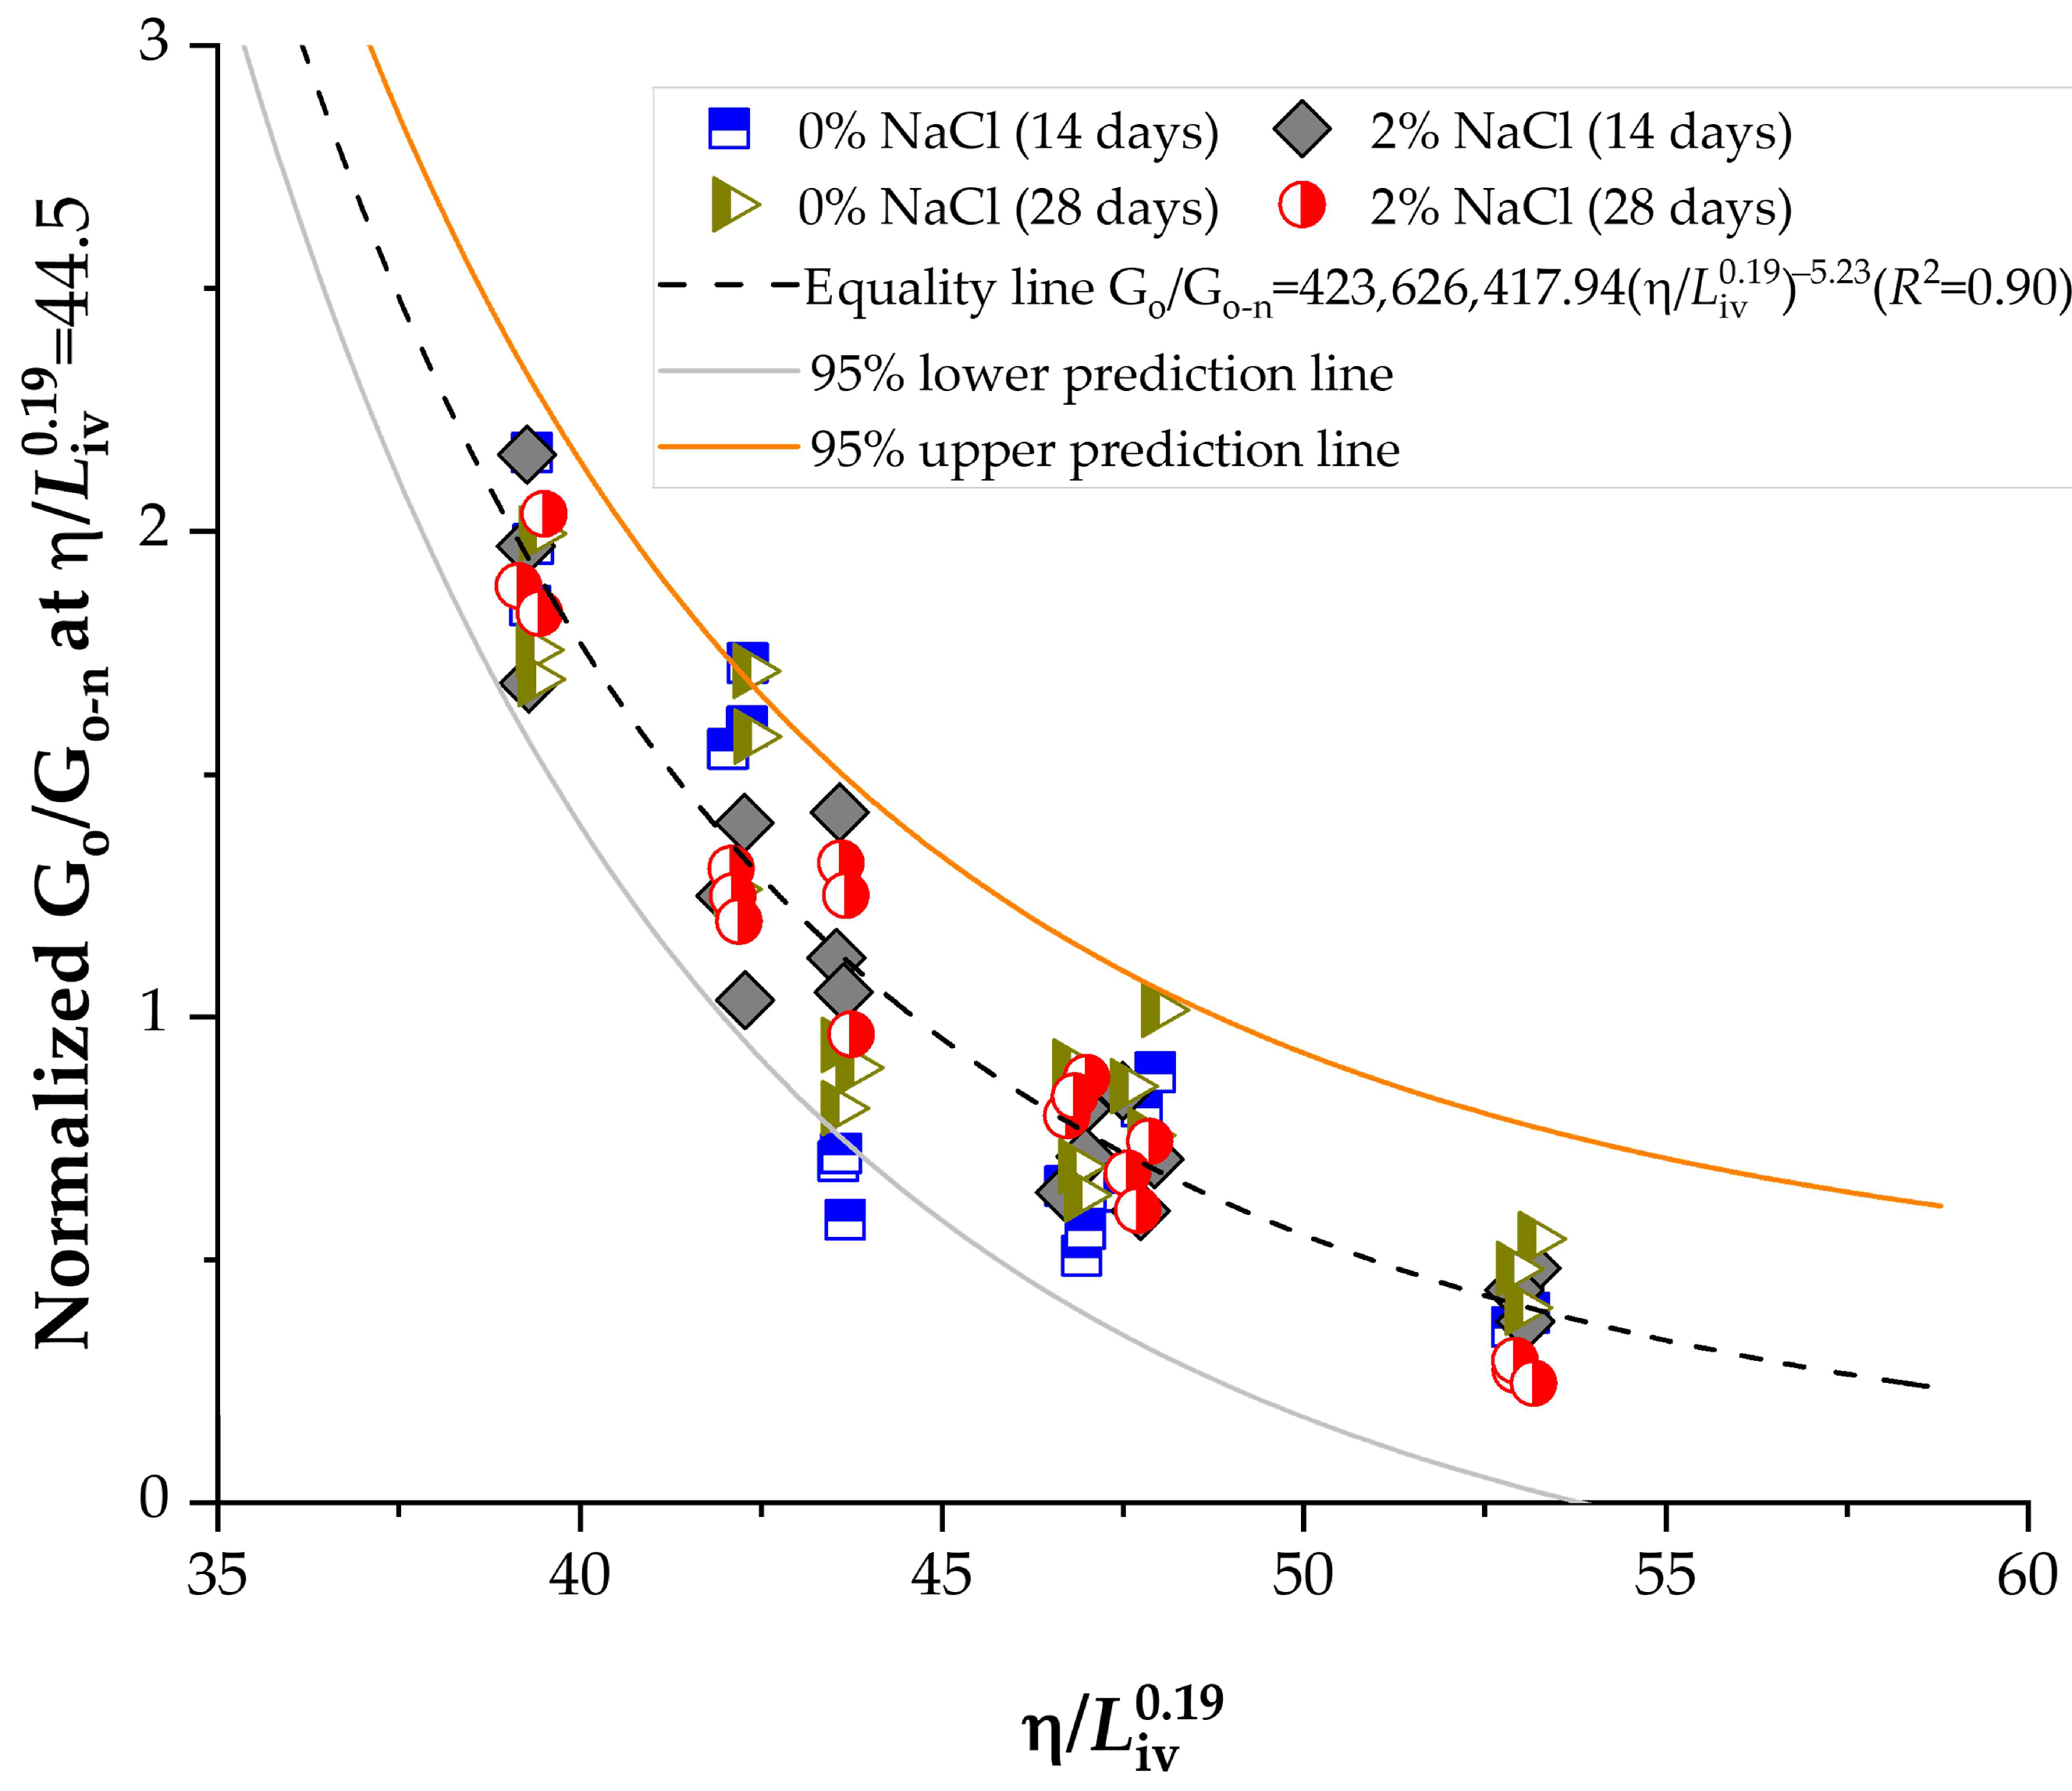
In the normalization process, each measured strength (qu) and stiffness (Go) value was divided by its corresponding normalization parameter, as reported in Table 5. The normalization values of strength and stiffness were obtained by substituting η / L i v 0.19 = 44.5 % into the equations in Figure 12 for strength and the equations in Figure 13 for stiffness. In this way, Figure 14 presents the normalized strength as a function of the porosity-to-lime index and NaCl content for all mixtures. The regression analysis yielded a normalization equation for strength with a coefficient of determination of R2 = 0.93 (Equation (4)). Similarly, Figure 15 shows the normalized stiffness results, with the corresponding equation achieving R2 = 0.90 (Equation 5). These high determination coefficients confirm the robustness of the normalization approach and its applicability as a predictive tool for lime–soil–NaCl stabilization systems.
q u q u n η / L i v x = 44.5 = 67966370.8 η / L i v 0.19 4.75   R 2 = 0.93
G o G o n η / L i v x = 44.5 = 423626417.94 η / L i v 0.19 5.23   R 2 = 0.90

3.7. Go/qu Index

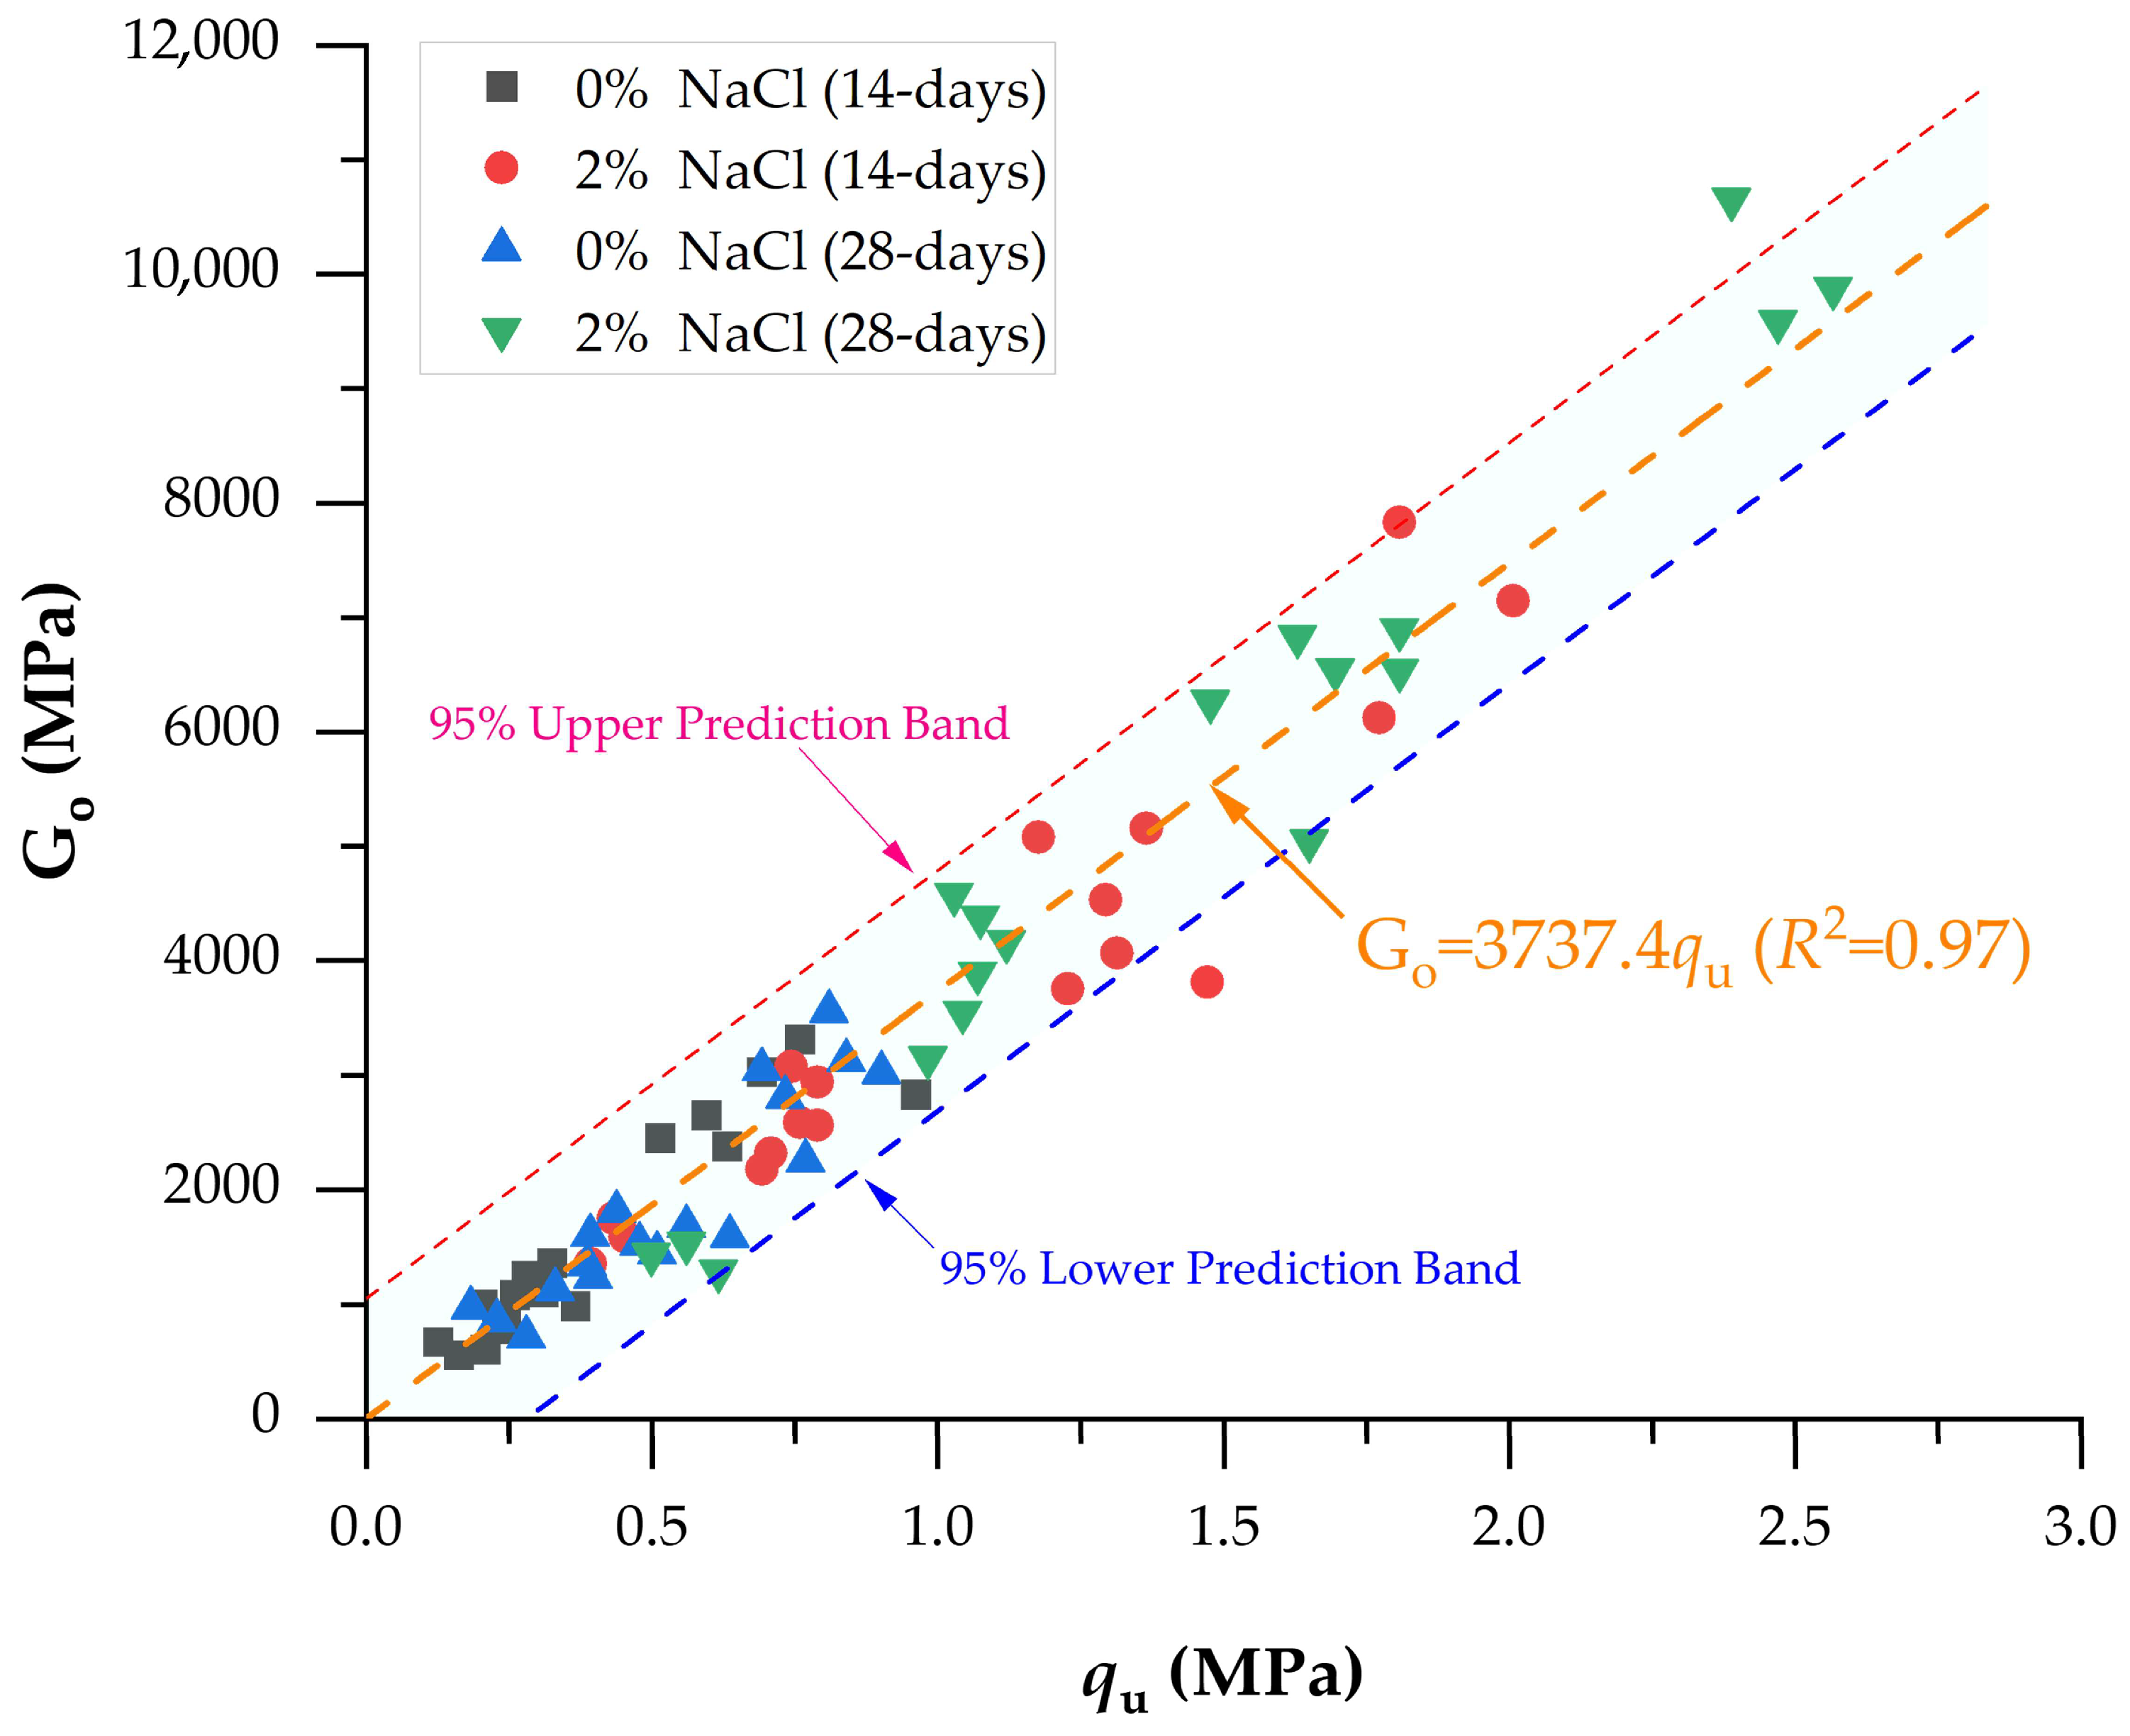
The increase in the stiffness of lime–stabilized soil mixtures also enhances mechanical strength, primarily due to cementitious processes occurring within the soil matrix [37]. Consequently, determining an amplification constant is significant in assessing the Go/qu ratio. Figure 16 illustrates the direct relationship between unconfined compressive strength (qu) and the initial small-strain stiffness (Go, in MPa). For the highest qu values (up to 2 MPa), the corresponding Go values exceeded 8000 MPa, consistent with values reported in previous studies on lime-treated clays [38]. The relationship obtained in this study was best described by a linear fit, indicating that Go depends on qu across all curing times and lime/NaCl contents. The constant derived from this correlation was Go/qu = 3737.4. Other authors have also proposed a constant Go/qu ratio, as summarized in Table 6.
Several studies have reported the ratio between initial stiffness and unconfined compressive strength (Go/qu) for various stabilized geomaterials. For instance, clayey soil treated with cement and crushed limestone waste (CLW) presented a Go/qu ratio of 4828.8 [14], while sand–cement mixtures exhibited a higher value of 7465.9 [39]. In contrast, biopolymer-based stabilization, such as clayey soil with xanthan gum, showed a significantly lower ratio of 1915.3 [17]. When glass powder and cement were added to clayey soil, the Go/qu ratio increased to 2909.68 [31]. Mixtures of sand with ground glass and carbide lime demonstrated remarkably high ratios, reaching 21,690 after 7 days and 30,690 after 180 days of curing [40]. In addition, soils from different origins treated with glass powder and carbide lime showed variable behavior, with Osorio sand reaching 2169.49 [41], Rio Pardo sand 1785.74 [41], and Porto Alegre sand only 985.34 [41]. The ratio of 3737.4 obtained for the lime–NaCl-stabilized clay indicates a pronounced gain in small-strain stiffness relative to unconfined compressive strength. Such a high ratio is typical of cemented geomaterials, where interparticle bonding and pozzolanic reaction products provide a rigid skeleton capable of sustaining elastic shear stresses with minimal deformation. This behavior suggests that the stabilized clay exhibits a dense and well-bonded microstructure with enhanced load transfer at particle contacts, which reduces settlements and increases serviceability in engineering applications. Comparable ratios have been reported in lime- or cement-treated clays and silty soils, supporting the effectiveness of the lime–NaCl treatment in producing a stiff yet strong material [37].
Table 6. The direct relationship between stiffness and strength of different geomaterials has been reported in the literature. XG is xanthan gum and RAP is reclaimed asphalt pavement.
Type of Compacted MixUCS EquationR2Reference
Present Studyqu = 3737.4 Go0.970-
Soil–cement–natural rubber latex qu = 3686.6 Go0.910[15]
Soil–RAP–xanthan gum–XG (0.5% XG)qu = 2601Go0.981[17]
Soil–RAP–xanthan gum–XG (1.0% XG)qu = 1958.1Go0.964[17]
Soil–RAP–xanthan gum–XG (1.5% XG)qu = 1202.5Go0.923[17]
Soil–RAP–xanthan gum–XG (2.0% XG)qu = 695.47Go0.812[17]
Clayey soil–cement–limestone wastequ = 4828.8Go0.960[14]
Sand–cementqu = 7465.9Go0.860[39]
Clayey soil–xanthan gumqu = 1915.3Go0.980[17]
Clayey soil–glass powder–cementqu = 2909.68Go0.970[31]
Sand–ground glass–carbide lime (7 days)qu = 21,690Go0.990[42]
Sand–ground glass–carbide lime (180 days)qu = 30,690Go0.980[42]
Osorio sand–glass powder–carbide limequ = 2169.49Go0.940[41]
Rio Pardo sand–glass powder–carbide limequ = 1785.74Go0.850[41]
Porto Alegre sand–glass powder–carbide limequ = 985.34Go0.820[41]
Clay–tire rubber fiber–cementqu = 0.00124Go1.730.870[43]
Alluvial clay–marble dust–Portland cementqu = 1 × 10⁻⁵Go2.30550.880[44]
Clay–sintered gypsum– glass powderqu = 8.508Go0.780.900[45]

3.8. Microstructure of Lime–Soil-NaCl Compacted Blends

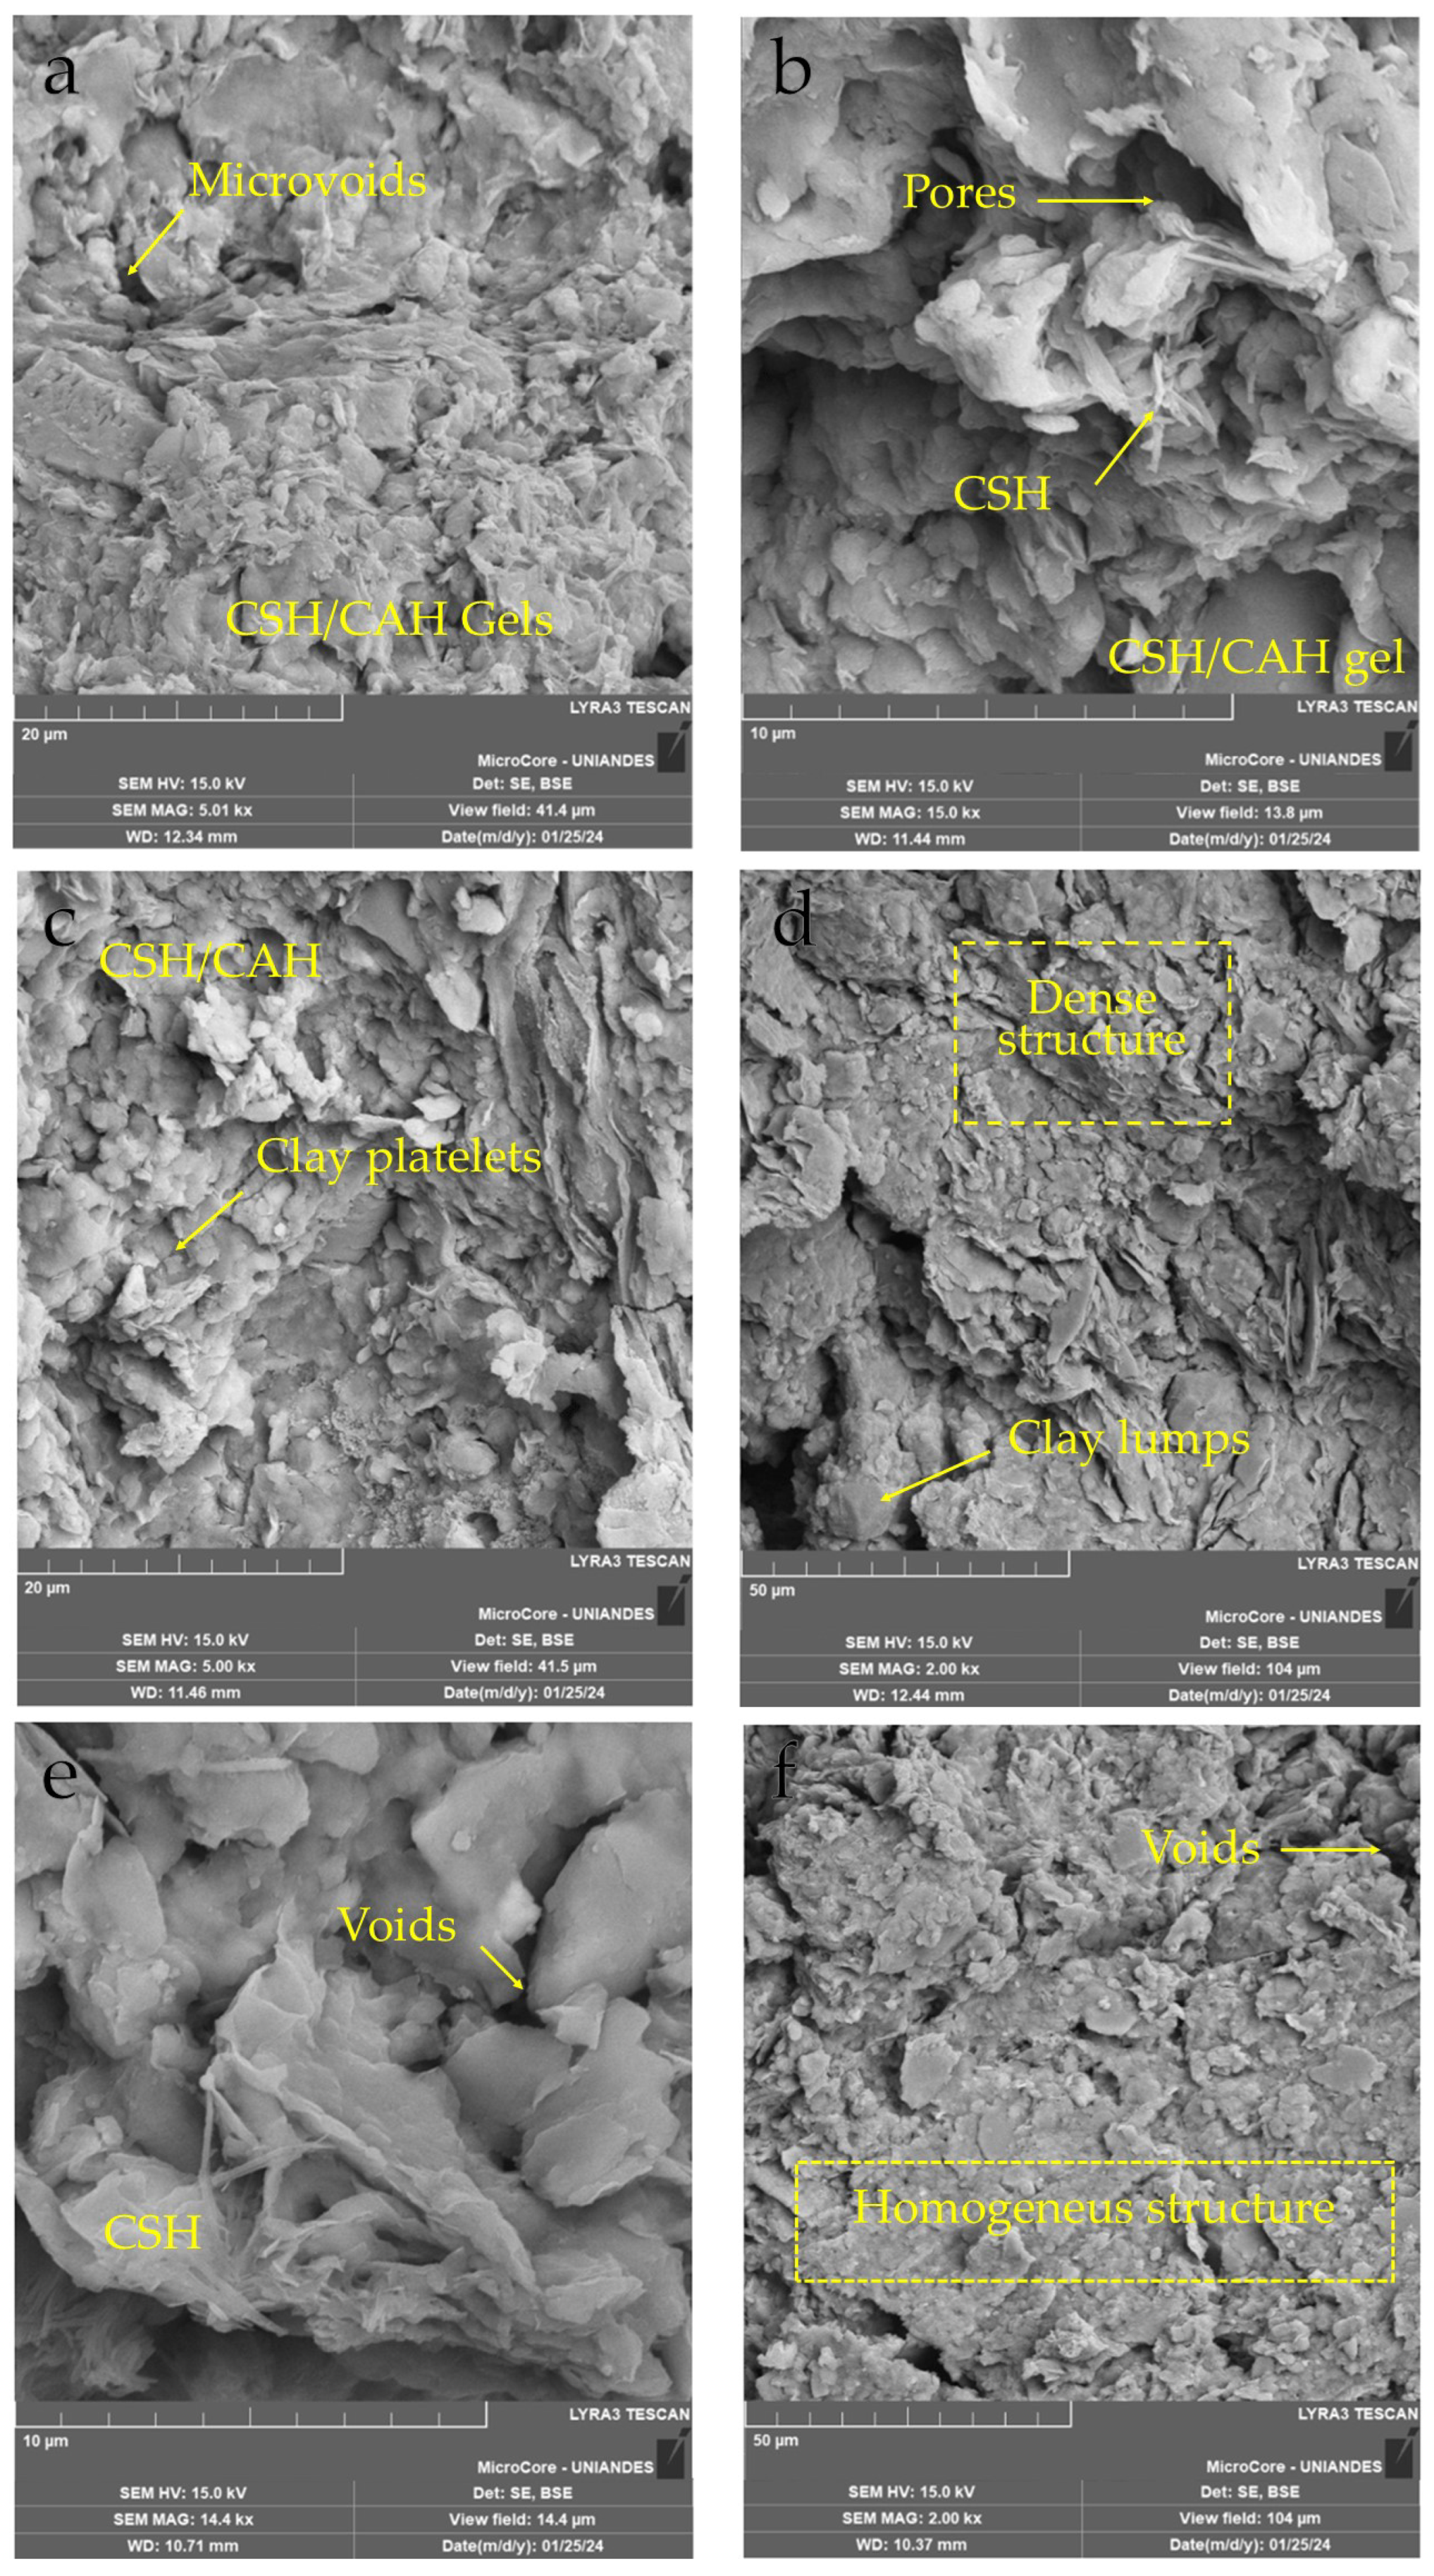
The SEM image at 5.01 kX magnification (Figure 17a) reveals a flocculated microstructure composed of aggregated platy particles with irregular interparticle voids. The edges of the clay sheets appear slightly diffused, suggesting the onset of lime-induced cation exchange, yet no clear evidence of cementitious gel formation is observed. This morphology corresponds to an early stabilization stage, likely under low lime content, short curing time, and reduced molding density.
In Figure 17b, taken at 15.0 kX, the microstructure shows a highly compacted and continuous matrix with dense amorphous regions. These regions are interpreted as calcium-silicate-hydrate (C–S–H) or calcium-aluminate-hydrate (C–A–H) gels, which appear to envelop and bridge clay particles. The reduced porosity and the blurred particle boundaries indicate an advanced pozzolanic reaction, consistent with increased lime content, NaCl addition, and extended curing.
Figure 17c, at 5.00 kX, presents a heterogeneous matrix with distinguishable flocculated domains and discontinuities. While some areas exhibit signs of gel development, others remain unbound, and the presence of microfissures suggests localized failure in bonding. This may reflect an intermediate stabilization scenario, where lime content is moderate, but curing time or chemical activation was insufficient.
The SEM micrograph at 2.00 kX (Figure 17d) provides a broader view of the treated soil, showing loosely bound particle clusters with substantial interaggregate spaces. The lack of cementing products and the irregular particle arrangement suggest incomplete reaction progress. This configuration indicates low lime content and suboptimal compaction, corresponding to a mixture in the early phase of treatment.
Figure 17e, captured at 14.4 kX, exhibits well-defined fibrous and amorphous structures intimately connecting the clay particles. The presence of needle-like formations and dense gel masses suggests a high degree of pozzolanic activity and possibly the formation of ettringite or advanced C–S–H networks. The microstructure is highly cohesive and compact, reflecting the favorable influence of NaCl and adequate curing conditions. Finally, Figure 17f, also at 2.00 kX, shows a homogeneously compacted structure with negligible porosity and a matrix densely filled with cementitious compounds. The smooth and sealed particle interfaces imply effective lime–soil interaction and the formation of a continuous reaction product phase. This micrograph represents a well-stabilized system, optimized through proper chemical composition, molding density, and curing duration.
The microstructural observations obtained from SEM analysis provide clear evidence of the internal transformations induced by lime and NaCl stabilization, which directly influence the mechanical response of the treated clayey-silty soil. Figure 17a,d, associated with low lime content (3%), absence of NaCl, and short curing time (14 days), exhibit poorly bonded microstructures with visible interparticle voids and limited cementation. This morphology is consistent with low UCS values and reduced initial stiffness (Go), as the soil fabric remains weakly aggregated and susceptible to deformation.
In contrast, Figure 17d,e show significant development of cementitious compounds, including dense amorphous gels and fibrous structures—indicative of effective pozzolanic reactions under enhanced conditions (6–9% lime, 2% NaCl, and 28 days of curing). These micrographs correspond to specimens that exhibited the highest UCS and Go values in the test program, due to forming a continuous matrix that bridges clay particles and minimizes porosity. NaCl likely accelerated lime dissolution and promoted faster nucleation of C–S–H/C–A–H products, enhancing both short- and long-term mechanical performance. Figure 17d reflects an intermediate case, where partial cementation and localized microcracking were observed. This suggests that, while the lime dosage may have been sufficient (e.g., 6%), either the curing time or the lack of NaCl limited the progress of stabilization reactions. Accordingly, the UCS and stiffness for this mixture fall between those of the low- and high-reactivity systems.
Figure 17f, although acquired at lower magnification, further confirms the effectiveness of optimal treatment conditions. The homogenous and compact microstructure aligns with specimens molded at higher density (14 kN/m3), which favors particle rearrangement and mechanical interlock, ultimately contributing to strength and stiffness gain. These findings emphasize that not only the chemical additives (lime and NaCl), but also physical parameters such as compaction and curing, are critical in achieving superior soil behavior.
Adding NaCl modifies the lime–soil system’s physicochemical environment by increasing the pore water’s ionic strength and supplying readily available sodium cations. This promotes cation exchange between Na+ and the exchangeable cations of clay minerals, leading to dispersion of clay platelets and enhanced release of silica and alumina from the clay lattice. The higher ionic strength also accelerates the dissolution of reactive species, facilitating the precipitation of calcium silicate hydrates (C–S–H) and calcium aluminate hydrates (C–A–H) and possible mixed sodium–calcium phases. These newly formed hydration products fill voids and bridge soil particles, increasing interparticle bonding and yielding a denser, more cemented microstructure. As a result, the lime–NaCl-stabilized clay develops higher early-age stiffness and strength compared with lime-only treatments, which is consistent with the microstructural evidence observed in the SEM analyses [38].

4. Conclusions

Lime treatment alone improved the unconfined compressive strength (qu) of the soil from 324 kPa at the early stage of 14 days (3% lime, 14 kN/m3) to 901 kPa for a longer term of 28 days (9% lime, 14 kN/m3, 28 d), confirming its effectiveness as a stabilizing agent.
The incorporation of 2% NaCl at 9% lime and high compaction density increased qu from 901 kPa (lime only, 28 d) to 2567 kPa, representing an enhancement of approximately 185%. At low density, qu rose from 637 kPa to 1808 kPa under the same conditions.
Initial stiffness (Go) exhibited a similar trend. At 9% lime and high density, values increased from 3315 MPa (0% NaCl, 14 d) to 10,652 MPa (2% NaCl, 28 d), corresponding to a nearly threefold improvement. At lower densities, Go increased from ~1103 MPa (0% NaCl, 14 d) to 6891 MPa (2% NaCl, 28 d).
The stiffness-to-strength ratio (Go/qu) obtained in this study was 3737.4, which is consistent with values reported for cemented geomaterials such as lime–limestone waste (4828.8) and soil–natural rubber latex blends (3686.6), and significantly higher than biopolymer-based systems such as xanthan gum (1915.3).
The porosity-to-lime index strongly governed unconfined compressive strength (qu) and initial stiffness (Go), following consistent power-type relationships with exponents of −4.75 and −5.23, respectively.
Normalization of qu and Go produced master curves with high determination coefficients (R2 > 0.90), confirming the robustness of the porosity-to-lime framework as a predictive design tool for lime–NaCl–soil systems.
The transition from a flocculated, porous system to a compact, gel-rich microstructure demonstrates a clear micro–macro correlation. As cementitious products such as C–S–H and C–A–H develop and interconnect the particles, the soil matrix becomes more deformation-resistant and can better distribute applied stresses. This is further enhanced by the role of NaCl, which likely accelerates lime dissolution and promotes early reaction kinetics.
The combined lime–NaCl treatment produced a denser, more cemented microstructure strongly associated with higher stiffness and strength. At the same time, this transformation suggests enhanced resistance to moisture-related degradation and potential reduction in dispersivity.
This study demonstrates that combined lime–NaCl stabilization converts moderately dispersive clay into a dense, durable, non-dispersive material, enabling local soils to be safely reused for foundations and embankments. This approach reduces the need for imported granular materials, lowers transportation emissions, and extends the service life of earth structures, aligning with sustainable construction practices

Author Contributions

Conceptualization, J.A.B. and J.D.T.P.; methodology, J.A.B. and J.D.T.P.; validation, J.A.B. and J.D.T.P.; formal analysis, J.A.B. and J.D.T.P.; investigation, J.A.B. and J.D.T.P.; resources, J.A.B. and Y.E.N.d.l.R.; writing—original draft preparation, J.A.B.; writing—review and editing, J.A.B. and Y.E.N.d.l.R.; visualization, J.A.B. and Y.E.N.d.l.R.; supervision, J.A.B.; funding acquisition, J.A.B. and Y.E.N.d.l.R. All authors have read and agreed to the published version of the manuscript.

Funding

This study was partly financed by the Fundación Universitaria los Libertadores and Universidad de Cartagena.

Institutional Review Board Statement

Not applicable.

Informed Consent Statement

Not applicable.

Data Availability Statement

Data are contained within the article.

Acknowledgments

The authors want to thank the Universidad de Cartagena for the support provided.

Conflicts of Interest

The authors declare no conflicts of interest.

References

  1. Fattah, M.Y.; Ismael, R.H.; Aswad, M.F. Dispersion Characteristics of MgO-Treated Dispersive Clay. Arab. J. Geosci. 2021, 14, 605. [Google Scholar] [CrossRef]
  2. Zhang, L.; Du, Y.H.; Yang, X.J.; Fan, H.H. Application of Artificial Neural Network in Predicting the Dispersibility of Soil. Iran. J. Sci. Technol. Trans. Civ. Eng. 2022, 46, 2315–2324. [Google Scholar] [CrossRef]
  3. Filho, H.C.S.; Saldanha, R.B.; da Rocha, C.G.; Consoli, N.C. Sustainable Binders Stabilizing Dispersive Clay. J. Mater. Civ. Eng. 2021, 33, 06020026. [Google Scholar] [CrossRef]
  4. Mohd Yunus, N.Z.; Wanatowski, D.; Marto, A.; Jusoh, S.N. Strength Improvement of Lime-Treated Clay with Sodium Chloride. Geotech. Res. 2017, 4, 192–202. [Google Scholar] [CrossRef]
  5. Saldanha, R.B.; Mallmann, J.E.C.; Consoli, N.C. Salts Accelerating Strength Increase of Coal Fly Ash-Carbide Lime Compacted Blends. Geotech. Lett. 2016, 6, 23–27. [Google Scholar] [CrossRef]
  6. Razeghi, H.R.; Ghadir, P.; Javadi, A.A. Mechanical Strength of Saline Sandy Soils Stabilized with Alkali-Activated Cements. Sustainability 2022, 14, 13669. [Google Scholar] [CrossRef]
  7. Liu, L.; Li, Z.; Liu, X.; Li, Y. Effect of Salt Content on Freezing Temperature and Unconfined Compression Strength of Lime-Treated Subgrade Clay. Appl. Clay Sci. 2018, 158, 65–71. [Google Scholar] [CrossRef]
  8. Saldanha, R.B.; Scheuermann Filho, H.C.; Ribeiro, J.L.D.; Consoli, N.C. Modelling the Influence of Density, Curing Time, Amounts of Lime and Sodium Chloride on the Durability of Compacted Geopolymers Monolithic Walls. Constr. Build. Mater. 2017, 136, 65–72. [Google Scholar] [CrossRef]
  9. Ramesh, H.N.; Rakesh, C. Influence of Lime Sludge and Sodium Salts on the Strength and Structural Behavior of Clayey Soils–Granite Stone Slurry Dust Composite with Curing. Indian Geotech. J. 2020, 50, 801–809. [Google Scholar] [CrossRef]
  10. Godoy, V.B.; Tomasi, L.F.; Benetti, M.; de Araújo, M.T.; Dalmolin, D.A.; Heineck, K.S. Effects of Curing Temperature on Sand-Ash-Lime Mixtures with Fibres and NaCl. Geotech. Geol. Eng. 2023, 41, 2221–2235. [Google Scholar] [CrossRef]
  11. Gravina da Rocha, C.; Marin, E.J.B.; Quiñónez Samaniego, R.A.; Consoli, N.C. Decision-Making Model for Soil Stabilization: Minimizing Cost and Environmental Impacts. J. Mater. Civ. Eng. 2021, 33, 06020024. [Google Scholar] [CrossRef]
  12. Saldanha, R.B.; Lotero, A.; Jaskulski, F.; Consoli, N.C.; da Rocha, C.G. A Decision-Making Flowchart for Tailings Stabilization: Assessing Environmental and Economic Impacts. J. Clean. Prod. 2025, 519, 145893. [Google Scholar] [CrossRef]
  13. Ferrazzo, S.T.; Tonini de Araújo, M.; Consoli, N.C.; da Rocha, C.G. Geotech Social Impacts: Development, Application, and Comparative Analysis. Env. Impact Assess. Rev. 2024, 108, 107577. [Google Scholar] [CrossRef]
  14. Román Martínez, C.; Nuñez de la Rosa, Y.E.; Estrada Luna, D.; Baldovino, J.A.; Jordi Bruschi, G. Strength, Stiffness, and Microstructure of Stabilized Marine Clay-Crushed Limestone Waste Blends: Insight on Characterization through Porosity-to-Cement Index. Materials 2023, 16, 4983. [Google Scholar] [CrossRef]
  15. Baldovino, J.A.; Diaz, K.C.; Royero, J.M.; Sierra, R.S.; Nuñez de la Rosa, Y.E. Developing New Geomaterials: The Case of the Natural Rubber Latex Polymers in Soil Stabilization. Materials 2025, 18, 1720. [Google Scholar] [CrossRef]
  16. Wang, G.; Zhang, X.; Liu, X.; Gao, H.; Pan, Y. Stabilization of Micaceous Residual Soil with Industrial and Agricultural Byproducts: Perspectives from Hydrophobicity, Water Stability, and Durability Enhancement. Constr. Build. Mater. 2024, 430, 136450. [Google Scholar] [CrossRef]
  17. Baldovino, J.A.; Durán, A.P.; de la Rosa, Y.E.N. Sustainable Stabilization of Soil–RAP Mixtures Using Xanthan Gum Biopolymer. Sustainability 2025, 17, 4601. [Google Scholar] [CrossRef]
  18. López, L.C.S.; Ramos, J.C.L.; de la Rosa, Y.E.N.; Bruschi, G.J.; Baldovino, J.d.J.A. Stabilization of Clay Soils Using a Lime Derived from Seashell. Materials 2025, 18, 2723. [Google Scholar] [CrossRef] [PubMed]
  19. ASTM D854; Standard Test Methods for Specific Gravity of Soil Solids by Water Pycnometer. ASTM International: West Conshohocken, PA, USA, 2014.
  20. ASTM 4318; Standard Test Methods for Liquid Limit, Plastic Limit and Plasticity Index of Soils. ASTM International: West Conshohocken, PA, USA, 2010.
  21. ASTM D4647/D4647M-13; Standard Test Methods for Identification and Classification of Dispersive Clay Soils by the Pinhole Test. ASTM International: West Conshohocken, PA, USA, 2013.
  22. Consoli, N.C.; da Silva Lopes, L.; Foppa, D.; Heineck, K.S. Key Parameters Dictating Strength of Lime/Cement-Treated Soils. Proc. Inst. Civ. Eng.-Geotech. Eng. 2009, 162, 111–118. [Google Scholar] [CrossRef]
  23. Ciancio, D.; Beckett, C.T.S.; Carraro, J.A.H. Optimum Lime Content Identification for Lime-Stabilised Rammed Earth. Constr. Build. Mater. 2014, 53, 59–65. [Google Scholar] [CrossRef]
  24. ASTM D 2166-03; Standard Test Method for Unconfined Compressive Strength of Cohesive Soil 1. ASTM International: West Conshohocken, PA, USA, 2003; p. 4.
  25. ASTM D 2487-11; Standard Practice for Classification of Soils for Engineering Purposes (Unified Soil Classification System). ASTM International: West Conshohocken, PA, USA, 2017; pp. 1–5. [CrossRef]
  26. ASTM D7928; Standard Test Method for Particle-Size Distribution (Gradation) of Fine-Grained Soils Using the Sedimentation (Hydrometer) Analysis. ASTM International: West Conshohocken, PA, USA, 2021.
  27. ASTM D698-12; Standard Test Method for Laboratory Compaction Characteristics of Soils Using Standard Effort (12.400 Ft-Lbf/Ft3 (600 KN-m/m3)). ASTM International: West Conshohocken, PA, USA, 2012.
  28. Consoli, N.C.; Festugato, L.; Miguel, G.D.; Moreira, E.B.; Scheuermann Filho, H.C. Fatigue Life of Green Stabilized Fiber-Reinforced Sulfate-Rich Dispersive Soil. J. Mater. Civ. Eng. 2021, 33, 04021249. [Google Scholar] [CrossRef]
  29. Mohanty, S.; Roy, N.; Singh, S.P.; Sihag, P. Estimating the Strength of Stabilized Dispersive Soil with Cement Clinker and Fly Ash. Geotech. Geol. Eng. 2019, 37, 2915–2926. [Google Scholar] [CrossRef]
  30. Abbasi, N.; Farjad, A.; Sepehri, S. The Use of Nanoclay Particles for Stabilization of Dispersive Clayey Soils. Geotech. Geol. Eng. 2018, 36, 327–335. [Google Scholar] [CrossRef]
  31. Baldovino, J.A.; Nuñez de la Rosa, Y.E.; Namdar, A. Sustainable Cement Stabilization of Plastic Clay Using Ground Municipal Solid Waste: Enhancing Soil Properties for Geotechnical Applications. Sustainability 2024, 16, 5195. [Google Scholar] [CrossRef]
  32. Ekinci, A.; Scheuermann Filho, H.C.; Consoli, N.C. Copper Slag–Hydrated Lime–Portland Cement Stabilised Marine-Deposited Clay. Proc. Inst. Civ. Eng.-Ground Improv. 2022, 175, 51–63. [Google Scholar] [CrossRef]
  33. Castellar Buelvas, G.; Perez Luna, J.; De Avila Florez, W.; Aldana Rivera, H.; Arrieta, J. Using Ground Glass Powder and Recycled Gypsum Powder in Clay Stabilization. Int. Rev. Civ. Eng. 2025, 16, 36. [Google Scholar] [CrossRef]
  34. Diambra, A.; Ibraim, E.; Peccin, A.; Consoli, N.C.; Festugato, L. Theoretical Derivation of Artificially Cemented Granular Soil Strength. J. Geotech. Geoenviron. Eng. 2017, 143, 04017003. [Google Scholar] [CrossRef]
  35. Diambra, A.; Festugato, L.; Ibraim, E.; Peccin da Silva, A.; Consoli, N.C. Modelling Tensile/Compressive Strength Ratio of Artificially Cemented Clean Sand. Soils Found. 2018, 58, 199–211. [Google Scholar] [CrossRef]
  36. ASTM D4609-08; Standard Guide for Evaluating Effectiveness of Admixtures for Soil Stabilization. ASTM International: West Conshohocken, PA, USA, 2008.
  37. Favretto, F.; Bruschi, G.J.; Secco, M.P.; Festugato, L. Strength and Stiffness of High-Moisture Content Kaolin–Bentonite Blends Cemented with an Alternative Lime. Indian Geotech. J. 2025. [Google Scholar] [CrossRef]
  38. Ekinci, A.; Hanafi, M.; Aydin, E. Strength, Stiffness, and Microstructure of Wood-Ash Stabilized Marine Clay. Minerals 2020, 10, 796. [Google Scholar] [CrossRef]
  39. López, L.C.S.; Vergara, J.A.A.; de la Rosa, Y.E.N.; Arrieta, A.; Baldovino, J.d.J.A. Effect of Grain Size and Porosity/Binder Index on the Unconfined Compressive Strength, Stiffness and Microstructure of Cemented Colombian Sands. Materials 2024, 17, 5193. [Google Scholar] [CrossRef]
  40. Consoli, N.C.; Winter, D.; Leon, H.B.; Scheuermann Filho, H.C. Durability, Strength, and Stiffness of Green Stabilized Sand. J. Geotech. Geoenviron. Eng. 2018, 144, 04018057. [Google Scholar] [CrossRef]
  41. Consoli, N.C.; da Silva Carretta, M.; Festugato, L.; Leon, H.B.; Tomasi, L.F.; Heineck, K.S. Ground Waste Glass–Carbide Lime as a Sustainable Binder Stabilising Three Different Silica Sands. Géotechnique 2021, 71, 480–493. [Google Scholar] [CrossRef]
  42. Al-Subari, L.; Ekinci, A. Evaluation of Mechanical and Microstructural Properties of Waste Tire Improved Cemented Clay. J. Nat. Fibers 2024, 21. [Google Scholar] [CrossRef]
  43. Hanafi, M.; Javed, I.; Ekinci, A. Evaluating the Strength, Durability and Porosity Characteristics of Alluvial Clay Stabilized with Marble Dust as a Sustainable Binder. Results Eng. 2025, 25, 103978. [Google Scholar] [CrossRef]
  44. Nategh, M.; Ekinci, A.; Iravanian, A.; Fahrioğlu, M. Enhancing Clay Soil’s Geotechnical Properties Utilizing Sintered Gypsum and Glass Powder. Appl. Sci. 2024, 14, 4961. [Google Scholar] [CrossRef]
  45. Yao, L.; Yang, J.; Ma, X.; Wei, P.; Wang, Y.; Wang, W.; Li, N. Short-Term Mechanical Properties and Microstructure of Coastal Cement Soil Modified by Sugarcane Bagasse Ash. Results Eng. 2024, 24, 103279. [Google Scholar] [CrossRef]
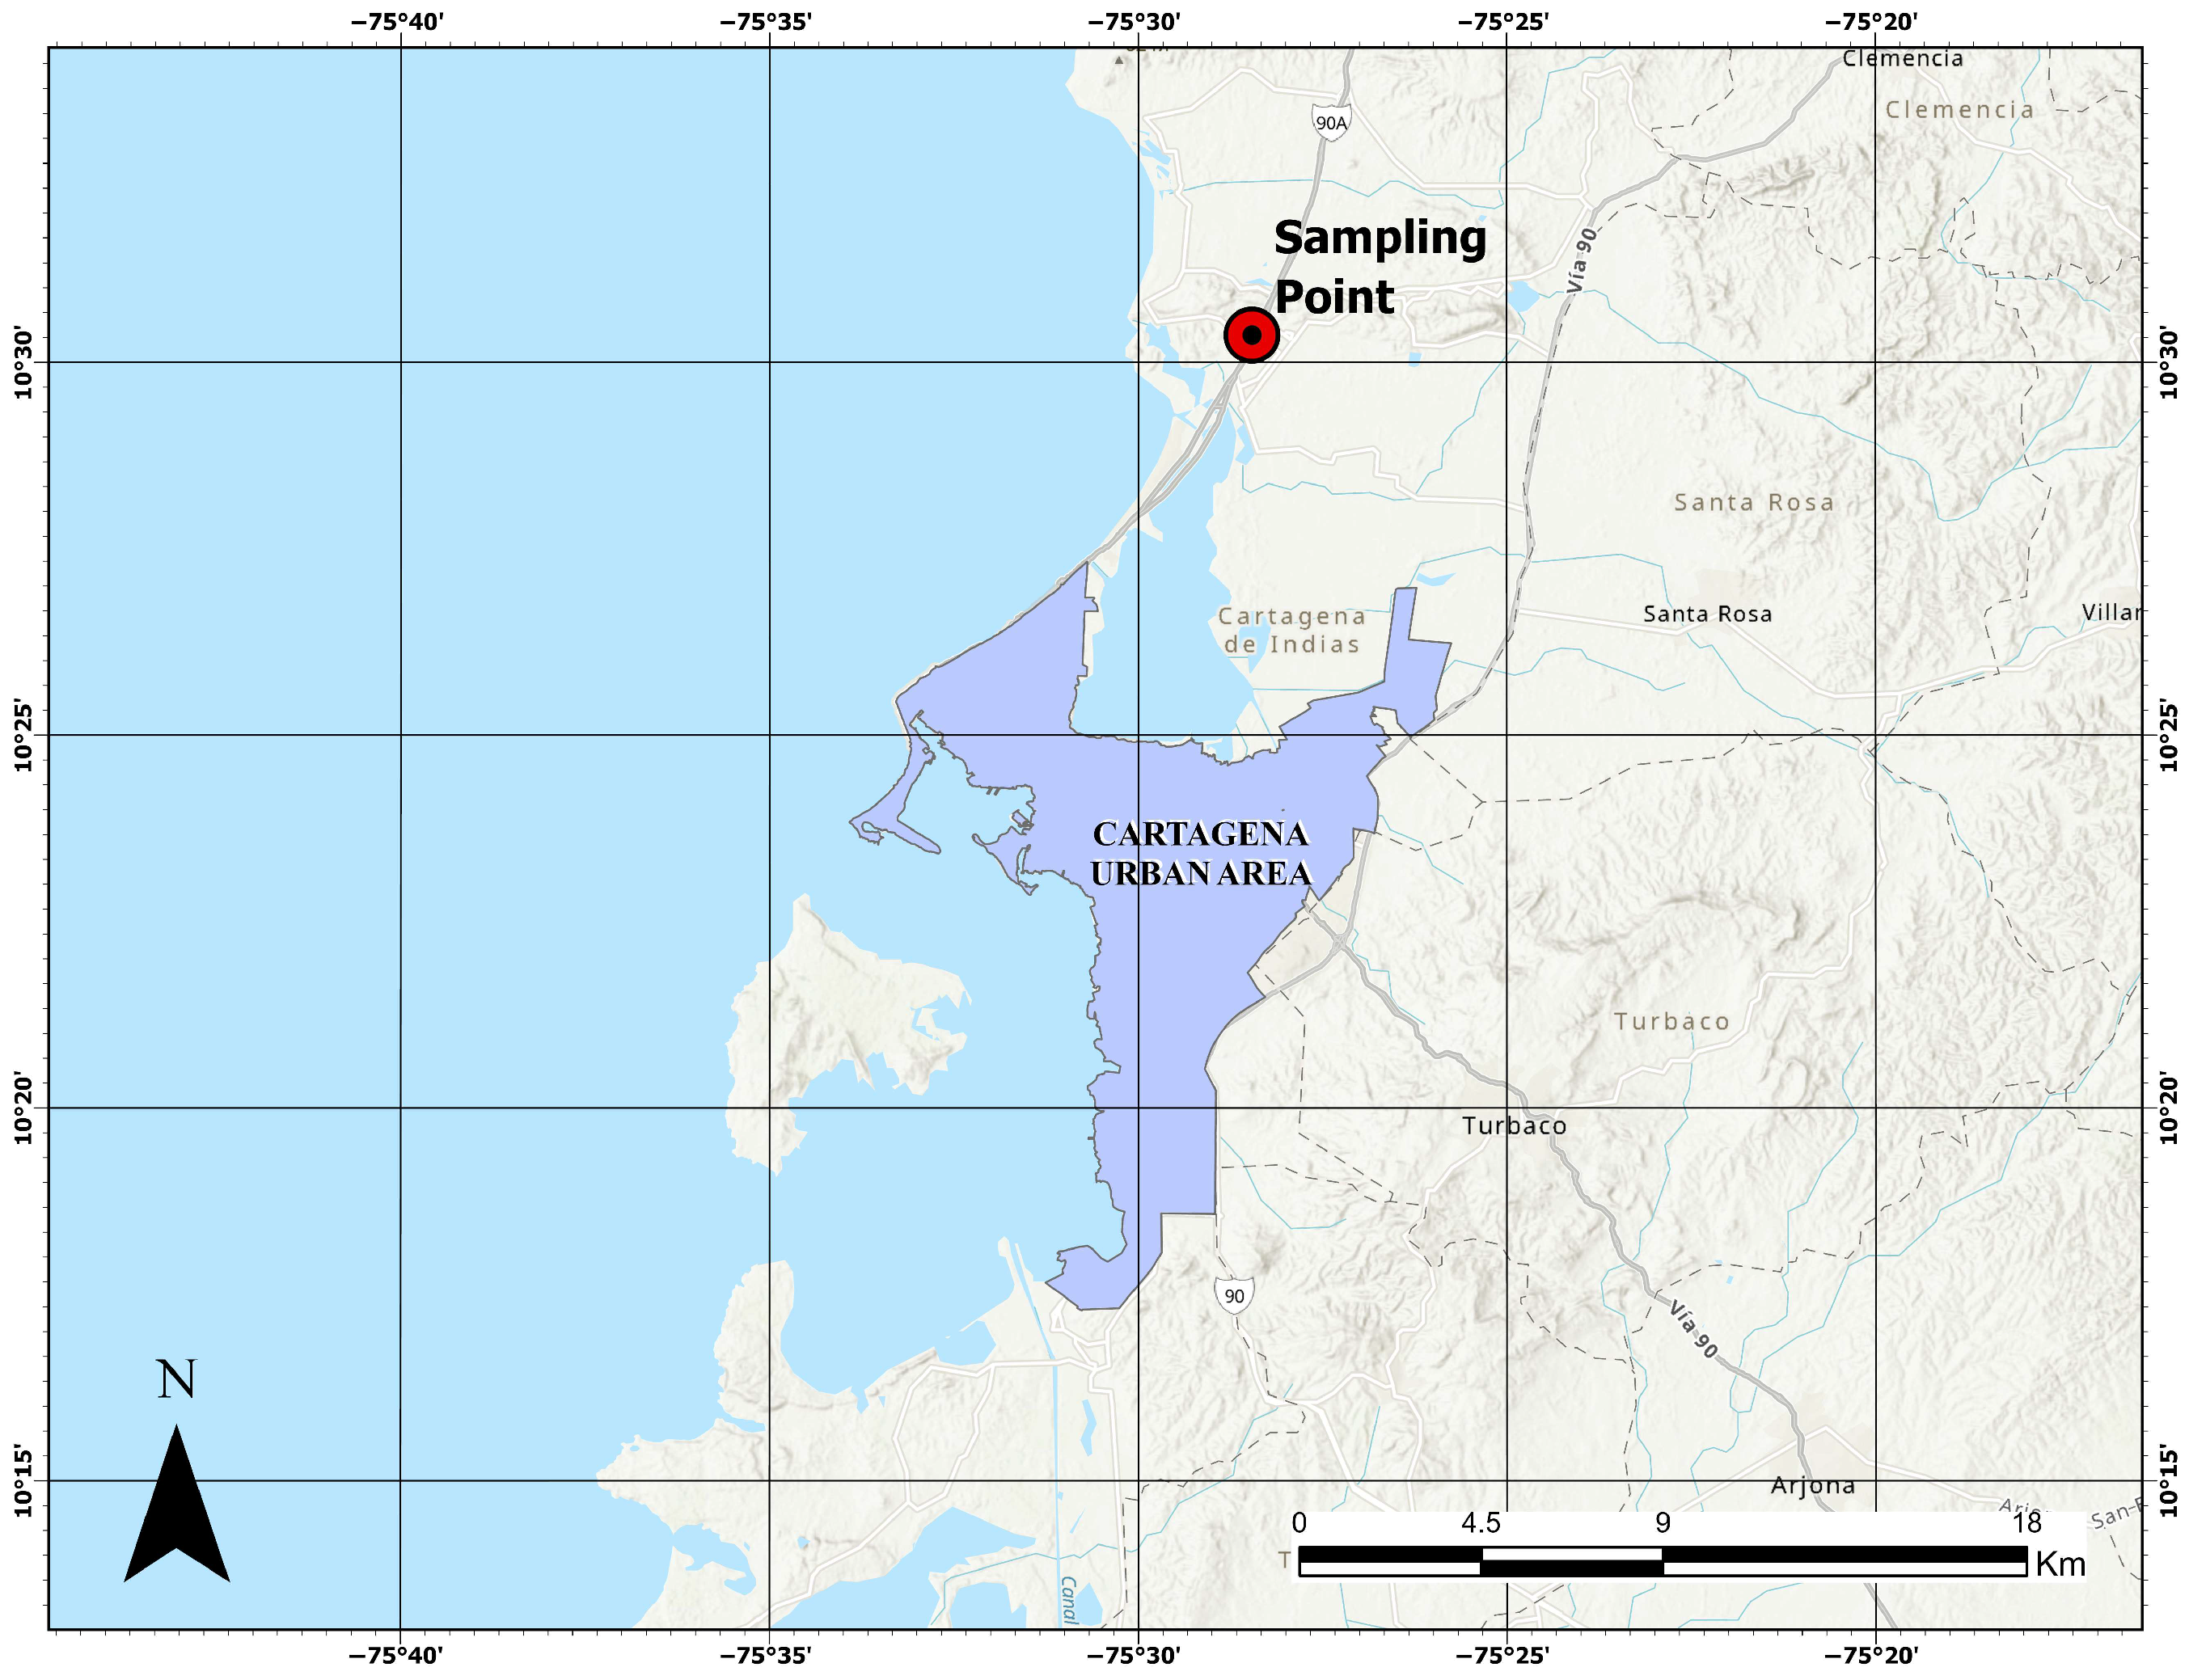
Figure 1. The soil sample collection point is located in northern Cartagena de Indias, Colombia.
Sustainability 17 08715 g001
Figure 2. Coastal deposits of soils in northern Cartagena, Colombia.
Sustainability 17 08715 g002
Figure 3. Raw materials.
Sustainability 17 08715 g003
Figure 4. Pilot study for fixing NaCl content: (a) influence of lime content on qu of lime–soil mix; (b) influence of NaCl content on qu of lime–soil mix.
Sustainability 17 08715 g004
Figure 5. Experimental program flowchart of soil–lime–NaCl blends.
Sustainability 17 08715 g005
Figure 6. Setup of stiffness, Go, and unconfined compression tests (qu).
Sustainability 17 08715 g006
Figure 7. Granulometric curve of the soil sample and lime compared with other dispersive clays [28,29,30,31].
Sustainability 17 08715 g007
Figure 8. Unconfined compressive strength 14 days of curing.
Sustainability 17 08715 g008
Figure 9. Unconfined compressive strength 28 days of curing.
Sustainability 17 08715 g009
Figure 10. Stiffness of soil–lime–NaCl for 14 days of curing.
Sustainability 17 08715 g010
Figure 11. Stiffness of soil–lime–NaCl for 28 days of curing.
Sustainability 17 08715 g011
Figure 12. Influence of porosity-to-lime index on unconfined compressive strength (qu) of lime–NaCl–soil compacted blends, including 14 and 28 days of curing.
Sustainability 17 08715 g012
Figure 13. Influence of porosity-to-lime index on stiffness (Go) of lime–NaCl–soil compacted blends, including 14 and 28 days of curing.
Sustainability 17 08715 g013
Figure 14. Normalization of qu.
Sustainability 17 08715 g014
Figure 15. Normalization of Go.
Sustainability 17 08715 g015
Figure 16. Calculation of stiffness/strength index.
Sustainability 17 08715 g016
Figure 17. Microstructure of lime–soil compacted blends (a) at 3% lime, 0% NaCl, 14 d, 12.7 kN/m3; (b) 6% lime, 2% NaCl, 28 d, 14 kN/m3; (c) 6% lime, 0% NaCl, 14 d, 12.7 kN/m3; (d) 3% lime, 0% NaCl, 14 d, 12.7 kN/m3; (e) 9% lime, 2% NaCl, 28 d, 14 kN/m3; and (f) 9% lime, 0% NaCl, 28 d, 14 kN/m3.
Sustainability 17 08715 g017
Table 1. A mixed proportion design is used for compacted soil, lime, and NaCl blends.
MaterialMoisture (%)Lime (%)NaCl (%)Curing Time (Days)qu (kPa)Reference
Clay161027420[7]
Clay221027380[7]
Fly Ash31.581288500[8]
Clay30.65228200[4]
Black cotton3312128200[9]
Sand-Fly ash1470.57250[10]
Table 2. Specimen Distribution for Compacted Soil–Lime–NaCl Blends by Curing Period and Molding Density.
Molding
γd (kN/m3)
Soil (%)Lime (%)NaCl (%)Curing Times (Days)Specimens
12.710030 and 214 and 2812
10060 and 214 and 2812
10090 and 214 and 2812
14.010030 and 214 and 2812
10060 and 214 and 2812
10090 and 214 and 2812
Table 3. Chemical composition results from X-ray fluorescence (XRF) methodology.
ElementNameContent (%)
SiO2Silicon Dioxide62.6
Al2O3Aluminum Oxide24.1
SO3Sulfur Trioxide5.6
K2OPotassium Oxide4.4
CaOCalcium Oxide1.7
Fe2O3Iron (III) Oxide1.2
TiO2Titanium Dioxide0.5
Table 4. Physical properties of the soil sample.
Physical Property of the SoilResultsStandard
Liquid limit, %53.1ASTM 4318 [20]
Plastic limit, %29.0ASTM 4318 [20]
Plastic index, %24.1ASTM 4318 [20]
Specific gravity2.73ASTM D854 [19]
Fine gravel (4.75 mm–19 mm), %-ASTM D7928 [26]
Coarse sand (2.0 mm–4.75 mm), %-ASTM D7928 [26]
Medium sand (0.425 mm–2.0 mm), %7.5ASTM D7928 [26]
Fine sand (0.075 mm–0.425 mm), %25.9ASTM D7928 [26]
Silt (0.002 mm–0.075 mm), %57.6ASTM D7928 [26]
Clay (diameter < 0.002 mm), %9.0ASTM D7928 [26]
Medium diameter (D50), mm0.0245-
USCS ClassificationCHASTM D2487 [25]
Maximum dry unit weight, standard Proctor, kN/m313.87ASTM D698 [27]
Optimum water content, Standard Proctor, %26.0ASTM D698 [27]
Table 5. Normalization data for stiffness and strength.
BlendNormalization IndexFor Normalization
q u n G o n q u k P a G o M P a
Soil–L–0%NaCl (14 d) η / L i v 0.19 = 44.5 η / L i v 0.19 = 44.5 400.681533.17
Soil–L–2%NaCl (14 d) η / L i v 0.19 = 44.5 η / L i v 0.19 = 44.5 1039.443628.24
Soil–L–0%NaCl (28 d) η / L i v 0.19 = 44.5 η / L i v 0.19 = 44.5 513.921783.90
Soil–L–2%NaCl (28 d) η / L i v 0.19 = 44.5 η / L i v 0.19 = 44.5 1381.935230.72
Disclaimer/Publisher’s Note: The statements, opinions and data contained in all publications are solely those of the individual author(s) and contributor(s) and not of MDPI and/or the editor(s). MDPI and/or the editor(s) disclaim responsibility for any injury to people or property resulting from any ideas, methods, instructions or products referred to in the content.