Article

Towards Sustainable Rockfall Protection: An Interaction Matrix Method for Assessing Flexible Barrier Siting Adaptability

by
Ziwei Ge
School of Civil Engineering and Architecture, Zhejiang University of Science and Technology, Hangzhou 310023, China
Sustainability 2025, 17(19), 8675; https://doi.org/10.3390/su17198675
Submission received: 29 August 2025 / Revised: 23 September 2025 / Accepted: 24 September 2025 / Published: 26 September 2025

Abstract

Earthquake-triggered rockfalls pose significant threats to human lives, critical infrastructure, and the natural environment, highlighting an urgent need for sustainable and effective mitigation strategies. Flexible barriers are effective against rockfall, but there is a lack of universal procedures for selecting appropriate sites. As a result, flexible barriers are often misused, and their protective effect significantly decreases. To address this, a method for quantitatively characterizing the “flexible barrier siting adaptability” is proposed. The concept of “flexible barrier siting adaptability” is used to assess the suitability of a selected site for flexible barrier installation. The assessment method consists of three parts: the evaluation index system, the evaluation index value standards, and the calculation method. The evaluation index system is based on the interaction matrix considering not only the factors influencing the flexible barrier siting adaptability but also the interactions between them. The interaction matrix is determined by the expert semi-quantitative method, which can quantitatively assess the flexible barrier siting adaptability. Furthermore, the proposed method is applied to a typical rockfall area in Jiuzhaigou county, Sichuan province, China. This method provides a resource-efficient and practical tool for preliminary site assessment, contributing to the development of sustainable infrastructure and enhancing community resilience in rockfall-prone regions.

1. Introduction

Rockfall and rockslides can cause severe impact damage to infrastructure or even casualties all over the world, so it is urgent and necessary to prevent and control them [1,2,3,4]. The increasing frequency and intensity of extreme weather events—such as intense precipitation, freeze–thaw cycles, typhoons, and earthquakes—driven by climate change, are projected to significantly exacerbate slope instability and rockfall activity in many regions globally. These processes mechanically weather rock masses through hydrostatic pressure, ice crystallization, and strong wind-driven vibrations, while chemical weathering from acid rain further degrades rock integrity. This evolving risk profile underscores the growing urgency for developing sustainable and adaptive mitigation strategies that can withstand this wider range of environmental stressors under evolving climate conditions.
To address these growing challenges, flexible barriers have been widely used in rockslide protection and control [5,6,7,8,9,10,11,12,13,14] due to their design flexibility, significant range of manageable energy (from 100 kJ to 10,000 kJ) [15], and cost-effectiveness [16,17,18], as shown in Figure 1. These barriers typically consist of four components: steel nets, energy dissipating devices, steel posts, and supporting cables [19,20,21]. By undergoing large deformations, flexible barriers dissipate the impact energy of rockslides, thereby intercepting falling rocks. Compared to traditional rigid protective structures, flexible barriers have been observed to exhibit enhanced performance in earthquake-prone areas [22,23]. First, their inherent flexibility enables significant energy absorption through large deformations, effectively mitigating the brittle failure risks associated with seismic inertial forces in rigid structures. Second, the integrated flexible connections between components facilitate coordinated structural behavior during seismic excitation, maintaining system integrity under ground motions.
In practical applications, however, flexible barriers are frequently damaged even when the impact energy is below the design protection energy [24,25,26]. This compromises their intended protective function. The primary cause of this phenomenon is the disparity between the idealized test conditions and the variety of actual engineering conditions, such as rock characteristics or installation location. This disparity results in decreased reliability of mitigation measures in practice. Therefore, to fully utilize the protective capabilities of flexible barriers, it is crucial to understand how these factors influence barrier performance [27]. The effectiveness of flexible barriers depends on multiple factors, including dynamic response to rockfall characteristics [28,29,30,31,32,33], slope characteristics [34], weathering and corrosion [35,36], and vegetation coverage [37]. Extensive studies have been conducted on factors influencing flexible barrier performance [38,39,40,41,42]. For instance, Guo et al. [28] investigated the damage to flexible barriers through impact tests, considering various rock shapes, sizes, and net specifications. Berger et al. [22] conducted small-scale laboratory experiments on different protective structures and investigated the relationship between barrier flexibility and total impact load.
However, there is currently no universal procedure for designing and siting flexible barriers [43]. This lack of standardization makes it difficult to consistently achieve sustainable outcomes. Beyond immediate safety concerns, the principle of sustainability is becoming paramount in geohazard mitigation engineering [44,45,46,47,48]. This pursuit of sustainability is also driving innovation in adjacent fields, such as resource utilization in steel production [49] and safety monitoring in smart buildings [50]. Traditional engineering decisions often rely on complex simulations or extensive testing, which can be resource-intensive and time-consuming, potentially leading to delays and increased carbon emissions. Furthermore, inappropriate siting of protective structures can result in ecological disruption, visual intrusion, and unnecessary waste of materials due to premature failure or over-design. Therefore, there is a growing call for simple, robust, and low-impact decision-support tools that align with sustainability goals. Existing qualitative guidelines rely heavily on subjective judgments, resulting in significant variability in site assessments. For instance, the European Technical Approval Guideline (ETAG) [51]—which was replaced by EAD 340059-0106 in 2018—provides design recommendations for energy levels and structural dimensions [52], but its complexity hinders practical application. Table 1 illustrates ETAG design suggestions for flexible barriers. The specific criteria and calculation methods proposed in ETAG are scientific and comprehensive but complex in practice. Currently, the selection of flexible barrier sites often relies on general design principles, restrictions, and experience. These guidelines are primarily qualitative, offering only directional guidance on relevant considerations during design. Moreover, being empirical, judgments regarding the same site conditions can vary significantly among practitioners. Inappropriate siting configurations can significantly compromise protective effectiveness. In conclusion, the lack of a practical and unified approach not only compromises protective efficacy but also leads to potentially unsustainable outcomes, including wasted resources, environmental damage, and reduced community resilience. This study aims to fill this gap by proposing a quantitative assessment method that explicitly incorporates sustainability considerations through a systematic evaluation of key interacting factors.
To address these limitations, this study introduces the concept of “siting adaptability,” defined as an index to evaluate the suitability of a site for flexible barrier installation. A higher siting adaptability indicates greater engineering rationality. This paper establishes a scientific and reliable assessment system for siting adaptability, guiding the design and site selection of flexible barriers. The rest of this paper is organized as follows. Section 2 describes the details of the interaction matrix method. Section 3 presents the establishment of the flexible barrier siting adaptability assessment system. Section 4 verifies the reliability of the flexible barrier siting adaptability assessment system. Section 5 draws the conclusions of this study.

2. Materials and Methods

2.1. Overview

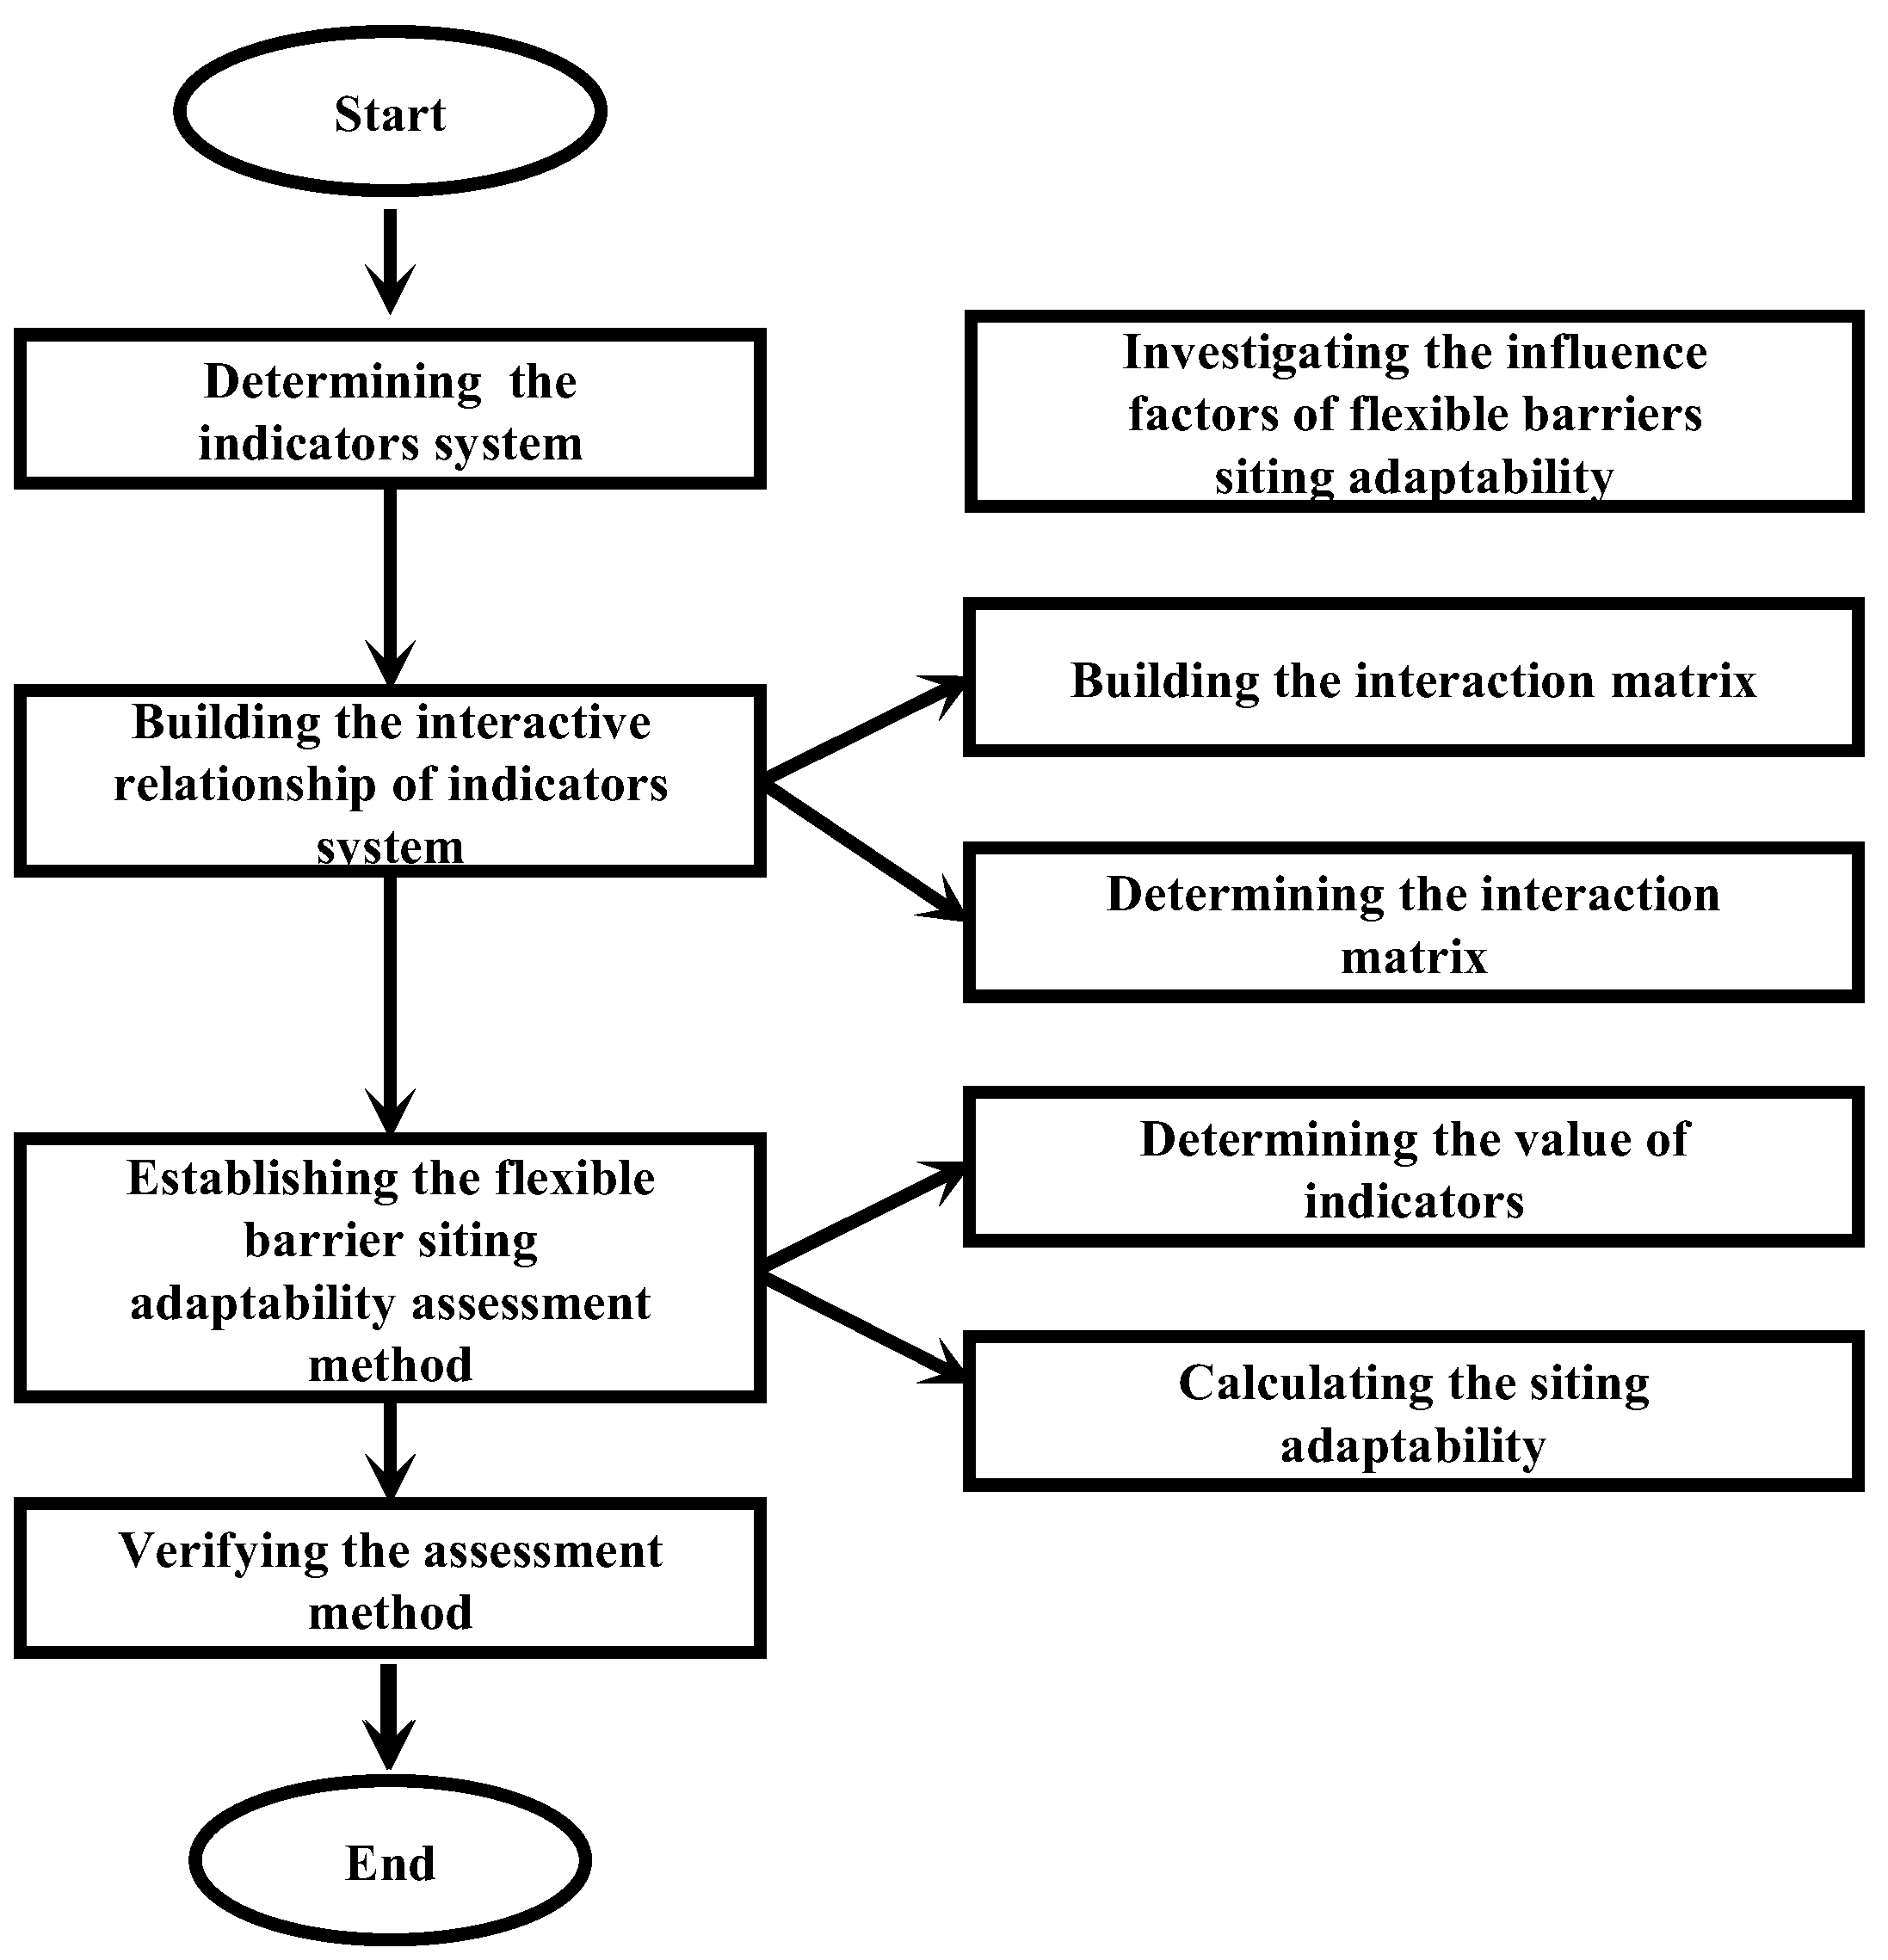
To ensure the accuracy and reliability of the assessment method, a corresponding evaluation index system is necessary. Therefore, a set of evaluation factors must first be defined for the flexible barrier siting adaptability assessment system. Secondly, the evaluation indicators are quantified using the expert semi-quantitative method. Based on this, the method for calculating siting adaptability is proposed. Finally, the flexible barrier siting adaptability assessment system is established.
As illustrated in Figure 2, the research process comprises four main parts: determining the indicators system (step 1), building the interactive relationship of the indicators system (steps 2–3), establishing the flexible barrier siting adaptability assessment method (steps 4–5), and verifying the assessment method (step 6). Specifically, the research steps are: (1) investigating the influence factors of the flexible barrier siting adaptability; (2) building the interaction matrix; (3) determining the interaction matrix; (4) determining the value of the indicators; (5) calculating the siting adaptability; (6) verifying the assessment method.

2.2. Details of the Interaction Matrix

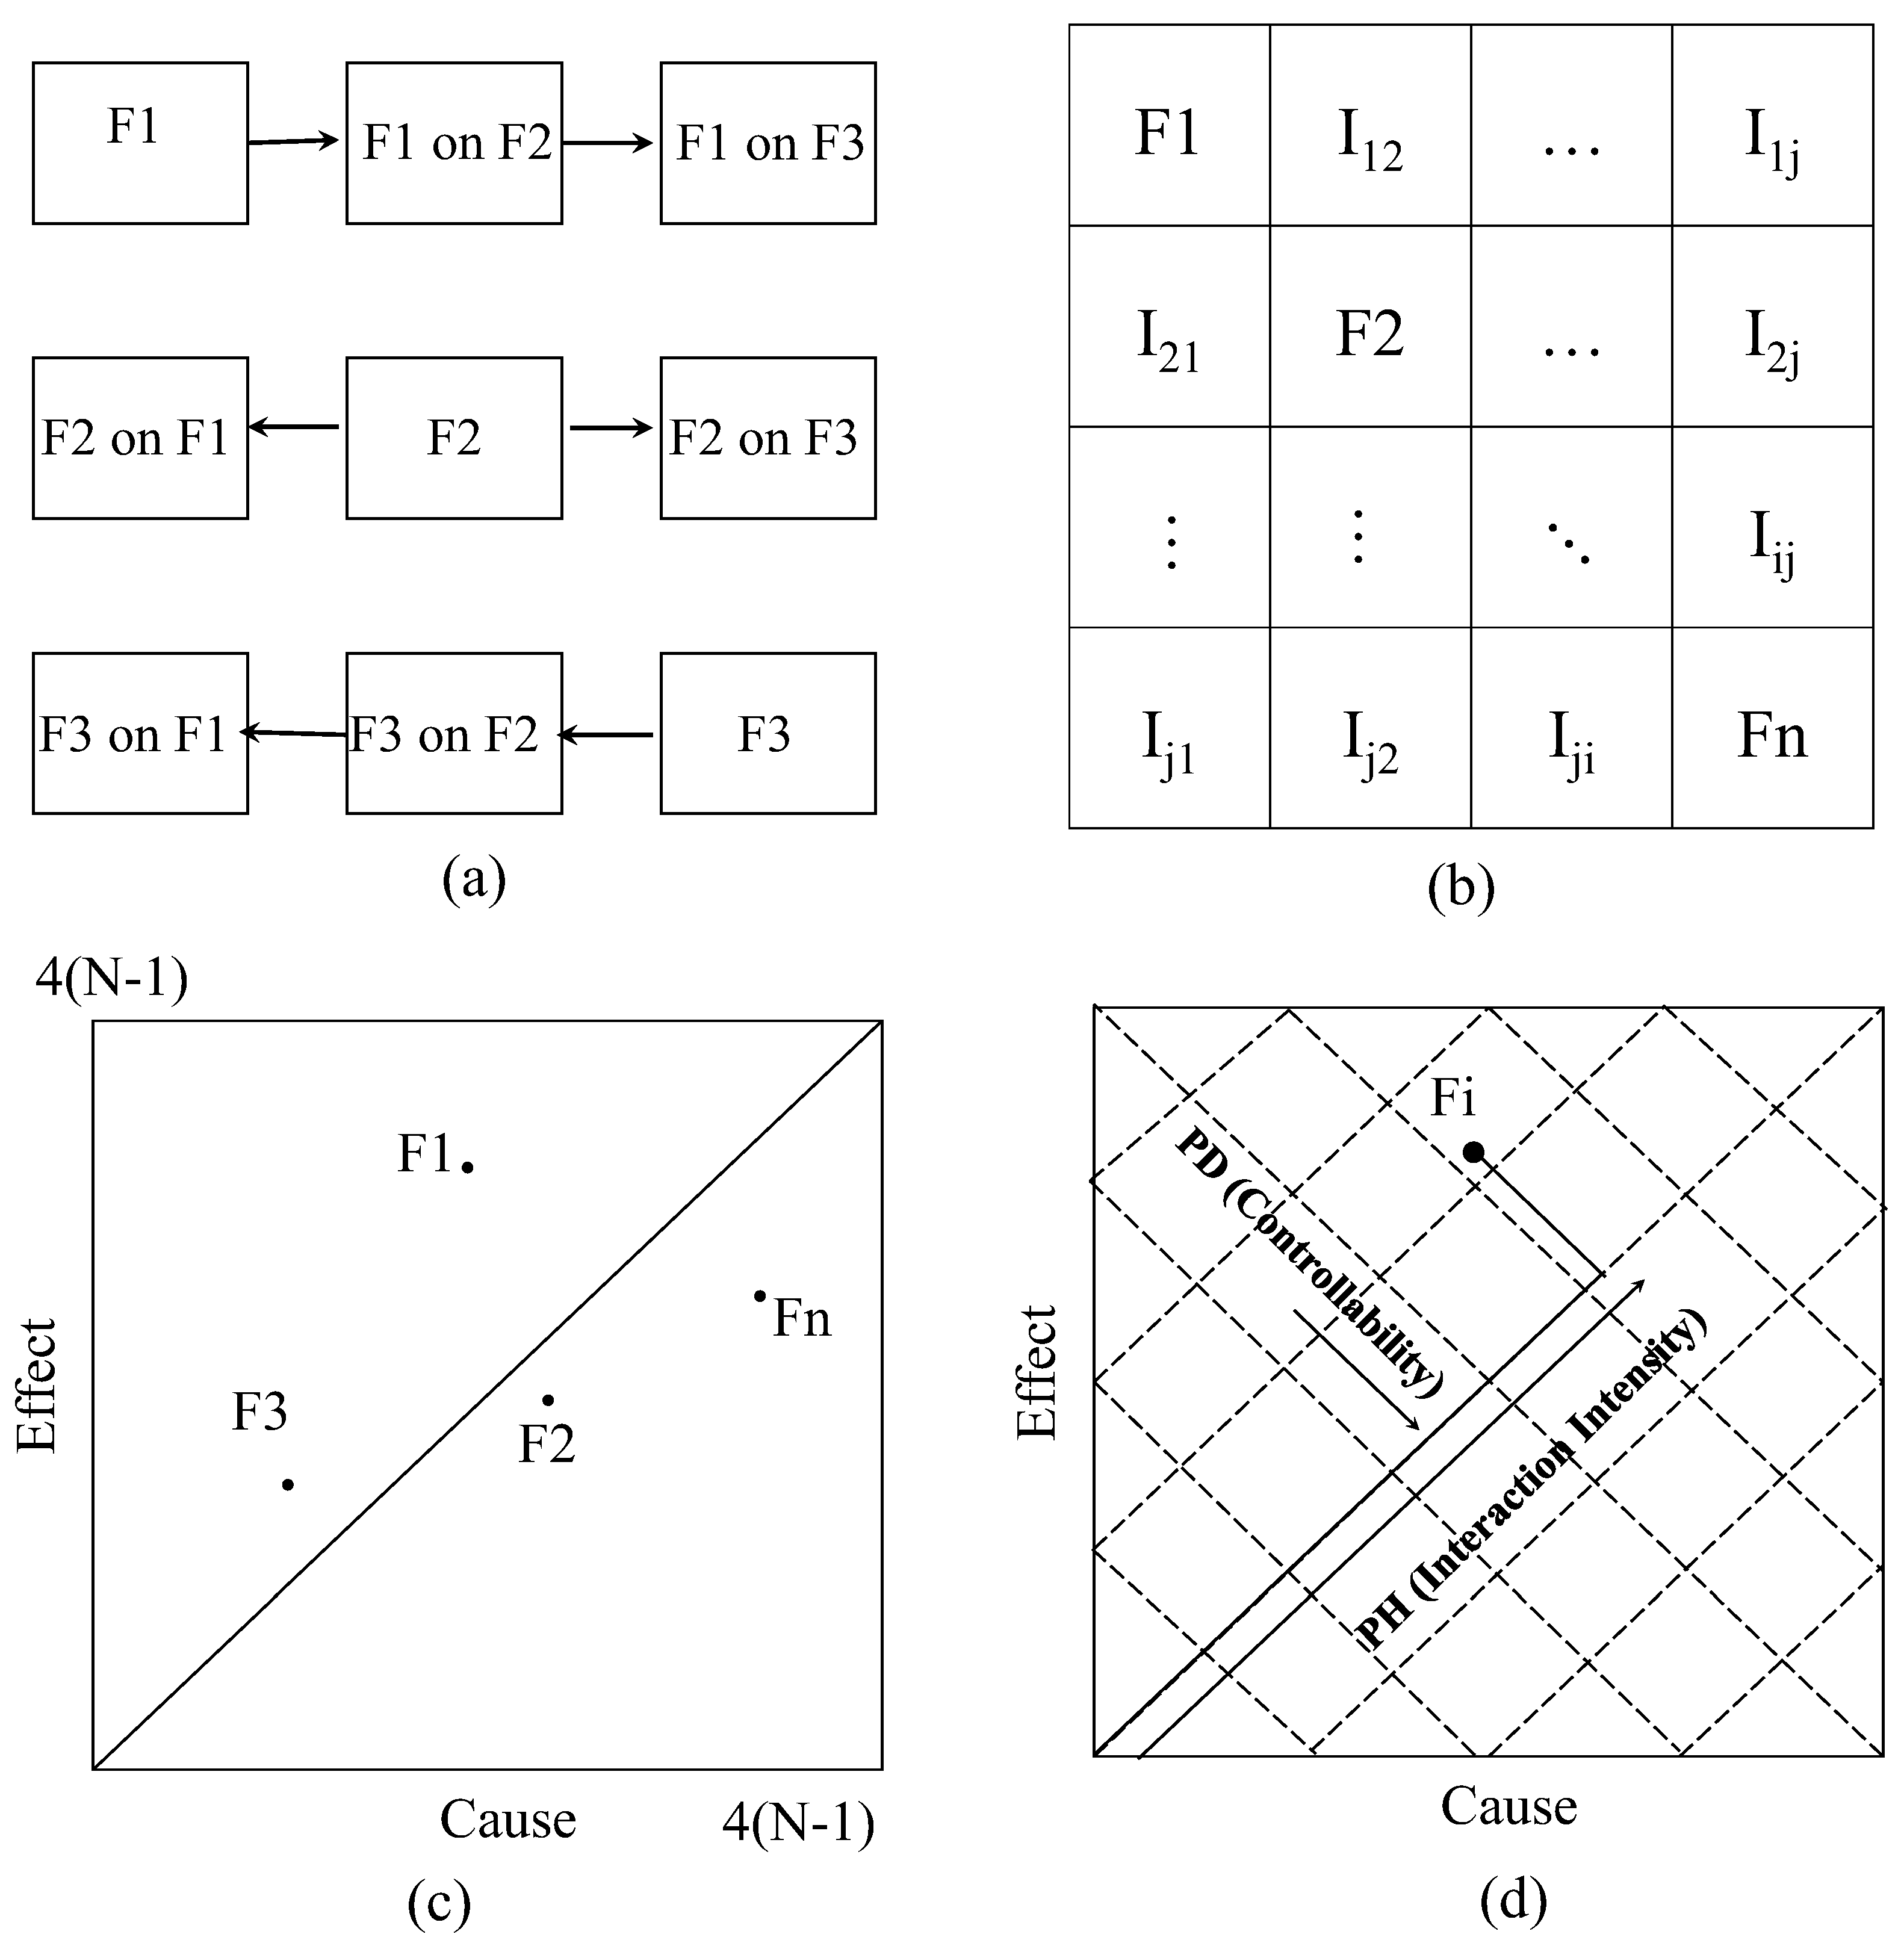
The typical interaction matrix is shown in Figure 3a,b. The diagonal elements of the interaction matrix represent the main influencing factors of the flexible barrier siting adaptability F 1 ,   F 2 F n . The off-diagonal elements represent the interaction between two factors ( I i j ). I i j represents the influence of factor F i on factor F j .
The cause and effect values for each influencing factor are determined using the Expert semi-quantitative method. The Expert semi-quantitative method was proposed by Hudson [53,54,55]. This method assigns values of 0, 1, 2, 3, or 4 to the off-diagonal matrix elements, denoting no interaction, weak interaction, moderate interaction, strong interaction, and extremely strong interaction, respectively. Subsequently, this method has been widely applied for evaluating interaction matrices in various systems. The sum of all elements in a row represents the total influence exerted by that factor on the system, termed the “cause” C i . C i is the sum of the off-diagonal elements in the i t h row, calculated as:
C i = j = 1 j = i I i j ( i = 1 , 2 , 3 , , i )
The sum of all elements in a column represents the total influence received by that factor from the system, termed the “effect” E i . E i is the sum of the off-diagonal elements in the j t h   column, which can be calculated as follows:
E j = i = 1 i = j I i j ( j = 1 , 2 , 3 , , j )
For a system with N factors, the maximum possible values for C i and E j are both 4 ( N 1 ) , and   i = 1 n C i = j = 1 n E j
Figure 3c shows the distribution of interaction matrix parameters. The position of F ( C , E ) can be determined according to the values of C and E . As shown in Figure 3c, the parameter interaction strength PH represents the overall intensity of influence associated with a parameter and is measured by its distance from the origin along the line C = E :
P H = ( C + E ) / 2
Parameter controllability PD indicates the dominance of a parameter’s causal influence C over its effected response E, measured by its perpendicular distance to the line C = E :
P D = ( C E ) / 2
Figure 3d provides a clearer visualization of factor interactions. The activity index ki represents the relative contribution of each factor to the total system interaction:
k i = ( C i + E j ) / i = 1 n C i + E j = ( C i + E j ) / 2 i = 1 , j = 1 n I i j
A higher ki indicates a more significant contribution to the overall system behavior.

3. Establishing the Flexible Barrier Siting Adaptability Assessment System

3.1. Selecting the Evaluation Indicators

The main factors influencing the protective effectiveness of flexible barriers are derived from literature reviews and field investigations. These parameters are categorized into four dimensions: rockfall characteristics (P1–P4), slope characteristics (P5–P8), environmental characteristics (P9–P10), and engineering characteristics (P11–P12). A total of 12 key parameters are considered: kinetic energy of falling rocks (P1), rockfall size (P2), dispersion characteristics of perilous rock masses (P3), rockfall event frequency (P4), slope roughness (P5), slope height (P6), slope gradient variation (affecting rockfall bounce height) (P7), vegetation coverage (P8), hydrological conditions (P9), seismic activity (P10), and construction conditions (P11), environmental and social sustainability (P12). The qualitative descriptions of these parameters are presented in Table 2.
Furthermore, the practical design of a flexible barrier system relies on a comprehensive rockfall trajectory analysis. This analysis, typically conducted using simulation software (e.g., Rocfall V.4.0 [56]), is essential for determining two critical design parameters: (1) the kinetic energy and bounce height of falling rocks (directly linked to parameters P1 and P7), and (2) the total dispersion width of the rockfall trajectories. The required length of the flexible barrier must extend beyond the outermost predicted trajectories on both sides to ensure complete coverage of the hazard zone. The dispersion characteristic of perilous rock masses (P3) and slope gradient variation (P7) are the primary factors influencing this required spatial coverage. Thus, the proposed siting adaptability assessment system works in tandem with quantitative trajectory simulations to guide both the optimal placement and the necessary dimensions of the protection structure.

3.2. Building the Interaction Relationship of Evaluation Indicators

Building the Interaction Matrix

To evaluate the relationships between influencing factors, the 132 off-diagonal elements are assigned values of 0, 1, 2, 3, or 4 using the Expert semi-quantitative method, as shown in Table 3. The assignment of values (0–4) to the off-diagonal elements of the interaction matrix was conducted using the expert semi-quantitative method. This process, while inherently relying on expert judgment, was structured and iterative to ensure consistency and robustness. Firstly, the initial assignment was grounded in a comprehensive review of documented mechanisms found in the literature (as referenced throughout Section 1). For instance, the strong interaction (I21 = 4) between rock size (P2) and kinetic energy (P1) is directly supported by the fundamental physical principle E = 1 2 m v 2 . Subsequently, the authors, acting as the expert panel given their expertise in rock mechanics and geohazard mitigation, conducted an iterative review process. The proposed interactions and scores were critically examined for logical consistency. This involved:
(1)
Ensuring that if factor A strongly influences factor B, the reverse interaction (B on A) was evaluated independently and assigned a logically consistent value.
(2)
Checking that the assigned intensity aligned with the defined criteria (e.g., value of 4 was reserved only for direct, deterministic relationships).
(3)
Comparing the relative strengths of different interactions to maintain a consistent scale across the matrix.
Finally, the resulting matrix was validated indirectly through its successful application in the Jiuzhaigou case study (Section 4), where it produced a logical prioritization of sites that aligned with independent numerical simulations and field observations.
The classifications are defined as follows:
(1)
No Interaction (0 points)
76 factors exhibited no influence and were assigned 0 points.
(2)
Minor Interaction (1 point)
21 factors exhibited minor influence and were assigned 1 point: I2,12 (larger rockfalls require more massive structural components and foundations, resulting in a slight reduction in sustainability), I3,11 (dispersed rockfalls optimize passive flexible barriers, eliminating full-slope coverage needs), I48 (high-frequency rockfall events can damage and reduce vegetation coverage), I54 (rougher slopes may slightly inhibit rock mobility, potentially decreasing the frequency of rocks reaching the barrier.), I57 (slope roughness slightly modifies rock trajectories), I511 (rocky slope increases drilling resistance), I64 (higher slopes contain a greater volume of perilous rock masses, slightly increasing event frequency), I65 (high slopes experience weathering), I68 (high slopes mildly inhibit vegetation growth), I6,11 (height slightly increases construction difficulty, though flexible barriers remain optimal for steep terrain), I72 (abrupt gradient changes elevate rock fragmentation), I73 (gradient variations enhance dispersion through trajectory deviation), I75 (rock impacts cause slope roughness), I89 (vegetation roots reduce water infiltration), I98 (runoff affects vegetation growth), I9,11 (hydrology increases flexible barrier corrosion requirements), I102 (earthquake increases rocks fragmentations), I105 (earthquake cause surface fracturing), I106 (earthquakes trigger localized landslides, marginally reducing slope height), I11,8 (construction leads to the removal of vegetation, which can be bypassed by flexible barriers compared to rigid barriers), I11,9 (construction induces short-term water turbidity increases).
(3)
Moderate Interaction (2 points)
19 factors exhibit moderate influence and were assigned 2 points: I1,11 (higher kinetic energy rockfall demands deeper anchoring systems), I1,12 (higher design kinetic energy significantly increases material use and complexity of energy-dissipating devices, reducing sustainability), I23 (large rock motion enhances dispersion through progressive fragmentation), I31 (high dispersion reduces per-impact kinetic energy through multiple collisions), I32 (fragmentation processes reduce post-failure particle sizes), I34 (highly dispersed rock masses often indicate larger source areas, correlating with higher failure event probability), I3,12 (dispersed sources often require longer barriers or multiple structures, increasing material consumption and environmental impact.), I4,12 (high event frequency compromises sustainability by increasing long-term maintenance, resource use, and environmental disturbance.), I52 (slope roughness increases fragmentation by impact), I53 (surface irregularities amplify trajectory unpredictability), I67 (steep gradients intensify energy conversion at slope transitions), I78 (high-gradient zones restrict vegetation coverage), I82 (vegetation intercepts large rock blocks), I83 (vegetation causes collision points to be random), I85 (root systems stabilize slopes, reducing surface erosion), I8,11 (dense vegetation complicates access and foundation work, though flexible barriers retain advantages over rigid barriers), I9,12 (aggressive hydrological conditions challenge sustainability by accelerating corrosion and increasing maintenance frequency), I10,12 (high seismic activity threatens sustainability by raising the risk of barrier damage or failure), I11,12 (difficult construction conditions decrease sustainability by elevating energy consumption and environmental disturbance during installation).
(4)
Significant Interaction (3 points)
11 factors exhibit significant influence and were, assigned 3 points: I15 (high-energy impacts significantly alter slope roughness through rock fracturing), I4,11 (high event frequency greatly increases maintenance difficulty and frequency, affecting construction and maintenance assessments), I51 (surface roughness substantially influences kinetic energy dissipation), I58 (rocky slopes inhibit vegetation coverage, resulting in significantly lower coverage compared to soil slopes), I63 (tall slopes significantly increase dispersion and collision probability), I71 (abrupt gradient transitions elevate rockfall rebound heights, substantially amplifying impact energy), I87 (dense vegetation cover reduces rockfall rebound heights through energy absorption), I94 (intensive hydrological processes promote rock weathering and destabilization, substantially increasing rockfall frequency), I103 (seismic activity enhances rockfall dispersion through fracturing), I12,8 (sustainable design promotes vegetation preservation through minimal clearing.), I12,9 (sustainability mandates require corrosion-resistant materials and designs in aggressive hydrological conditions to ensure long service life).
(5)
Strong Interaction (4 points)
5 factors exhibit strong influence, assigned 4 points: I21 (rock size directly determines mass and kinetic energy parameters), I61 (slope height directly governs potential-to-kinetic energy conversion efficiency), I104 (Seismic activity is a primary and extreme trigger of rockfalls), I10,11 (flexible barrier systems demonstrate superior performance in seismic environments due to their inherent adaptability), I12,11 (sustainability objectives dominantly influence construction choices, strongly determining construction difficulty and environmental impact).

3.3. Calculating the Flexible Barrier Siting Adaptability

The Expert semi-quantitative method is used to quantify the evaluation indicators. A two-level assessment standard is established: Level I (unsuitable) and Level II (suitable), assigned values of 1 and 0 points, respectively.
The weighting factors ki for each evaluation index are derived from the activity index defined in Equation (5). The resulting weight coefficients are:
k ( P 1 , P 2 , P 3 , P 4 , P 5 , P 6 , P 7 , P 8 , P 9 , P 10 , P 11 , P 12 ) = ( 10.27 , 6.70 , 9.82 , 7.59 , 9.38 , 6.25 , 6.25 , 10.71 , 5.36 , 7.14 , 10.27 , 10.27 )
The siting adaptability index W is then calculated as the weighted sum of the indicator scores (pi, where pi = 0 or 1):
W = i = 1 10 k i P i

4. Case Study

4.1. Study Area

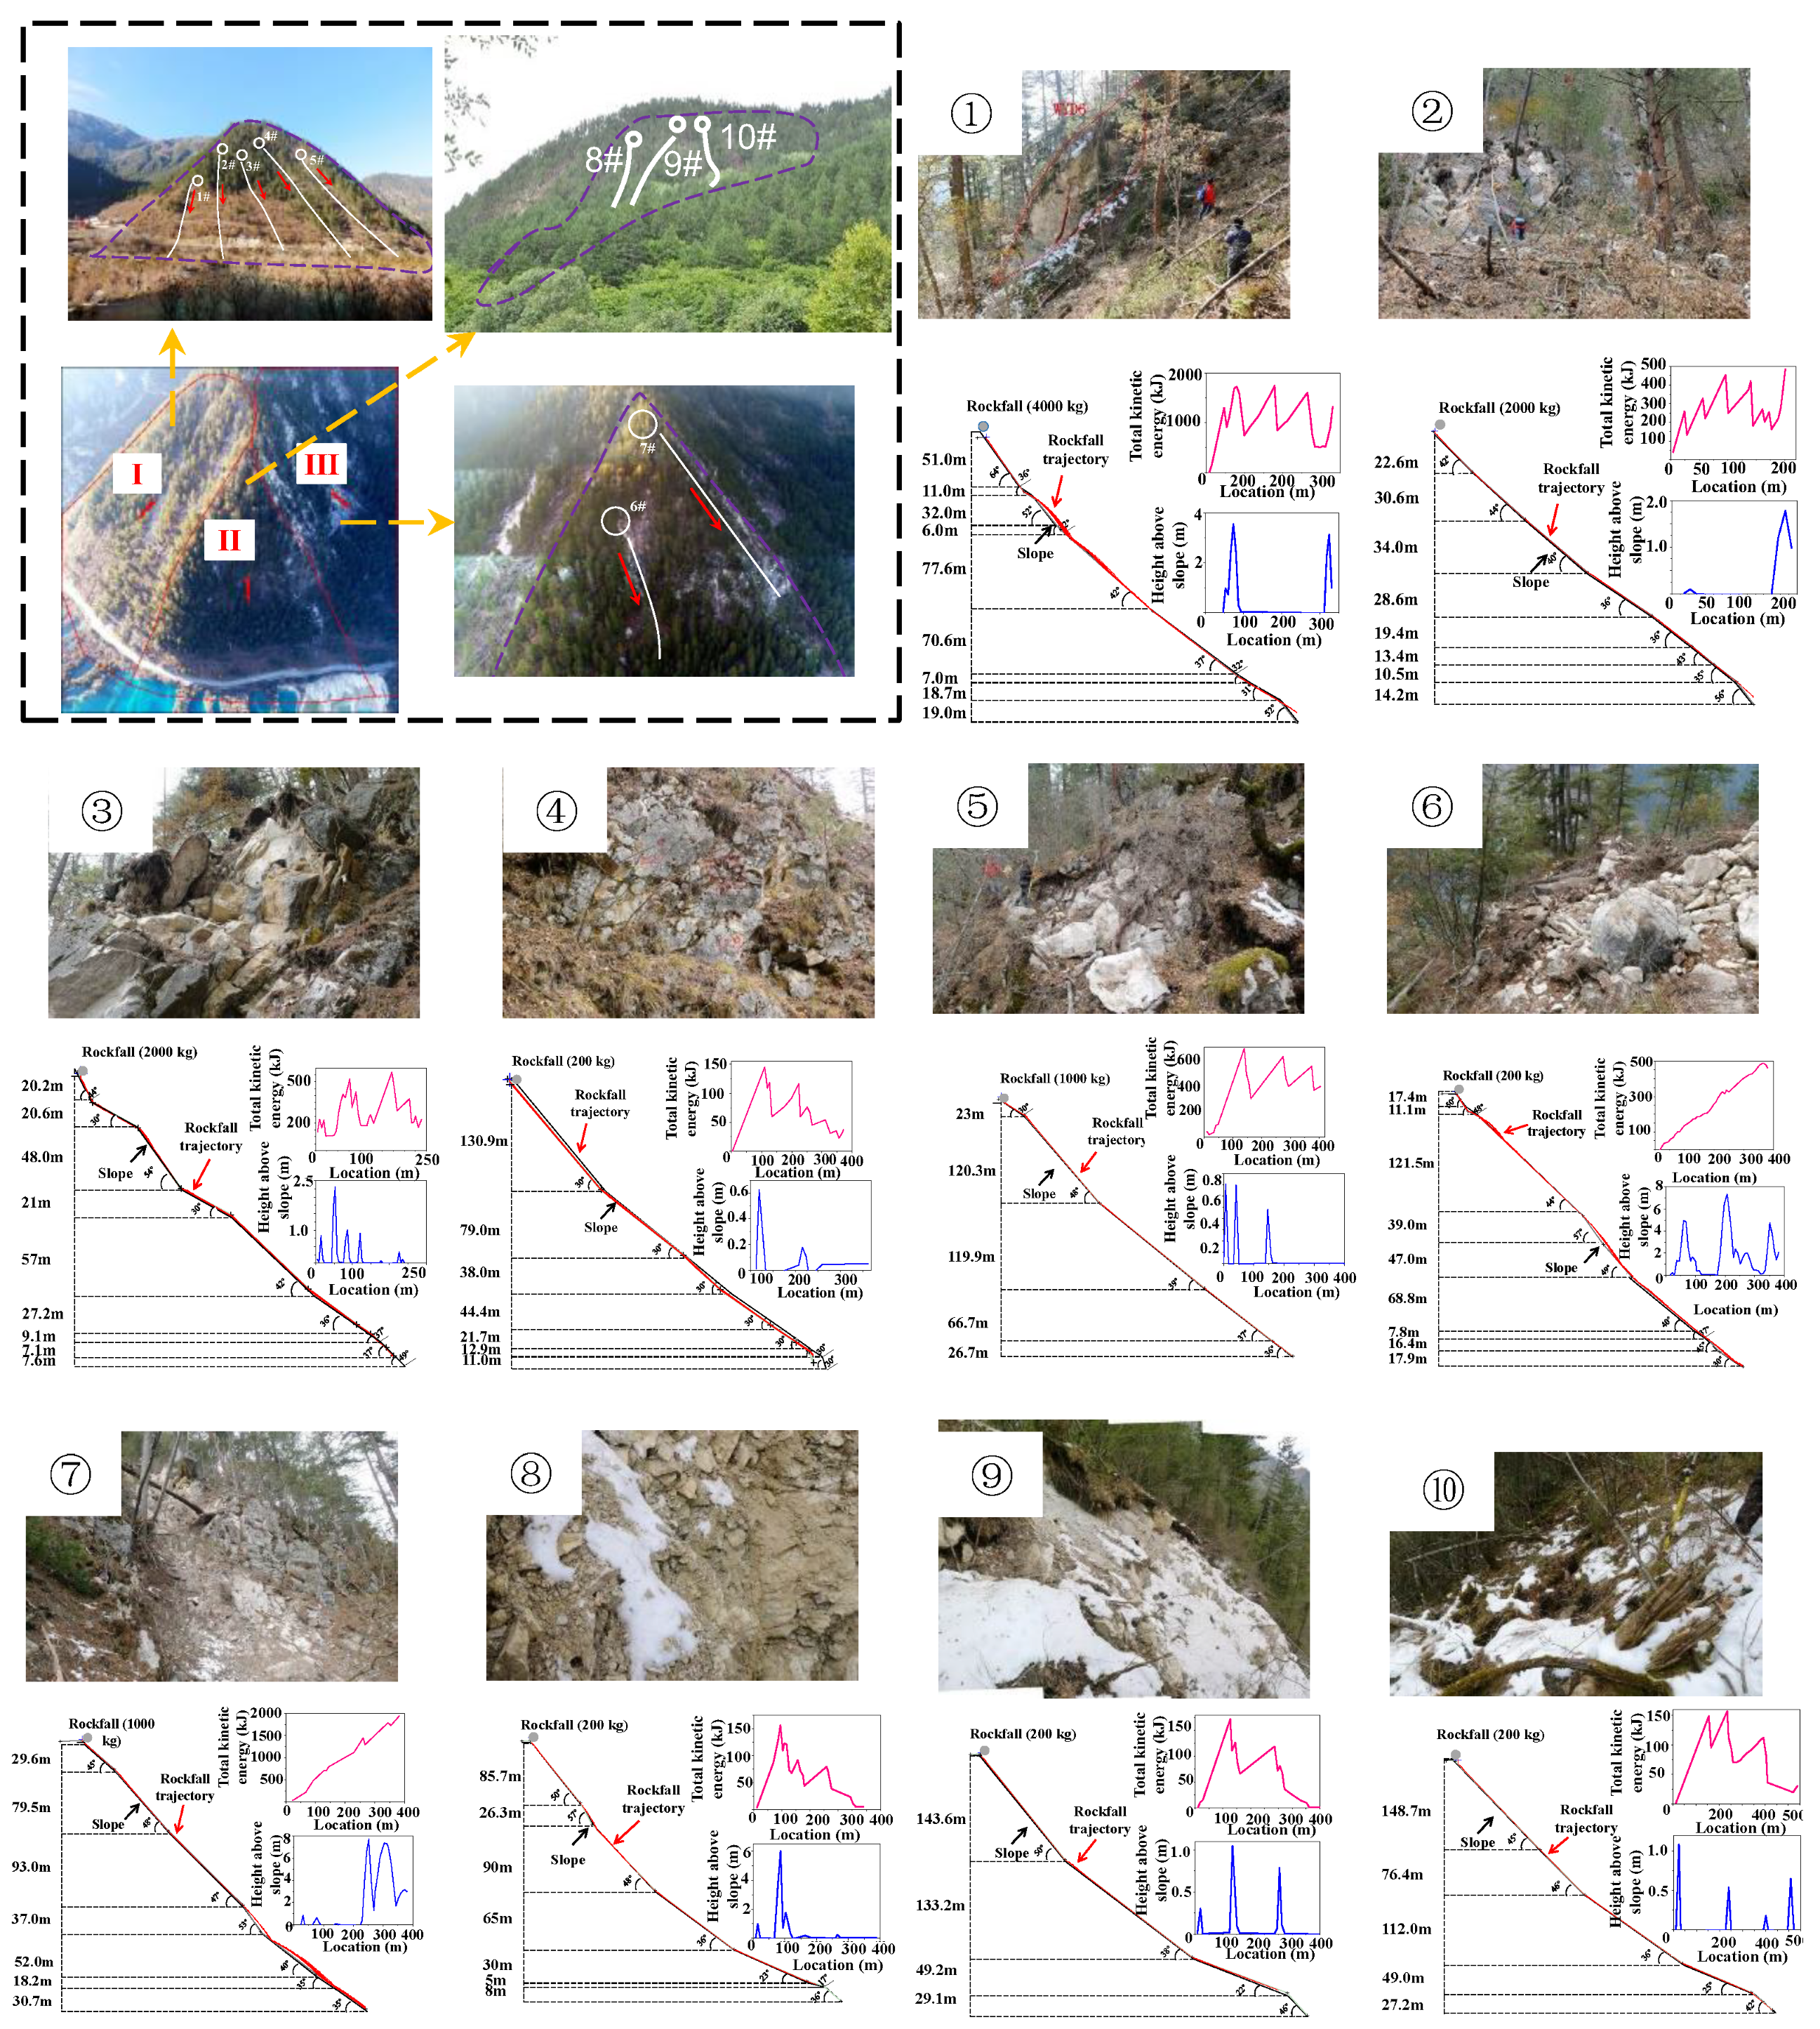
On 8 August 2017, an earthquake of magnitude Ms = 7.0 occurred in Jiuzhaigou county [57,58]. The earthquake significantly disturbed the geological environment, loosening shallow rock and soil masses on slopes [59]. Subsequent aftershocks and external forces (e.g., heavy rainfall or engineering activities) can easily trigger new geological disasters on these unstable slopes. Huohua village is located on the left bank slope of a highway (33°13′3.20″ N, 103°54′16.99″ E). The average annual rainfall is 552.3 mm, and the groundwater is acidic. The relative elevation difference between the collapse source area and the tourist road ranges from 45 to 420 m. Figure 4 shows the external morphology of Huohua village and photographs of the perilous rock masses. The Jiuzhaigou valley is a UNESCO World Heritage Site, making the preservation of its natural landscape and sustainable tourism economy of utmost importance. Therefore, any mitigation measure must balance safety with minimal environmental and visual impact.

4.2. Assessing the Flexible Barrier Siting Adaptability

Table 4 presents the siting adaptability assessment results for potential barrier locations at Huohua Lake.

4.3. Results and Analysis

The proposed method was verified against actual application conditions and numerical simulations performed using Rocfall V.4.0. Rocfall V.4.0 can simulate the trajectory of falling rocks, kinetic energy and maximum bounce height [60,61]. Among the parameters used in the program, the slope profile, coefficient of restitution, and friction coefficient are the most critical. The slope profile is obtained through field surveys. The coefficient of restitution and rolling friction coefficient are influenced by the physical characteristics of the slope, the presence of vegetation, and the radius of the rockfall itself. These coefficients can be directly acquired through back analysis of previously fallen rock blocks or theoretically estimated. In this study, the slope type was modeled as vegetated talus. The masses of perilous rock masses, with volumes ranging from 0.1 to 2 m3, were estimated between 200 kg and 4000 kg (assuming a mass of 2600 kg/m3). Figure 4 shows the simulated maximum bounce height and maximum kinetic energy for falling rocks. Based on these simulations, the siting adaptability was evaluated, as presented in Table 5.
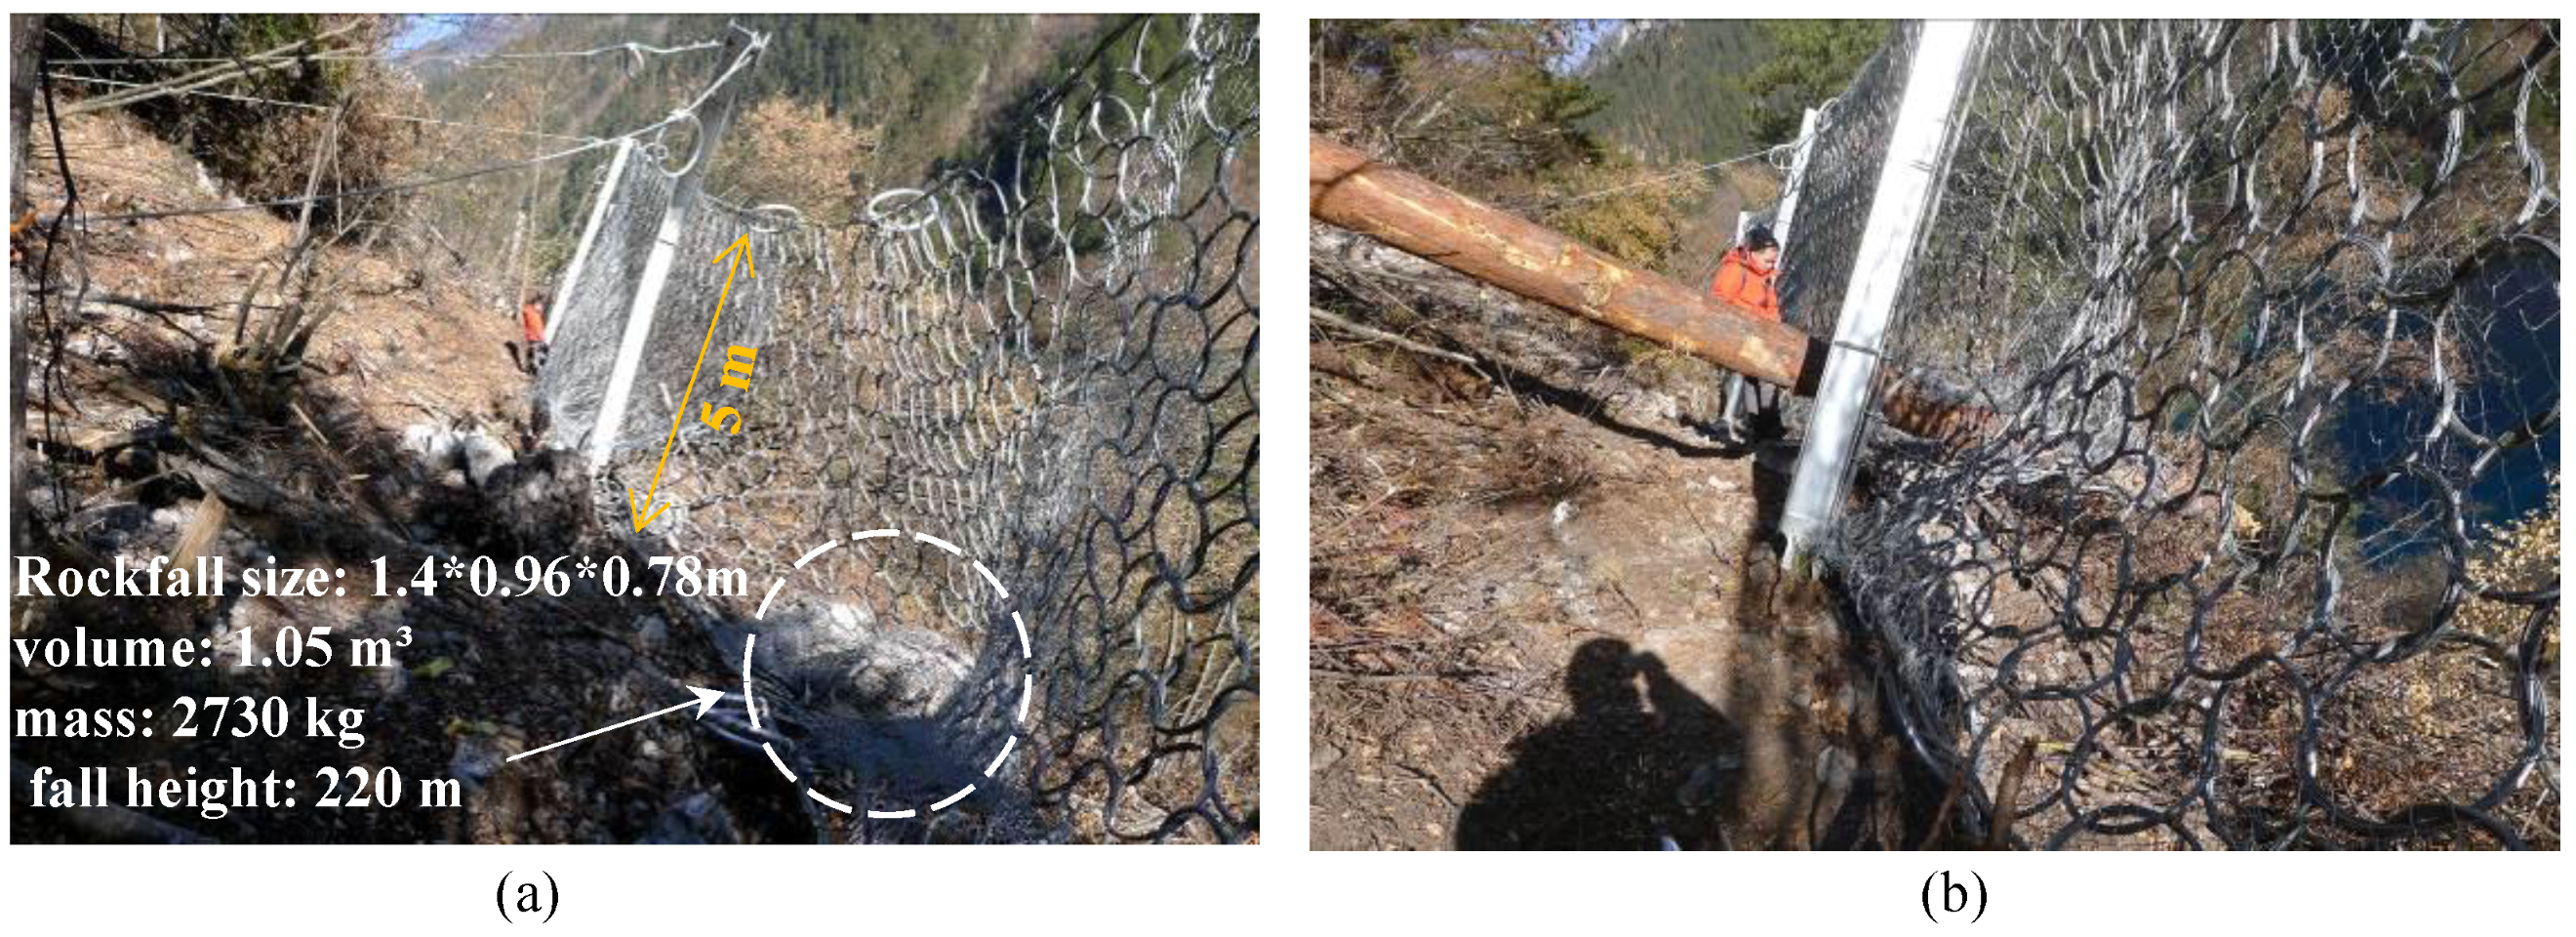
A score W above 60 indicates relatively high siting adaptability. According to the assessment results (illustrated in Table 5), 80% of the sites exhibit high siting adaptability (W > 60). Furthermore, the Rocfall V.4.0 simulations (illustrated in Table 6) show maximum kinetic energies below 2000 kJ and bounce heights between 0.63 m and 7.73 m. Flexible barriers installed after the Jiuzhaigou earthquake have successfully intercepted rockfalls and fallen trees (as shown in Figure 5). These results demonstrate that flexible barriers with a protection energy level of 2000 kJ are suitable for meeting the protection requirements at this site. This confirms the reliability and applicability of the proposed assessment method. The successful interception by 2000 kJ barriers, as identified by our method, prevented the need for installing higher-capacity (and thus more material-intensive, costly, and visually intrusive) barriers, demonstrating a sustainable and cost-effective design outcome. The method’s ability to correctly identify suitable sites on the first attempt avoids the environmental disturbance and financial waste associated with trial-and-error or improper installation.
The validation presented here should be considered a successful proof of concept. The primary validation lies in the fact that the barriers installed post-earthquake (with a 2000 kJ capacity) have effectively intercepted rocks and that our assessment method correctly identified sites suitable for such barriers (W > 60, simulated energies < 2000 kJ). This provides strong preliminary, qualitative evidence of the method’s utility in preventing over-design and guiding appropriate site selection. However, we acknowledge the limitations of this study, primarily the lack of long-term, quantitative performance data (e.g., detailed records of maintenance frequency, capacity utilization, or survival rates under repeated impacts) against which to rigorously test the predicted W scores. A comprehensive quantitative validation would require a large dataset of sites where both the initial assessment (W score) and the actual long-term performance are recorded. Therefore, future work should focus on monitoring the performance of these installed barriers over time to build such a dataset. This would allow for a statistical analysis of prediction errors, calibration of the W score threshold (currently 60), and further refinement of the interaction matrix values based on observed field performance.

4.4. Impact of Variations in Slope Angle on Rocks' Bouncing Behavior

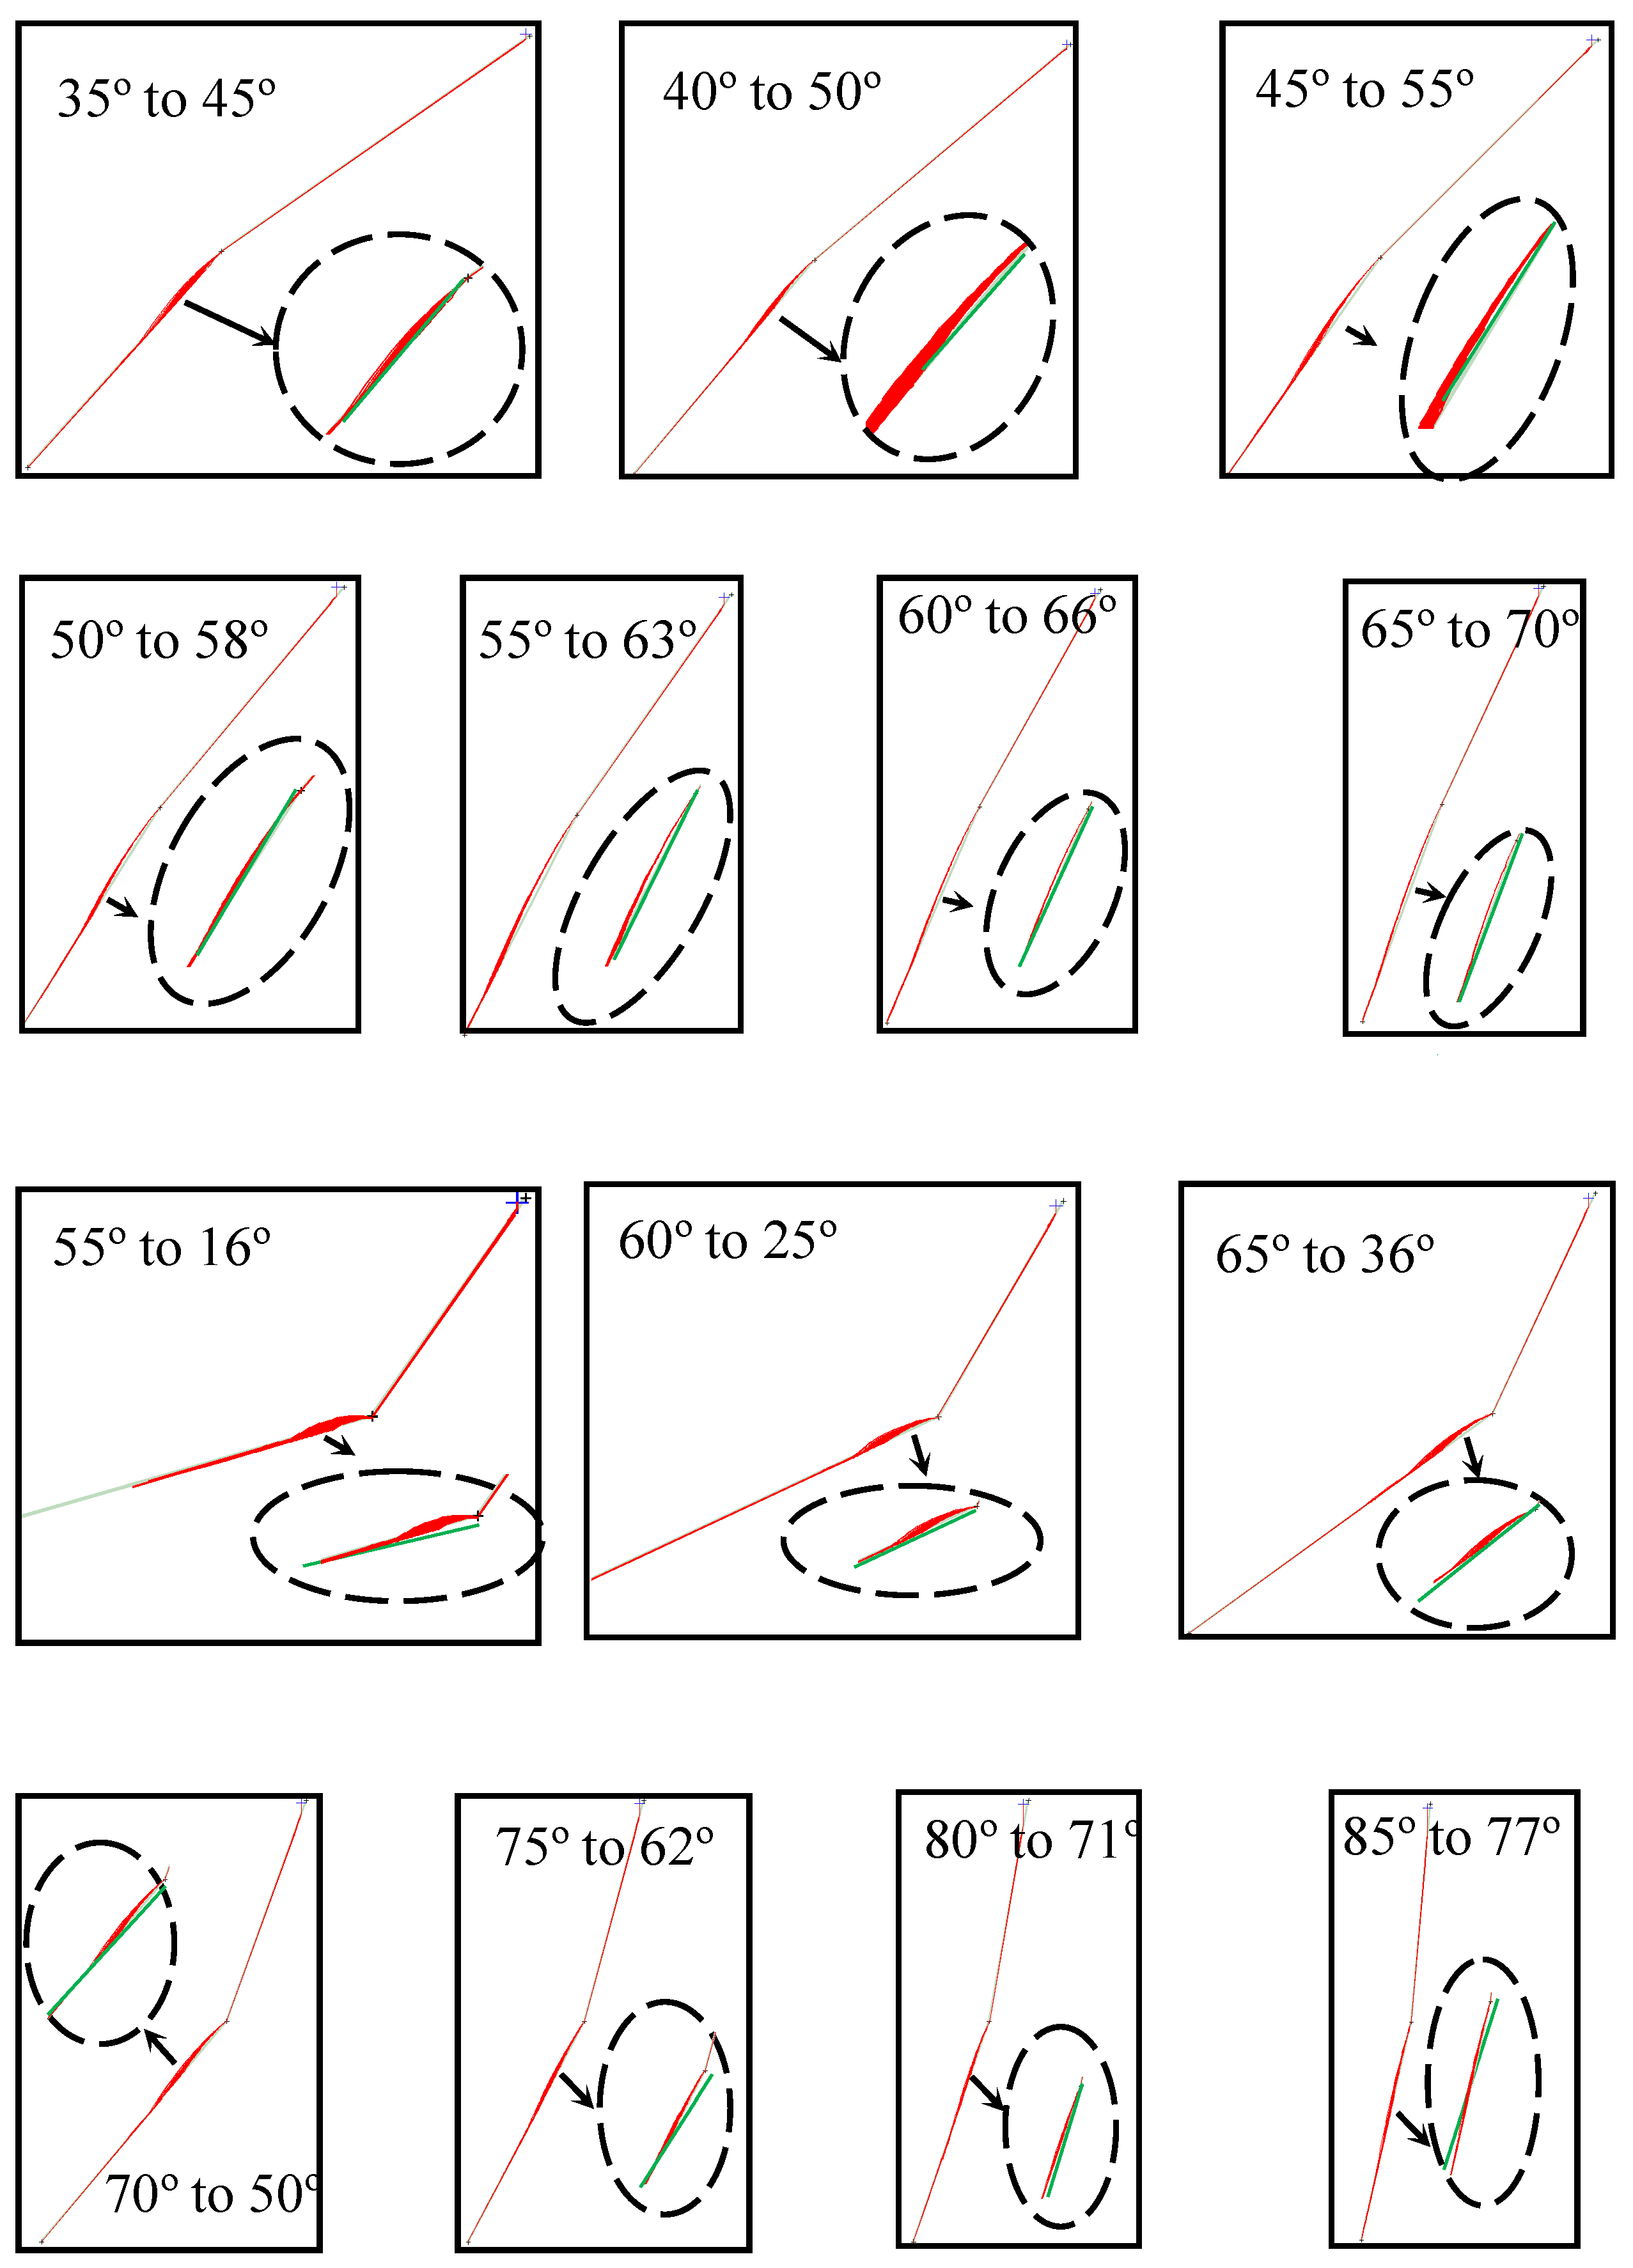
Variations in slope angle affect the bounce height of falling rocks. The motion of falling rocks changes at slope angle transitions due to collisions with the slope surface. Subsequent motion can be either flight or rolling. Slope transitions are categorized as steep-to-gentle or gentle-to-steep. The upper slope angle α was varied from 35° to 65° in 5° increments. The height of both the upper and lower slope sections was set at 5 m. The simulation results are shown in Figure 6. Table 7 summarizes the critical lower slope angles inducing bounce and the corresponding angle differences. The results show that as the gentle slope angle increases (in steep-to-gentle transitions), the minimum angle difference required to induce bouncing motion decreases, exhibiting an approximately linear relationship.

5. Discussion and Conclusions

This study addressed the lack of quantitative methods for assessing flexible barrier siting adaptability by proposing an innovative assessment method based on the interaction matrix. The method was validated through an engineering case study, demonstrating its effectiveness. The main conclusions are:
(1)
This study developed a novel sustainability-oriented assessment framework for flexible barrier siting. The ten key factors and their interactions, quantified through the interaction matrix, provide a holistic view that encompasses not only engineering performance but also implicit environmental and constructability (economic) concerns.
(2)
It was found that variations in slope angle significantly affect rockfall bounce height; specifically, as the gentle slope angle increases (in steep-to-gentle transitions), the minimum angle difference required to induce bouncing motion decreases.
(3)
Most significantly, the proposed method itself embodies a sustainable approach. Its simplicity and low computational requirements make it a rapid, low-energy, and accessible tool for engineers, particularly in the critical planning and feasibility stages. This promotes resource-efficient design by ensuring that barriers are correctly sited from the outset, thereby extending service life, reducing maintenance needs, and avoiding the substantial embodied carbon costs associated with failed or over-designed structures.

Funding

A project supported by the Scientific Research Fund of Zhejiang Provincial Education Department (Y202454601). This research was supported by the Joint Fund of Zhejiang Provincial Natural Science Foundation of China under Grant No. LGEY25E090019.

Institutional Review Board Statement

Not applicable.

Informed Consent Statement

Not applicable.

Data Availability Statement

The original contributions presented in this study are included in the article. Further inquiries can be directed to the corresponding author.

Conflicts of Interest

The authors declare no conflicts of interest.

References

  1. Ge, Z.; Liu, H. Effects of three-directional seismic wave on dynamic response and failure behavior of high-steep rock slide. Appl. Sci. 2022, 12, 20. [Google Scholar] [CrossRef]
  2. Margreth, S.; Roth, A. Interaction of flexible rockfall barriers with avalanches and snow pressure. Cold Reg. Sci. Technol. 2008, 51, 168–177. [Google Scholar] [CrossRef]
  3. Tian, Y.; Luo, L.; Yu, Z.; Xu, H.; Ni, F. Noncontact vision-based impact force reconstruction and spatial-temporal deflection tracking of a flexible barrier system under rockfall impact. Comput. Geotech. 2023, 153, 105070. [Google Scholar] [CrossRef]
  4. Xia, C.; Zhang, Z.; Liu, C.; Zhang, H.; Tian, S. Study on numerical model and dynamic response of ring net in flexible rockfall barriers. Sustainability 2022, 14, 4406. [Google Scholar] [CrossRef]
  5. Brighenti, R.; Segalini, A.; Ferrero, A.M. Debris flow hazard mitigation: A simplified analytical model for the design of flexible barriers. Comput. Geotech. 2013, 54, 1–15. [Google Scholar] [CrossRef]
  6. Peila, D.; Peilizza, S.; Sassudelli, F. Evaluation of behaviour of rockfall restraining nets by full scale tests. Rock Mech. Rock Eng. 1998, 31, 1–24. [Google Scholar] [CrossRef]
  7. Tan, D.; Yin, J.; Feng, W.; Qin, J.m.; Zhu, Z. New simple method for measuring impact force on a flexible barrier from rockfall and debris flow based on large-scale flume tests. Eng. Geol. 2020, 279, 105881. [Google Scholar] [CrossRef]
  8. Zhao, L.; He, J.; Yu, Z.; Liu, Y.; Zhou, Z.; Chan, S. Coupled numerical simulation of a flexible barrier impacted by debris flow with boulders in front. Landslides 2020, 17, 2723–2736. [Google Scholar] [CrossRef]
  9. Volkwien, A.; Wendeler, C.; Guasti, G. Design of Flexible Debris Flow Barriers. Ital. J. Eng. Geol. Environ. 2011, 1093–1100. [Google Scholar] [CrossRef]
  10. Liu, C.; Liang, L. A coupled SPH–DEM–FEM approach for modeling of debris flow impacts on flexible barriers. Arab. J. Geosci. 2022, 15, 10. [Google Scholar] [CrossRef]
  11. Li, X.; Zhao, J. A unified CFD-DEM approach for modeling of debris flow impacts on flexible barriers. Int. J. Num. Anal. Met. 2018, 42, 1643–1670. [Google Scholar] [CrossRef]
  12. Leonardi, A.; Wittel, K.; Mendoza, M.; Vetter, R.; Hermann, H. Particle–fluid–structure interaction for debris flow impact on flexible barriers. Comp.-Aided. Civ. Inf. 2016, 31, 323–333. [Google Scholar] [CrossRef]
  13. Geobrugg. Report on Testing SL–150 a Protection System Against Shallow Landslides; Test report No. 10–17; Geobrugg AG: Hong Kong, China, 2011. [Google Scholar]
  14. Cheung, A.; Yiu, J.; Lam, H.; Sze, E. Advanced numerical analysis of landslide debris mobility and barrier interaction. HKIE Trans. 2018, 25, 76–89. [Google Scholar] [CrossRef]
  15. Wu, H.; Wu, Y.; Ma, L. Design of passive flexible barrier against rockfall impact with 8 000 kJ energy level. Explos. Shock. Waves 2025, 45, 1–8. (In Chinese) [Google Scholar] [CrossRef]
  16. Pimpinella, F.; Marchelli, M.; De, V. A weight-based efficiency measure for energy dissipating devices for flexible rockfall barriers. Int. J. Prot. Struct. 2024, 151, 10. [Google Scholar] [CrossRef]
  17. Taboni, B.; Umili, G.; Malbertelli, L.; Tagliaferri, L. Surveying existing rockfall flexible barriers: A combined method for gathering data, managing information and prioritizing maintenance. J. Mt. Sci. 2024, 21, 4112–4130. [Google Scholar] [CrossRef]
  18. Zhao, L.; Zhang, L.; Yu, Z.; Qi, X.; Zhang, Y. A case study on the energy capacity of a flexible rockfall barrier in resisting landslide debris. Forests 2022, 13, 1384. [Google Scholar] [CrossRef]
  19. Castanon, L.; Blanco, E.; Castro, D.; Ballester, F. Energy Dissipating Devices in Falling Rock Protection Barriers. Rock Mech. Rock Eng. 2016, 50, 603–619. [Google Scholar] [CrossRef]
  20. Escallón, J.; Wendeler, C.; Chatzi, E.; Bartelt, P. Parameter identification of rockfall protection barrier components through an inverse formulation. Eng. Struct. 2014, 77, 1–16. [Google Scholar] [CrossRef]
  21. Xu, H.; Gentilini, C.; Yu, Z.; Qi, X.; Zhao, S. An energy allocation based design approach for flexible rockfall protection barriers. Eng. Struct. 2018, 173, 831–852. [Google Scholar] [CrossRef]
  22. Berger, S.; Hofmann, R.; Preh, A. Impacts on embankments, rigid and flexible barriers against rockslides: Model experiments vs. DEM simulations. Rock Mech. Rock Eng. 2024, 57, 2793–2808. [Google Scholar] [CrossRef]
  23. Sha, S.; Dyson, A.; Kefayati, G.; Tolooiya, A. An equivalent stiffness flexible barrier for protection against boulders transported by debris flow. Int. J. Civ. Eng. 2024, 22, 705–722. [Google Scholar] [CrossRef]
  24. Huo, M.; Zhou, J.; Zhao, J.; Zhou, H.; Li, J.; Liu, X. The normal impact stiffness of a debris-flow flexible barrier. Sci. Rep. 2023, 13, 3969. [Google Scholar] [CrossRef] [PubMed]
  25. Spadari, M.; Giacomini, A.; Buzzi, O.; Hambleton, J. Prediction of the Bullet Effect for Rockfall Barriers: A Scaling Approach. Rock Mech. Rock Eng. 2012, 45, 131–144. [Google Scholar] [CrossRef]
  26. Yu, Z.; Zhao, L.; Liu, Y.; Zhao, S.; Xu, H.; Chan, S. Studies on flexible rockfall barriers for failure modes, mechanisms and design strategies: A case study of Western China. Landslides 2019, 16, 347–362. [Google Scholar] [CrossRef]
  27. Albaba, A.; Lambert, S.; Kneib, F.; Chareyre, B.; Nicot, F. DEM modeling of a flexible barrier impacted by a dry granular flow. Rock Mech. Rock Eng. 2017, 50, 3029–3048. [Google Scholar] [CrossRef]
  28. Guo, L.; He, S.; Yu, Z.; Jin, Y. Damage assessment of ring nets in flexible barriers subjected to consecutive rockfall impacts. Can. Geotech. J. 2025, 62, 1–21. [Google Scholar] [CrossRef]
  29. He, Y.; Nie, L.; Lv, Y.; Wang, H.; Jiang, S.; Zhao, X. The study of rockfall trajectory and kinetic energy distribution based on numerical simulations. Nat. Hazards 2021, 106, 213–233. [Google Scholar] [CrossRef]
  30. Koo, R.; Kwan, J.; Lam, C.; Ng, C.; Yiu, J.; Choi, C.; Ng, A.; Ho, K.; Pun, W. Dynamic response of flexible rockfall barriers under different loading geometries. Landslides 2017, 14, 905–916. [Google Scholar] [CrossRef]
  31. Qi, X.; Zhao, L.; Meng, Q. Prediction method for the tension force of support ropes in flexible rockfall barriers based on full-scale experiments and numerical analysis. Sci. Rep. 2024, 141, 9969. [Google Scholar] [CrossRef]
  32. Yu, Z.; Luo, L.; Liu, C.; Guo, L.; Qi, X.; Zhao, L. Dynamic response of flexible rockfall barriers with different block shapes. Land-slides 2021, 18, 2621–2637. [Google Scholar] [CrossRef]
  33. Xiong, H.; Hao, M.; Zhao, D.; Gan, X.; Yin, Z.; Chen, X. A fully resolved SPH-DEM for simulation of debris flows with arbitrary particle shapes impacting flexible barriers. Acta Geotech. 2025, 203, 1403–1430. [Google Scholar] [CrossRef]
  34. Paronuzzi, P. Rockfall-induced block propagation on a soil slope, northern Italy. Environ. Geol. 2009, 58, 1451–1466. [Google Scholar] [CrossRef]
  35. Gili, J.; Ruiz, R.; Matas, G.; Moya, J.; Prades, A.; Corominas, J.; Lantada, N.; Núñez-Andrés, M.A.; Buill, F.; Puig, C.; et al. Rockfalls: Analysis of the block fragmentation through field experiments. Landslides 2022, 193, 1009–1029. [Google Scholar] [CrossRef]
  36. Xu, H.; Cheng, Y.; Zhao, L.; Liu, Y.; Yu, Z. Experimental study on bearing capacity reduction of the steel wire-rings in flexible barriers due to corrosion. Constr. Build. Mater. 2024, 439, 137341. [Google Scholar] [CrossRef]
  37. Saroglou, H.; Berger, F.; Bourrier, F.; Asteriou, P.; Tsiambao, G.; Tsagkas, D. Effect of forest presence on rockfall trajectory, an example from Greece. In Engineering Geology for Society and Territory-Volume 2; Springer International Publishing: Cham, Switzerland, 2015; pp. 1451–1466. [Google Scholar]
  38. Boulaud, R.; Douthe, C. A comparative assessment of ASM4 rockfall barrier modelling. Eng. Struct. 2022, 251 Pt B, 113512. [Google Scholar] [CrossRef]
  39. Hambleton, J.; Buzzi, O.; Giacomini, A.; Spadari, M.; Sloan, S. Perforation of flexible rockfall barriers by normal block impact. Rock Mech. Rock Eng. 2013, 46, 515–526. [Google Scholar] [CrossRef]
  40. Liu, C.; Yu, Z.; Zhao, S. Quantifying the impact of a debris avalanche against a flexible barrier by coupled DEM-FEM analyses. Landslides 2020, 17, 33–47. [Google Scholar] [CrossRef]
  41. Zhao, L.; Yu, Z.; Liu, Y.; He, J.; Chan, S.; Zhao, S. Numerical simulation of responses of flexible rockfall barriers under impact loading at different positions. J. Constr. Steel Res. 2020, 167, 105953. [Google Scholar] [CrossRef]
  42. Kong, Y.; Li, X.; Zhao, J. Quantifying the transition of impact mechanisms of geophysical flows against flexible barrier. Eng. Geol. 2021, 289, 106188. [Google Scholar] [CrossRef]
  43. Lambert, S.; Toe, D.; Mentani, A.; Bourrier, F. A Meta-Model-Based Procedure for Quantifying the On-Site Efficiency of Rockfall Barriers. Rock Mech. Rock Eng. 2021, 54, 487–500. [Google Scholar] [CrossRef]
  44. Zhang, Y.; Ci, H.; Yang, H.; Wang, R.; Yan, Z. Rainfall-Induced Geological Hazard Susceptibility Assessment in the Henan Section of the Yellow River Basin: Multi-Model Approaches Supporting Disaster Mitigation and Sustainable Development. Sustainability 2025, 17, 4348. [Google Scholar] [CrossRef]
  45. Tsou, C.-Y.; Yamagishi, H.; Kawakami, R.; Tsai, M.-F.; Miwa, T. Investigating the Relationship between Plant Species Composi-tion and Topography in the Tomeyama Landslide: Implications for Environmental Education and Sustainable Management in the Happo-Shirakami Geopark, Japan. Sustainability 2023, 15, 16572. [Google Scholar] [CrossRef]
  46. Zheng, X.; Zhao, Q.; Peng, S.; Wu, L.; Dou, Y.; Chen, K. Analysis of Failure Mechanism of Medium-Steep Bedding Rock Slopes under Seismic Action. Sustainability 2024, 16, 7729. [Google Scholar] [CrossRef]
  47. Kikuchi, T.; Nishiyama, S.; Hatano, T. Unveiling Deep-Seated Gravitational Slope Deformations via Aerial Photo Interpretation and Statistical Analysis in an Accretionary Complex in Japan. Sustainability 2024, 16, 5328. [Google Scholar] [CrossRef]
  48. Sotiriadis, D.; Klimis, N.; Dokas, I.M. Updated Predictive Models for Permanent Seismic Displacement of Slopes for Greece and Their Effect on Probabilistic Landslide Hazard Assessment. Sustainability 2024, 16, 2240. [Google Scholar] [CrossRef]
  49. Kumar, P.; Kumara, A.; Reddy, U. Making quality agglomerates using lean iron ores for sustainable iron-making. J. Saf. Sustain. 2024, 1, 257–263. [Google Scholar] [CrossRef]
  50. Shen, Z.; Liu, Y.; Xu, J.; Zhou, Y.; Yang, L.; Fang, Y.; Yuan, B. Self-powered smart fire-alarm materials: Advances and perspective. J. Saf. Sustain. 2025, 2, 81–94. [Google Scholar] [CrossRef]
  51. EOTA. Falling Rock Protection Kits. 2018. Available online: https://www.eota.eu/download?file=/2014/14-34-0059/ead%20for%20ojeu/ead%20340059-00-0106_ojeu2018.pdf (accessed on 27 August 2025).
  52. Volkwein, A.; Gerber, W.; Klette, J.; Spescha, G. Review of approval of flexible rockfall protection systems according to ETAG 027. Geosciences 2019, 9, 49. [Google Scholar] [CrossRef]
  53. Hudson, J. Rock mechanics principles in engineering practice. Int. J. Rock Mech. Min. Sci. Geomech. Abstr. 1989, 26, 289. [Google Scholar] [CrossRef]
  54. Hudson, J.; Arnold, P.; Tamai, A. Rock Engineering Mechanisms Information Technology (REMIT): Part 1—The basic method: Part II—Illustrative case examples: Hudson, J A; Arnold, P N; Tamai, A Proc 7th ISRM International Congress on Rock Mechanics, Aachen, 16–20 September 1991V2, P1113–1119. Publ Rotterdam: A A Balkema, 1991. Int. J. Rock Mech. Min. Sci. Geomech. Abstr. 1993, 30, 302. [Google Scholar] [CrossRef]
  55. Hudson, J.; Harrisin, J. A new approach to studying complete rock engineering problems. Q. J. Eng. Geol. 1992, 25, 93–105. [Google Scholar] [CrossRef]
  56. Rocscience Inc. ROCFALL-Computer Program for Risk Analysis of Falling Rocks on Steep Slopes, Version 4.0; Rocscience Inc.: Toronto, ON, Canada, 2022. [Google Scholar]
  57. Huang, C.; Hu, Q.; Cai, Q.; Li, M. Post-earthquake spatiotemporal evolution characteristics of typical landslide sources in the Jiuzhaigou meizoseismal area. Bull. Eng. Geol. Environ. 2024, 83, 1–19. [Google Scholar] [CrossRef]
  58. Yang, Z.; Du, G.; Zhang, Y.; Xu, C.; Yu, P.; Shao, W.; Mai, X. Seismic landslide hazard assessment using improved seismic motion parameters of the 2017 Ms 7.0 Jiuzhaigou earthquake, Tibetan Plateau. Front. Earth Sci. 2024, 12, 1–16. [Google Scholar] [CrossRef]
  59. Ling, S.; Sun, C.; Li, X.; Ren, Y.; Xu, J.; Huang, T. Correction to: Characterizing the distribution pattern and geologic and geo-morphic controls on earthquake-triggered landslide occurrence during the 2017 Ms 7.0 Jiuzhaigou earthquake, Sichuan, China. Landslides 2021, 18, 1293. [Google Scholar] [CrossRef]
  60. Stevens, W. Rockfall: A Tool for Probabilistic Analysis, Design of Remedial Measures and Prediction of Rockfalls. Master’s Thesis, Department of Civil Engineering, University of Toronto, Toronto, ON, Canada, 1998. [Google Scholar]
  61. Wang, X.; Zhang, L.; Wang, S.; Agliardi, F.; Frattini, P.; Crosta, G.B.; Yang, Z. Field investigation and rockfall hazard zonation at the Shijing Mountains Sutra caves cultural heritage (China). Environ. Earth Sci. 2012, 66, 1897–1908. [Google Scholar] [CrossRef]
Figure 1. The applications of the flexible barriers: (a) landslide [13,14]; (b) rockslide [6]; (c) debris flow [8,9]; (d) snow avalanche [2].
Sustainability 17 08675 g001
Figure 2. Flowchart of establishing the method of the siting adaptability of the flexible barriers assessment.
Sustainability 17 08675 g002
Figure 3. The principle of the interaction matrix, (a) schematic diagram of the Interaction relationship, (b) multi-factor interaction matrix, (c) multi-factor relationship matrix parameter points distribution map, (d) visualization of the parameter interaction and controllability for a single factor Fi. The resultant vector F (C, E) represents its total influence within the system, decomposed into the interaction intensity component PH (along the line C = E) and the controllability component PD (perpendicular to C = E).
Sustainability 17 08675 g003
Figure 4. Distribution of perilous rock masses at Huohua village. Bottom: geological profile. Top: rockfall trajectories simulated using Rocfall V.4.0 (red lines), kinetic energy during motion (red curve), and bounce height (blue curve). Labels (e.g., 8#, 9#, 10#) denote the identification numbers of key monitored perilous rock masses.
Sustainability 17 08675 g004
Figure 6. Rockfall bouncing behavior induced by changes in slope angle (Red lines are rockfall trajectories and green lines are slopes.).
Sustainability 17 08675 g006
Figure 5. Field evidence of successful flexible barrier performance at Huohua village, validating the assessment results. (a) The flexible barrier intercepting a rockfall. (b) The flexible barrier intercepting fallen trees. The site has an assessed adaptability index W > 60 (See Table 5, Site 3#). The barrier with a design capacity of 2000 kJ and height of 5 m successfully intercepted rocks (size 1.4 × 0.96 × 0.78 m, volume: 1.05 m3, mass: 2730 kg, fall height: 220 m), confirming the accuracy of the siting adaptability assessment.
Sustainability 17 08675 g005
Table 1. Design suggestions for the flexible barrier in ETAG.
Protection LevelHeight RequirementSetback Distance
γ E E d E r
Ed: design energy level; Er: protection energy level; γ E : safety factor.
h i h p + f
hi: design intercept height; hp: rockfall height (95% reliability) from analyzing the rockfall trajectory; f: 0.5 times average rockfall size.
d p γ E d a
da: maximum flexible barrier elongation; dp: distance to protected area; γ E : safety factor.
Table 2. Qualitative description of the main factors influencing the protective effectiveness of flexible barriers.
ElementIDDescriptions
Kinetic energy of falling rocksP1When kinetic energy exceeds 10,000 kJ, flexible barriers are not suitable for use.
Rockfall sizeP2Oversized rockfalls with excessive kinetic energy cannot be effectively intercepted.
Dispersion of perilous rock massesP3Passive flexible barriers are preferred when rockfalls are numerous and dispersed.
Rockfall event frequencyP4Evaluate the expected number of rockfall events per unit time
Slope roughnessP5Smooth rock faces and loose deposits affect frictional energy dissipation.
Slope heightP6Increased slope height results in greater kinetic energy, potentially exceeding barrier capacity.
Slope gradient variation (rockfall bounce height)P7Flexible barriers are unsuitable if rockfall bounce heights are excessive.
Vegetation coverageP8Vegetation dissipates kinetic energy. Tall trees can intercept falling rocks.
Hydrological conditionsP9Acidic groundwater corrodes anchor bolts; surface runoff can undermine slope toe stability.
Seismic activityP10Flexible protection measures are preferred in high-seismic zones due to their ability to undergo large deformations and dissipate energy through ductile behavior, unlike rigid structures that are prone to brittle failure under seismic inertial forces. Their integrated connections allow for better coordination during ground motions, maintaining system integrity.
Construction conditionsP11Flexible barriers are suitable for difficult-to-access sites (accessibility—transport/installation difficulty, and maintenance conditions—ease of inspection/component replacement).
Environmental and social sustainabilityP12Evaluate the environmental and social impacts of flexible barriers throughout their entire life cycle, encompassing aspects such as material recyclability, ecological disturbance caused by construction, visual landscape impact, and long-term maintenance requirements.
Table 3. Interaction matrix values determined by Expert semi-quantitative method.
IijIi1Ii2Ii3Ii4Ii5Ii6Ii7Ii8Ii9Ii10Ii,11Ii,12CiCi + EjCi − Ejki(%)PHPD
I1jP1---3-----22723−910.27 16.27 −6.36
I2j4P22--------1715−16.70 10.61 −0.71
I3j22P32------12922−49.82 15.56 −2.83
I4j---P4---1--32617−57.59 12.02 −3.54
I5j3221P5-13--1-132159.38 14.85 3.54
I6j4-311P621--1-1314126.25 9.90 8.49
I7j311-1-P72----81426.25 9.90 1.41
I8j-22-2-3P81-2-1224010.71 16.97 0.00
I9j---3---1P9-1271225.36 8.49 1.41
I10j-13411---P10421616167.14 11.32 11.32
I11,j-------11-P112423−1510.27 16.27 −10.61
I12,j-------33-4P121023−310.27 16.27 −2.12
Ej168131181612501913
Table 4. Evaluation criteria for flexible barrier siting adaptability indicators.
FactorP1P2P3P4P5P6
Level
Ⅰ (Suitable)<2000 kJ *<4 m3 *concentrated 1 event/yearrock<30 m *
Ⅱ (Unsuitable)≥2000 kJ *≥4 m3 *dispersed > 1 event/year soil≥30 m *
FactorP7P8P9P10P11P12
Level
Ⅰ (Suitable) < 8 mtreeacidicseismic activitydifficultrecyclable
Ⅱ (Unsuitable) 8 mnone/shrubneutralno seismic activitysimplenon-recyclable
* Note: A fundamental prerequisite for the successful deployment of a flexible barrier is that the kinetic energy of the design rockfall must be less than the barrier’s designated protection energy capacity. The values provided in Table 4—such as the 2000 kJ energy level and the corresponding 4 m3 rock volume—are illustrative examples based on a specific vertical-impact test scenario (assuming a rock density of 2400 kg/m3 and a fall height of 30 m). These thresholds are not universal constants. In practice, the limiting values for kinetic energy (P1) and rockfall size (P2) must be determined based on the design energy capacity (Er) of the barrier selected for the specific site. The maximum kinetic energy is estimated using the equation E = mgh, where the free-fall model represents the most conservative scenario. Two practical approaches are recommended: For identified perilous rock masses of volume V, calculate the maximum allowable fall height h such that EEr; For a slope of defined height h, determine the maximum allowable rock volume V that satisfies EEr. Once Er is established, the Level I/II threshold for P1 is defined as E < Er/EEr, respectively. This procedure aligns with standard industry practice and ensures that site-specific conditions are incorporated into the adaptability assessment.
Table 5. Siting adaptability assessment results for Huohua village.
Site IDP1P2P3P4P5P6P7P8P9P10P11P12W
100101101111169.2
201001111111172.33
300101111111175.45
410100111111176.34
511100111111183.04
611100001111170.54
710000001111154.02
810000001111154.02
910000011111160.27
1011000111111173.22
Table 7. Influence of slope transition on rockfall bounce occurrence.
upper slope angle α 1 (°)35404550556065
lower slope angle α 2 (°)48505558636670
angle difference α (°)1310108765
upper slope angle α 1 (°)55606570758085
lower slope angle α 2 (°)16253650627177
angle difference α (°)393529201398
Table 6. Rockfall simulation results.
Site ID 12345678910
Case
maximum kinetic energy (kJ)17414875701456894901792156172157
maximum bounce height (m)3.561.782.310.630.707.317.736.011.041.08
Disclaimer/Publisher’s Note: The statements, opinions and data contained in all publications are solely those of the individual author(s) and contributor(s) and not of MDPI and/or the editor(s). MDPI and/or the editor(s) disclaim responsibility for any injury to people or property resulting from any ideas, methods, instructions or products referred to in the content.